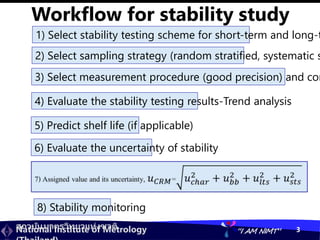
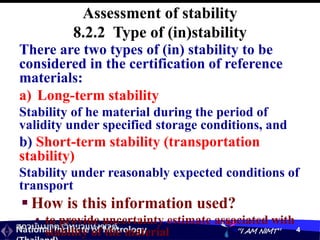
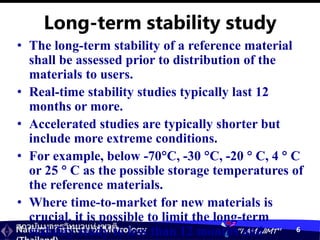
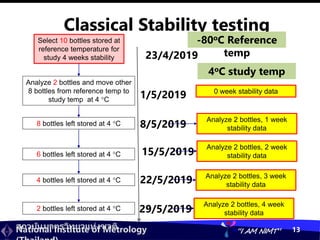
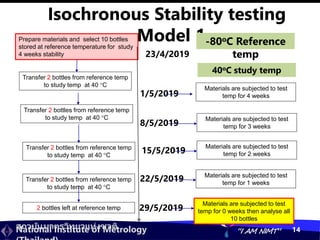
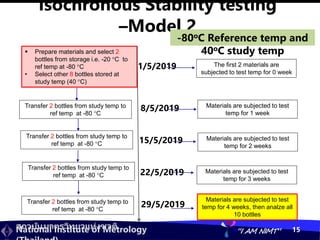
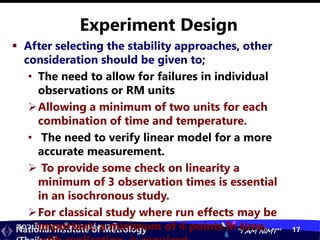
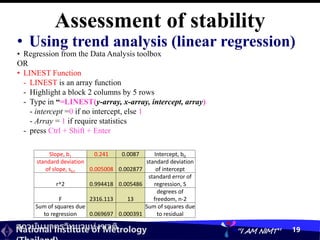
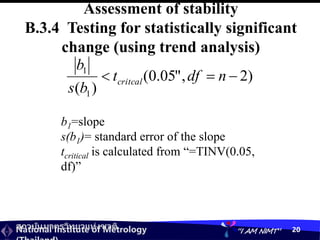
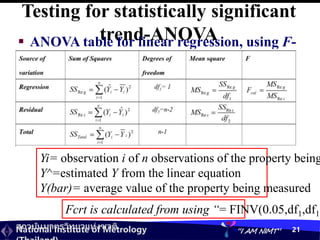
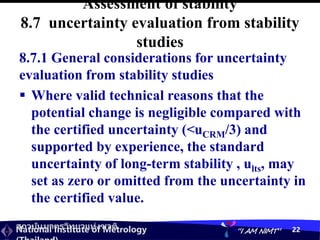
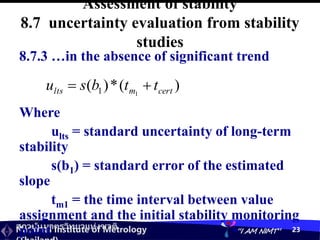
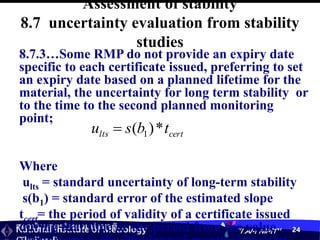
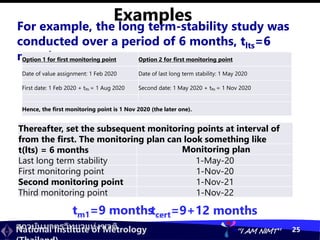
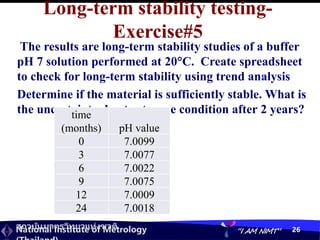
National Institute of Metrology
(Thailand)
สถาบันมาตรวิทยาแห่งชาติ
“I AM NIMT”
Paul Armishaw and Kittiya
Shearman
Statistics for reference
materials production_ISO
Guide 35: 2017
สถาบันมาตรวิทยาแห่งชาติ
National Institute of Metrology “I AM NIMT” 2
Stability Study
สถาบันมาตรวิทยาแห่งชาติ
National Institute of Metrology “I AM NIMT” 3
Workflow for stability study
1) Select stability testing scheme for short-term and long-t
2) Select sampling strategy (random stratified, systematic s
3) Select measurement procedure (good precision) and con
4) Evaluate the stability testing results-Trend analysis
6) Evaluate the uncertainty of stability
5) Predict shelf life (if applicable)
8) Stability monitoring
สถาบันมาตรวิทยาแห่งชาติ
National Institute of Metrology “I AM NIMT” 4
Assessment of stability
8.2.2 Type of (in)stability
There are two types of (in) stability to be
considered in the certification of reference
materials:
a) Long-term stability
Stability of he material during the period of
validity under specified storage conditions, and
b) Short-term stability (transportation
stability)
Stability under reasonably expected conditions of
transport
 How is this information used?
• to provide uncertainty estimate associated with
stability of the material
สถาบันมาตรวิทยาแห่งชาติ
National Institute of Metrology “I AM NIMT” 5
Short-term stability studies
• The producer shall, prior to distribution
of the material to users, assess the
stability of the reference material under
expected conditions of transport.
• For this, the behavior of the material and
it’s property values are studies under the
intended for packaging and transport.
• The conditions should include
temperatures that might occur during
transport, for e.g. between- 50 C to 70C
• The duration should reflect the duration
สถาบันมาตรวิทยาแห่งชาติ
National Institute of Metrology “I AM NIMT” 6
Long-term stability study
• The long-term stability of a reference material
shall be assessed prior to distribution of the
materials to users.
• Real-time stability studies typically last 12
months or more.
• Accelerated studies are typically shorter but
include more extreme conditions.
• For example, below -70C, -30 C, -20  C, 4  C
or 25  C as the possible storage temperatures of
the reference materials.
• Where time-to-market for new materials is
crucial, it is possible to limit the long-term
stability study to less than 12 months and
สถาบันมาตรวิทยาแห่งชาติ
National Institute of Metrology “I AM NIMT” 7
Assessment of stability
8.3.2 Classification according to
conditions of measurement
• Classical stability studies-intermediate
condition of measurement (within-
laboratory reproducibility condition)
• Isochronous stability studies-
Repeatability condition of measurement
สถาบันมาตรวิทยาแห่งชาติ
National Institute of Metrology “I AM NIMT” 8
Stability experiment design
 Classical approach
• Individual samples prepared as a batch
under identical conditions and
measured as time elapses –different
batch and calibration-intermediate
condition of measurement (within-
laboratory reproducibility condition)
• High uncertainty due to instability of
measurement system
• Required for on-going stability
monitoring for extension of certificates
• Due to the run effects may be
important, a minimum of 4 points in
สถาบันมาตรวิทยาแห่งชาติ
National Institute of Metrology “I AM NIMT” 9
Stability experiment design
 Isochronous approach
• All measurement of stability carried
out at the same time under
repeatable conditions – a single
batch and calibration
• Reduce variability of results over
time lead to smaller uncertainty
• Usually employed for the first 6
months stability testing
• Minimum of 2 RM units for each
time point
สถาบันมาตรวิทยาแห่งชาติ
National Institute of Metrology “I AM NIMT” 10
Isochronous Stability testing
Long-term stability
at -20oC
Accelerated stability
1, 3, 5, 7 and 14 days at
40oC
+40oC -20oC
-80oC
Reference
Samples removed
from oven after 1,
3, 5, 7 and 14 days
Samples removed
from freezer after
1, 2, 3, 4, 5 and 6
months
Samples and reference
sample analysed in a
single batch using same
calibration standard
Stored at -80oC until
analysis
Stored at -80oC until
analysis
สถาบันมาตรวิทยาแห่งชาติ
National Institute of Metrology “I AM NIMT” 11
Isochronous Stability testing
Long-term stability
at -20oC
Accelerated stability
1, 3, 5, 7 and 14 days at
40oC
+40oC -20oC
-80oC
Reference
Samples removed
from oven after 1,
3, 5, 7 and 14 days
Samples removed
from freezer after
1, 2, 3, 4, 5 and 6
months
Samples and reference
sample analysed in a
single batch using same
calibration standard
Stored at -80oC until
analysis
Stored at -80oC until
analysis
Reference samples
is required for the
on going long-term
stability testing
สถาบันมาตรวิทยาแห่งชาติ
National Institute of Metrology “I AM NIMT” 12
Stability testing schedule
A minimum of 2 to 3 units are tested at
each time point to obtain an average
measurement value
No. of bottles
Days Date started Date due -80oC +40oC -20oC
0 1/04/2015 1/04/2015 2 2
1 1/04/2015 2/04/2015 2
3 1/04/2015 4/04/2015 2
5 1/04/2015 6/04/2015 2
7 1/04/2015 8/04/2015 2
14 1/04/2015 15/04/201 2
Months
0 1/04/2015 1/04/2015 2 2
1 1/04/2015 1/05/2015 2
2 1/04/2015 1/06/2015 2
4 1/04/2015 1/08/2015 2
6 1/04/2015 1/10/2015 2
Total no. of bottles 4 12 10
สถาบันมาตรวิทยาแห่งชาติ
National Institute of Metrology “I AM NIMT” 13
Classical Stability testing
0 week stability data
Select 10 bottles stored at
reference temperature for
study 4 weeks stability
-80oC Reference
temp
Analyze 2 bottles, 1 week
stability data
Analyze 2 bottles, 2 week
stability data
Analyze 2 bottles, 3 week
stability data
Analyze 2 bottles, 4 week
stability data
1/5/2019
8/5/2019
15/5/2019
22/5/2019
29/5/2019
23/4/2019
Analyze 2 bottles and move other
8 bottles from reference temp to
study temp at 4 C
8 bottles left stored at 4 C
6 bottles left stored at 4 C
4 bottles left stored at 4 C
2 bottles left stored at 4 C
4oC study temp
สถาบันมาตรวิทยาแห่งชาติ
National Institute of Metrology “I AM NIMT” 14
Isochronous Stability testing
–Model 1
Materials are subjected to test
temp for 4 weeks
Prepare materials and select 10 bottles
stored at reference temperature for study
4 weeks stability
-80oC Reference
temp
Materials are subjected to test
temp for 3 weeks
Materials are subjected to test
temp for 2 weeks
Materials are subjected to test
temp for 1 weeks
Materials are subjected to test
temp for 0 weeks then analyse all
10 bottles
1/5/2019
8/5/2019
15/5/2019
22/5/2019
29/5/2019
23/4/2019
Transfer 2 bottles from reference temp
to study temp at 40 C
Transfer 2 bottles from reference temp
to study temp at 40 C
Transfer 2 bottles from reference temp
to study temp at 40 C
Transfer 2 bottles from reference temp
to study temp at 40 C
2 bottles left at reference temp
40oC study temp
สถาบันมาตรวิทยาแห่งชาติ
National Institute of Metrology “I AM NIMT” 15
Isochronous Stability testing
–Model 2
Materials are subjected to test
temp for 1 week
 Prepare materials and select 2
bottles from storage i.e. -20 C to
ref temp at -80 C
• Select other 8 bottles stored at
study temp (40 C)
-80oC Reference temp and
40oC study temp
Materials are subjected to test
temp for 2 weeks
Materials are subjected to test
temp for 3 weeks
Materials are subjected to test
temp for 4 weeks, then analze all
10 bottles
1/5/2019
8/5/2019
15/5/2019
22/5/2019
29/5/2019
Transfer 2 bottles from study temp to
ref temp at -80 C
Transfer 2 bottles from study temp to
ref temp at -80 C
Transfer 2 bottles from study temp to
ref temp at -80 C
Transfer 2 bottles from study temp to
ref temp at -80 C
The first 2 materials are
subjected to test temp for 0 week
สถาบันมาตรวิทยาแห่งชาติ
National Institute of Metrology “I AM NIMT” 16
Experiment Design
 After selecting the stability
approaches, other consideration
should be given to;
• Selection of units
Select sampling strategy (random
stratified and systematic samplings) used
in homogeneity may be applied.
• Selection of suitable measurement
procedure
The precision of the measurement
procedure ( very precise methods
required low levels of replication, good
สถาบันมาตรวิทยาแห่งชาติ
National Institute of Metrology “I AM NIMT” 17
Experiment Design
 After selecting the stability approaches, other
consideration should be given to;
• The need to allow for failures in individual
observations or RM units
Allowing a minimum of two units for each
combination of time and temperature.
• The need to verify linear model for a more
accurate measurement.
 To provide some check on linearity a
minimum of 3 observation times is essential
in an isochronous study.
For classical study where run effects may be
important, a minimum of 4 points in time,
สถาบันมาตรวิทยาแห่งชาติ
National Institute of Metrology “I AM NIMT” 18
Assessment of
stability
• Using trend analysis (linear
regression)
• Assumption , the slope of the
regression should be 0, if the
material is stable.
• Using t-test to check if the slope is
significantly different from 0.
สถาบันมาตรวิทยาแห่งชาติ
National Institute of Metrology “I AM NIMT” 19
Assessment of stability
• Using trend analysis (linear regression)
Slope, b1 0.241 0.0087 Intercept, b0
standard deviation
of slope, sb1 0.005008 0.002877
standard deviation
of intercept
r^2 0.994418 0.005486
standard error of
regression, S
F 2316.113 13
degrees of
freedom, n-2
Sum of squares due
to regression 0.069697 0.000391
Sum of squares due
to residual
• Regression from the Data Analysis toolbox
OR
• LINEST Function
- LINEST is an array function
- Highlight a block 2 columns by 5 rows
- Type in “=LINEST(y-array, x-array, intercept, array)
- intercept =0 if no intercept, else 1
- Array = 1 if require statistics
- press Ctrl + Shift + Enter
สถาบันมาตรวิทยาแห่งชาติ
National Institute of Metrology “I AM NIMT” 20
Assessment of stability
B.3.4 Testing for statistically significant
change (using trend analysis)
)
2
,
"
05
.
0
(
)
( 1
1


 n
df
t
b
s
b
critcal
b1=slope
s(b1)= standard error of the slope
tcritical is calculated from “=TINV(0.05,
df)”
สถาบันมาตรวิทยาแห่งชาติ
National Institute of Metrology “I AM NIMT” 21
Testing for statistically significant
trend-ANOVA
 ANOVA table for linear regression, using F-
test to significant
Fcrt is calculated from using “= FINV(0.05,df1,df1)
Yi= observation i of n observations of the property being
Y^=estimated Y from the linear equation
Y(bar)= average value of the property being measured
สถาบันมาตรวิทยาแห่งชาติ
National Institute of Metrology “I AM NIMT” 22
Assessment of stability
8.7 uncertainty evaluation from stability
studies
8.7.1 General considerations for uncertainty
evaluation from stability studies
 Where valid technical reasons that the
potential change is negligible compared with
the certified uncertainty (<uCRM/3) and
supported by experience, the standard
uncertainty of long-term stability , ults, may
set as zero or omitted from the uncertainty in
the certified value.
สถาบันมาตรวิทยาแห่งชาติ
National Institute of Metrology “I AM NIMT” 23
Assessment of stability
8.7 uncertainty evaluation from stability
studies
8.7.3 …in the absence of significant trend
Where
ults = standard uncertainty of long-term
stability
s(b1) = standard error of the estimated
slope
tm1 = the time interval between value
assignment and the initial stability monitoring
point
)
(
*
)
( 1
1 cert
m
lts t
t
b
s
u 

สถาบันมาตรวิทยาแห่งชาติ
National Institute of Metrology “I AM NIMT” 24
Assessment of stability
8.7 uncertainty evaluation from stability
studies
8.7.3…Some RMP do not provide an expiry date
specific to each certificate issued, preferring to set
an expiry date based on a planned lifetime for the
material, the uncertainty for long term stability or
to the time to the second planned monitoring
point;
Where
ults = standard uncertainty of long-term stability
s(b1) = standard error of the estimated slope
tcert= the period of validity of a certificate issued
during that time or the period from the value
nd
cert
lts t
b
s
u *
)
( 1

สถาบันมาตรวิทยาแห่งชาติ
National Institute of Metrology “I AM NIMT” 25
Examples
For example, the long term-stability study was
conducted over a period of 6 months, tlts=6
months
Option 1 for first monitoring point Option 2 for first monitoring point
Date of value assignment: 1 Feb 2020 Date of last long term stability: 1 May 2020
First date: 1 Feb 2020 + tlts = 1 Aug 2020 Second date: 1 May 2020 + tlts = 1 Nov 2020
Hence, the first monitoring point is 1 Nov 2020 (the later one).
Thereafter, set the subsequent monitoring points at interval of
from the first. The monitoring plan can look something like
t(lts) = 6 months Monitoring plan
Last long term stability 1-May-20
First monitoring point 1-Nov-20
Second monitoring point 1-Nov-21
Third monitoring point 1-Nov-22
tm1=9 months
tcert=9+12 months
สถาบันมาตรวิทยาแห่งชาติ
National Institute of Metrology “I AM NIMT” 26
Long-term stability testing-
Exercise#5
The results are long-term stability studies of a buffer
pH 7 solution performed at 20C. Create spreadsheet
to check for long-term stability using trend analysis
Determine if the material is sufficiently stable. What is
the uncertainty due to storage condition after 2 years?
time
(months) pH value
0 7.0099
3 7.0077
6 7.0022
9 7.0075
12 7.0009
24 7.0018
สถาบันมาตรวิทยาแห่งชาติ
National Institute of Metrology “I AM NIMT” 27
Long-term stability testing-
Exercise#6
The results are Long-term stability of RM of KCl 0.1
M
Determine if the material is sufficiently stable.
x-axis y-axis
Date
(DD/MM/YYYY)
Months passed
Average Electrolytic
conductivity, EC
(mS/cm)
1/1/2019 0 12.880
1/4/2019 3 12.879
1/9/2019 8 12.891
1/10/2019 9 12.890
1/12/2019 12 12.894
สถาบันมาตรวิทยาแห่งชาติ
National Institute of Metrology “I AM NIMT” 28
Assessment of stability
8.6 Action on finding of a significant
trend
a) The property value for which the degradation
was observed is not certified;
b) The period of validity of the certified value is
decreased, based on the model prediction…
c) The expected extent of degradation over the
intended period of validity is estimated ,
converted into a standard uncertainty and
included, together with the uncertainty of the
expected degradation, in the uncertainty of the
assigned value;
d) The certified value and its uncertainty are given
as a function of time….
สถาบันมาตรวิทยาแห่งชาติ
National Institute of Metrology “I AM NIMT” 29
Monitoring stability
Study
สถาบันมาตรวิทยาแห่งชาติ
National Institute of Metrology “I AM NIMT” 30
Requirements for monitoring
 Monitoring should be planned during the
lifetime of the CRM.
 The behavior of a given RM or CRM over its
lifetime is difficult to predict reliably from
typical stability studies.
 Because the behavior is hard to predict, it is
usually necessary to monitor the stability of
the material.
 Monitoring usually takes place using the
classical design because the isochronous
สถาบันมาตรวิทยาแห่งชาติ
National Institute of Metrology “I AM NIMT” 31
Monitoring plan where prior
information is not available
 There are two basic strategies for choosing
initial monitoring points;
a) Predict possible change and set the initial
monitoring point
b) Use a simple multiple of the stability study
duration
 It should be noted that stability monitoring
does not affect the uncertainty statement of
the reference material on the certificate, uCRM.
สถาบันมาตรวิทยาแห่งชาติ
National Institute of Metrology “I AM NIMT” 32
stability monitoring plan
a) Use of a predicted change to set the initial
monitoring point
The first intersect point
The earliest point at which the CI intersects the specified t
The first monitoring p
สถาบันมาตรวิทยาแห่งชาติ
National Institute of Metrology “I AM NIMT” 33
b) Use of a simple multiple of the
stability study duration
 This strategy is simple but can be shorter
intervals than strategy a)
 It is based on multiples of long-term stability
study duration, t(lts).
 Example:
• Set the first monitoring point at the later of
the value assignment date plus t(lts) and the
date of the end of the long-term stability
study plus t(lts).
• Set two subsequent monitoring points at
สถาบันมาตรวิทยาแห่งชาติ
National Institute of Metrology “I AM NIMT” 34
Examples of stability monitoring
plan
b) Use a simple multiple of stability study
For example, the long term-stability study was
conducted over a period of 6 months, tlts= 6 months
Option 1 for first monitoring point Option 2 for first monitoring point
Date of value assignment: 1 Feb 2020 Date of last long term stability: 1 May 2020
First date: 1 Feb 2020 + tlts = 1 Aug 2020 Second date: 1 May 2020 + tlts = 1 Nov 2020
Hence, the first monitoring point is 1 Nov 2020 (the later one).
Thereafter, set the subsequent monitoring points at interval of
2*t(lts) from the first. The monitoring plan can look something like
below:
t(lts) = 6 months Monitoring plan
Last long term stability 1-May-20
First monitoring point 1-Nov-20
Second monitoring point 1-Nov-21
Third monitoring point 1-Nov-22
สถาบันมาตรวิทยาแห่งชาติ
National Institute of Metrology “I AM NIMT” 35
Evaluation of stability monitoring
results
 The basic evaluation of a single stability
monitoring experiment applied to a CRM
relies on comparison of the new measured
value with the certified value.
 The approach requires the standard
uncertainties of umon and uCRM associated with
Xmon and XCRM, respectively.
2
2
* mon
CRM
mon
CRM u
u
k
x
x 


k= coverage factor at 95% confidence
level, k = 2
uCRM= standard uncertainty of CRM
umon=monitored standard uncertainty
สถาบันมาตรวิทยาแห่งชาติ
National Institute of Metrology “I AM NIMT” 36
Evaluation of stability monitoring
results
 If the condition
is met , then the material may be considered to be sufficiently
stable and the stability is demonstrated.
 Under these conditions, no changes will be made to the
assigned value and the associated uncertainty.
 The validity of the assigned value of the CRM/RM can be
extended.
 If the monitoring stability testing indicates that the
property value is no longer valid within its uncertainty,
- Perform confirmatory studies (with or without temporary
suspension of RM distribution)
- Halting distribution and discarding the material, or
2
2
* mon
CRM
mon
CRM u
u
k
x
x 


สถาบันมาตรวิทยาแห่งชาติ
National Institute of Metrology “I AM NIMT” 37
 Where there is an acceptable range for
change in a property value over time in
storage, it can be useful to estimate either;
- the storage lifetime (or shelf life) of a
reference material, or
- set the first monitoring point using the
results from a stability data
 It is based on estimation the 95% confidence
interval for future values.
 Set acceptable range for the certified value
B.4 Predicting shelf life or
choosing initial monitoring plan
สถาบันมาตรวิทยาแห่งชาติ
National Institute of Metrology “I AM NIMT” 38
B.4 Prediction shelf life in the
case of linear trend
Lupr = upper specification limit = certified
value +U/3
Llwr = lower specification limit = certified
value- U/3
b0+b1ts,upr = predicted y (Y^) at a
predicted time point (x^)






 n
i
i
n
x
x
x
n
s
t
CI x
1
2
2
^
2
,
'
95
)
(
)
(
1 s= standard error of the regression
n= number of data used for simulati
xbar= average time point of data used
สถาบันมาตรวิทยาแห่งชาติ
National Institute of Metrology “I AM NIMT” 39
Prediction of shelf life
The first intersect point
The earliest point at which the CI intersects the specified tole
t(shelf)
สถาบันมาตรวิทยาแห่งชาติ
National Institute of Metrology “I AM NIMT” 40
Predicting shelf life
However, if the specification limits are too close
together (e.g. small expanded uncertainty,
particularly CRM pure standard solution). It is
not possible to find a real value solution.
สถาบันมาตรวิทยาแห่งชาติ
National Institute of Metrology “I AM NIMT” 41
B.4 Prediction shelf life in the
case of linear trend
สถาบันมาตรวิทยาแห่งชาติ
National Institute of Metrology “I AM NIMT” 42
Prediction shelf life in the case
of linear trend
ISO Guide 35(2017), page 85
สถาบันมาตรวิทยาแห่งชาติ
National Institute of Metrology “I AM NIMT” 43
Thank
you!

Day 3 Statistic for CRM_ISO Guide 35-stability study.ppt

  • 1.
    National Institute ofMetrology (Thailand) สถาบันมาตรวิทยาแห่งชาติ “I AM NIMT” Paul Armishaw and Kittiya Shearman Statistics for reference materials production_ISO Guide 35: 2017
  • 2.
  • 3.
    สถาบันมาตรวิทยาแห่งชาติ National Institute ofMetrology “I AM NIMT” 3 Workflow for stability study 1) Select stability testing scheme for short-term and long-t 2) Select sampling strategy (random stratified, systematic s 3) Select measurement procedure (good precision) and con 4) Evaluate the stability testing results-Trend analysis 6) Evaluate the uncertainty of stability 5) Predict shelf life (if applicable) 8) Stability monitoring
  • 4.
    สถาบันมาตรวิทยาแห่งชาติ National Institute ofMetrology “I AM NIMT” 4 Assessment of stability 8.2.2 Type of (in)stability There are two types of (in) stability to be considered in the certification of reference materials: a) Long-term stability Stability of he material during the period of validity under specified storage conditions, and b) Short-term stability (transportation stability) Stability under reasonably expected conditions of transport  How is this information used? • to provide uncertainty estimate associated with stability of the material
  • 5.
    สถาบันมาตรวิทยาแห่งชาติ National Institute ofMetrology “I AM NIMT” 5 Short-term stability studies • The producer shall, prior to distribution of the material to users, assess the stability of the reference material under expected conditions of transport. • For this, the behavior of the material and it’s property values are studies under the intended for packaging and transport. • The conditions should include temperatures that might occur during transport, for e.g. between- 50 C to 70C • The duration should reflect the duration
  • 6.
    สถาบันมาตรวิทยาแห่งชาติ National Institute ofMetrology “I AM NIMT” 6 Long-term stability study • The long-term stability of a reference material shall be assessed prior to distribution of the materials to users. • Real-time stability studies typically last 12 months or more. • Accelerated studies are typically shorter but include more extreme conditions. • For example, below -70C, -30 C, -20  C, 4  C or 25  C as the possible storage temperatures of the reference materials. • Where time-to-market for new materials is crucial, it is possible to limit the long-term stability study to less than 12 months and
  • 7.
    สถาบันมาตรวิทยาแห่งชาติ National Institute ofMetrology “I AM NIMT” 7 Assessment of stability 8.3.2 Classification according to conditions of measurement • Classical stability studies-intermediate condition of measurement (within- laboratory reproducibility condition) • Isochronous stability studies- Repeatability condition of measurement
  • 8.
    สถาบันมาตรวิทยาแห่งชาติ National Institute ofMetrology “I AM NIMT” 8 Stability experiment design  Classical approach • Individual samples prepared as a batch under identical conditions and measured as time elapses –different batch and calibration-intermediate condition of measurement (within- laboratory reproducibility condition) • High uncertainty due to instability of measurement system • Required for on-going stability monitoring for extension of certificates • Due to the run effects may be important, a minimum of 4 points in
  • 9.
    สถาบันมาตรวิทยาแห่งชาติ National Institute ofMetrology “I AM NIMT” 9 Stability experiment design  Isochronous approach • All measurement of stability carried out at the same time under repeatable conditions – a single batch and calibration • Reduce variability of results over time lead to smaller uncertainty • Usually employed for the first 6 months stability testing • Minimum of 2 RM units for each time point
  • 10.
    สถาบันมาตรวิทยาแห่งชาติ National Institute ofMetrology “I AM NIMT” 10 Isochronous Stability testing Long-term stability at -20oC Accelerated stability 1, 3, 5, 7 and 14 days at 40oC +40oC -20oC -80oC Reference Samples removed from oven after 1, 3, 5, 7 and 14 days Samples removed from freezer after 1, 2, 3, 4, 5 and 6 months Samples and reference sample analysed in a single batch using same calibration standard Stored at -80oC until analysis Stored at -80oC until analysis
  • 11.
    สถาบันมาตรวิทยาแห่งชาติ National Institute ofMetrology “I AM NIMT” 11 Isochronous Stability testing Long-term stability at -20oC Accelerated stability 1, 3, 5, 7 and 14 days at 40oC +40oC -20oC -80oC Reference Samples removed from oven after 1, 3, 5, 7 and 14 days Samples removed from freezer after 1, 2, 3, 4, 5 and 6 months Samples and reference sample analysed in a single batch using same calibration standard Stored at -80oC until analysis Stored at -80oC until analysis Reference samples is required for the on going long-term stability testing
  • 12.
    สถาบันมาตรวิทยาแห่งชาติ National Institute ofMetrology “I AM NIMT” 12 Stability testing schedule A minimum of 2 to 3 units are tested at each time point to obtain an average measurement value No. of bottles Days Date started Date due -80oC +40oC -20oC 0 1/04/2015 1/04/2015 2 2 1 1/04/2015 2/04/2015 2 3 1/04/2015 4/04/2015 2 5 1/04/2015 6/04/2015 2 7 1/04/2015 8/04/2015 2 14 1/04/2015 15/04/201 2 Months 0 1/04/2015 1/04/2015 2 2 1 1/04/2015 1/05/2015 2 2 1/04/2015 1/06/2015 2 4 1/04/2015 1/08/2015 2 6 1/04/2015 1/10/2015 2 Total no. of bottles 4 12 10
  • 13.
    สถาบันมาตรวิทยาแห่งชาติ National Institute ofMetrology “I AM NIMT” 13 Classical Stability testing 0 week stability data Select 10 bottles stored at reference temperature for study 4 weeks stability -80oC Reference temp Analyze 2 bottles, 1 week stability data Analyze 2 bottles, 2 week stability data Analyze 2 bottles, 3 week stability data Analyze 2 bottles, 4 week stability data 1/5/2019 8/5/2019 15/5/2019 22/5/2019 29/5/2019 23/4/2019 Analyze 2 bottles and move other 8 bottles from reference temp to study temp at 4 C 8 bottles left stored at 4 C 6 bottles left stored at 4 C 4 bottles left stored at 4 C 2 bottles left stored at 4 C 4oC study temp
  • 14.
    สถาบันมาตรวิทยาแห่งชาติ National Institute ofMetrology “I AM NIMT” 14 Isochronous Stability testing –Model 1 Materials are subjected to test temp for 4 weeks Prepare materials and select 10 bottles stored at reference temperature for study 4 weeks stability -80oC Reference temp Materials are subjected to test temp for 3 weeks Materials are subjected to test temp for 2 weeks Materials are subjected to test temp for 1 weeks Materials are subjected to test temp for 0 weeks then analyse all 10 bottles 1/5/2019 8/5/2019 15/5/2019 22/5/2019 29/5/2019 23/4/2019 Transfer 2 bottles from reference temp to study temp at 40 C Transfer 2 bottles from reference temp to study temp at 40 C Transfer 2 bottles from reference temp to study temp at 40 C Transfer 2 bottles from reference temp to study temp at 40 C 2 bottles left at reference temp 40oC study temp
  • 15.
    สถาบันมาตรวิทยาแห่งชาติ National Institute ofMetrology “I AM NIMT” 15 Isochronous Stability testing –Model 2 Materials are subjected to test temp for 1 week  Prepare materials and select 2 bottles from storage i.e. -20 C to ref temp at -80 C • Select other 8 bottles stored at study temp (40 C) -80oC Reference temp and 40oC study temp Materials are subjected to test temp for 2 weeks Materials are subjected to test temp for 3 weeks Materials are subjected to test temp for 4 weeks, then analze all 10 bottles 1/5/2019 8/5/2019 15/5/2019 22/5/2019 29/5/2019 Transfer 2 bottles from study temp to ref temp at -80 C Transfer 2 bottles from study temp to ref temp at -80 C Transfer 2 bottles from study temp to ref temp at -80 C Transfer 2 bottles from study temp to ref temp at -80 C The first 2 materials are subjected to test temp for 0 week
  • 16.
    สถาบันมาตรวิทยาแห่งชาติ National Institute ofMetrology “I AM NIMT” 16 Experiment Design  After selecting the stability approaches, other consideration should be given to; • Selection of units Select sampling strategy (random stratified and systematic samplings) used in homogeneity may be applied. • Selection of suitable measurement procedure The precision of the measurement procedure ( very precise methods required low levels of replication, good
  • 17.
    สถาบันมาตรวิทยาแห่งชาติ National Institute ofMetrology “I AM NIMT” 17 Experiment Design  After selecting the stability approaches, other consideration should be given to; • The need to allow for failures in individual observations or RM units Allowing a minimum of two units for each combination of time and temperature. • The need to verify linear model for a more accurate measurement.  To provide some check on linearity a minimum of 3 observation times is essential in an isochronous study. For classical study where run effects may be important, a minimum of 4 points in time,
  • 18.
    สถาบันมาตรวิทยาแห่งชาติ National Institute ofMetrology “I AM NIMT” 18 Assessment of stability • Using trend analysis (linear regression) • Assumption , the slope of the regression should be 0, if the material is stable. • Using t-test to check if the slope is significantly different from 0.
  • 19.
    สถาบันมาตรวิทยาแห่งชาติ National Institute ofMetrology “I AM NIMT” 19 Assessment of stability • Using trend analysis (linear regression) Slope, b1 0.241 0.0087 Intercept, b0 standard deviation of slope, sb1 0.005008 0.002877 standard deviation of intercept r^2 0.994418 0.005486 standard error of regression, S F 2316.113 13 degrees of freedom, n-2 Sum of squares due to regression 0.069697 0.000391 Sum of squares due to residual • Regression from the Data Analysis toolbox OR • LINEST Function - LINEST is an array function - Highlight a block 2 columns by 5 rows - Type in “=LINEST(y-array, x-array, intercept, array) - intercept =0 if no intercept, else 1 - Array = 1 if require statistics - press Ctrl + Shift + Enter
  • 20.
    สถาบันมาตรวิทยาแห่งชาติ National Institute ofMetrology “I AM NIMT” 20 Assessment of stability B.3.4 Testing for statistically significant change (using trend analysis) ) 2 , " 05 . 0 ( ) ( 1 1    n df t b s b critcal b1=slope s(b1)= standard error of the slope tcritical is calculated from “=TINV(0.05, df)”
  • 21.
    สถาบันมาตรวิทยาแห่งชาติ National Institute ofMetrology “I AM NIMT” 21 Testing for statistically significant trend-ANOVA  ANOVA table for linear regression, using F- test to significant Fcrt is calculated from using “= FINV(0.05,df1,df1) Yi= observation i of n observations of the property being Y^=estimated Y from the linear equation Y(bar)= average value of the property being measured
  • 22.
    สถาบันมาตรวิทยาแห่งชาติ National Institute ofMetrology “I AM NIMT” 22 Assessment of stability 8.7 uncertainty evaluation from stability studies 8.7.1 General considerations for uncertainty evaluation from stability studies  Where valid technical reasons that the potential change is negligible compared with the certified uncertainty (<uCRM/3) and supported by experience, the standard uncertainty of long-term stability , ults, may set as zero or omitted from the uncertainty in the certified value.
  • 23.
    สถาบันมาตรวิทยาแห่งชาติ National Institute ofMetrology “I AM NIMT” 23 Assessment of stability 8.7 uncertainty evaluation from stability studies 8.7.3 …in the absence of significant trend Where ults = standard uncertainty of long-term stability s(b1) = standard error of the estimated slope tm1 = the time interval between value assignment and the initial stability monitoring point ) ( * ) ( 1 1 cert m lts t t b s u  
  • 24.
    สถาบันมาตรวิทยาแห่งชาติ National Institute ofMetrology “I AM NIMT” 24 Assessment of stability 8.7 uncertainty evaluation from stability studies 8.7.3…Some RMP do not provide an expiry date specific to each certificate issued, preferring to set an expiry date based on a planned lifetime for the material, the uncertainty for long term stability or to the time to the second planned monitoring point; Where ults = standard uncertainty of long-term stability s(b1) = standard error of the estimated slope tcert= the period of validity of a certificate issued during that time or the period from the value nd cert lts t b s u * ) ( 1 
  • 25.
    สถาบันมาตรวิทยาแห่งชาติ National Institute ofMetrology “I AM NIMT” 25 Examples For example, the long term-stability study was conducted over a period of 6 months, tlts=6 months Option 1 for first monitoring point Option 2 for first monitoring point Date of value assignment: 1 Feb 2020 Date of last long term stability: 1 May 2020 First date: 1 Feb 2020 + tlts = 1 Aug 2020 Second date: 1 May 2020 + tlts = 1 Nov 2020 Hence, the first monitoring point is 1 Nov 2020 (the later one). Thereafter, set the subsequent monitoring points at interval of from the first. The monitoring plan can look something like t(lts) = 6 months Monitoring plan Last long term stability 1-May-20 First monitoring point 1-Nov-20 Second monitoring point 1-Nov-21 Third monitoring point 1-Nov-22 tm1=9 months tcert=9+12 months
  • 26.
    สถาบันมาตรวิทยาแห่งชาติ National Institute ofMetrology “I AM NIMT” 26 Long-term stability testing- Exercise#5 The results are long-term stability studies of a buffer pH 7 solution performed at 20C. Create spreadsheet to check for long-term stability using trend analysis Determine if the material is sufficiently stable. What is the uncertainty due to storage condition after 2 years? time (months) pH value 0 7.0099 3 7.0077 6 7.0022 9 7.0075 12 7.0009 24 7.0018
  • 27.
    สถาบันมาตรวิทยาแห่งชาติ National Institute ofMetrology “I AM NIMT” 27 Long-term stability testing- Exercise#6 The results are Long-term stability of RM of KCl 0.1 M Determine if the material is sufficiently stable. x-axis y-axis Date (DD/MM/YYYY) Months passed Average Electrolytic conductivity, EC (mS/cm) 1/1/2019 0 12.880 1/4/2019 3 12.879 1/9/2019 8 12.891 1/10/2019 9 12.890 1/12/2019 12 12.894
  • 28.
    สถาบันมาตรวิทยาแห่งชาติ National Institute ofMetrology “I AM NIMT” 28 Assessment of stability 8.6 Action on finding of a significant trend a) The property value for which the degradation was observed is not certified; b) The period of validity of the certified value is decreased, based on the model prediction… c) The expected extent of degradation over the intended period of validity is estimated , converted into a standard uncertainty and included, together with the uncertainty of the expected degradation, in the uncertainty of the assigned value; d) The certified value and its uncertainty are given as a function of time….
  • 29.
  • 30.
    สถาบันมาตรวิทยาแห่งชาติ National Institute ofMetrology “I AM NIMT” 30 Requirements for monitoring  Monitoring should be planned during the lifetime of the CRM.  The behavior of a given RM or CRM over its lifetime is difficult to predict reliably from typical stability studies.  Because the behavior is hard to predict, it is usually necessary to monitor the stability of the material.  Monitoring usually takes place using the classical design because the isochronous
  • 31.
    สถาบันมาตรวิทยาแห่งชาติ National Institute ofMetrology “I AM NIMT” 31 Monitoring plan where prior information is not available  There are two basic strategies for choosing initial monitoring points; a) Predict possible change and set the initial monitoring point b) Use a simple multiple of the stability study duration  It should be noted that stability monitoring does not affect the uncertainty statement of the reference material on the certificate, uCRM.
  • 32.
    สถาบันมาตรวิทยาแห่งชาติ National Institute ofMetrology “I AM NIMT” 32 stability monitoring plan a) Use of a predicted change to set the initial monitoring point The first intersect point The earliest point at which the CI intersects the specified t The first monitoring p
  • 33.
    สถาบันมาตรวิทยาแห่งชาติ National Institute ofMetrology “I AM NIMT” 33 b) Use of a simple multiple of the stability study duration  This strategy is simple but can be shorter intervals than strategy a)  It is based on multiples of long-term stability study duration, t(lts).  Example: • Set the first monitoring point at the later of the value assignment date plus t(lts) and the date of the end of the long-term stability study plus t(lts). • Set two subsequent monitoring points at
  • 34.
    สถาบันมาตรวิทยาแห่งชาติ National Institute ofMetrology “I AM NIMT” 34 Examples of stability monitoring plan b) Use a simple multiple of stability study For example, the long term-stability study was conducted over a period of 6 months, tlts= 6 months Option 1 for first monitoring point Option 2 for first monitoring point Date of value assignment: 1 Feb 2020 Date of last long term stability: 1 May 2020 First date: 1 Feb 2020 + tlts = 1 Aug 2020 Second date: 1 May 2020 + tlts = 1 Nov 2020 Hence, the first monitoring point is 1 Nov 2020 (the later one). Thereafter, set the subsequent monitoring points at interval of 2*t(lts) from the first. The monitoring plan can look something like below: t(lts) = 6 months Monitoring plan Last long term stability 1-May-20 First monitoring point 1-Nov-20 Second monitoring point 1-Nov-21 Third monitoring point 1-Nov-22
  • 35.
    สถาบันมาตรวิทยาแห่งชาติ National Institute ofMetrology “I AM NIMT” 35 Evaluation of stability monitoring results  The basic evaluation of a single stability monitoring experiment applied to a CRM relies on comparison of the new measured value with the certified value.  The approach requires the standard uncertainties of umon and uCRM associated with Xmon and XCRM, respectively. 2 2 * mon CRM mon CRM u u k x x    k= coverage factor at 95% confidence level, k = 2 uCRM= standard uncertainty of CRM umon=monitored standard uncertainty
  • 36.
    สถาบันมาตรวิทยาแห่งชาติ National Institute ofMetrology “I AM NIMT” 36 Evaluation of stability monitoring results  If the condition is met , then the material may be considered to be sufficiently stable and the stability is demonstrated.  Under these conditions, no changes will be made to the assigned value and the associated uncertainty.  The validity of the assigned value of the CRM/RM can be extended.  If the monitoring stability testing indicates that the property value is no longer valid within its uncertainty, - Perform confirmatory studies (with or without temporary suspension of RM distribution) - Halting distribution and discarding the material, or 2 2 * mon CRM mon CRM u u k x x   
  • 37.
    สถาบันมาตรวิทยาแห่งชาติ National Institute ofMetrology “I AM NIMT” 37  Where there is an acceptable range for change in a property value over time in storage, it can be useful to estimate either; - the storage lifetime (or shelf life) of a reference material, or - set the first monitoring point using the results from a stability data  It is based on estimation the 95% confidence interval for future values.  Set acceptable range for the certified value B.4 Predicting shelf life or choosing initial monitoring plan
  • 38.
    สถาบันมาตรวิทยาแห่งชาติ National Institute ofMetrology “I AM NIMT” 38 B.4 Prediction shelf life in the case of linear trend Lupr = upper specification limit = certified value +U/3 Llwr = lower specification limit = certified value- U/3 b0+b1ts,upr = predicted y (Y^) at a predicted time point (x^)        n i i n x x x n s t CI x 1 2 2 ^ 2 , ' 95 ) ( ) ( 1 s= standard error of the regression n= number of data used for simulati xbar= average time point of data used
  • 39.
    สถาบันมาตรวิทยาแห่งชาติ National Institute ofMetrology “I AM NIMT” 39 Prediction of shelf life The first intersect point The earliest point at which the CI intersects the specified tole t(shelf)
  • 40.
    สถาบันมาตรวิทยาแห่งชาติ National Institute ofMetrology “I AM NIMT” 40 Predicting shelf life However, if the specification limits are too close together (e.g. small expanded uncertainty, particularly CRM pure standard solution). It is not possible to find a real value solution.
  • 41.
    สถาบันมาตรวิทยาแห่งชาติ National Institute ofMetrology “I AM NIMT” 41 B.4 Prediction shelf life in the case of linear trend
  • 42.
    สถาบันมาตรวิทยาแห่งชาติ National Institute ofMetrology “I AM NIMT” 42 Prediction shelf life in the case of linear trend ISO Guide 35(2017), page 85
  • 43.

Editor's Notes

  • #22 Alternative way is to compute an ANOVA table for linear regression
  • #33 U/3 gives low risk of certified value moving outside of the expanded uncertainty before the first monitoring point
  • #40 U/3 gives low risk of certified value moving outside of the expanded uncertainty before the first monitoring point
  • #41 U/3 gives low risk of certified value moving outside of the expanded uncertainty before the first monitoring point