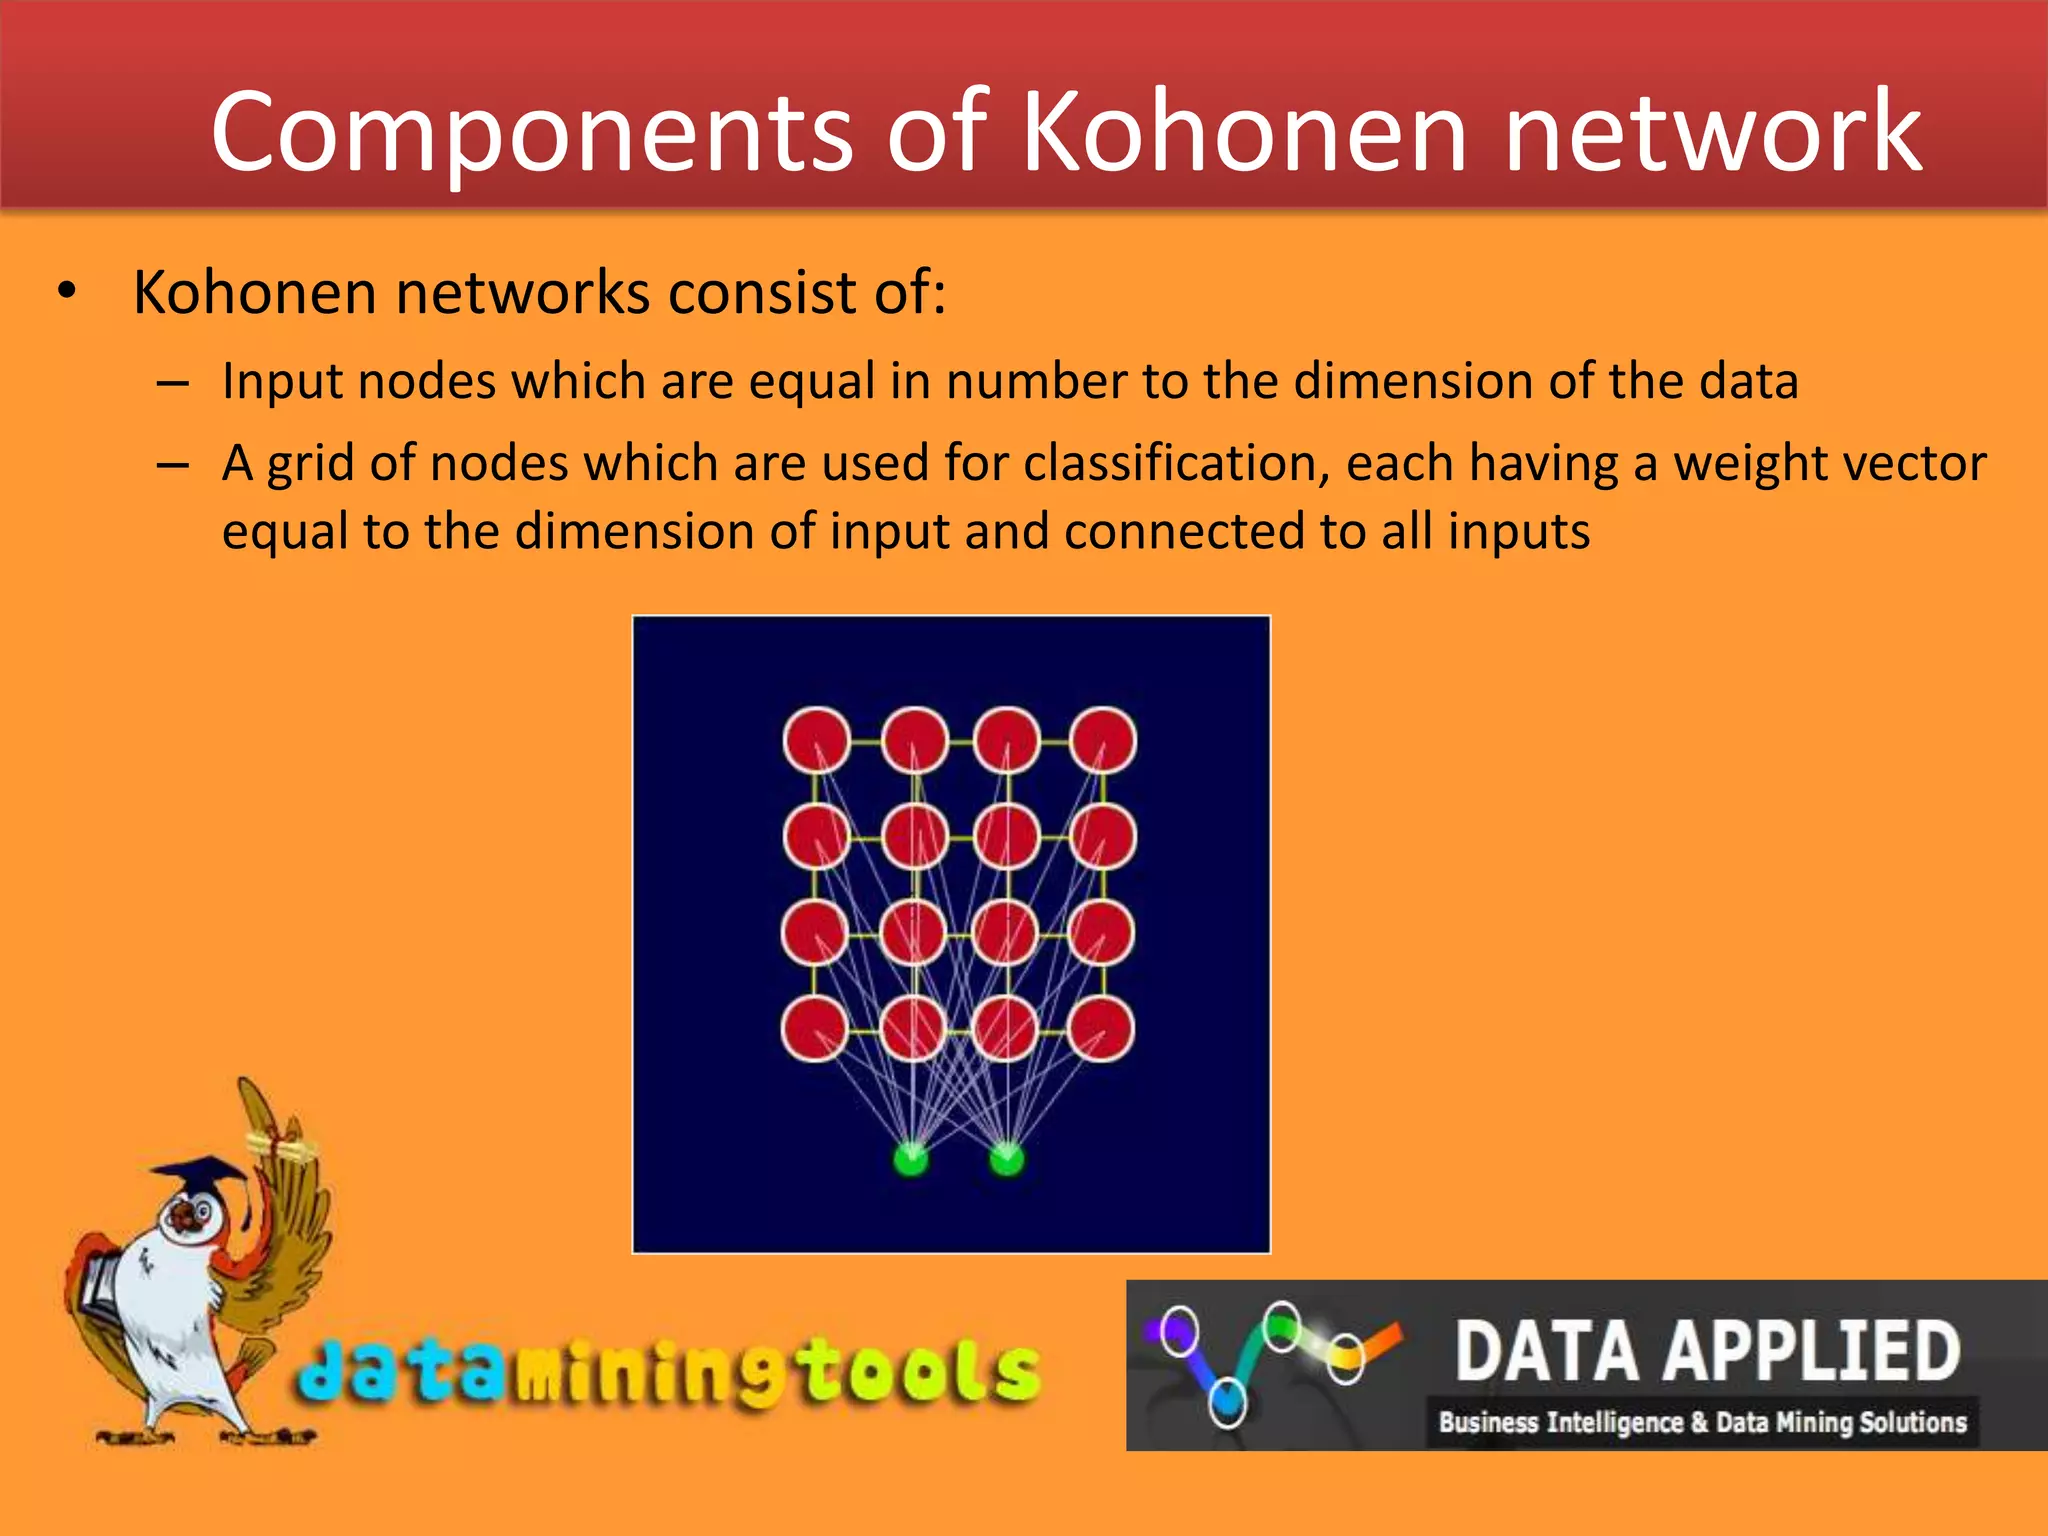
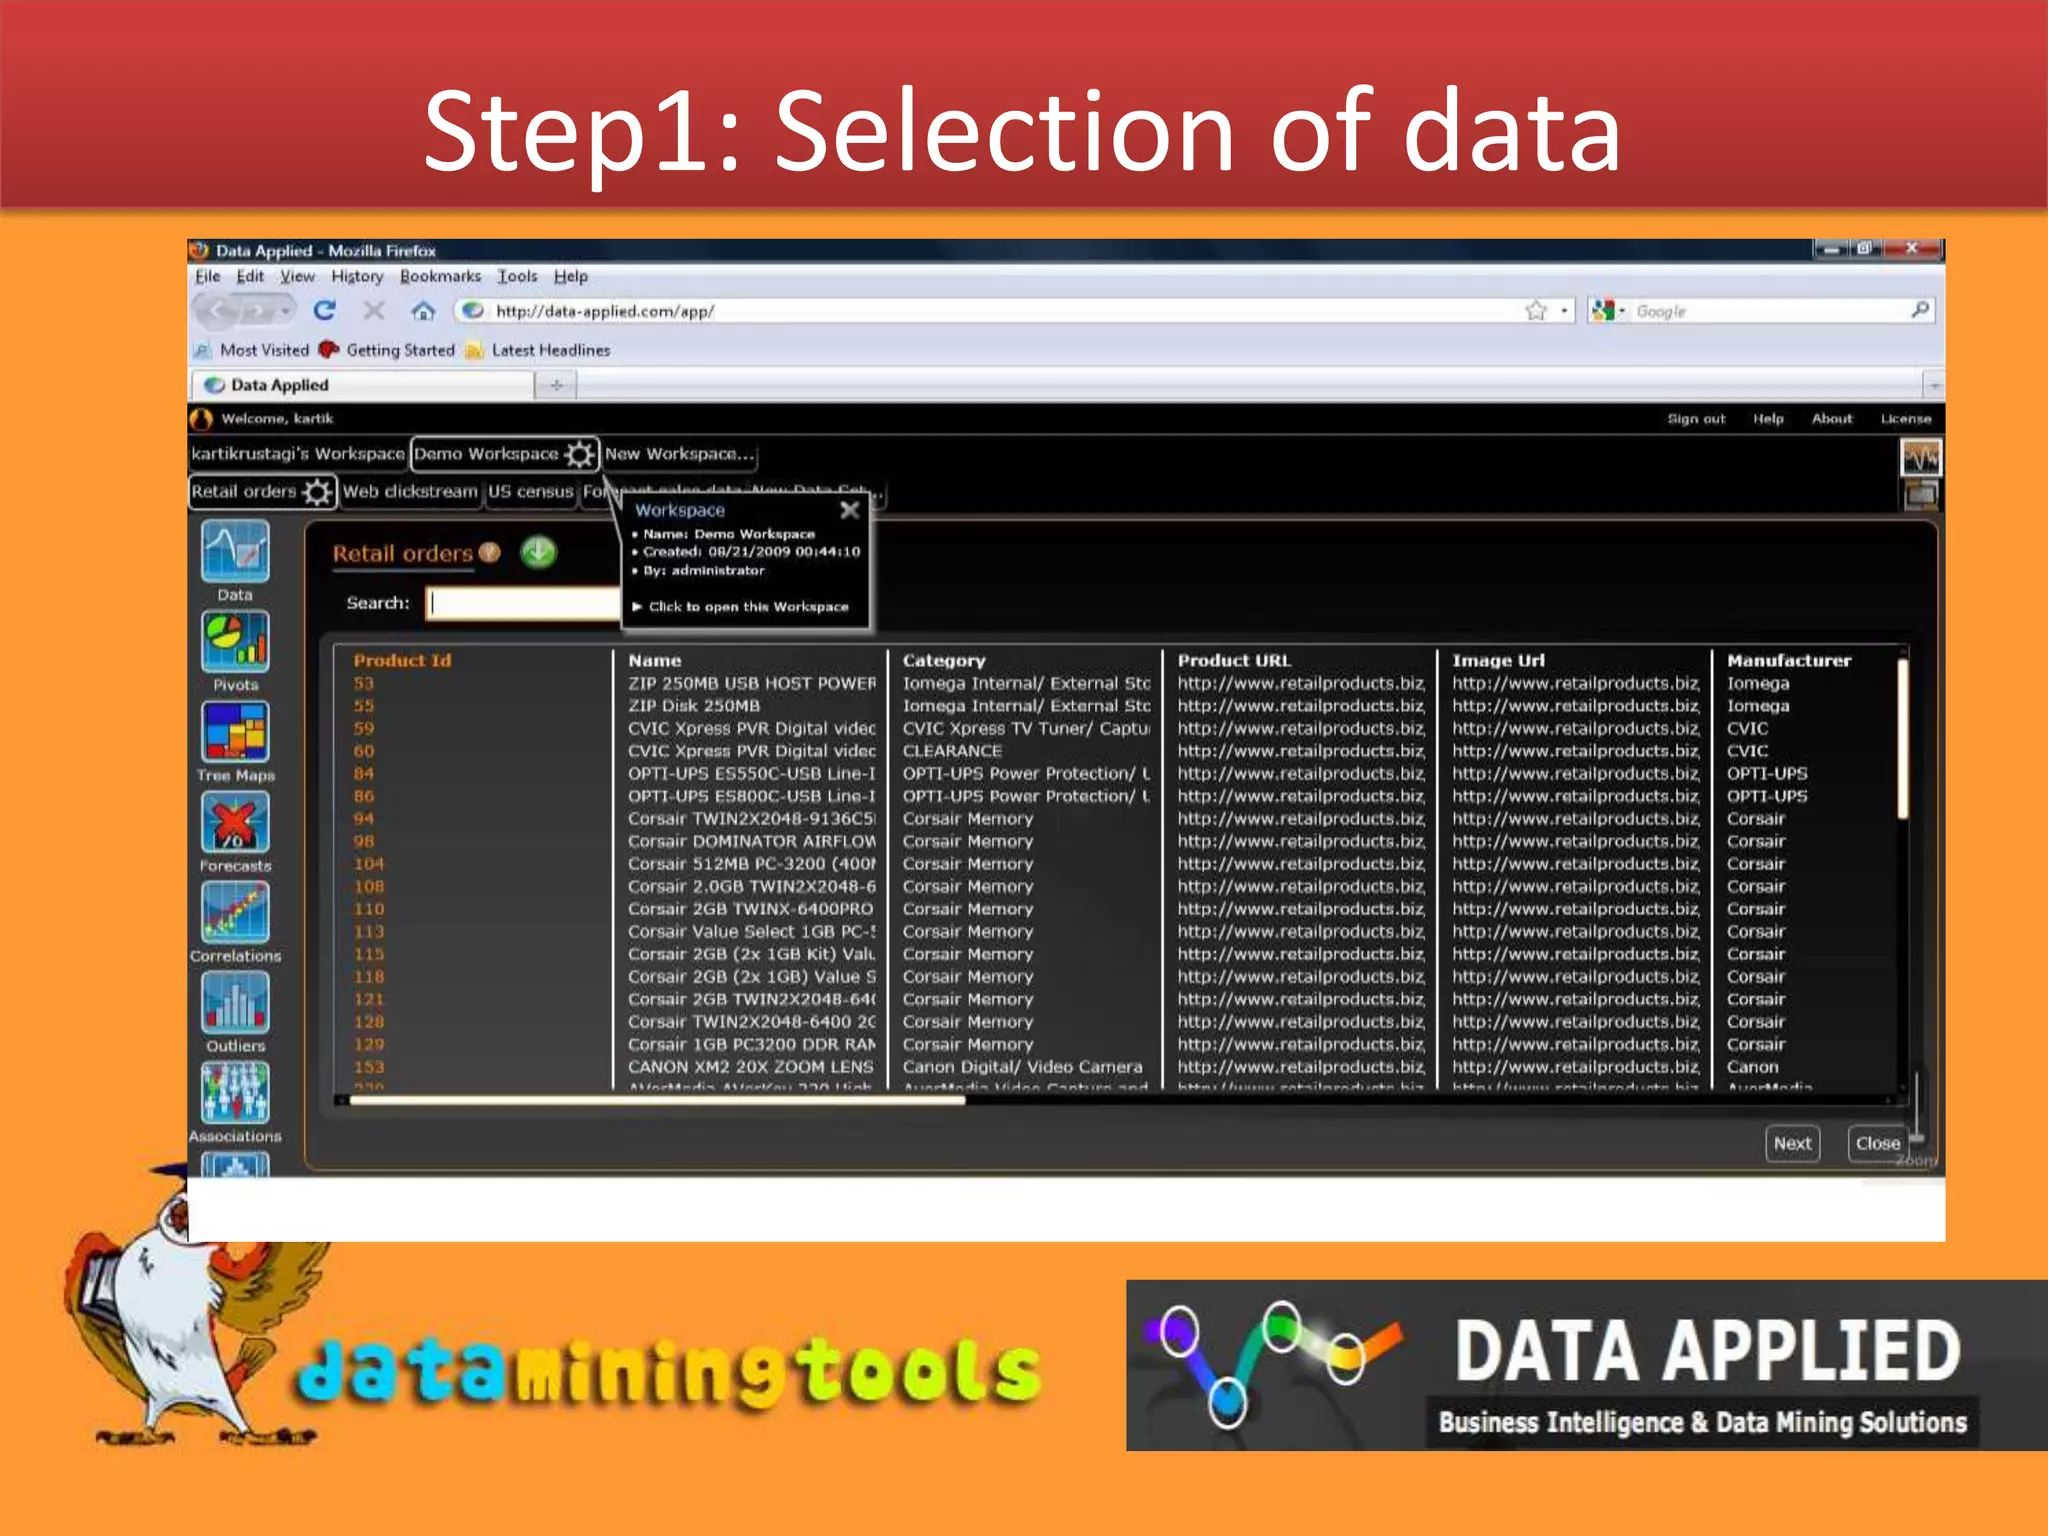
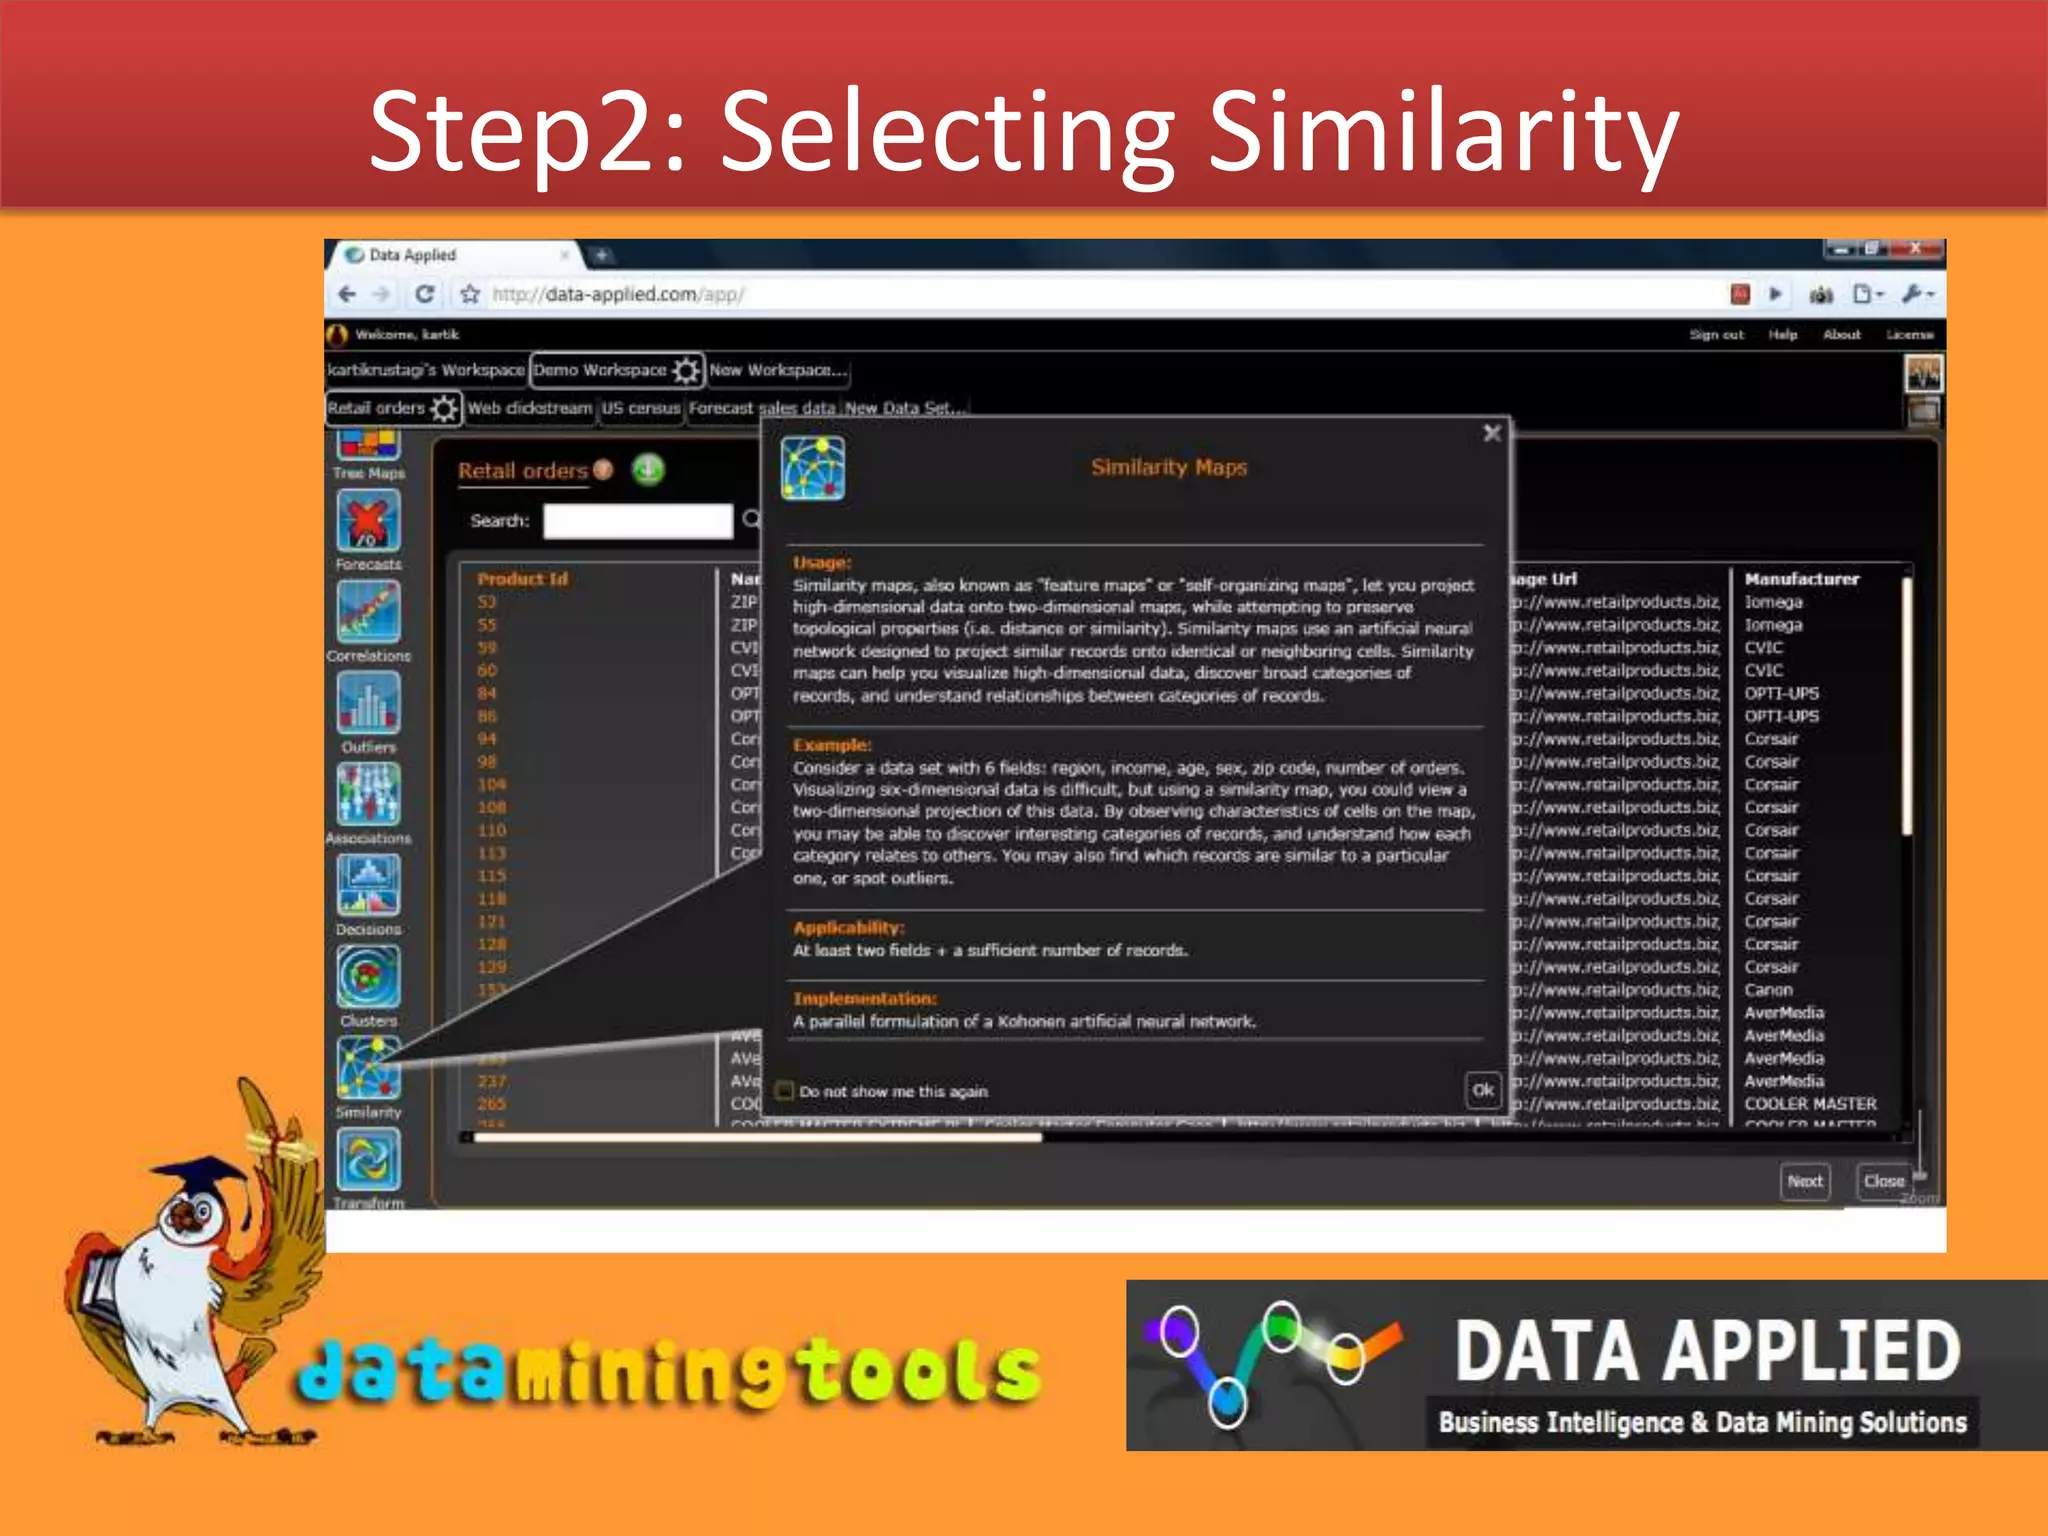
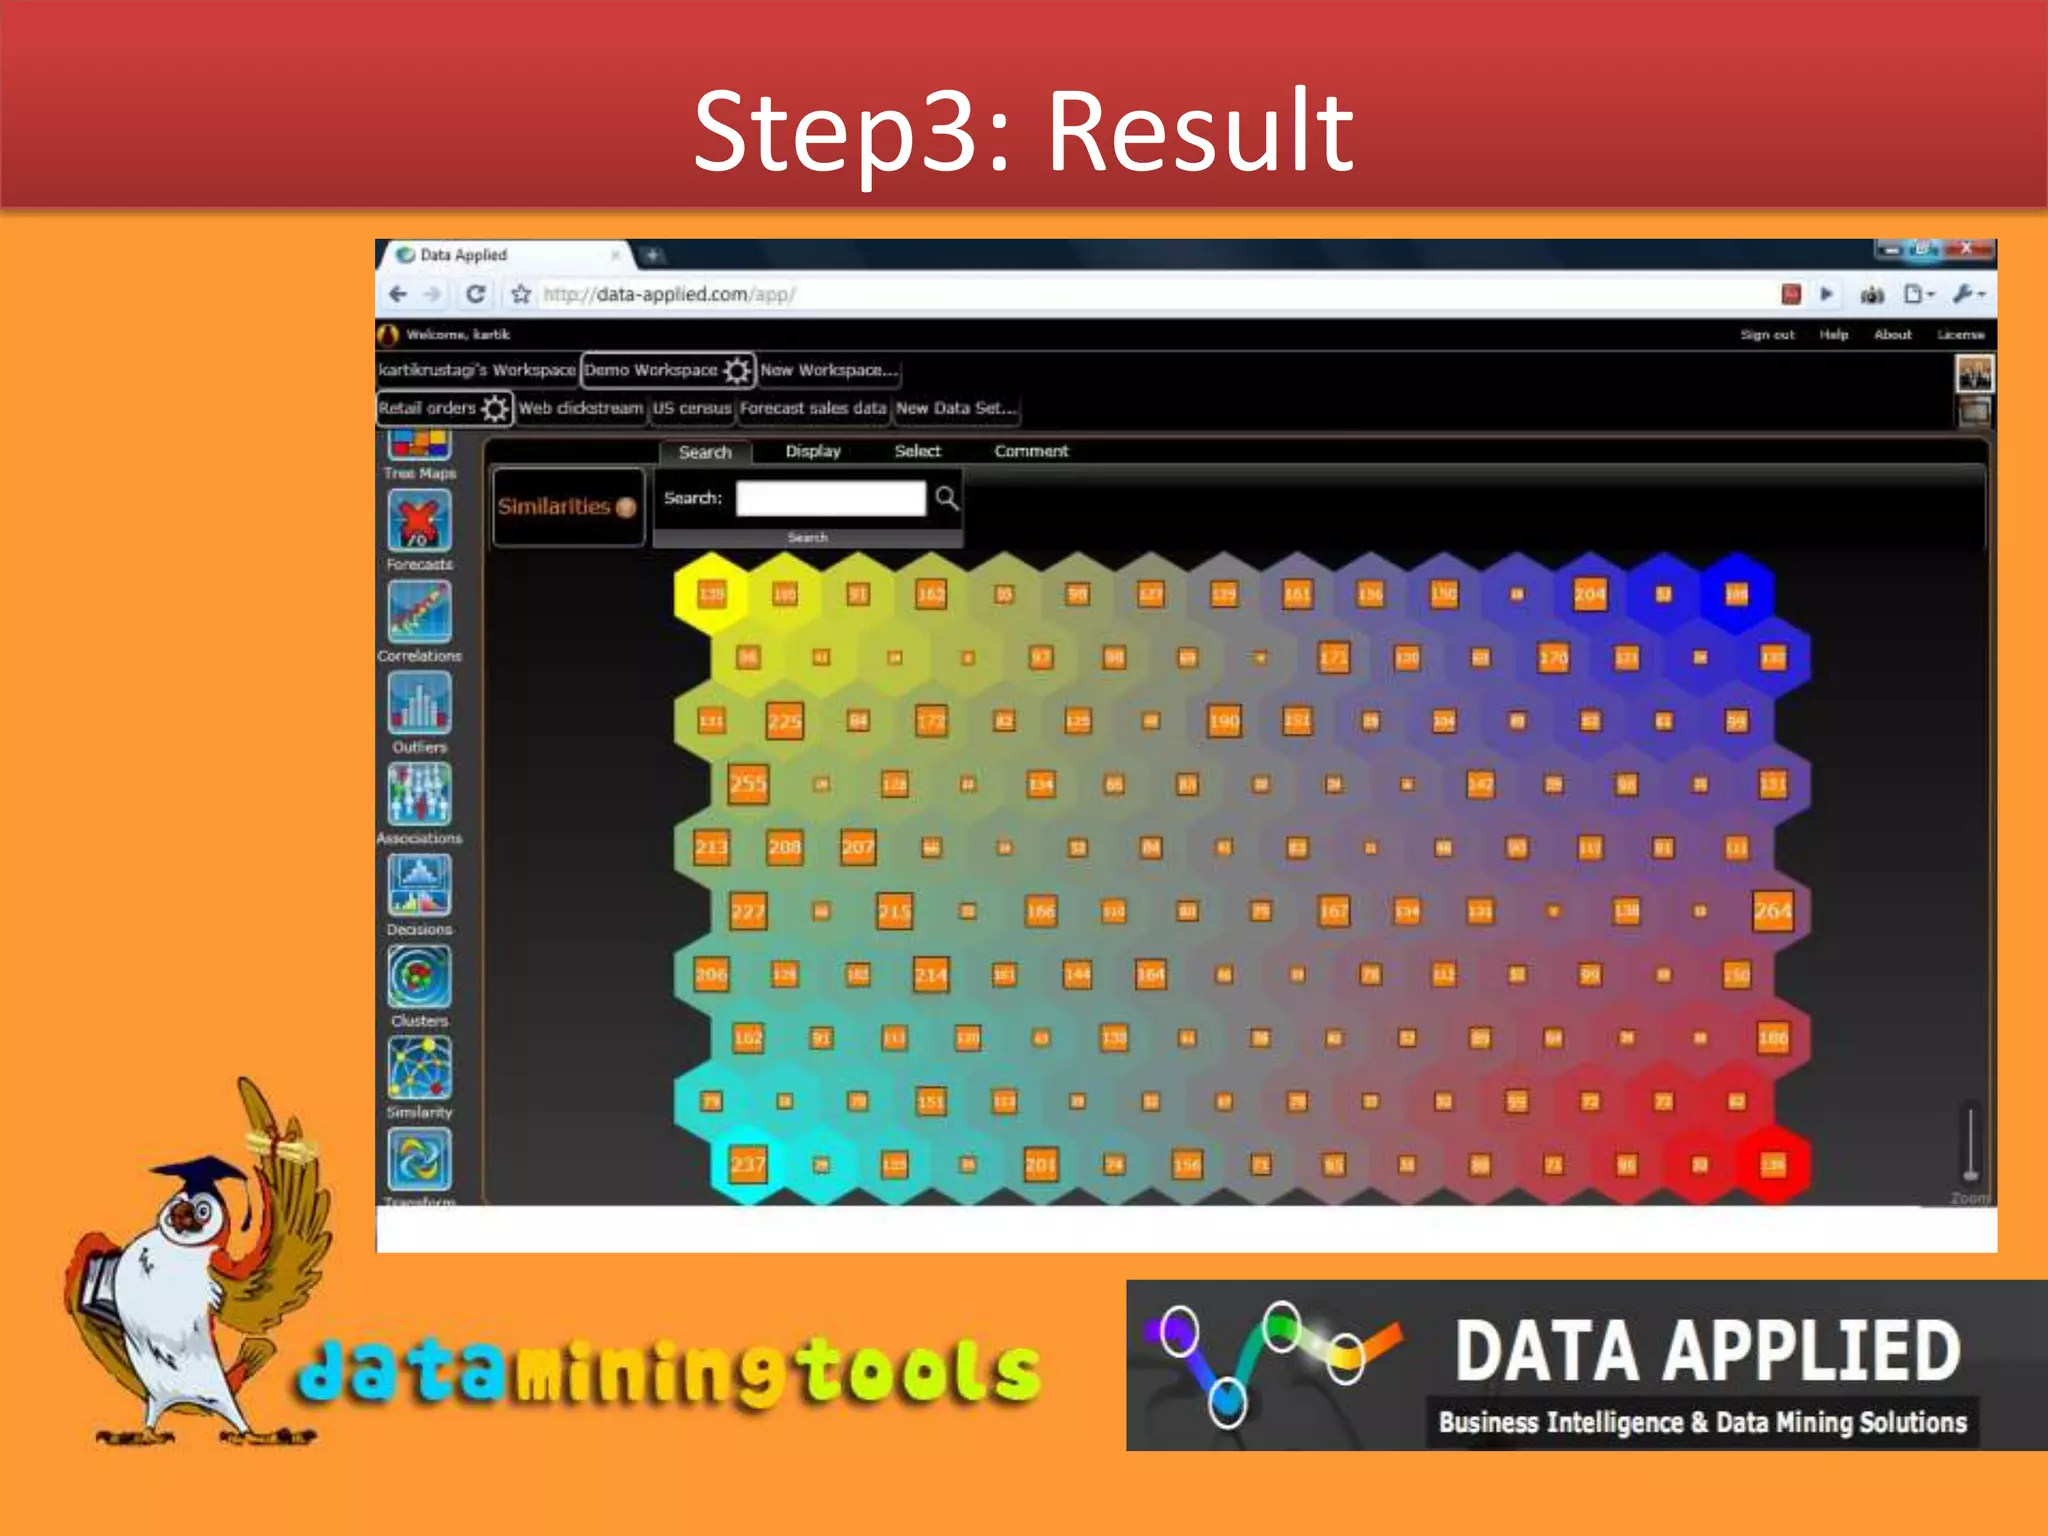
Data-Applied.com: Similarity
IntroductionVisualization of data having high dimensions is very difficultThe kohonen network enables us to represent high dimensional data in lower dimensions  while keeping the topological information in it like similarity etc. intactKohonen networks or self organizing maps learn to classify data without supervision unlike artificial neural networksA SOM does not need a target output to be specified unlike many other types of network. The learning steps are:
Components of Kohonen networkKohonen networks consist of:Input nodes which are equal in number to the dimension of the dataA grid of nodes which are used for classification, each having a weight vector equal to the dimension of input and connected to all inputs
Learn Algorithm OverviewEach node's weights are initialized.A vector is chosen at random from the set of training data and presented to the lattice.Every node is examined to calculate which one's weights are most like the input vector. The winning node is commonly known as the Best Matching Unit (BMU).The radius of the neighbourhood of the BMU is now calculated. This is a value that starts large, typically set to the 'radius' of the lattice,  but diminishes each time-step. Any nodes found within this
Learn Algorithm OverviewEach node's weights are initialized.A vector is chosen at random from the set of training data and presented to the lattice.Every node is examined to calculate which one's weights are most like the input vector. The winning node is commonly known as the Best Matching Unit (BMU).The radius of the neighbourhood of the BMU is now calculated. This is a value that starts large, typically set to the 'radius' of the lattice,  but diminishes each time-step. Any node found within
Learn Algorithm Overview(contd..)     radius are deemed to be inside the BMU's neighbourhood.5.  Each neighbouring node's (the nodes found in step 4) weights are adjusted to make them more like the input vector. The closer a node is to the BMU, the more its weights get altered.6.  Repeat step 2 for N iterations.
Similarity using Data Applied’s web interface
Step1: Selection of data
Step2: Selecting Similarity
Step3: Result
Visit more self help tutorialsPick a tutorial of your choice and browse through it at your own pace.

Data Applied: Similarity

  • 1.
  • 2.
    IntroductionVisualization of datahaving high dimensions is very difficultThe kohonen network enables us to represent high dimensional data in lower dimensions while keeping the topological information in it like similarity etc. intactKohonen networks or self organizing maps learn to classify data without supervision unlike artificial neural networksA SOM does not need a target output to be specified unlike many other types of network. The learning steps are:
  • 3.
    Components of KohonennetworkKohonen networks consist of:Input nodes which are equal in number to the dimension of the dataA grid of nodes which are used for classification, each having a weight vector equal to the dimension of input and connected to all inputs
  • 4.
    Learn Algorithm OverviewEachnode's weights are initialized.A vector is chosen at random from the set of training data and presented to the lattice.Every node is examined to calculate which one's weights are most like the input vector. The winning node is commonly known as the Best Matching Unit (BMU).The radius of the neighbourhood of the BMU is now calculated. This is a value that starts large, typically set to the 'radius' of the lattice,  but diminishes each time-step. Any nodes found within this
  • 5.
    Learn Algorithm OverviewEachnode's weights are initialized.A vector is chosen at random from the set of training data and presented to the lattice.Every node is examined to calculate which one's weights are most like the input vector. The winning node is commonly known as the Best Matching Unit (BMU).The radius of the neighbourhood of the BMU is now calculated. This is a value that starts large, typically set to the 'radius' of the lattice,  but diminishes each time-step. Any node found within
  • 6.
    Learn Algorithm Overview(contd..) radius are deemed to be inside the BMU's neighbourhood.5. Each neighbouring node's (the nodes found in step 4) weights are adjusted to make them more like the input vector. The closer a node is to the BMU, the more its weights get altered.6. Repeat step 2 for N iterations.
  • 7.
    Similarity using DataApplied’s web interface
  • 8.
  • 9.
  • 10.
  • 11.
    Visit more selfhelp tutorialsPick a tutorial of your choice and browse through it at your own pace.
  • 12.
    The tutorials sectionis free, self-guiding and will not involve any additional support.
  • 13.
    Visit us atwww.dataminingtools.net