GLOBAL CHP MARKETOVERVIEW
For COGEN World Coalition
17 December 2024
Presented by
Dr Simon MINETT
Managing Director, Challoch Energy
2.
www.cogenworld.org
❑ Methodology andSources
❑ World CHP Market Overview
❑ Overview of Regional CHP Markets
❑ Europe
❑ Germany, Italy, Poland, Netherlands & the UK
❑ EU27
❑ Russian Federation
❑ Americas
❑ United States, Canada & Brazil
❑ Asia
❑ China & India
❑ Africa
❑ Australia and New Zealand
❑ Assessment of Waste Heat from the Power Sector
❑ CHP Prospects for each Continent
Content
3.
www.cogenworld.org
Methodology
▪ Desk research,including data collection; comparison and analysis of data from different sources
▪ Priority given to IEA data for consistency, as data from other sources do not cover the same period
▪ Analysis of CHP market development in the period 2011-2022, with focus on CHP fuel mix, CHP
electricity and heat generation (when available), and electricity share in total electricity
generation. The main report has more data on big markets in each region with additional
information.
▪ Most of the slides are 2021 data as the 2022 IEA data was not complete enough to use. However
for EU-27 2022 data were used.
Sources
- IEA, Eurostat, National Statistics Offices
- Other sources (COGEN Europe, Global Energy Monitor, Digest of UK Energy Statistics (DUKES)…)
CHP MARKET OVERVIEW
Methodology and Sources
4.
www.cogenworld.org
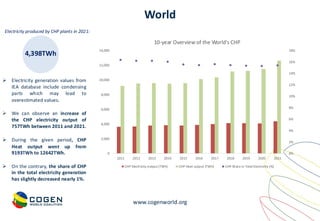
World
4,398TWh
Electricity produced byCHP plants in 2021:
➢ Electricity generation values from
IEA database include condensing
parts which may lead to
overestimated values.
➢ We can observe an increase of
the CHP electricity output of
757TWh between 2011 and 2021.
➢ During the given period, CHP
Heat output went up from
9193TWh to 12642TWh.
➢ On the contrary, the share of CHP
in the total electricity generation
has slightly decreased nearly 1%.
0%
2%
4%
6%
8%
10%
12%
14%
16%
18%
0
2,000
4,000
6,000
8,000
10,000
12,000
14,000
2011 2012 2013 2014 2015 2016 2017 2018 2019 2020 2021
10-year Overview of the World's CHP
CHP Electricity output (TWh) CHP Heat output (TWh) CHP Share in Total Electricity (%)
5.
www.cogenworld.org
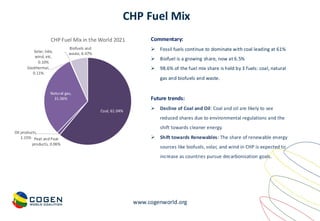
CHP Fuel Mix
Commentary:
➢Fossil fuels continue to dominate with coal leading at 61%
➢ Biofuel is a growing share, now at 6.5%
➢ 98.6% of the fuel mix share is held by 3 fuels: coal, natural
gas and biofuels and waste.
Future trends:
➢ Decline of Coal and Oil: Coal and oil are likely to see
reduced shares due to environmental regulations and the
shift towards cleaner energy.
➢ Shift towards Renewables: The share of renewable energy
sources like biofuels, solar, and wind in CHP is expected to
increase as countries pursue decarbonisation goals.
Coal, 61.04%
Peat and Peat
products, 0.06%
Oil products,
1.15%
Natural gas,
31.06%
Geothermal,
0.11%
Solar, tide,
wind, etc,
0.10%
Biofuels and
waste, 6.47%
CHP Fuel Mix in the World 2021
6.
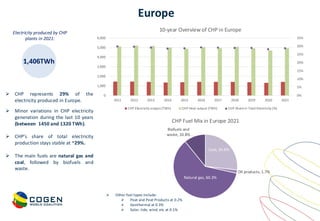
www.cogenworld.org
Europe
1,406TWh
Electricity produced byCHP
plants in 2021:
➢ Minor variations in CHP electricity
generation during the last 10 years
(between 1450 and 1320 TWh).
➢ CHP’s share of total electricity
production stays stable at ~29%.
➢ The main fuels are natural gas and
coal, followed by biofuels and
waste.
➢ CHP represents 29% of the
electricity produced in Europe.
0%
5%
10%
15%
20%
25%
30%
35%
0
1,000
2,000
3,000
4,000
5,000
6,000
2011 2012 2013 2014 2015 2016 2017 2018 2019 2020 2021
10-year Overview of CHP in Europe
CHP Electricity output (TWh) CHP Heat output (TWh) CHP Share in Total Electricity (%)
Coal, 26.6%
Oil products, 1.7%
Natural gas, 60.3%
Biofuels and
waste, 10.8%
CHP Fuel Mix in Europe 2021
➢ Other fuel types include:
➢ Peat and Peat Products at 0.2%
➢ Geothermal at 0.3%
➢ Solar, tide, wind, etc at 0.1%
7.
www.cogenworld.org
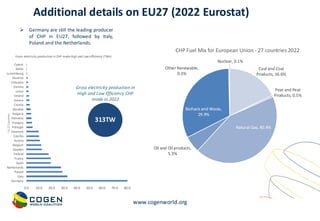
0.0 10.0 20.030.0 40.0 50.0 60.0 70.0 80.0
Germany
Italy
Poland
Netherlands
Spain
France
Finland
Sweden
Belgium
Austria
Czechia
Denmark
Portugal
Hungary
Romania
Bulgaria
Slovakia
Croatia
Greece
Ireland
Latvia
Estonia
Lithuania
Slovenia
Luxembourg
Malta
Cyprus
Gross electricity production in CHP modeHigh and Low efficiency (TWh)
EU
27
Countries
Additional details on EU27 (2022 Eurostat)
313TW
Gross electricity production in
High and Low Efficiency CHP
mode in 2022
➢ Germany are still the leading producer
of CHP in EU27, followed by Italy,
Poland and the Netherlands.
Coal and Coal
Products, 16.6%
Peat and Peat
Products, 0.5%
Natural Gas, 40.4%
Oil and Oil products,
5.3%
Biofuels and Waste,
29.9%
Other Renewable,
0.3%
Nuclear, 0.1%
CHP Fuel Mix for European Union - 27 countries 2022
8.
www.cogenworld.org
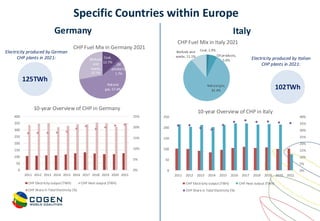
Specific Countries withinEurope
125TWh
Electricity produced by German
CHP plants in 2021:
102TWh
Electricity produced by Italian
CHP plants in 2021:
0%
5%
10%
15%
20%
25%
0
50
100
150
200
250
300
350
400
2011 2012 2013 2014 2015 2016 2017 2018 2019 2020 2021
10-year Overview of CHP in Germany
CHP Electricity output (TWh) CHP Heat output (TWh)
CHP Share in Total Electricity (%)
Coal,
12.7%
Oil
products,
1.7%
Natural
gas, 57.4%
Biofuels
and
waste,
27.7%
CHP Fuel Mix in Germany 2021
0%
5%
10%
15%
20%
25%
30%
35%
40%
0
50
100
150
200
250
2011 2012 2013 2014 2015 2016 2017 2018 2019 2020 2021
10-year Overview of CHP in Italy
CHP Electricity output (TWh) CHP Heat output (TWh)
CHP Share in Total Electricity (%)
Coal, 1.9%
Oil products,
5.6%
Natural gas,
81.4%
Biofuels and
waste, 11.1%
CHP Fuel Mix in Italy 2021
Germany Italy
9.
www.cogenworld.org
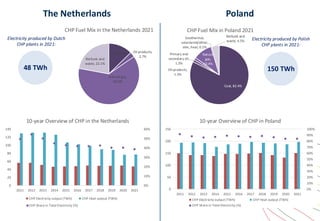
Coal, 82.4%
Primary and
secondaryoil,
1.3%
Oil products,
1.3%
Natural
gas,
10.4%
Geothermal,
solar/wind/other,
elec, heat, 0.1%
Biofuels and
waste, 4.5%
CHP Fuel Mix in Poland 2021
48 TWh
Electricity produced by Dutch
CHP plants in 2021:
150 TWh
Electricity produced by Polish
CHP plants in 2021:
The Netherlands Poland
Coal, 12.7% Oil products,
2.7%
Natural gas,
62.5%
Biofuels and
waste, 22.1%
CHP Fuel Mix in the Netherlands 2021
0%
10%
20%
30%
40%
50%
60%
0
20
40
60
80
100
120
140
2011 2012 2013 2014 2015 2016 2017 2018 2019 2020 2021
10-year Overview of CHP in the Netherlands
CHP Electricity output (TWh) CHP Heat output (TWh)
CHP Share in Total Electricity (%)
0%
10%
20%
30%
40%
50%
60%
70%
80%
90%
100%
0
50
100
150
200
250
2011 2012 2013 2014 2015 2016 2017 2018 2019 2020 2021
10-year Overview of CHP in Poland
CHP Electricity output (TWh) CHP Heat output (TWh)
CHP Share in Total Electricity (%)
10.
www.cogenworld.org
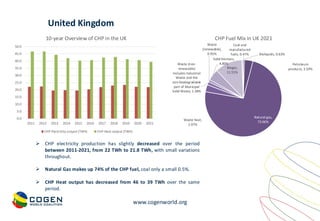
Coal and
manufactured
fuels, 0.47%
Petroleum
products,3.59%
Natural gas,
73.66%
Waste heat,
2.97%
Waste (non-
renewable)
Includes Industrial
Waste and the
non-biodegradable
part of Municipal
Solid Waste, 1.38%
Waste
(renewable),
0.95%
Solid biomass,
4.80%
Biogas,
11.55%
Bioliquids, 0.63%
CHP Fuel Mix in UK 2021
United Kingdom
0.0
5.0
10.0
15.0
20.0
25.0
30.0
35.0
40.0
45.0
50.0
2011 2012 2013 2014 2015 2016 2017 2018 2019 2020 2021
10-year Overview of CHP in the UK
CHP Electricity output (TWh) CHP Heat output (TWh)
➢ CHP electricity production has slightly decreased over the period
between 2011-2021, from 22 TWh to 21.8 TWh, with small variations
throughout.
➢ Natural Gas makes up 74% of the CHP fuel, coal only a small 0.5%.
➢ CHP Heat output has decreased from 46 to 39 TWh over the same
period.
11.
www.cogenworld.org
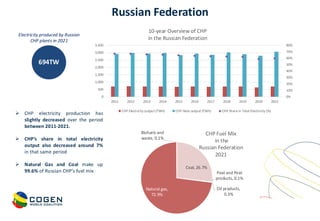
Russian Federation
694TW
Electricity producedby Russian
CHP plants in 2021
0%
10%
20%
30%
40%
50%
60%
70%
80%
0
500
1,000
1,500
2,000
2,500
3,000
3,500
2011 2012 2013 2014 2015 2016 2017 2018 2019 2020 2021
10-year Overview of CHP
in the Russian Federation
CHP Electricity output (TWh) CHP Heat output (TWh) CHP Share in Total Electricity (%)
Coal, 26.7%
Peat and Peat
products, 0.1%
Oil products,
0.3%
Natural gas,
72.9%
Biofuels and
waste, 0.1%
CHP Fuel Mix
in the
Russian Federation
2021
➢ CHP electricity production has
slightly decreased over the period
between 2011-2021.
➢ CHP’s share in total electricity
output also decreased around 7%
in that same period
➢ Natural Gas and Coal make up
99.6% of Russian CHP’s fuel mix
12.
www.cogenworld.org
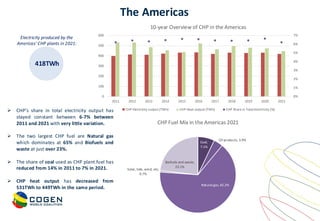
The Americas
418TWh
Electricity producedby the
Americas’ CHP plants in 2021:
0%
1%
2%
3%
4%
5%
6%
7%
0
100
200
300
400
500
600
2011 2012 2013 2014 2015 2016 2017 2018 2019 2020 2021
10-year Overview of CHP in the Americas
CHP Electricity output (TWh) CHP Heat output (TWh) CHP Share in Total Electricity (%)
Coal,
7.1%
Oil products, 3.9%
Natural gas, 65.2%
Solar, tide, wind, etc,
0.7%
Biofuels and waste,
23.1%
CHP Fuel Mix in the Americas 2021
➢ CHP’s share in total electricity output has
stayed constant between 6-7% between
2011 and 2021 with very little variation.
➢ The two largest CHP fuel are Natural gas
which dominates at 65% and Biofuels and
waste at just over 23%.
➢ The share of coal used as CHP plant fuel has
reduced from 14% in 2011 to 7% in 2021.
➢ CHP heat output has decreased from
531TWh to 449TWh in the same period.
13.
www.cogenworld.org
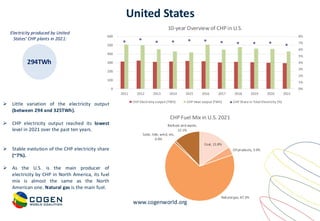
United States
294TWh
Electricity producedby United
States’ CHP plants in 2021:
➢ Little variation of the electricity output
(between 294 and 325TWh).
➢ CHP electricity output reached its lowest
level in 2021 over the past ten years.
➢ Stable evolution of the CHP electricity share
(~7%).
➢ As the U.S. is the main producer of
electricity by CHP in North America, its fuel
mix is almost the same as the North
American one. Natural gas is the main fuel.
Coal, 15.8%
Oil products, 3.9%
Natural gas, 67.3%
Solar, tide, wind, etc,
0.9%
Biofuels and waste,
12.1%
CHP Fuel Mix in U.S. 2021
0%
1%
2%
3%
4%
5%
6%
7%
8%
0
100
200
300
400
500
600
2011 2012 2013 2014 2015 2016 2017 2018 2019 2020 2021
10-year Overview of CHP in U.S.
CHP Electricity output (TWh) CHP Heat output (TWh) CHP Share in Total Electricity (%)
14.
www.cogenworld.org
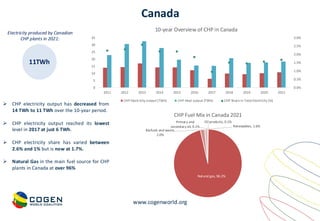
Canada
11TWh
Electricity produced byCanadian
CHP plants in 2021:
➢ CHP electricity output has decreased from
14 TWh to 11 TWh over the 10-year period.
➢ CHP electricity output reached its lowest
level in 2017 at just 6 TWh.
➢ CHP electricity share has varied between
2.6% and 1% but is now at 1.7%.
➢ Natural Gas in the main fuel source for CHP
plants in Canada at over 96%
0.0%
0.5%
1.0%
1.5%
2.0%
2.5%
3.0%
0
5
10
15
20
25
30
35
2011 2012 2013 2014 2015 2016 2017 2018 2019 2020 2021
10-year Overview of CHP in Canada
CHP Electricity output (TWh) CHP Heat output (TWh) CHP Share in Total Electricity (%)
Primary and
secondary oil, 0.1%
Oil products, 0.1%
Natural gas, 96.2%
Biofuels and waste,
2.0%
Renewables, 1.6%
CHP Fuel Mix in Canada 2021
15.
www.cogenworld.org
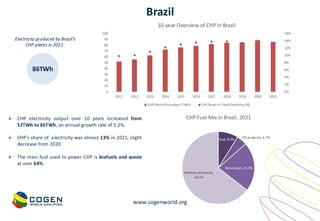
Brazil
86TWh
Electricity produced byBrazil’s
CHP plants in 2021:
➢ CHP electricity output over 10 years increased from
52TWh to 86TWh, an annual growth rate of 5.2%.
➢ CHP’s share of electricity was almost 13% in 2021, slight
decrease from 2020.
➢ The main fuel used to power CHP is biofuels and waste
at over 64%.
0%
2%
4%
6%
8%
10%
12%
14%
16%
0
10
20
30
40
50
60
70
80
90
100
2011 2012 2013 2014 2015 2016 2017 2018 2019 2020 2021
10-year Overview of CHP in Brazil
CHP Electricity output (TWh) CHP Share in Total Electricity (%)
Coal, 8.9%
Oil products, 4.7%
Natural gas, 21.9%
Biofuels and waste,
64.5%
CHP Fuel Mix in Brazil. 2021
16.
www.cogenworld.org
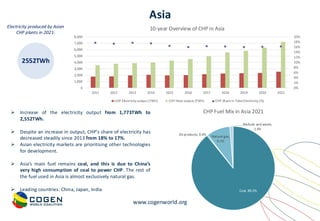
Asia
2552TWh
Electricity produced byAsian
CHP plants in 2021:
➢ Increase of the electricity output from 1,773TWh to
2,552TWh.
➢ Despite an increase in output, CHP’s share of electricity has
decreased steadily since 2013 from 18% to 17%.
➢ Asian electricity markets are prioritising other technologies
for development.
➢ Asia’s main fuel remains coal, and this is due to China’s
very high consumption of coal to power CHP. The rest of
the fuel used in Asia is almost exclusively natural gas.
➢ Leading countries: China, Japan, India
0%
2%
4%
6%
8%
10%
12%
14%
16%
18%
20%
0
1,000
2,000
3,000
4,000
5,000
6,000
7,000
8,000
2011 2012 2013 2014 2015 2016 2017 2018 2019 2020 2021
10-year Overview of CHP in Asia
CHP Electricity output (TWh) CHP Heat output (TWh) CHP Share in Total Electricity (%)
Coal, 89.2%
Oil products, 0.4%
Natural gas,
9.1%
Biofuels and waste,
1.3%
CHP Fuel Mix in Asia 2021
17.
www.cogenworld.org
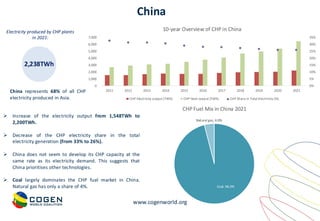
China
2,238TWh
Electricity produced byCHP plants
in 2021:
China represents 68% of all CHP
electricity produced in Asia.
➢ Increase of the electricity output from 1,548TWh to
2,200TWh.
➢ Decrease of the CHP electricity share in the total
electricity generation (from 33% to 26%).
➢ China does not seem to develop its CHP capacity at the
same rate as its electricity demand. This suggests that
China prioritises other technologies.
➢ Coal largely dominates the CHP fuel market in China.
Natural gas has only a share of 4%.
0%
5%
10%
15%
20%
25%
30%
35%
0
1,000
2,000
3,000
4,000
5,000
6,000
7,000
2011 2012 2013 2014 2015 2016 2017 2018 2019 2020 2021
10-year Overview of CHP in China
CHP Electricity output (TWh) CHP Heat output (TWh) CHP Share in Total Electricity (%)
Coal, 96.0%
Natural gas, 4.0%
CHP Fuel Mix in China 2021
18.
www.cogenworld.org
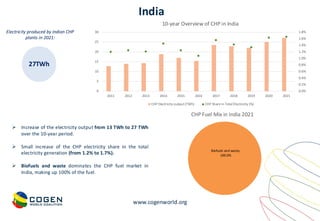
India
27TWh
Electricity produced byIndian CHP
plants in 2021:
➢ Increase of the electricity output from 13 TWh to 27 TWh
over the 10-year period.
➢ Small increase of the CHP electricity share in the total
electricity generation (from 1.2% to 1.7%).
➢ Biofuels and waste dominates the CHP fuel market in
India, making up 100% of the fuel.
0.0%
0.2%
0.4%
0.6%
0.8%
1.0%
1.2%
1.4%
1.6%
1.8%
0
5
10
15
20
25
30
2011 2012 2013 2014 2015 2016 2017 2018 2019 2020 2021
10-year Overview of CHP in India
CHP Electricity output (TWh) CHP Share in Total Electricity (%)
Biofuels and waste,
100.0%
CHP Fuel Mix in India 2021
19.
www.cogenworld.org
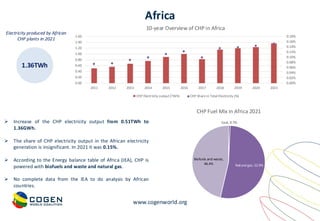
Africa
1.36TWh
Electricity produced byAfrican
CHP plants in 2021
➢ Increase of the CHP electricity output from 0.51TWh to
1.36GWh.
➢ The share of CHP electricity output in the African electricity
generation is insignificant. In 2021 it was 0.15%.
➢ According to the Energy balance table of Africa (IEA), CHP is
powered with biofuels and waste and natural gas.
➢ No complete data from the IEA to do analysis by African
countries.
Coal, 0.7%
Natural gas, 52.9%
Biofuels and waste,
46.4%
CHP Fuel Mix in Africa 2021
0.00%
0.02%
0.04%
0.06%
0.08%
0.10%
0.12%
0.14%
0.16%
0.18%
0.00
0.20
0.40
0.60
0.80
1.00
1.20
1.40
1.60
2011 2012 2013 2014 2015 2016 2017 2018 2019 2020 2021
10-year Overview of CHP in Africa
CHP Electricity output (TWh) CHP Share in Total Electricity (%)
20.
www.cogenworld.org
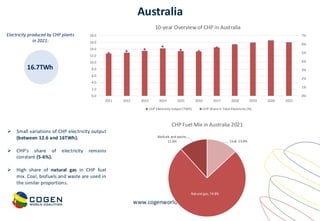
Australia
16.7TWh
Electricity produced byCHP plants
in 2021:
➢ Small variations of CHP electricity output
(between 12.6 and 16TWh).
➢ CHP’s share of electricity remains
constant (5-6%).
➢ High share of natural gas in CHP fuel
mix. Coal, biofuels and waste are used in
the similar proportions.
Coal, 13.0%
Natural gas, 74.8%
Biofuels and waste,
11.6%
CHP Fuel Mix in Australia 2021
0%
1%
2%
3%
4%
5%
6%
7%
0.0
2.0
4.0
6.0
8.0
10.0
12.0
14.0
16.0
18.0
2011 2012 2013 2014 2015 2016 2017 2018 2019 2020 2021
10-year Overview of CHP in Australia
CHP Electricity output (TWh) CHP Share in Total Electricity (%)
21.
www.cogenworld.org
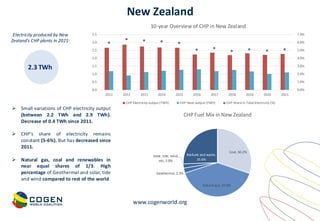
New Zealand
2.3 TWh
Electricityproduced by New
Zealand’s CHP plants in 2021:
➢ Small variations of CHP electricity output
(between 2.2 TWh and 2.9 TWh).
Decrease of 0.4 TWh since 2011.
➢ CHP’s share of electricity remains
constant (5-6%). But has decreased since
2011.
➢ Natural gas, coal and renewables in
near equal shares of 1/3. High
percentage of Geothermal and solar, tide
and wind compared to rest of the world
Coal, 30.2%
Natural gas, 39.9%
Geothermal, 2.3%
Solar, tide, wind,
etc, 2.0%
Biofuels and waste,
25.6%
CHP Fuel Mix in New Zealand
0.0%
1.0%
2.0%
3.0%
4.0%
5.0%
6.0%
7.0%
0.0
0.5
1.0
1.5
2.0
2.5
3.0
3.5
2011 2012 2013 2014 2015 2016 2017 2018 2019 2020 2021
10-year Overview of CHP in New Zealand
CHP Electricity output (TWh) CHP Heat output (TWh) CHP Share in Total Electricity (%)
22.
www.cogenworld.org
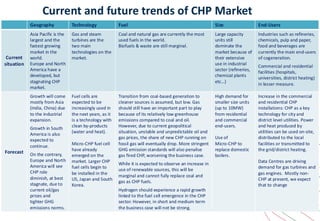
Current and futuretrends of CHP Market
Geography Technology Fuel Size End-Users
Current
situation
Asia Pacific is the
largest and the
fastest growing
market in the
world.
Europe and North
America have a
developed, but
stagnating CHP
market.
Gas and steam
turbines are the
two main
technologies on the
market.
Coal and natural gas are currently the most
used fuels in the world.
Biofuels & waste are still marginal.
Large capacity
units still
dominate the
market because of
their extensive
use in industrial
sector (refineries,
chemical plants
etc…)
Industries such as refineries,
chemicals, pulp and paper,
food and beverages are
currently the main end-users
of cogeneration.
Commercial and residential
facilities (hospitals,
universities, district heating)
in lesser measure.
Forecast
Growth will come
mostly from Asia
(India, China) due
to the industrial
expansion.
Growth in South
America is also
expected to
continue.
On the contrary,
Europe and North
America will see
CHP role
diminish, at best
stagnate, due to
current oil/gas
prices and
tighter GHG
emissions norms.
Fuel cells are
expected to be
increasingly used in
the next years, as it
is a technology with
clean by-products
(water and heat).
Micro-CHP fuel cell
have already
emerged on the
market. Larger CHP
fuel cells begin to
be installed in the
US, Japan and South
Korea.
Transition from coal-based generation to
cleaner sources is assumed, but low. Gas
should still have an important part to play
because of its relatively low greenhouse
emissions compared to coal and oil.
However, due to current geopolitical
situation, unstable and unpredictable oil and
gas prices, the share of new CHP running on
fossil gas will eventually drop. More stringent
GHG emission standards will also penalise
gas fired CHP, worsening the business case.
While it is expected to observe an increase in
use of renewable sources, this will be
marginal and cannot fully replace coal and
gas as CHP fuels.
Hydrogen should experience a rapid growth
linked to the fuel cell emergence in the CHP
sector. However, in short and medium term
the business case will not be strong.
High demand for
smaller size units
(up to 10MW)
from residential
and commercial
end-users.
Use of
Micro-CHP to
replace domestic
boilers.
Increase in the commercial
and residential CHP
installations: CHP as a key
technology for city and
district level utilities. Power
and heat produced by
utilities can be used on-site,
distributed to the local
facilities or transmitted to
the grid/district heating.
Data Centres are driving
demand for gas turbines and
gas engines. Mostly non-
CHP at present, we expect
that to change
23.
www.cogenworld.org
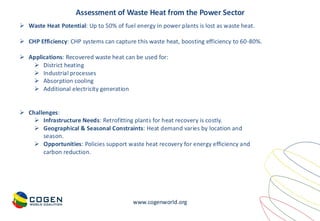
➢ Waste HeatPotential: Up to 50% of fuel energy in power plants is lost as waste heat.
➢ CHP Efficiency: CHP systems can capture this waste heat, boosting efficiency to 60-80%.
➢ Applications: Recovered waste heat can be used for:
➢ District heating
➢ Industrial processes
➢ Absorption cooling
➢ Additional electricity generation
➢ Challenges:
➢ Infrastructure Needs: Retrofitting plants for heat recovery is costly.
➢ Geographical & Seasonal Constraints: Heat demand varies by location and
season.
➢ Opportunities: Policies support waste heat recovery for energy efficiency and
carbon reduction.
Assessment of Waste Heat from the Power Sector
24.
www.cogenworld.org
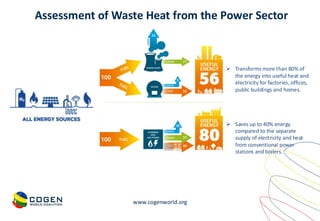
Assessment of WasteHeat from the Power Sector
➢ Transforms more than 80% of
the energy into useful heat and
electricity for factories, offices,
public buildings and homes.
➢ Saves up to 40% energy
compared to the separate
supply of electricity and heat
from conventional power
stations and boilers.
25.
www.cogenworld.org
CHP Prospects foreach Continent
Europe also has a well-established CHP market with strong
policy support:
➢ The region has ambitious carbon reduction goals and
energy security policies stimulating CHP investment.
➢ Natural gas is currently the primary fuel for CHP in
Europe.
Asia-Pacific is positioned for significant CHP market growth:
➢ Rapid industrialisation, urbanisation, and economic
growth are driving new CHP installations.
➢ China and India are leading the growth in power
generation and consumption.
➢ China is the world's largest CHP market and expected to
maintain its leadership position.
➢ The region is currently transitioning from coal-based to
gas-fired power generation, creating opportunities for
CHP
North America has a stable and expanding CHP market:
➢ The U.S. and Canada have established CHP infrastructure
with government incentives supporting efficiency
improvements.
➢ Natural gas is the dominant CHP fuel, with the region's
abundant supply contributing to its attractiveness.
South America shows moderate CHP market growth
potential:
➢ Brazil led the region with policies encouraging
energy efficiency and industrial cogeneration.
➢ CHP has potential in mining, creating CHP
opportunities.
➢ Challenges include regulatory barriers and
economic instability in some areas, which can
impact investment in new CHP projects.
Africa has emerging potential for CHP deployment:
➢ Industrial growth and urban expansion are
increasing energy demand across the continent.
➢ Limited grid reliability and high electricity costs are
driving interest in decentralised CHP solutions.
Summary
➢ North America, Europe, and Asia-Pacific are the
regions with the most developed and fastest-
growing CHP markets, while South America, Africa,
and the Middle East present emerging
opportunities with varying fuel mixes and growth
rates.
26.
www.cogenworld.org
EU Global Gateway:Boosting Clean Energy
and Infrastructure in Africa and South
America
EU Energy Projects Plan Boosts Africa and South America
The EU's Global Gateway initiative aims to unlock investment and enhance trade with developing nations, offering up to
€300 billion between 2021 and 2027. Africa and South America are key beneficiaries, with several flagship projects
focused on clean energy and infrastructure development.
Key Projects:
➢ Southern Hydrogen Corridor (Tunisia-Algeria)
➢ Large-scale Green Hydrogen Production in Argentina, Morocco, and Namibia
➢ Electrical Interconnectivity in Central and South America
➢ Solar Panel Production in The Gambia
These projects aim to strengthen EU strategic partnerships, with tangible milestones expected by 2025. The funding
could support clean hydrogen development, improving energy access for sectors like CHP in both regions.