Download to read offline

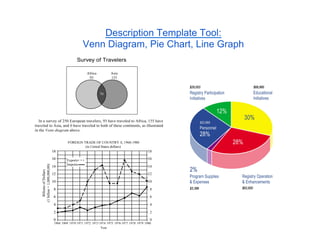
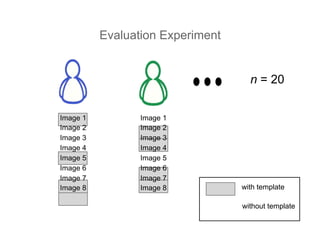
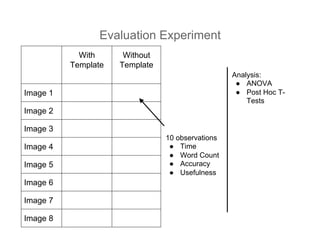
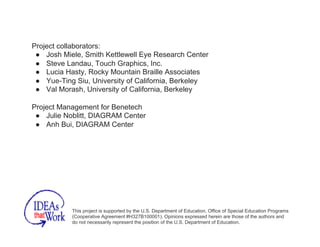


The document discusses tools developed by the Diagram Center for enhancing image descriptions using description templates across various academic subjects. It presents evaluation results from an experiment comparing templates in terms of time, word count, accuracy, and usefulness. The project is backed by the U.S. Department of Education and includes details for contacting project collaborators and registering for user trials.


