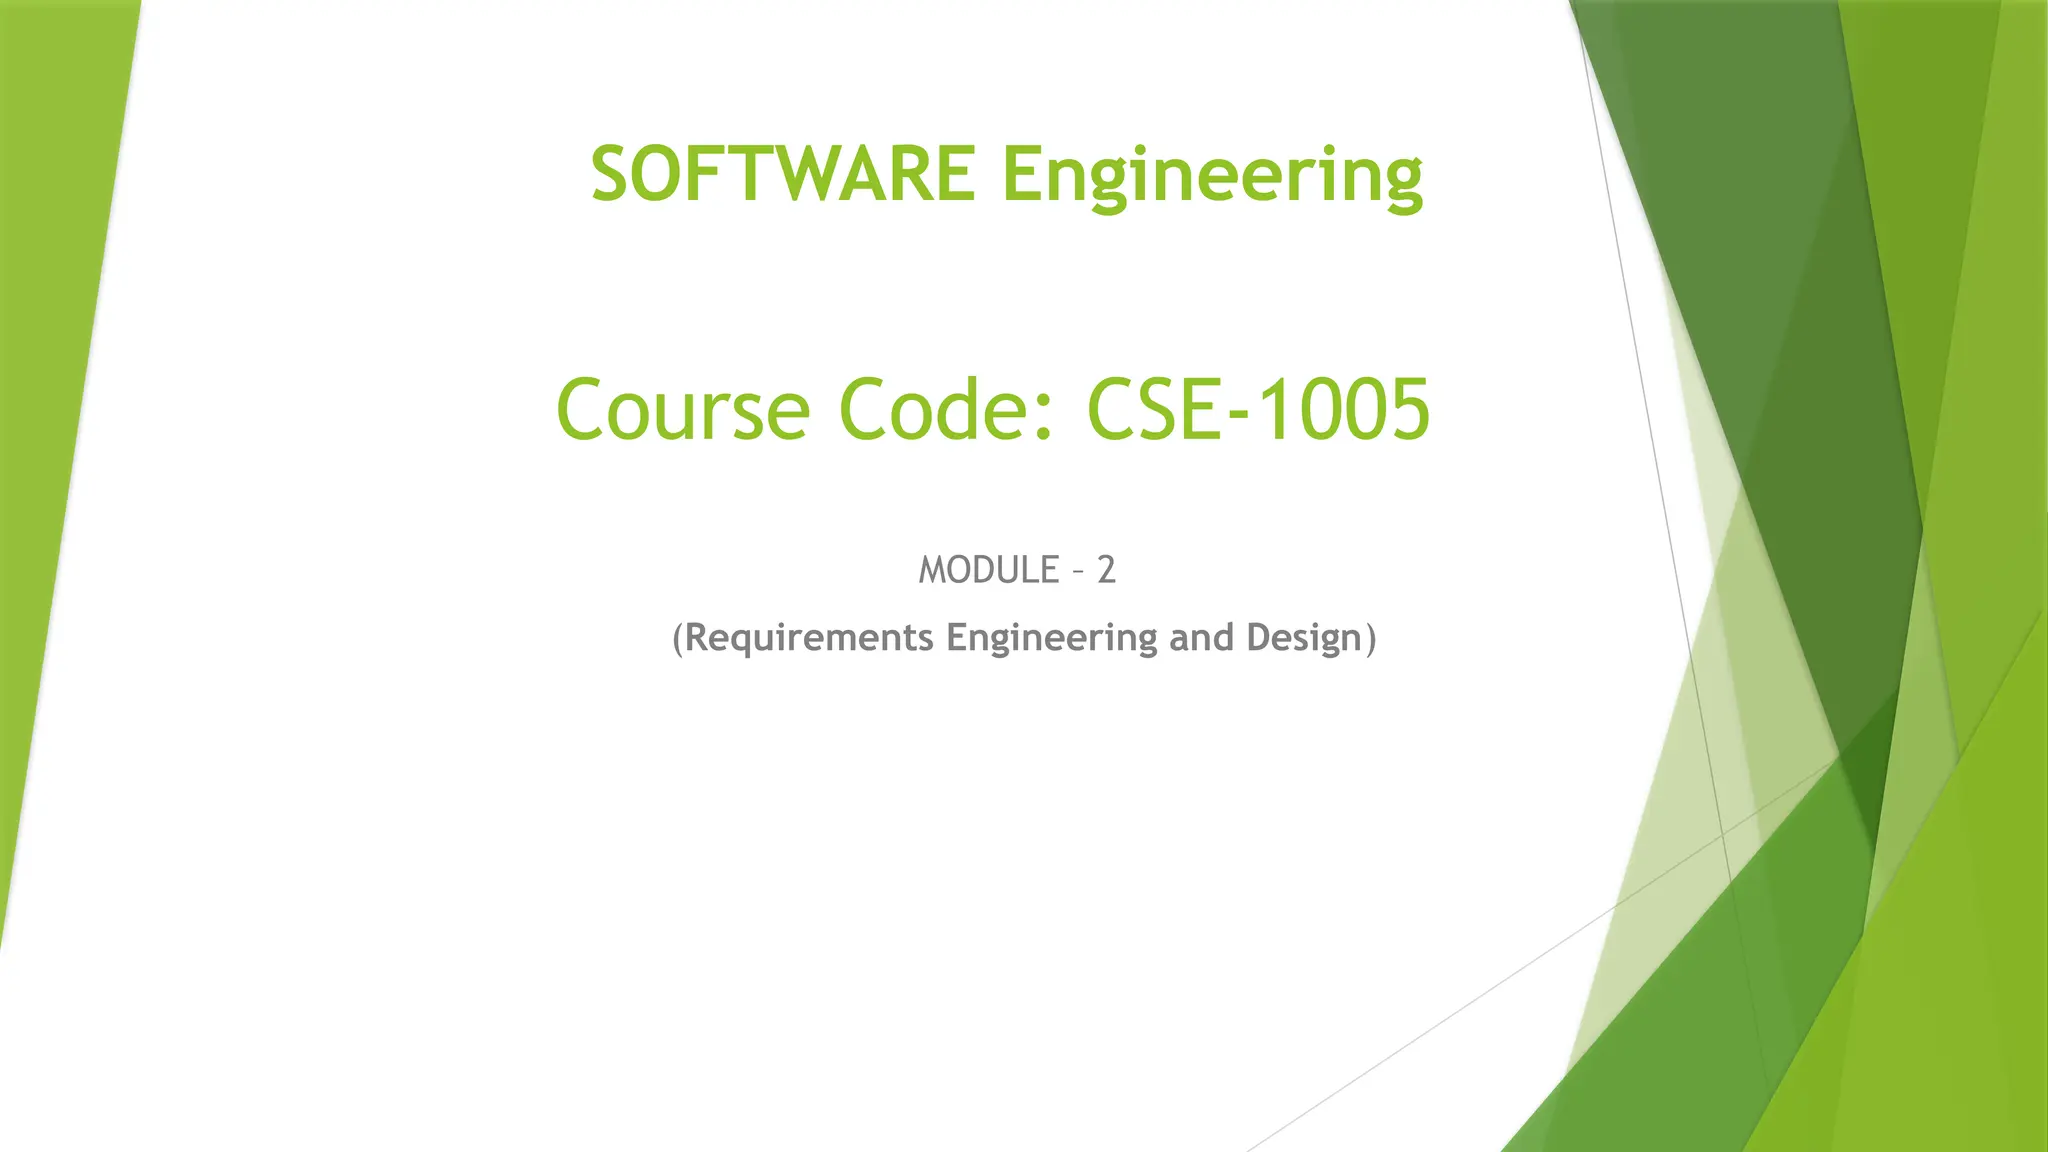
Agenda
Requirements:
Requirements Engineering,UML Model,
Developing Use Cases, Building the
Requirements Model, Negotiating
Requirements, Validating Requirements.
Design:
Design within the Context of Software
Engineering, Design Process, Design Concepts,
Design Model.
3.
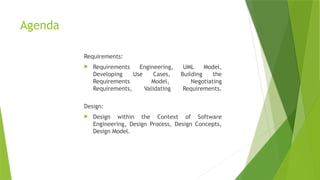
Requirements Engineering
Asystematic and strict approach to the definition, creation, and verification of
requirements for a software system is known as requirements engineering. To guarantee the
effective creation of a software product, the requirements engineering process entails
several tasks that help in understanding, recording, and managing the demands of
stakeholders.
4.
Requirements Engineering Process
Feasibility Study
Requirements elicitation
Requirements specification
Requirements for verification and validation
Requirements management
1. Feasibility Study
The feasibility study mainly concentrates on below five mentioned areas below. Among these Economic
Feasibility Study is the most important part of the feasibility analysis and the Legal Feasibility Study is less
considered feasibility analysis.
Technical Feasibility: In Technical Feasibility current resources both hardware software along required
technology are analyzed/assessed to develop the project. This technical feasibility study reports whether there
are correct required resources and technologies that will be used for project development. Along with this, the
feasibility study also analyzes the technical skills and capabilities of the technical team, whether existing
technology can be used or not, whether maintenance and up-gradation are easy or not for the chosen
technology, etc.
5.
Operational Feasibility:In Operational Feasibility degree of providing service to requirements is analyzed
along with how easy the product will be to operate and maintain after deployment. Along with this other
operational scopes are determining the usability of the product, Determining suggested solution by the
software development team is acceptable or not, etc.
Legal Feasibility: In legal feasibility, the project is ensured to comply with all relevant laws, regulations,
and standards. It identifies any legal constraints that could impact the project and reviews existing contracts
and agreements to assess their effect on the project’s execution. Additionally, legal feasibility considers
issues related to intellectual property, such as patents and copyrights, to safeguard the project’s
innovation and originality.
Schedule Feasibility: In schedule feasibility, the project timeline is evaluated to determine if it is realistic
and achievable. Significant milestones are identified, and deadlines are established to track progress
effectively. Resource availability is assessed to ensure that the necessary resources are accessible to meet
the project schedule. Furthermore, any time constraints that might affect project delivery are considered to
ensure timely completion. This focus on schedule feasibility is crucial for the successful planning and
execution of a project.
Economic Feasibility: In the Economic Feasibility study cost and benefit of the project are analyzed. This
means under this feasibility study a detailed analysis is carried out will be cost of the project for
development which includes all required costs for final development hardware and software resources
required, design and development costs operational costs, and so on. After that, it is analyzed whether the
project will be beneficial in terms of finance for the organization or not.
6.
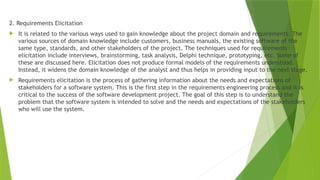
2. Requirements Elicitation
It is related to the various ways used to gain knowledge about the project domain and requirements. The
various sources of domain knowledge include customers, business manuals, the existing software of the
same type, standards, and other stakeholders of the project. The techniques used for requirements
elicitation include interviews, brainstorming, task analysis, Delphi technique, prototyping, etc. Some of
these are discussed here. Elicitation does not produce formal models of the requirements understood.
Instead, it widens the domain knowledge of the analyst and thus helps in providing input to the next stage.
Requirements elicitation is the process of gathering information about the needs and expectations of
stakeholders for a software system. This is the first step in the requirements engineering process and it is
critical to the success of the software development project. The goal of this step is to understand the
problem that the software system is intended to solve and the needs and expectations of the stakeholders
who will use the system.
7.
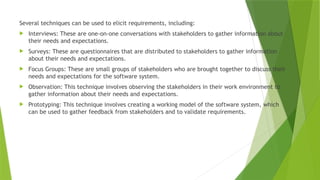
Several techniques canbe used to elicit requirements, including:
Interviews: These are one-on-one conversations with stakeholders to gather information about
their needs and expectations.
Surveys: These are questionnaires that are distributed to stakeholders to gather information
about their needs and expectations.
Focus Groups: These are small groups of stakeholders who are brought together to discuss their
needs and expectations for the software system.
Observation: This technique involves observing the stakeholders in their work environment to
gather information about their needs and expectations.
Prototyping: This technique involves creating a working model of the software system, which
can be used to gather feedback from stakeholders and to validate requirements.
8.
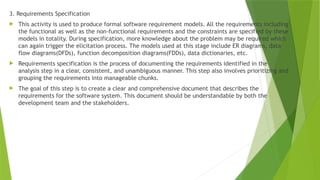
3. Requirements Specification
This activity is used to produce formal software requirement models. All the requirements including
the functional as well as the non-functional requirements and the constraints are specified by these
models in totality. During specification, more knowledge about the problem may be required which
can again trigger the elicitation process. The models used at this stage include ER diagrams, data
flow diagrams(DFDs), function decomposition diagrams(FDDs), data dictionaries, etc.
Requirements specification is the process of documenting the requirements identified in the
analysis step in a clear, consistent, and unambiguous manner. This step also involves prioritizing and
grouping the requirements into manageable chunks.
The goal of this step is to create a clear and comprehensive document that describes the
requirements for the software system. This document should be understandable by both the
development team and the stakeholders.
9.
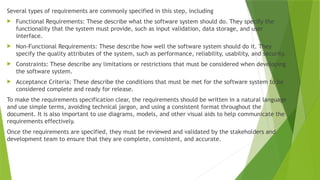
Several types ofrequirements are commonly specified in this step, including
Functional Requirements: These describe what the software system should do. They specify the
functionality that the system must provide, such as input validation, data storage, and user
interface.
Non-Functional Requirements: These describe how well the software system should do it. They
specify the quality attributes of the system, such as performance, reliability, usability, and security.
Constraints: These describe any limitations or restrictions that must be considered when developing
the software system.
Acceptance Criteria: These describe the conditions that must be met for the software system to be
considered complete and ready for release.
To make the requirements specification clear, the requirements should be written in a natural language
and use simple terms, avoiding technical jargon, and using a consistent format throughout the
document. It is also important to use diagrams, models, and other visual aids to help communicate the
requirements effectively.
Once the requirements are specified, they must be reviewed and validated by the stakeholders and
development team to ensure that they are complete, consistent, and accurate.
10.
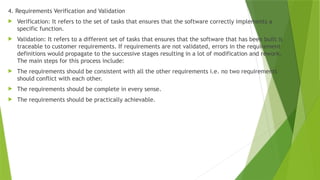
4. Requirements Verificationand Validation
Verification: It refers to the set of tasks that ensures that the software correctly implements a
specific function.
Validation: It refers to a different set of tasks that ensures that the software that has been built is
traceable to customer requirements. If requirements are not validated, errors in the requirement
definitions would propagate to the successive stages resulting in a lot of modification and rework.
The main steps for this process include:
The requirements should be consistent with all the other requirements i.e. no two requirements
should conflict with each other.
The requirements should be complete in every sense.
The requirements should be practically achievable.
11.
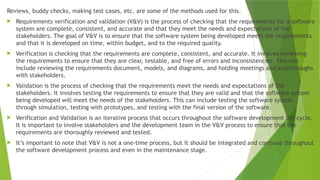
Reviews, buddy checks,making test cases, etc. are some of the methods used for this.
Requirements verification and validation (V&V) is the process of checking that the requirements for a software
system are complete, consistent, and accurate and that they meet the needs and expectations of the
stakeholders. The goal of V&V is to ensure that the software system being developed meets the requirements
and that it is developed on time, within budget, and to the required quality.
Verification is checking that the requirements are complete, consistent, and accurate. It involves reviewing
the requirements to ensure that they are clear, testable, and free of errors and inconsistencies. This can
include reviewing the requirements document, models, and diagrams, and holding meetings and walkthroughs
with stakeholders.
Validation is the process of checking that the requirements meet the needs and expectations of the
stakeholders. It involves testing the requirements to ensure that they are valid and that the software system
being developed will meet the needs of the stakeholders. This can include testing the software system
through simulation, testing with prototypes, and testing with the final version of the software.
Verification and Validation is an iterative process that occurs throughout the software development life cycle.
It is important to involve stakeholders and the development team in the V&V process to ensure that the
requirements are thoroughly reviewed and tested.
It’s important to note that V&V is not a one-time process, but it should be integrated and continue throughout
the software development process and even in the maintenance stage.
12.
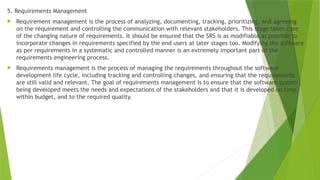
5. Requirements Management
Requirement management is the process of analyzing, documenting, tracking, prioritizing, and agreeing
on the requirement and controlling the communication with relevant stakeholders. This stage takes care
of the changing nature of requirements. It should be ensured that the SRS is as modifiable as possible to
incorporate changes in requirements specified by the end users at later stages too. Modifying the software
as per requirements in a systematic and controlled manner is an extremely important part of the
requirements engineering process.
Requirements management is the process of managing the requirements throughout the software
development life cycle, including tracking and controlling changes, and ensuring that the requirements
are still valid and relevant. The goal of requirements management is to ensure that the software system
being developed meets the needs and expectations of the stakeholders and that it is developed on time,
within budget, and to the required quality.
13.
Several key activitiesare involved in requirements management, including:
Tracking and controlling changes: This involves monitoring and controlling changes to the requirements
throughout the development process, including identifying the source of the change, assessing the impact of
the change, and approving or rejecting the change.
Version control: This involves keeping track of different versions of the requirements document and other
related artifacts.
Traceability: This involves linking the requirements to other elements of the development process, such as
design, testing, and validation.
Communication: This involves ensuring that the requirements are communicated effectively to all
stakeholders and that any changes or issues are addressed promptly.
Monitoring and reporting: This involves monitoring the progress of the development process and reporting on
the status of the requirements.
Requirements management is a critical step in the software development life cycle as it helps to ensure that
the software system being developed meets the needs and expectations of stakeholders and that it is
developed on time, within budget, and to the required quality. It also helps to prevent scope creep and to
ensure that the requirements are aligned with the project goals.
14.
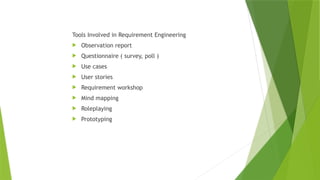
Tools Involved inRequirement Engineering
Observation report
Questionnaire ( survey, poll )
Use cases
User stories
Requirement workshop
Mind mapping
Roleplaying
Prototyping
15.
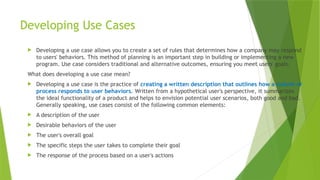
Developing Use Cases
Developing a use case allows you to create a set of rules that determines how a company may respond
to users' behaviors. This method of planning is an important step in building or implementing a new
program. Use case considers traditional and alternative outcomes, ensuring you meet users' goals.
What does developing a use case mean?
Developing a use case is the practice of creating a written description that outlines how a system or
process responds to user behaviors. Written from a hypothetical user's perspective, it summarizes
the ideal functionality of a product and helps to envision potential user scenarios, both good and bad.
Generally speaking, use cases consist of the following common elements:
A description of the user
Desirable behaviors of the user
The user's overall goal
The specific steps the user takes to complete their goal
The response of the process based on a user's actions
16.
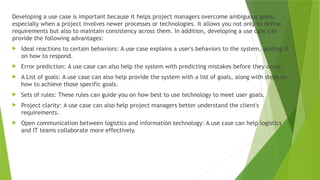
Developing a usecase is important because it helps project managers overcome ambiguous goals,
especially when a project involves newer processes or technologies. It allows you not only to define
requirements but also to maintain consistency across them. In addition, developing a use case can
provide the following advantages:
Ideal reactions to certain behaviors: A use case explains a user's behaviors to the system, guiding it
on how to respond.
Error prediction: A use case can also help the system with predicting mistakes before they occur.
A List of goals: A use case can also help provide the system with a list of goals, along with steps on
how to achieve those specific goals.
Sets of rules: These rules can guide you on how best to use technology to meet user goals.
Project clarity: A use case can also help project managers better understand the client's
requirements.
Open communication between logistics and information technology: A use case can help logistics
and IT teams collaborate more effectively.
17.
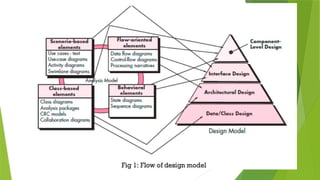
Building the Requirements
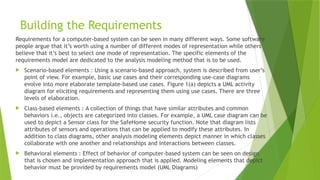
Requirementsfor a computer-based system can be seen in many different ways. Some software
people argue that it’s worth using a number of different modes of representation while others
believe that it’s best to select one mode of representation. The specific elements of the
requirements model are dedicated to the analysis modeling method that is to be used.
Scenario-based elements : Using a scenario-based approach, system is described from user’s
point of view. For example, basic use cases and their corresponding use-case diagrams
evolve into more elaborate template-based use cases. Figure 1(a) depicts a UML activity
diagram for eliciting requirements and representing them using use cases. There are three
levels of elaboration.
Class-based elements : A collection of things that have similar attributes and common
behaviors i.e., objects are categorized into classes. For example, a UML case diagram can be
used to depict a Sensor class for the SafeHome security function. Note that diagram lists
attributes of sensors and operations that can be applied to modify these attributes. In
addition to class diagrams, other analysis modeling elements depict manner in which classes
collaborate with one another and relationships and interactions between classes.
Behavioral elements : Effect of behavior of computer-based system can be seen on design
that is chosen and implementation approach that is applied. Modeling elements that depict
behavior must be provided by requirements model (UML Diagrams)
18.
Negotiating Requirements
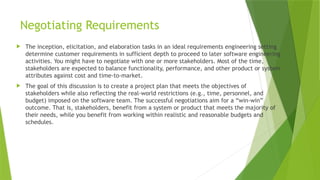
Theinception, elicitation, and elaboration tasks in an ideal requirements engineering setting
determine customer requirements in sufficient depth to proceed to later software engineering
activities. You might have to negotiate with one or more stakeholders. Most of the time,
stakeholders are expected to balance functionality, performance, and other product or system
attributes against cost and time-to-market.
The goal of this discussion is to create a project plan that meets the objectives of
stakeholders while also reflecting the real-world restrictions (e.g., time, personnel, and
budget) imposed on the software team. The successful negotiations aim for a “win-win”
outcome. That is, stakeholders, benefit from a system or product that meets the majority of
their needs, while you benefit from working within realistic and reasonable budgets and
schedules.
19.
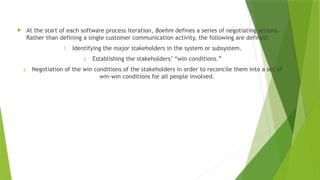
At thestart of each software process iteration, Boehm defines a series of negotiating actions.
Rather than defining a single customer communication activity, the following are defined:
1. Identifying the major stakeholders in the system or subsystem.
2. Establishing the stakeholders’ “win conditions.”
3. Negotiation of the win conditions of the stakeholders in order to reconcile them into a set of
win-win conditions for all people involved.
20.
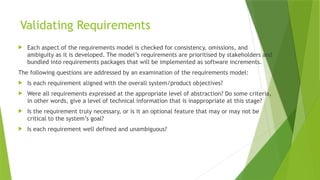
Validating Requirements
Eachaspect of the requirements model is checked for consistency, omissions, and
ambiguity as it is developed. The model’s requirements are prioritised by stakeholders and
bundled into requirements packages that will be implemented as software increments.
The following questions are addressed by an examination of the requirements model:
Is each requirement aligned with the overall system/product objectives?
Were all requirements expressed at the appropriate level of abstraction? Do some criteria,
in other words, give a level of technical information that is inappropriate at this stage?
Is the requirement truly necessary, or is it an optional feature that may or may not be
critical to the system’s goal?
Is each requirement well defined and unambiguous?
21.
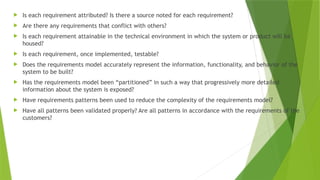
Is eachrequirement attributed? Is there a source noted for each requirement?
Are there any requirements that conflict with others?
Is each requirement attainable in the technical environment in which the system or product will be
housed?
Is each requirement, once implemented, testable?
Does the requirements model accurately represent the information, functionality, and behavior of the
system to be built?
Has the requirements model been “partitioned” in such a way that progressively more detailed
information about the system is exposed?
Have requirements patterns been used to reduce the complexity of the requirements model?
Have all patterns been validated properly? Are all patterns in accordance with the requirements of the
customers?
22.
UML
Unified ModelingLanguage (UML) is a general-purpose modeling language. The main aim of UML is
to define a standard way to visualize the way a system has been designed. It is quite similar to
blueprints used in other fields of engineering. UML is not a programming language , it is rather a
visual language.
Unified Modeling Language (UML) is a standardized visual modeling language used in the field of
software engineering to provide a general-purpose, developmental, and intuitive way to visualize
the design of a system. UML helps in specifying, visualizing, constructing, and documenting the
artifacts of software systems.
We use UML diagrams to portray the behavior and structure of a system.
UML helps software engineers, businessmen, and system architects with modeling, design, and
analysis.
The Object Management Group (OMG) adopted Unified Modelling Language as a standard in 1997.
It’s been managed by OMG ever since.
The International Organization for Standardization (ISO) published UML as an approved standard in
2005. UML has been revised over the years and is reviewed periodically.
23.
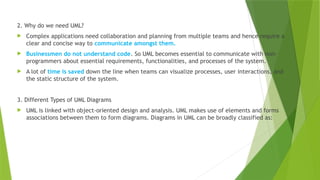
2. Why dowe need UML?
Complex applications need collaboration and planning from multiple teams and hence require a
clear and concise way to communicate amongst them.
Businessmen do not understand code. So UML becomes essential to communicate with non-
programmers about essential requirements, functionalities, and processes of the system.
A lot of time is saved down the line when teams can visualize processes, user interactions, and
the static structure of the system.
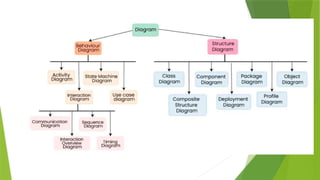
3. Different Types of UML Diagrams
UML is linked with object-oriented design and analysis. UML makes use of elements and forms
associations between them to form diagrams. Diagrams in UML can be broadly classified as:
25.
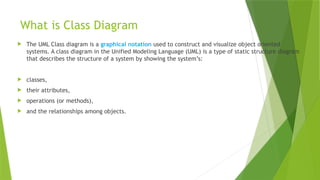
What is ClassDiagram
The UML Class diagram is a graphical notation used to construct and visualize object oriented
systems. A class diagram in the Unified Modeling Language (UML) is a type of static structure diagram
that describes the structure of a system by showing the system’s:
classes,
their attributes,
operations (or methods),
and the relationships among objects.
26.
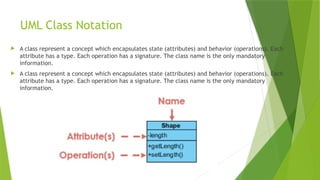
UML Class Notation
A class represent a concept which encapsulates state (attributes) and behavior (operations). Each
attribute has a type. Each operation has a signature. The class name is the only mandatory
information.
A class represent a concept which encapsulates state (attributes) and behavior (operations). Each
attribute has a type. Each operation has a signature. The class name is the only mandatory
information.
27.
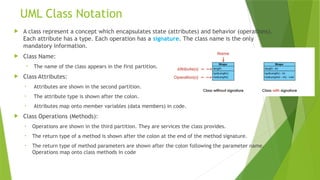
UML Class Notation
A class represent a concept which encapsulates state (attributes) and behavior (operations).
Each attribute has a type. Each operation has a signature. The class name is the only
mandatory information.
Class Name:
• The name of the class appears in the first partition.
Class Attributes:
• Attributes are shown in the second partition.
• The attribute type is shown after the colon.
• Attributes map onto member variables (data members) in code.
Class Operations (Methods):
• Operations are shown in the third partition. They are services the class provides.
• The return type of a method is shown after the colon at the end of the method signature.
• The return type of method parameters are shown after the colon following the parameter name.
Operations map onto class methods in code
28.
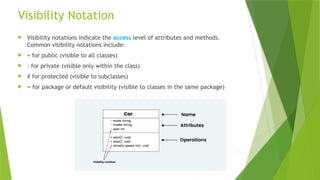
Visibility Notation
Visibilitynotations indicate the access level of attributes and methods.
Common visibility notations include:
+ for public (visible to all classes)
- for private (visible only within the class)
# for protected (visible to subclasses)
~ for package or default visibility (visible to classes in the same package)
29.
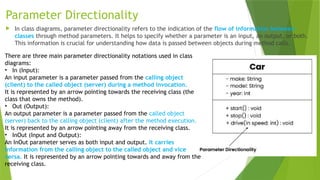
Parameter Directionality
Inclass diagrams, parameter directionality refers to the indication of the flow of information between
classes through method parameters. It helps to specify whether a parameter is an input, an output, or both.
This information is crucial for understanding how data is passed between objects during method calls.
There are three main parameter directionality notations used in class
diagrams:
• In (Input):
An input parameter is a parameter passed from the calling object
(client) to the called object (server) during a method invocation.
It is represented by an arrow pointing towards the receiving class (the
class that owns the method).
• Out (Output):
An output parameter is a parameter passed from the called object
(server) back to the calling object (client) after the method execution.
It is represented by an arrow pointing away from the receiving class.
• InOut (Input and Output):
An InOut parameter serves as both input and output. It carries
information from the calling object to the called object and vice
versa. It is represented by an arrow pointing towards and away from the
receiving class.
30.
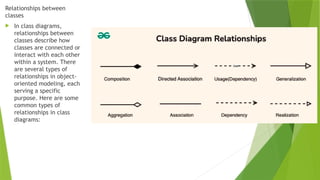
Relationships between
classes
Inclass diagrams,
relationships between
classes describe how
classes are connected or
interact with each other
within a system. There
are several types of
relationships in object-
oriented modeling, each
serving a specific
purpose. Here are some
common types of
relationships in class
diagrams:
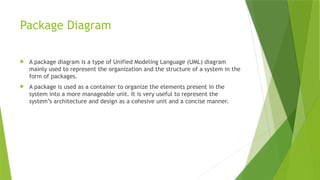
Package Diagram
Apackage diagram is a type of Unified Modeling Language (UML) diagram
mainly used to represent the organization and the structure of a system in the
form of packages.
A package is used as a container to organize the elements present in the
system into a more manageable unit. It is very useful to represent the
system’s architecture and design as a cohesive unit and a concise manner.
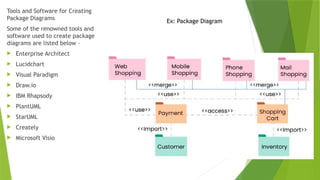
Tools and Softwarefor Creating
Package Diagrams
Some of the renowned tools and
software used to create package
diagrams are listed below –
Enterprise Architect
Lucidchart
Visual Paradigm
Draw.io
IBM Rhapsody
PlantUML
StarUML
Creately
Microsoft Visio
Ex: Package Diagram
35.
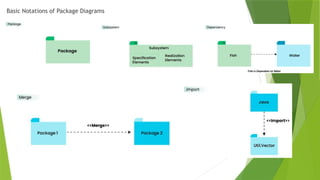
Package: Thisbasic building block of the Package Diagram is a Package. It is a container for organizing different
diagram elements such as classes, interfaces, etc. It is represented in the Diagram in a folder-like icon with its
name.
NameSpace: It represents the package’s name in the diagram. It generally appears on top of the package symbol
which helps to uniquely identify the package in the diagram.
Package Merge: It is a relationship that signifies how a package can be merged or combined. It is represented as
a direct arrow between two packages. Signifying that the contents of one package can be merged with the
contents of the other.
Package Import: It is another relationship that shows one package’s access to the contents of a different
package. It is represented as a Dashed Arrow.
Dependency: Dependencies are used to show that there might be some element or package that can be
dependent upon any other element or package, meaning that changing anything of that package will result in
alteration of the contents of the other package which is dependent upon the first one.
Element: An element can be a single unit inside of a package, it can be a class, an interface or subsystems. This
packages are connected and reside inside of packages that hold them.
For example, if we consider a Class, then there can be many functions inside it and many variables or subclass
can also be present, all of these are considered as an Element of that Class and they are connected with the
Main Class, without the existence of the main class, they will also not exist or have no relevance.
Constraint: It is like a condition or requirement set related to a package. It is represented by curly braces.
36.
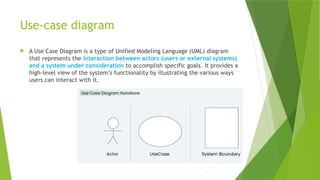
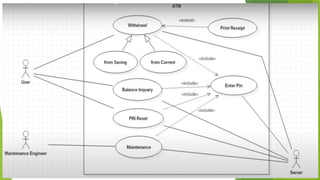
Use-case diagram
AUse Case Diagram is a type of Unified Modeling Language (UML) diagram
that represents the interaction between actors (users or external systems)
and a system under consideration to accomplish specific goals. It provides a
high-level view of the system’s functionality by illustrating the various ways
users can interact with it.
37.
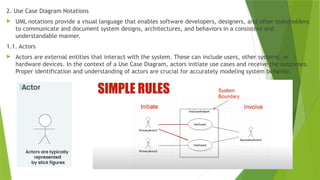
2. Use CaseDiagram Notations
UML notations provide a visual language that enables software developers, designers, and other stakeholders
to communicate and document system designs, architectures, and behaviors in a consistent and
understandable manner.
1.1. Actors
Actors are external entities that interact with the system. These can include users, other systems, or
hardware devices. In the context of a Use Case Diagram, actors initiate use cases and receive the outcomes.
Proper identification and understanding of actors are crucial for accurately modeling system behavior.
38.
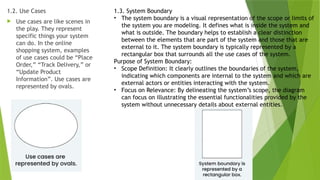
1.2. Use Cases
Use cases are like scenes in
the play. They represent
specific things your system
can do. In the online
shopping system, examples
of use cases could be “Place
Order,” “Track Delivery,” or
“Update Product
Information”. Use cases are
represented by ovals.
1.3. System Boundary
• The system boundary is a visual representation of the scope or limits of
the system you are modeling. It defines what is inside the system and
what is outside. The boundary helps to establish a clear distinction
between the elements that are part of the system and those that are
external to it. The system boundary is typically represented by a
rectangular box that surrounds all the use cases of the system.
Purpose of System Boundary:
• Scope Definition: It clearly outlines the boundaries of the system,
indicating which components are internal to the system and which are
external actors or entities interacting with the system.
• Focus on Relevance: By delineating the system’s scope, the diagram
can focus on illustrating the essential functionalities provided by the
system without unnecessary details about external entities.
41.
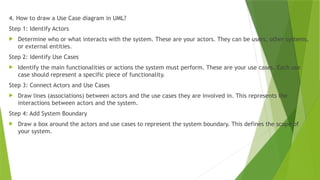
4. How todraw a Use Case diagram in UML?
Step 1: Identify Actors
Determine who or what interacts with the system. These are your actors. They can be users, other systems,
or external entities.
Step 2: Identify Use Cases
Identify the main functionalities or actions the system must perform. These are your use cases. Each use
case should represent a specific piece of functionality.
Step 3: Connect Actors and Use Cases
Draw lines (associations) between actors and the use cases they are involved in. This represents the
interactions between actors and the system.
Step 4: Add System Boundary
Draw a box around the actors and use cases to represent the system boundary. This defines the scope of
your system.
42.
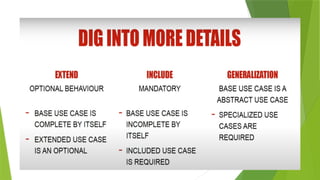
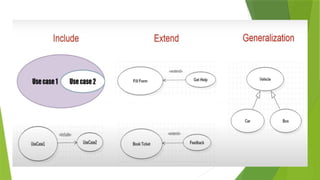
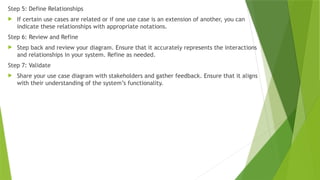
Step 5: DefineRelationships
If certain use cases are related or if one use case is an extension of another, you can
indicate these relationships with appropriate notations.
Step 6: Review and Refine
Step back and review your diagram. Ensure that it accurately represents the interactions
and relationships in your system. Refine as needed.
Step 7: Validate
Share your use case diagram with stakeholders and gather feedback. Ensure that it aligns
with their understanding of the system’s functionality.
43.
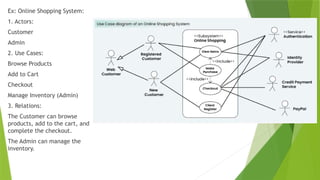
Ex: Online ShoppingSystem:
1. Actors:
Customer
Admin
2. Use Cases:
Browse Products
Add to Cart
Checkout
Manage Inventory (Admin)
3. Relations:
The Customer can browse
products, add to the cart, and
complete the checkout.
The Admin can manage the
inventory.
45.
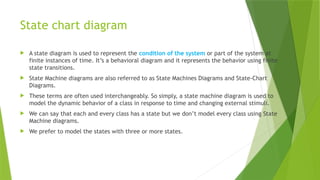
State chart diagram
A state diagram is used to represent the condition of the system or part of the system at
finite instances of time. It’s a behavioral diagram and it represents the behavior using finite
state transitions.
State Machine diagrams are also referred to as State Machines Diagrams and State-Chart
Diagrams.
These terms are often used interchangeably. So simply, a state machine diagram is used to
model the dynamic behavior of a class in response to time and changing external stimuli.
We can say that each and every class has a state but we don’t model every class using State
Machine diagrams.
We prefer to model the states with three or more states.
46.
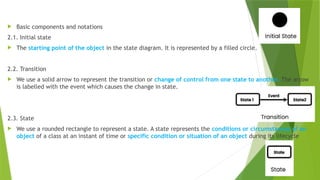
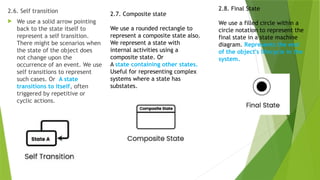
Basic componentsand notations
2.1. Initial state
The starting point of the object in the state diagram. It is represented by a filled circle.
2.2. Transition
We use a solid arrow to represent the transition or change of control from one state to another. The arrow
is labelled with the event which causes the change in state.
2.3. State
We use a rounded rectangle to represent a state. A state represents the conditions or circumstances of an
object of a class at an instant of time or specific condition or situation of an object during its lifecycle
47.
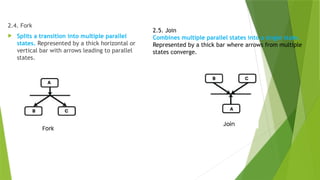
2.4. Fork
Splitsa transition into multiple parallel
states. Represented by a thick horizontal or
vertical bar with arrows leading to parallel
states.
2.5. Join
Combines multiple parallel states into a single state.
Represented by a thick bar where arrows from multiple
states converge.
48.
2.6. Self transition
We use a solid arrow pointing
back to the state itself to
represent a self transition.
There might be scenarios when
the state of the object does
not change upon the
occurrence of an event. We use
self transitions to represent
such cases. Or A state
transitions to itself, often
triggered by repetitive or
cyclic actions.
2.7. Composite state
We use a rounded rectangle to
represent a composite state also.
We represent a state with
internal activities using a
composite state. Or
A state containing other states.
Useful for representing complex
systems where a state has
substates.
2.8. Final State
We use a filled circle within a
circle notation to represent the
final state in a state machine
diagram. Represents the end
of the object's lifecycle in the
system.
49.
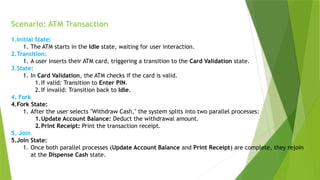
Scenario: ATM Transaction
1.InitialState:
1. The ATM starts in the Idle state, waiting for user interaction.
2.Transition:
1. A user inserts their ATM card, triggering a transition to the Card Validation state.
3.State:
1. In Card Validation, the ATM checks if the card is valid.
1.If valid: Transition to Enter PIN.
2.If invalid: Transition back to Idle.
4. Fork
4.Fork State:
1. After the user selects "Withdraw Cash," the system splits into two parallel processes:
1.Update Account Balance: Deduct the withdrawal amount.
2.Print Receipt: Print the transaction receipt.
5. Join
5.Join State:
1. Once both parallel processes (Update Account Balance and Print Receipt) are complete, they rejoin
at the Dispense Cash state.
50.
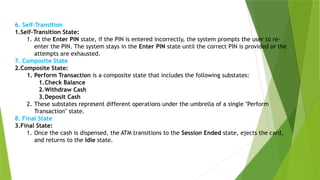
6. Self-Transition
1.Self-Transition State:
1.At the Enter PIN state, if the PIN is entered incorrectly, the system prompts the user to re-
enter the PIN. The system stays in the Enter PIN state until the correct PIN is provided or the
attempts are exhausted.
7. Composite State
2.Composite State:
1. Perform Transaction is a composite state that includes the following substates:
1.Check Balance
2.Withdraw Cash
3.Deposit Cash
2. These substates represent different operations under the umbrella of a single "Perform
Transaction" state.
8. Final State
3.Final State:
1. Once the cash is dispensed, the ATM transitions to the Session Ended state, ejects the card,
and returns to the Idle state.
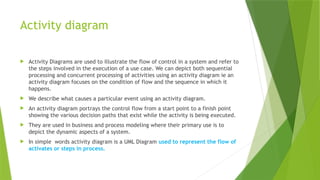
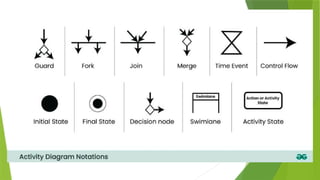
Activity diagram
ActivityDiagrams are used to illustrate the flow of control in a system and refer to
the steps involved in the execution of a use case. We can depict both sequential
processing and concurrent processing of activities using an activity diagram ie an
activity diagram focuses on the condition of flow and the sequence in which it
happens.
We describe what causes a particular event using an activity diagram.
An activity diagram portrays the control flow from a start point to a finish point
showing the various decision paths that exist while the activity is being executed.
They are used in business and process modeling where their primary use is to
depict the dynamic aspects of a system.
In simple words activity diagram is a UML Diagram used to represent the flow of
activates or steps in process.
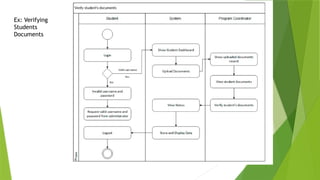
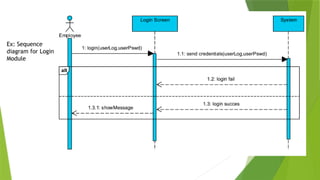
Interaction diagram
Fromthe term Interaction, it is clear that the diagram is used to describe
some type of interactions among the different elements in the model. This
interaction is a part of dynamic behavior of the system.
This interactive behavior is represented in UML by two diagrams known
as Sequence diagram and Collaboration diagram. The basic purpose of both
the diagrams are similar.
Sequence diagram emphasizes on time sequence of messages and
collaboration diagram emphasizes on the structural organization of the
objects that send and receive messages.
58.
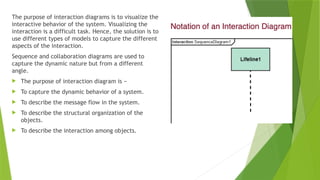
The purpose ofinteraction diagrams is to visualize the
interactive behavior of the system. Visualizing the
interaction is a difficult task. Hence, the solution is to
use different types of models to capture the different
aspects of the interaction.
Sequence and collaboration diagrams are used to
capture the dynamic nature but from a different
angle.
The purpose of interaction diagram is −
To capture the dynamic behavior of a system.
To describe the message flow in the system.
To describe the structural organization of the
objects.
To describe the interaction among objects.
59.
Following are somethings that are needed to follow while drawing sequence diagram:
A total no of lifeline which will take part in the communication.
The sequence of the message flow among several entities within the system.
No operators used to ease out the functionality of the diagram.
Several distinct messages that depict the interactions in a precise and clear way.
The organization and structure of a system.
The order of the sequence of the flow of messages.
Total no of time constructs of an object.
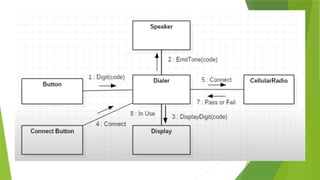
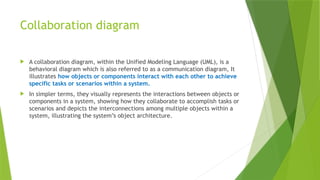
Collaboration diagram
Acollaboration diagram, within the Unified Modeling Language (UML), is a
behavioral diagram which is also referred to as a communication diagram, It
illustrates how objects or components interact with each other to achieve
specific tasks or scenarios within a system.
In simpler terms, they visually represents the interactions between objects or
components in a system, showing how they collaborate to accomplish tasks or
scenarios and depicts the interconnections among multiple objects within a
system, illustrating the system’s object architecture.
63.
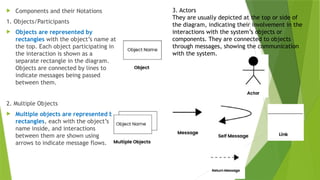
Importance of CollaborationDiagrams
Collaboration diagrams play a crucial role in system development by facilitating understanding,
communication, design, analysis, and documentation of the system’s architecture and behavior.
1) Visualizing Interactions:
These diagrams offer a clear visual representation of how objects or components interact within a system.
This visualization aids stakeholders in comprehending the flow of data and control, fostering easier
understanding.
2) Understanding System Behavior:
By depicting interactions, collaboration diagrams provide insights into the system’s dynamic behavior during
operation.
Understanding this behavior is crucial for identifying potential issues, optimizing performance, and ensuring
the system functions as intended.
3) Facilitating Communication:
Collaboration diagrams serve as effective communication tools among team members.
They facilitate discussions, enabling refinement of the system’s design, architecture, and functionality.
Clearer communication fosters better collaboration and alignment.
64.
4) Supporting Designand Analysis:
These diagrams assist in designing and analyzing system architecture and functionality.
They help identify objects, their relationships, and message exchanges, which is vital for creating
efficient and scalable systems.
5) Documentation Purposes:
Collaboration diagrams serve as valuable documentation assets for the system.
They offer a visual representation of the system’s architecture and behavior, serving as a reference
for developers, testers, and other stakeholders throughout the development process.
65.
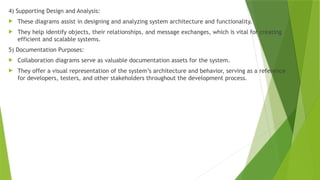
Components andtheir Notations
1. Objects/Participants
Objects are represented by
rectangles with the object’s name at
the top. Each object participating in
the interaction is shown as a
separate rectangle in the diagram.
Objects are connected by lines to
indicate messages being passed
between them.
2. Multiple Objects
Multiple objects are represented by
rectangles, each with the object’s
name inside, and interactions
between them are shown using
arrows to indicate message flows.
3. Actors
They are usually depicted at the top or side of
the diagram, indicating their involvement in the
interactions with the system’s objects or
components. They are connected to objects
through messages, showing the communication
with the system.
67.
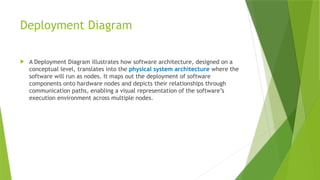
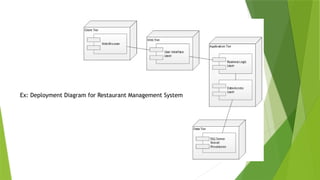
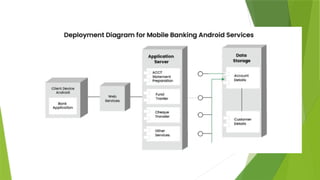
Deployment Diagram
ADeployment Diagram illustrates how software architecture, designed on a
conceptual level, translates into the physical system architecture where the
software will run as nodes. It maps out the deployment of software
components onto hardware nodes and depicts their relationships through
communication paths, enabling a visual representation of the software’s
execution environment across multiple nodes.
68.
Key elements ofa Deployment Diagram
1. Nodes
These represent the physical hardware entities where software components are
deployed, such as servers, workstations, routers, etc.
2. Components
Represent software modules or artifacts that are deployed onto nodes,
including executable files, libraries, databases, and configuration files.
3. Artifacts
Physical files deployed onto nodes, embodying the actual implementation of
software components, such as executables, scripts, databases, etc.
4. Dependencies
Reflect relationships or connections between nodes and components, indicating
communication paths, deployment constraints, or other dependencies.
5. Associations
Show relationships between nodes and components, signifying that a
component is deployed on a particular node, thus mapping software
components to physical nodes.
6. Deployment Specification
Describes the configuration and properties of nodes and components,
encompassing hardware specifications, software configurations, communication
protocols, etc.
7. Communication Paths
Represent channels or connections facilitating communication between nodes
and components, including network connections, communication protocols,
etc.
Notations
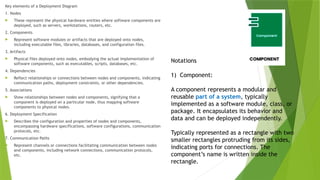
1) Component:
A component represents a modular and
reusable part of a system, typically
implemented as a software module, class, or
package. It encapsulates its behavior and
data and can be deployed independently.
Typically represented as a rectangle with two
smaller rectangles protruding from its sides,
indicating ports for connections. The
component’s name is written inside the
rectangle.
69.
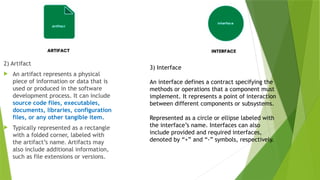
2) Artifact
Anartifact represents a physical
piece of information or data that is
used or produced in the software
development process. It can include
source code files, executables,
documents, libraries, configuration
files, or any other tangible item.
Typically represented as a rectangle
with a folded corner, labeled with
the artifact’s name. Artifacts may
also include additional information,
such as file extensions or versions.
3) Interface
An interface defines a contract specifying the
methods or operations that a component must
implement. It represents a point of interaction
between different components or subsystems.
Represented as a circle or ellipse labeled with
the interface’s name. Interfaces can also
include provided and required interfaces,
denoted by “+” and “-” symbols, respectively.
70.
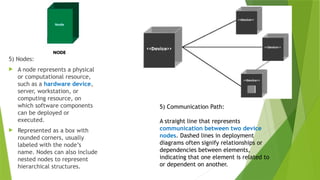
5) Nodes:
Anode represents a physical
or computational resource,
such as a hardware device,
server, workstation, or
computing resource, on
which software components
can be deployed or
executed.
Represented as a box with
rounded corners, usually
labeled with the node’s
name. Nodes can also include
nested nodes to represent
hierarchical structures.
5) Communication Path:
A straight line that represents
communication between two device
nodes. Dashed lines in deployment
diagrams often signify relationships or
dependencies between elements,
indicating that one element is related to
or dependent on another.
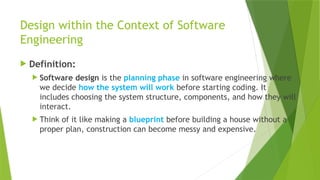
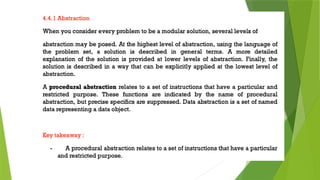
Design within theContext of Software
Engineering
Definition:
Software design is the planning phase in software engineering where
we decide how the system will work before starting coding. It
includes choosing the system structure, components, and how they will
interact.
Think of it like making a blueprint before building a house without a
proper plan, construction can become messy and expensive.
75.
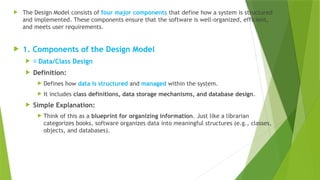
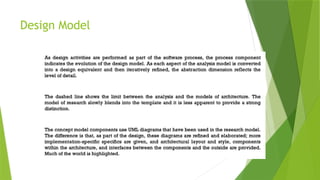
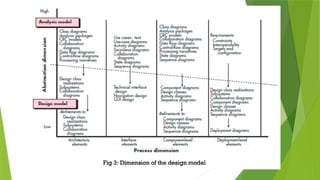
The DesignModel consists of four major components that define how a system is structured
and implemented. These components ensure that the software is well-organized, efficient,
and meets user requirements.
1. Components of the Design Model
📌 Data/Class Design
Definition:
Defines how data is structured and managed within the system.
It includes class definitions, data storage mechanisms, and database design.
Simple Explanation:
Think of this as a blueprint for organizing information. Just like a librarian
categorizes books, software organizes data into meaningful structures (e.g., classes,
objects, and databases).
76.
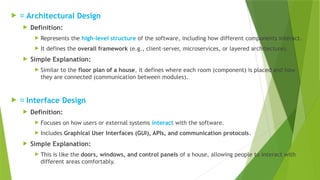
📌 ArchitecturalDesign
Definition:
Represents the high-level structure of the software, including how different components interact.
It defines the overall framework (e.g., client-server, microservices, or layered architecture).
Simple Explanation:
Similar to the floor plan of a house, it defines where each room (component) is placed and how
they are connected (communication between modules).
📌 Interface Design
Definition:
Focuses on how users or external systems interact with the software.
Includes Graphical User Interfaces (GUI), APIs, and communication protocols.
Simple Explanation:
This is like the doors, windows, and control panels of a house, allowing people to interact with
different areas comfortably.
77.
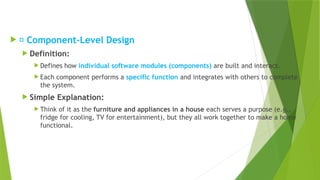
📌 Component-LevelDesign
Definition:
Defines how individual software modules (components) are built and interact.
Each component performs a specific function and integrates with others to complete
the system.
Simple Explanation:
Think of it as the furniture and appliances in a house each serves a purpose (e.g.,
fridge for cooling, TV for entertainment), but they all work together to make a home
functional.