
Recommended
Recommended
More Related Content
Viewers also liked
Viewers also liked (17)
Similar to Crustacean Survey Presentation 2015
Similar to Crustacean Survey Presentation 2015 (6)
Crustacean Survey Presentation 2015
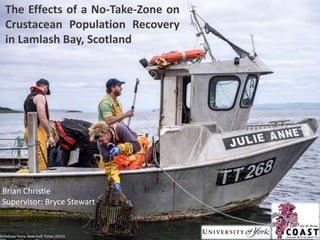
- 1. The Effects of a No-Take-Zone on Crustacean Population Recovery in Lamlash Bay, Scotland ©Andrew Testa, New York Times (2015) Brian Christie Supervisor: Bryce Stewart
- 2. © Scottish Fishermen’s Federation (2013)© Paul Kay © Howard Wood
- 3. • Severely degraded marine environment (Howarth et al., 2013) • Pelagic & groundfish stocks collapsed by early 21st Century (Thurstan and Roberts, 2010) • Prawn trawling & scallop dredging now dominant (McIntyre et al., 2012)
- 4. © Arran COAST • Established in 2008 • Scotland’s first No- Take-Zone (NTZ) • Covers 2.67km2
- 5. • Common Lobster (Homarus gammarus) • Edible/ Brown Crab (Cancer pagarus) • Velvet Swimming Crab (Necora puber)
- 6. • Common Lobster (Homarus gammarus) • Edible/ Brown Crab (Cancer pagarus) • Velvet Swimming Crab (Necora puber) Common Lobster • Value for 2013: o £10.6 million Brown Crab • Value for 2013: o £13.8 million Velvet Crab • Value for 2013: o £4.0 million (Barreto and Bailey, 2015)
- 7. Aims Lobsters Brown Crabs Velvet Crabs Abundance Size Biomass Reproductive Output Health Recaptures • Distance trends from NTZ boundary • Compare to previous years’ data sets
- 8. 10 fathoms Soak time: 24-72 hours
- 9. © Bryce Stewart© Brian Christie © Brian Christie © Jennifer Stark© Bryce Stewart© Bryce Stewart
- 10. Arran NTZ Far Control Fishing Observations: • Recorded lobster abundance, size, gender & presence of berries • Brown crab, velvet crab & bycatch abundance • Not capture & release
- 11. NTZ Near Control 1 Near Control 3 Near Control 2 Surveys: • Recorded size and abundance for lobsters, brown crab & velvet crab • Recorded lobster health, presence of berries & recaptures • Recorded bycatch abundance • Tagged all lobsters • Capture & release
- 12. Area No. of Fleets No. of Creels No. of Lobsters Gender Ratio (M:F) No. of Legal Lobsters (CL > 87mm) NTZ 18 90 87 1 : 0.45 73 Near Control 18 90 42 1 : 0.69 30 Far Control 94 811 702 1 : 0.96 204
- 13. 0.0 0.1 0.2 0.3 0.4 0.5 0.6 0.7 0.8 0.9 1.0 1.1 1.2 NTZ Near Control Far Control CatchPerUnitEffort(CPUE) Mean Lobster CPUE CPUE 107.14% higher in NTZ versus Near Control (Mann-Whitney- Wilcoxon Test, U = 243.5, p < 0.01) CPUE 9.19% higher in NTZ versus Far Control (Mann-Whitney-Wilcoxon Test, U= 898, p = 0.682) Catch Per Unit Effort = Number of lobsters caught Number of creels in the fleet
- 14. 0 0.1 0.2 0.3 0.4 0.5 0.6 0.7 0.8 0.9 1 NTZ Near Control Far Control CatchPerUnitEffort(CPUE) Mean Legal Lobster CPUE Legal CPUE 143.33% higher in NTZ versus Near Control (Mann- Whitney-Wilcoxon Test, U = 244, p < 0.01) Legal CPUE 224.54% higher in the NTZ versus Far Control (Mann- Whitney-Wilcoxon Test, U = 1358.5, p < 0.001)
- 15. 0 5 10 15 20 25 30 35 40 45 52-58 59-65 66-72 73-79 80-86 87-93 94-100 101-107 108-114 115-121 121-127 128-134 135-141 Frequency(%) Carapace Length (mm) Mean Lobster Size NTZ Near Control Far Control • Lobsters inside NTZ 11.64% larger than Near Control & 21.22% larger compared to Far Control • Legal lobsters inside NTZ 11.18% larger compared to Near Control & 11.17% larger compared to Far Control (All one-way ANOVAs p < 0.001) Minimum Landing Size (MLS)
- 16. WPUE 186.90% higher in NTZ versus Near Control (Mann- Whitney-Wilcoxon Test, U = 260.5, p = 0.002) WPUE 87.52% higher in NTZ versus Far Control (Mann- Whitney-Wilcoxon Test, U= 1189, p = 0.006) Lobster weight: • Males = 0.0022 * (carapace length (mm) ^ 2.7416)) • Females = 0.0016 * (carapace length (mm) ^ 2.8134)) (Howarth, 2014; Leslie et al. 2006) WPUE = Total weight of lobsters caught Number of creels in the fleet 0 100 200 300 400 500 600 700 800 900 NTZ Near Control Far Control WeightperUnitEffort(g) Mean Lobster WPUE
- 17. 0 100 200 300 400 500 600 700 800 NTZ Near Control Far Control WeightperUnitEffort(g) Mean Legal Lobster WPUE Legal WPUE 232% higher in NTZ versus Near Control (Mann-Whitney- Wilcoxon Test, U = 259, p = 0.002) Legal WPUE 346.9% higher in the NTZ versus Far Control (Mann- Whitney-Wilcoxon Test, U = 1450.5, p < 0.001)
- 18. 0 200 400 600 800 1000 1200 1400 1600 1800 NTZ Near Control Far Control ReproductiveOutputPerUnitEffort(No. ofEggs) Mean Potential Lobster ROPUE CL > 81mm • Egg output per individual = (carapace length (mm) * 155.4) - 10286) (Howarth, 2014; Lizárraga-Cubedo et al. 2003) ROPUE = Egg potential for fleet Number of creels in the fleet CL > 87 mm ROPUE 76.94% higher in NTZ versus Near Control (Mann- Whitney-Wilcoxon Test, U = 224, p = 0.04) CL > 87 mm ROPUE 42.82% higher in the NTZ versus Far Control (Mann- Whitney-Wilcoxon Test, U = 1043, p < 0.119)
- 19. R² = 0.2019 0 0.2 0.4 0.6 0.8 1 1.2 1.4 1.6 1.8 2 -2000 0 2000 4000 6000 8000 10000 12000 14000 16000 18000 20000 LegalCPUE Distance from NTZ Boundary (m) Mean Legal Lobster CPUE R² = 0.2503 0 200 400 600 800 1000 1200 1400 1600 -2000 0 2000 4000 6000 8000 10000 12000 14000 16000 18000 20000 LegalWPUE(g) Distance from NTZ Boundary (m) Mean Legal Lobster WPUE
- 20. 0 0.2 0.4 0.6 0.8 1 1.2 1.4 2012 2013 2014 2015 LegalCatchperuniteffort(CPUE) NTZ Outside NTZ
- 21. Carapace Length = 135mm!!! Conclusions • The NTZ is restoring lobster population size/ age structure • This is increasing biomass and may be significantly increasing reproductive output • The benefits of the recovering population seem to be spilling over • However, low abundance this year so interpret carefully, but…
- 22. Thank you to: • COAST for funding this research • Bryce for being an excellent supervisor … & thank you for listening! Any questions?
Editor's Notes
- Hello and quick intro
- Overfishing
- Overfishing and the Firth of Clyde – then NTZ
- NTZ establishment and history + map of Arran + introduce surveys
- Target species of surveys = lobsters, crabs, velvet crabs
- lobsters, crabs, velvet crabs (why)
- Aims
- Creeling + aims
- Variables recorded and tagging procedure
- Crustacean survey 2011 to 2015 – lobsters, crabs, velvet crabs (why) – focus on lobsters and why
- Crustacean survey 2011 to 2015 – lobsters, crabs, velvet crabs (why) – focus on lobsters and why
- Numbers of lobsters and legal lobsters caught plus facts table…
- CPUE
- Legal CPUE
- Sizes
- WPUE
- Legal WPUE
- ROPUE CL>81mm
- Distance trends
- Distance trends
- Conclusions + key facts + future work + questions?
- Conclusions + key facts + future work + questions?