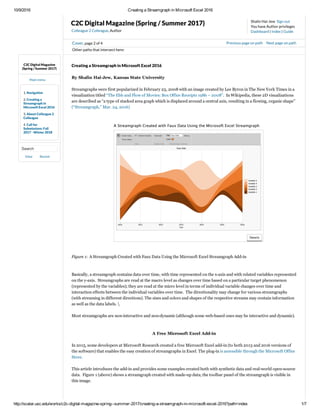
Creating a Streamgraph in Microsoft Excel 2016
•
1 like•1,013 views

This is a short article that describes the simple creation of a streamgraph using an add-in to Microsoft Excel.
![10/9/2016 Creating a Streamgraph in Microsoft Excel 2016
http://scalar.usc.edu/works/c2cdigitalmagazinespringsummer2017/creatingastreamgraphinmicrosoftexcel2016?path=index 2/7
So riffing on the use of artificial data, it is also possible to use negative numbers to create dramatic dips as in Figure 2. In
this latter visualization, the toolbar panel has been minimized.
Figure 2: Faux Data (with Negative Values)
Downloading and Installing the Steamgraph Addin
This sequence assumes that the correct version of Excel (2013, 2016, or the online cloudbased one) is already installed. Go
to the this site.
Click the “Add” button. If authentication is needed, sign in with the proper email address or phone number. Identify
whether you have a workbased account or a Microsoft account. Download the addin. Doubleclick on it to install it to
Excel.
Open Excel. In the Ribbon, go to the Insert tab. In the Addins dropdown, select Streamgraph (Figure 3). [Notice that the
Microsoft Store button is just above the Addins dropdown menu.]
Faux Data (with Negative Values) Annotations
Details
Activating the Steamgraph Add-in in Excel 2016 Annotation
Details](data:image/gif;base64,R0lGODlhAQABAIAAAAAAAP///yH5BAEAAAAALAAAAAABAAEAAAIBRAA7)
Recommended
Recommended
More Related Content
More from Shalin Hai-Jew
More from Shalin Hai-Jew (20)
Recently uploaded
Recently uploaded (20)
Creating a Streamgraph in Microsoft Excel 2016
- 1. 10/9/2016 Creating a Streamgraph in Microsoft Excel 2016 http://scalar.usc.edu/works/c2cdigitalmagazinespringsummer2017/creatingastreamgraphinmicrosoftexcel2016?path=index 1/7 Shalin Hai-Jew Sign out You have Author privileges Dashboard | Index | Guide C2C Digital Magazine (Spring / Summer 2017) Colleague 2 Colleague, Author C2C Digital Magazine (Spring / Summer 2017) 1. Navigation 2. Creating a Streamgraph in Microsoft Excel 2016 3. About Colleague 2 Colleague 4. Call for Submissions: Fall 2017 - Winter 2018 Search Other paths that intersect here: Cover, page 2 of 4 Previous page on path Next page on path Creating a Streamgraph in Microsoft Excel 2016 By Shalin HaiJew, Kansas State University Streamgraphs were first popularized in February 23, 2008 with an image created by Lee Byron in The New York Times in a visualization titled “The Ebb and Flow of Movies: Box Office Receipts 1986 – 2008”. In Wikipedia, these 2D visualizations are described as “a type of stacked area graph which is displaced around a central axis, resulting in a flowing, organic shape” (“Streamgraph,” Mar. 24, 2016) Figure 1: A Streamgraph Created with Faux Data Using the Microsoft Excel Streamgraph Addin Basically, a streamgraph contains data over time, with time represented on the xaxis and with related variables represented on the yaxis. Streamgraphs are read at the macro level as changes over time based on a particular target phenomenon (represented by the variables); they are read at the micro level in terms of individual variable changes over time and interaction effects between the individual variables over time. The directionality may change for various streamgraphs (with streaming in different directions). The sizes and colors and shapes of the respective streams may contain information as well as the data labels. Most streamgraphs are noninteractive and nondynamic (although some webbased ones may be interactive and dynamic). A Free Microsoft Excel Addin In 2015, some developers at Microsoft Research created a free Microsoft Excel addin (to both 2013 and 2016 versions of the software) that enables the easy creation of streamgraphs in Excel. The plugin is accessible through the Microsoft Office Store. This article introduces the addin and provides some examples created both with synthetic data and realworld opensource data. Figure 1 (above) shows a streamgraph created with madeup data; the toolbar panel of the streamgraph is visible in this image. Main menu View Recent A Streamgraph Created with Faux Data Using the Microsoft Excel Streamgraph Annotations Details
- 2. 10/9/2016 Creating a Streamgraph in Microsoft Excel 2016 http://scalar.usc.edu/works/c2cdigitalmagazinespringsummer2017/creatingastreamgraphinmicrosoftexcel2016?path=index 2/7 So riffing on the use of artificial data, it is also possible to use negative numbers to create dramatic dips as in Figure 2. In this latter visualization, the toolbar panel has been minimized. Figure 2: Faux Data (with Negative Values) Downloading and Installing the Steamgraph Addin This sequence assumes that the correct version of Excel (2013, 2016, or the online cloudbased one) is already installed. Go to the this site. Click the “Add” button. If authentication is needed, sign in with the proper email address or phone number. Identify whether you have a workbased account or a Microsoft account. Download the addin. Doubleclick on it to install it to Excel. Open Excel. In the Ribbon, go to the Insert tab. In the Addins dropdown, select Streamgraph (Figure 3). [Notice that the Microsoft Store button is just above the Addins dropdown menu.] Faux Data (with Negative Values) Annotations Details Activating the Steamgraph Add-in in Excel 2016 Annotation Details
- 5. 10/9/2016 Creating a Streamgraph in Microsoft Excel 2016 http://scalar.usc.edu/works/c2cdigitalmagazinespringsummer2017/creatingastreamgraphinmicrosoftexcel2016?path=index 5/7 Interestingly, the addin adds in .5 years or halfyears, which enables a kind of smoothing between years. Figure 7: The Backend of the A’s and B’s of the City of Los Angeles Crime Set: 2012 – 2015 Another subset of the crime dataset involves a focus on “pickpocketing, purse snatching, and shoplifting,” which may be seen in Figure 8. Figure 8: Pickpocketing, Purse Snatching, and Shoplifting in the City of Angels: 2012 – 2015 Smoking Habits in Kansas: 1995 – 2010 Another dataset used was from the U.S. Centers for Disease Control and Prevention. The Behavioral Risk Factor Surveillance System (BRFSS) shares its trend data through the Data.gov portal. The set used here is the following: BRFSS Prevalence and Trends Data: Tobacco Use – Four Level Smoking Data for 1995 – 2010. The Back-end of the A’s and B’s of the City of Los Angeles Crime Set: 2012 – 2015 Annotations Details Pickpocketing, Purse Snatching, and Shoplifting in the City of Angels: Annotations Details
- 6. 10/9/2016 Creating a Streamgraph in Microsoft Excel 2016 http://scalar.usc.edu/works/c2cdigitalmagazinespringsummer2017/creatingastreamgraphinmicrosoftexcel2016?path=index 6/7 The percentages of tobacco use are weighted to population characteristics to ensure that the statistics are comparable across the states. The data may be exported as .csv, .csv for Excel, JSON, RDF, RSS, and XML data (Figure 9). Figure 9: BRFSS Prevalence and Trends Data: Tobacco Use – Four Level Smoking Data for 1995 – 2010 In this case, the streamgraph is created from the Kansas data from 1995 – 2010. The categories are Never smoked, Former smoker, Smoke some days, and Smoke every day (Figure 10). Figure 10: Tobacco Use in Kansas from 1995 – 2010 (CDC) When the data accounts for 100% of what is possible, there is no white space. Of course, it is possible to run only, say, part of the dataset, like “smoke everyday” and “smoke some days” to have a twovariable set with white space in the streamgraph. It is important to pare down data in order to have a coherent streamgraph. An overloaded streamgraph can lose informational coherence quickly (and result in jagged lines). BRFSS Prevalence and Trends Data: Tobacco Use – Four Level Smoking Data for 1995 – 2010 Annotations Details Tobacco Use in Kansas from 1995 – 2010 (CDC) Annotations Details
- 7. 10/9/2016 Creating a Streamgraph in Microsoft Excel 2016 http://scalar.usc.edu/works/c2cdigitalmagazinespringsummer2017/creatingastreamgraphinmicrosoftexcel2016?path=index 7/7 Version 3 of this page, updated 07 October 2016. C2C Digital Magazine (Spring / Summer 2017) by Colleague 2 Colleague. Help reading this book. Powered by Scalar. Terms of Service | Privacy Policy | Scalar Feedback New Edit Hide Comment on this page Previous page on path Cover, page 2 of 4 Next page on path Sparser data, with some zeroes, will result in more dramatic views, such as with crossover of some of the lines. Using negative cell values can also result in dramatic and swooping lines. Sometimes, running fewer years can also result in some eyecatching visuals. About the Author Shalin HaiJew works as an instructional designer at Kansas State University. She may be reached at shalin@kstate.edu. Related: (No related content) streamgraph Data.gov