Download to read offline


![Architecture
40
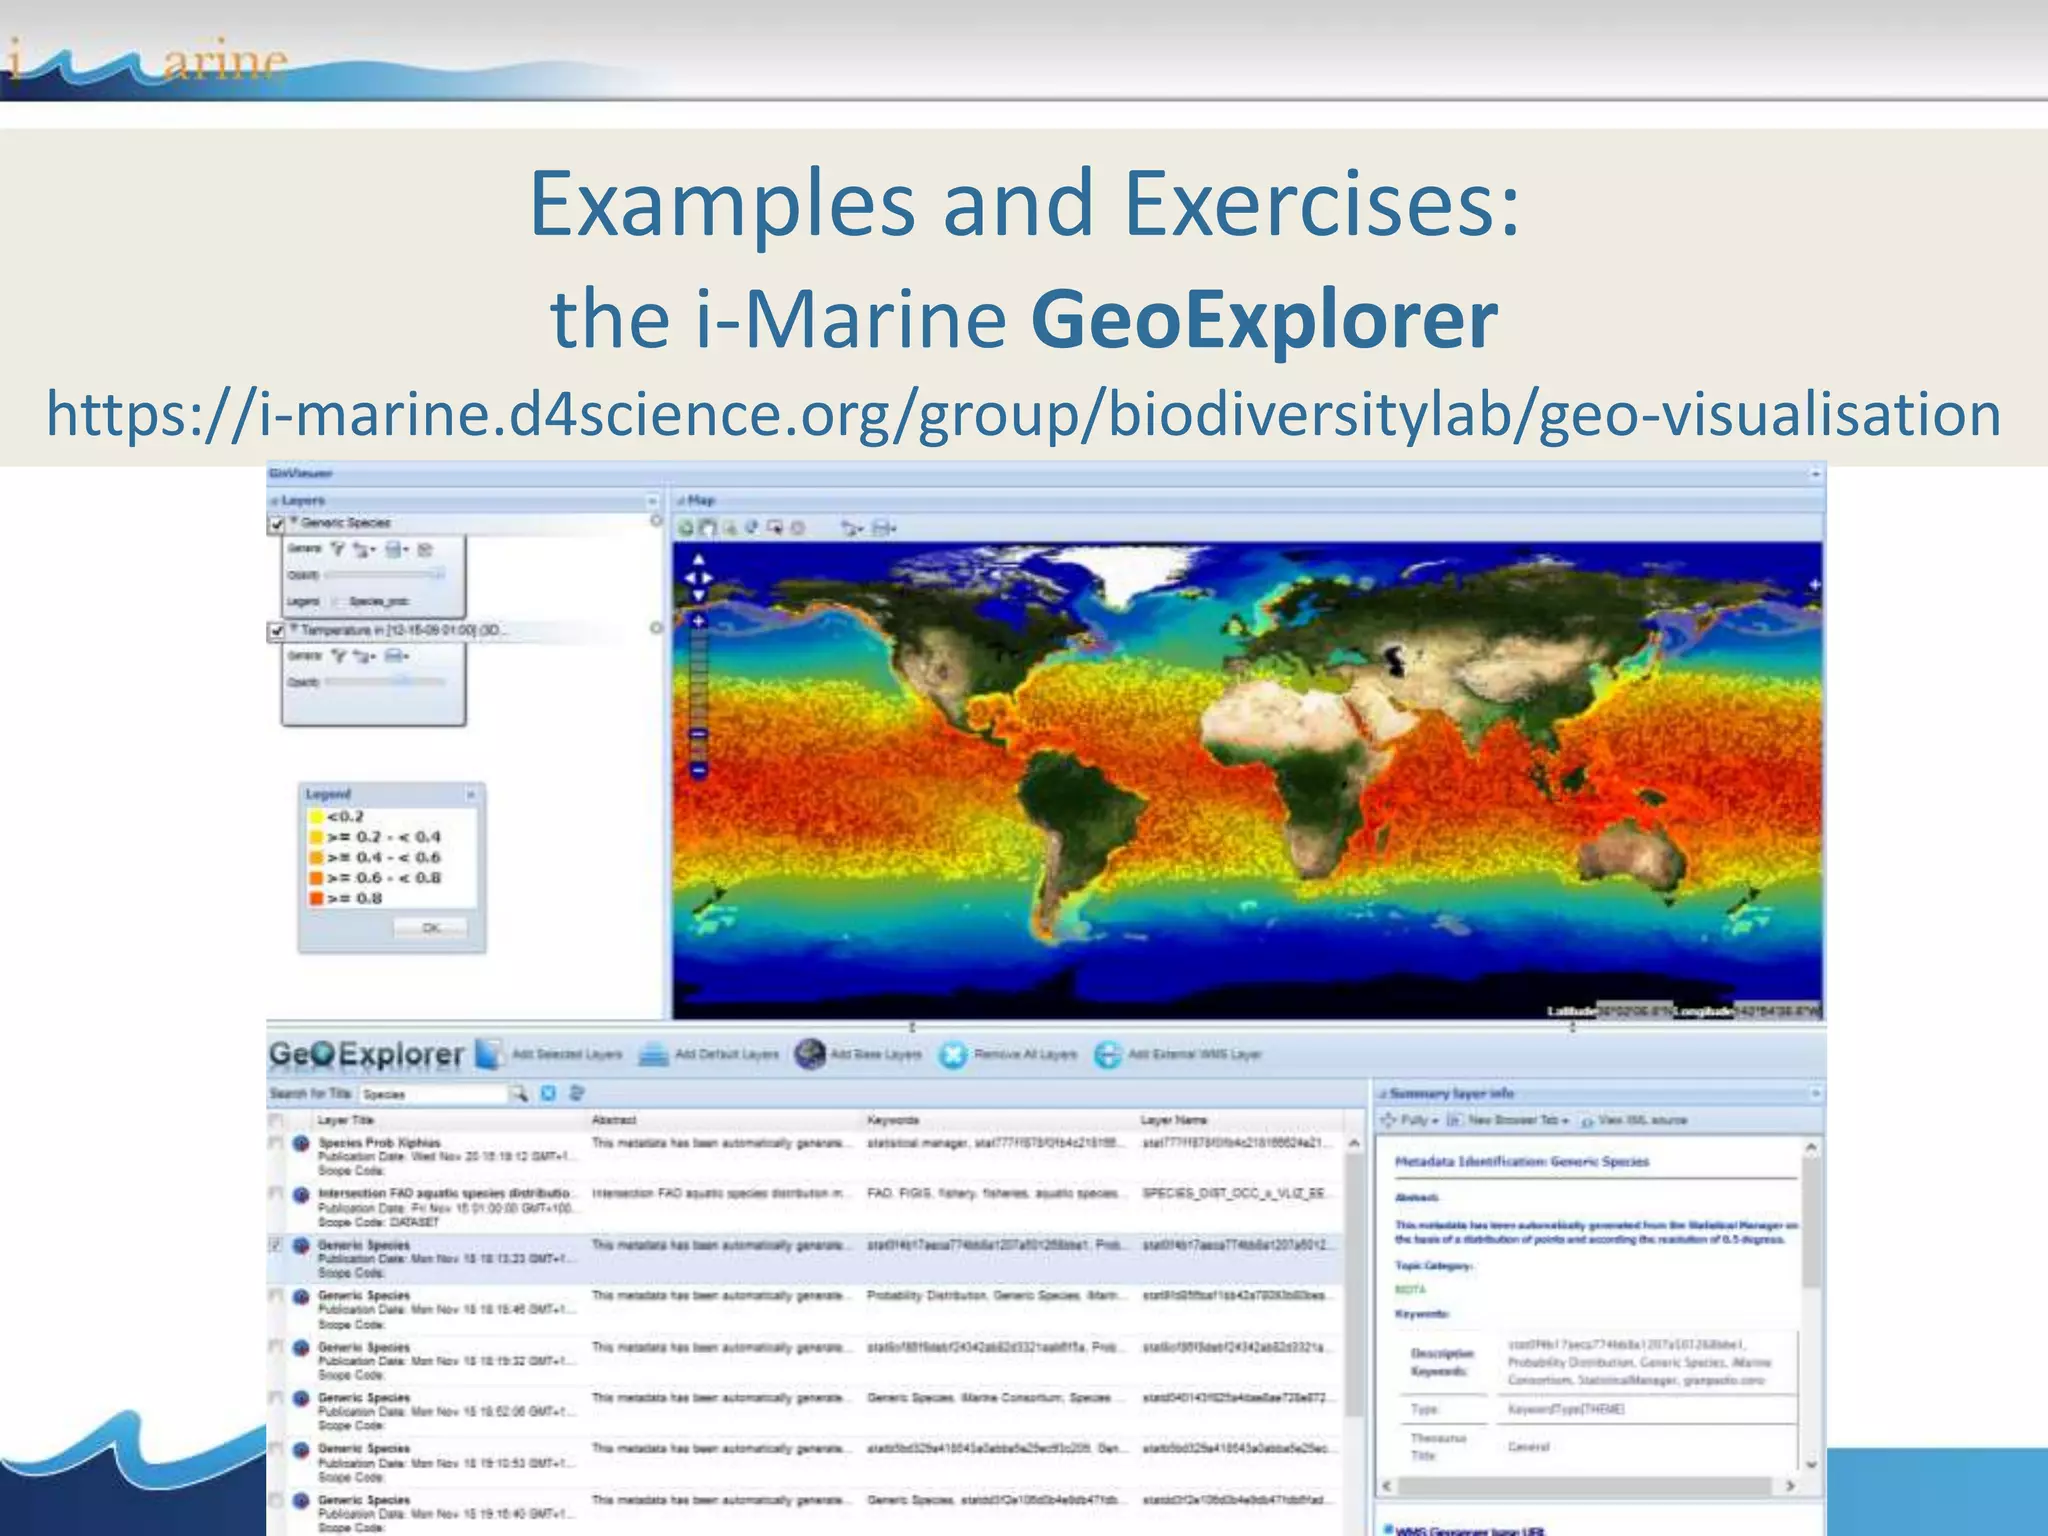
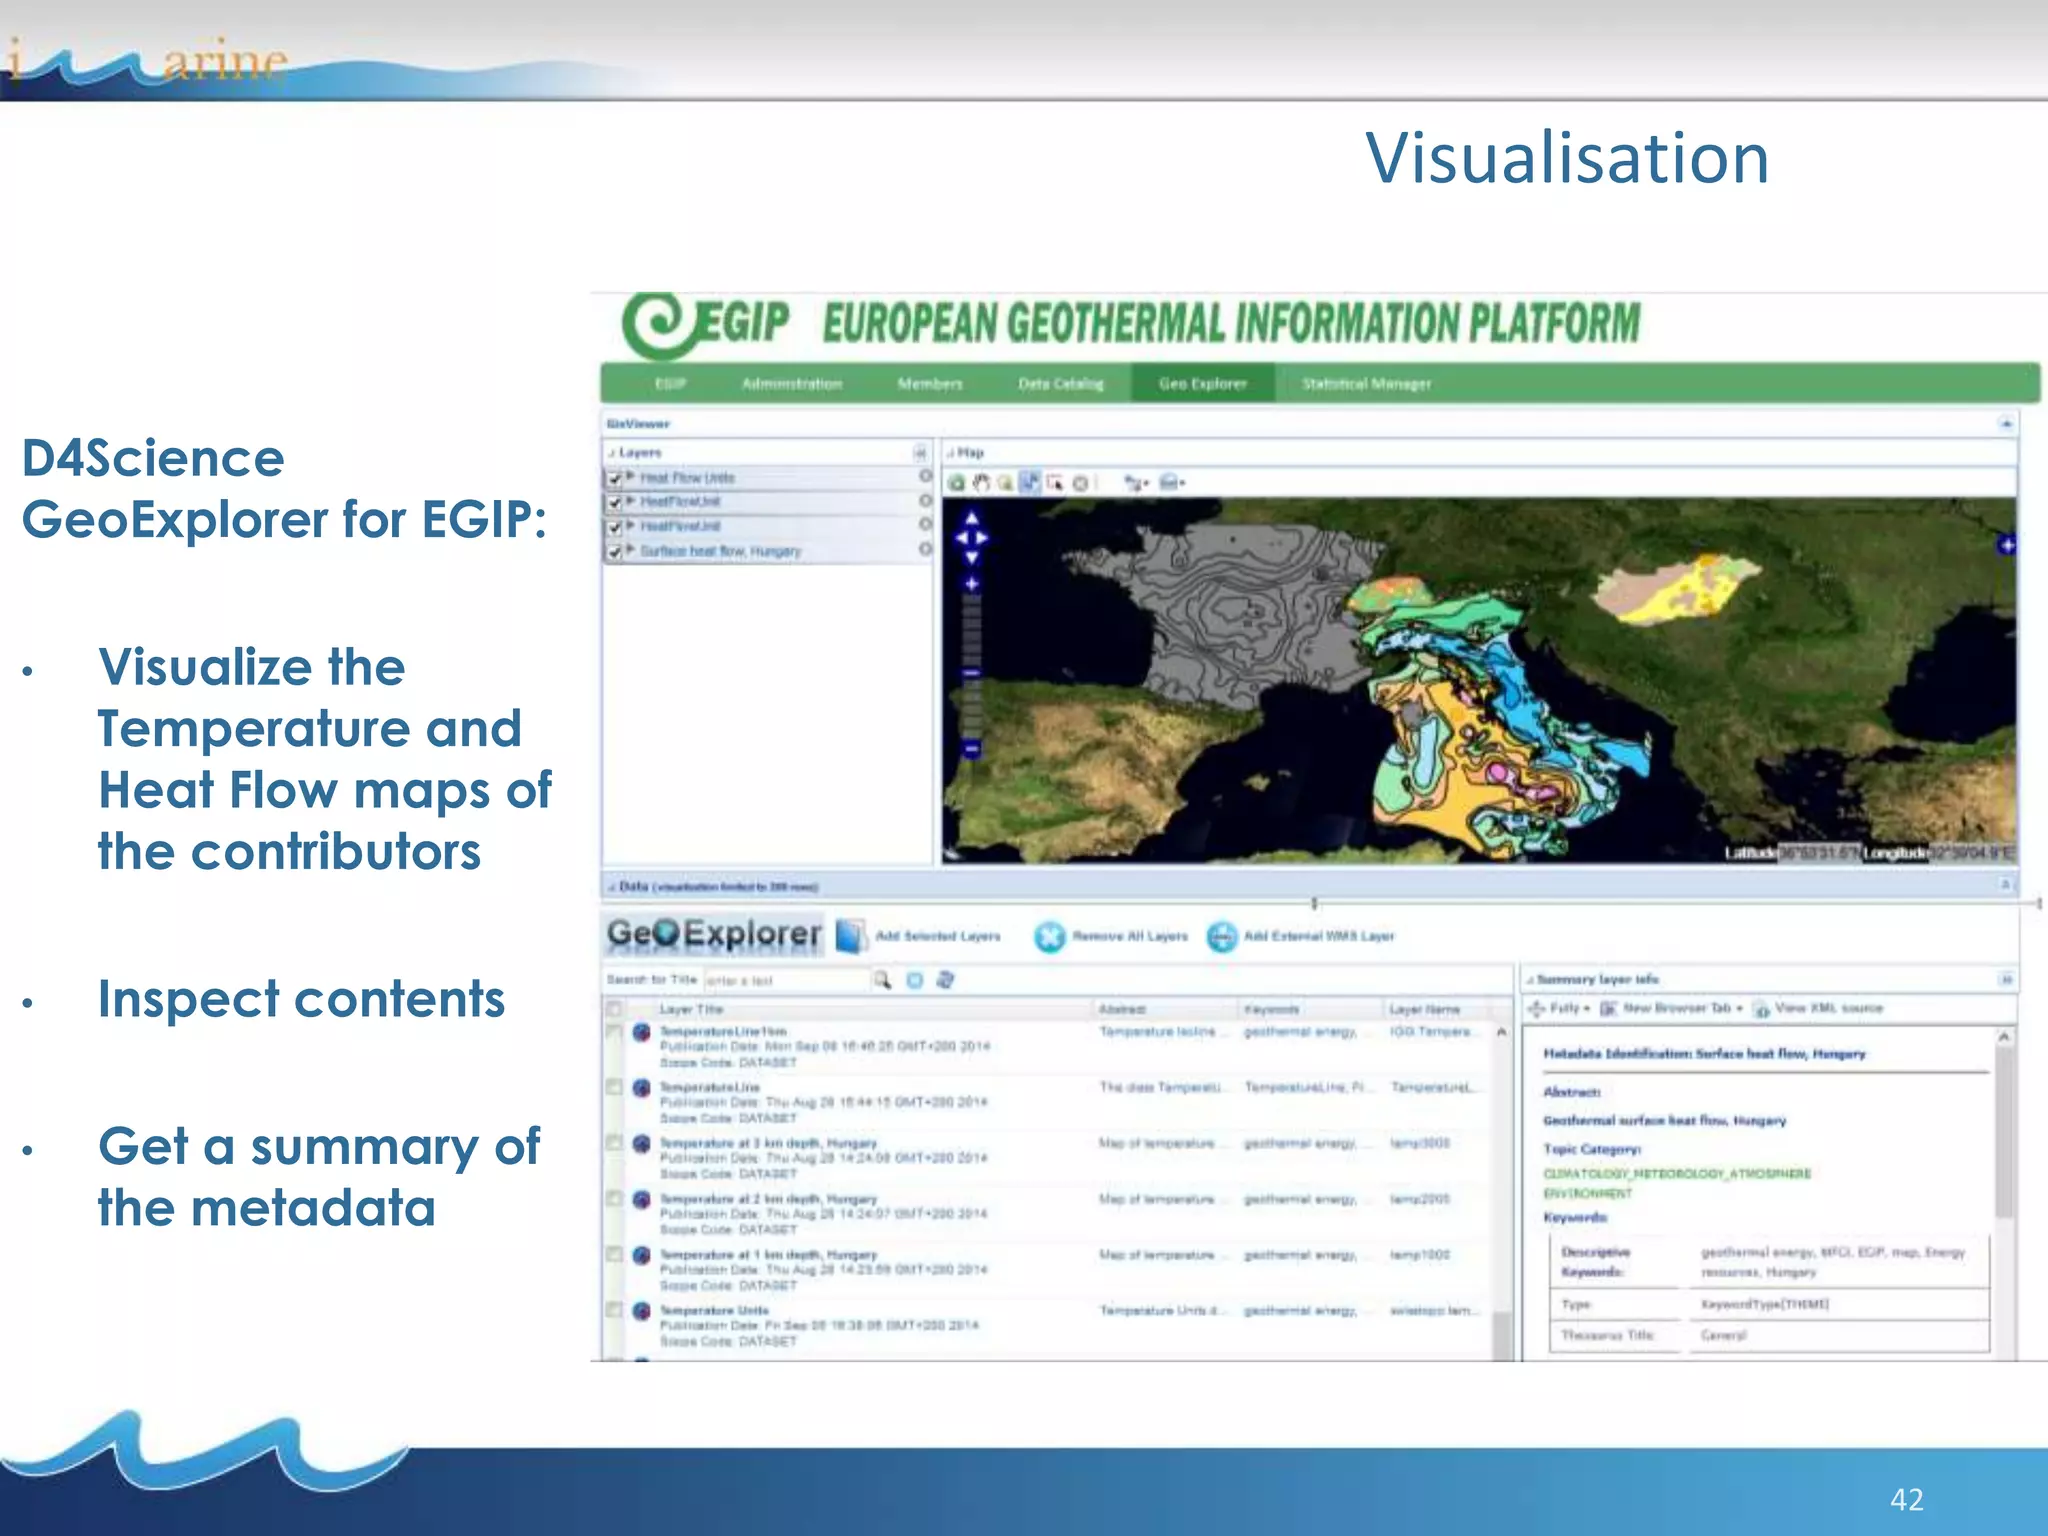
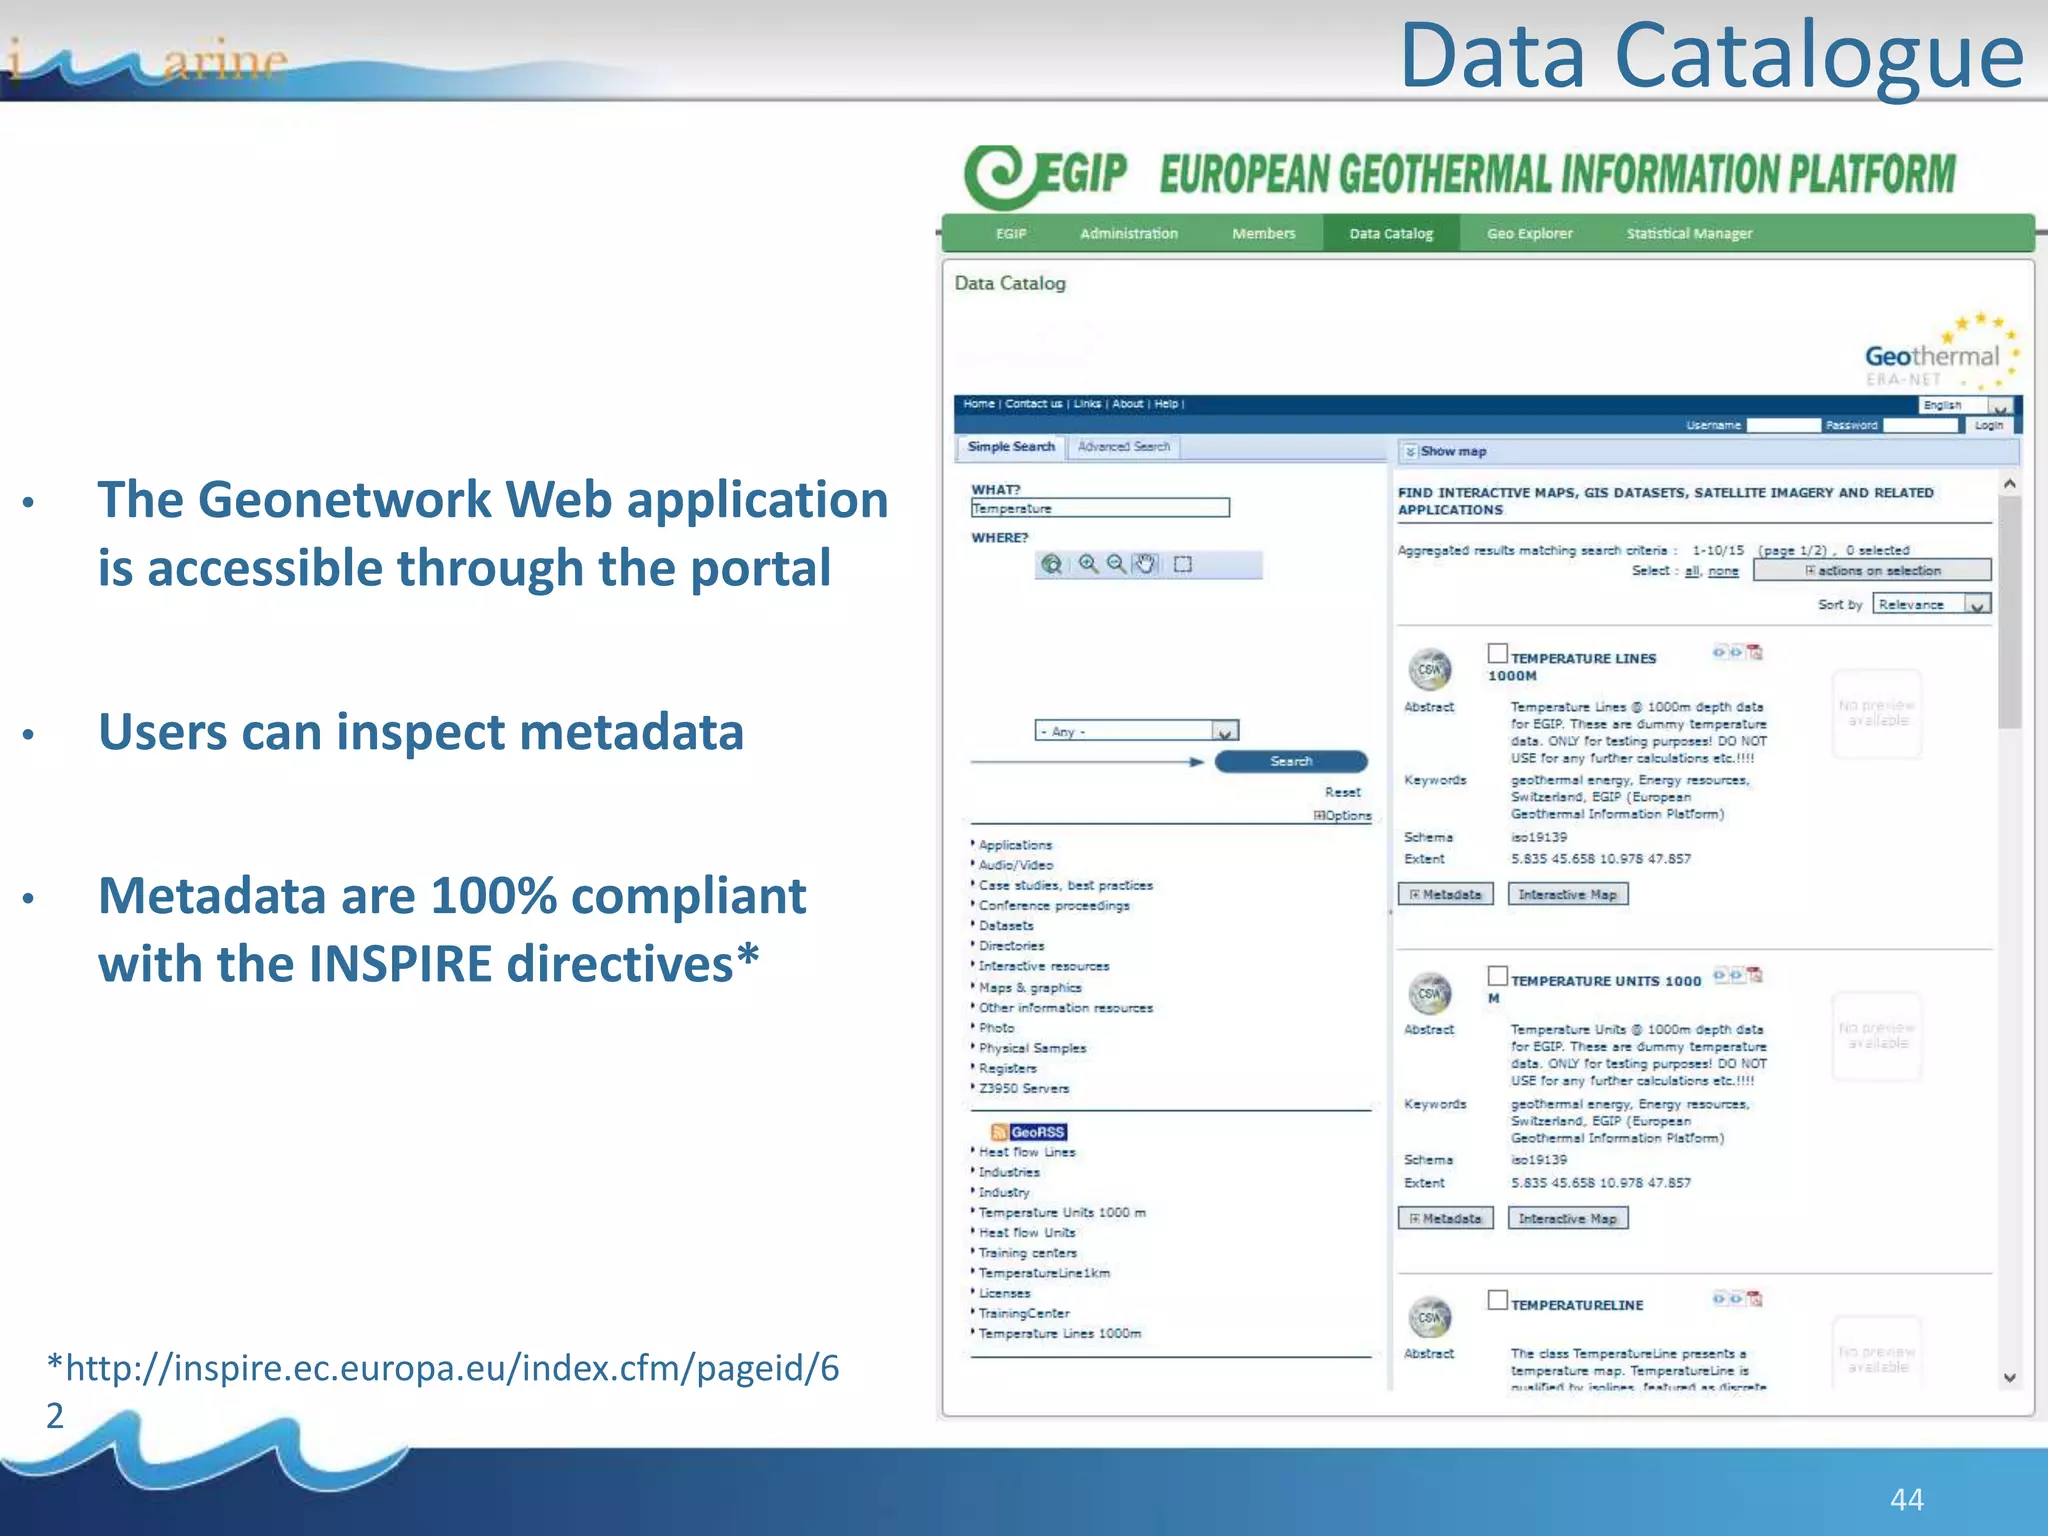
Visualization:
GeoExplorer
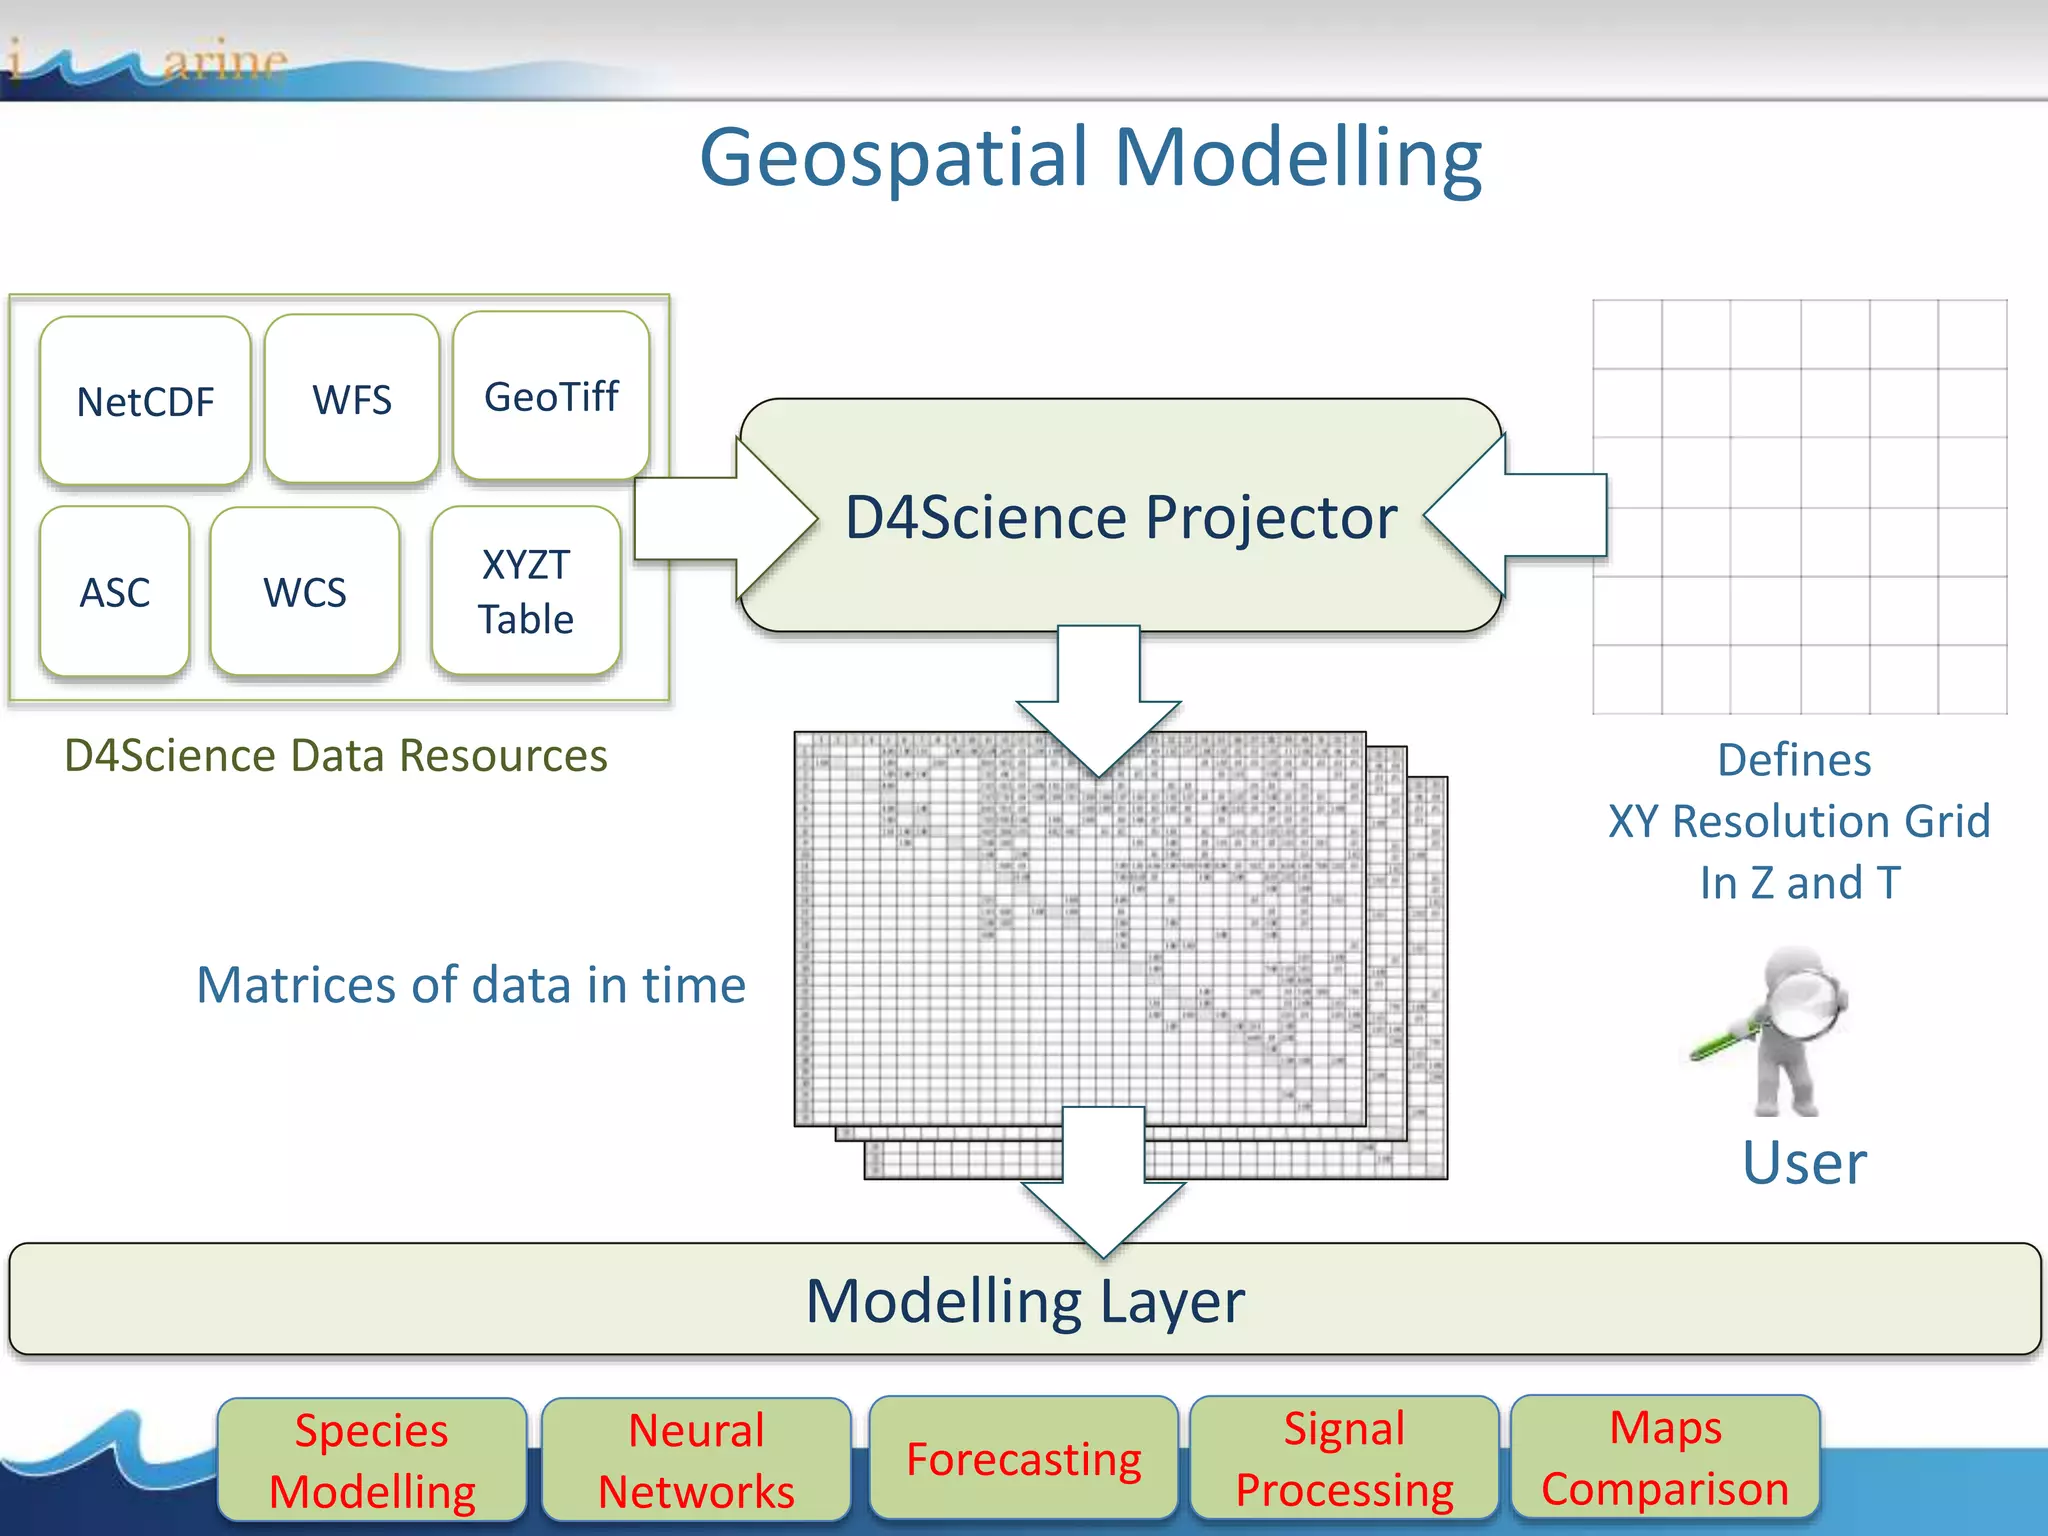
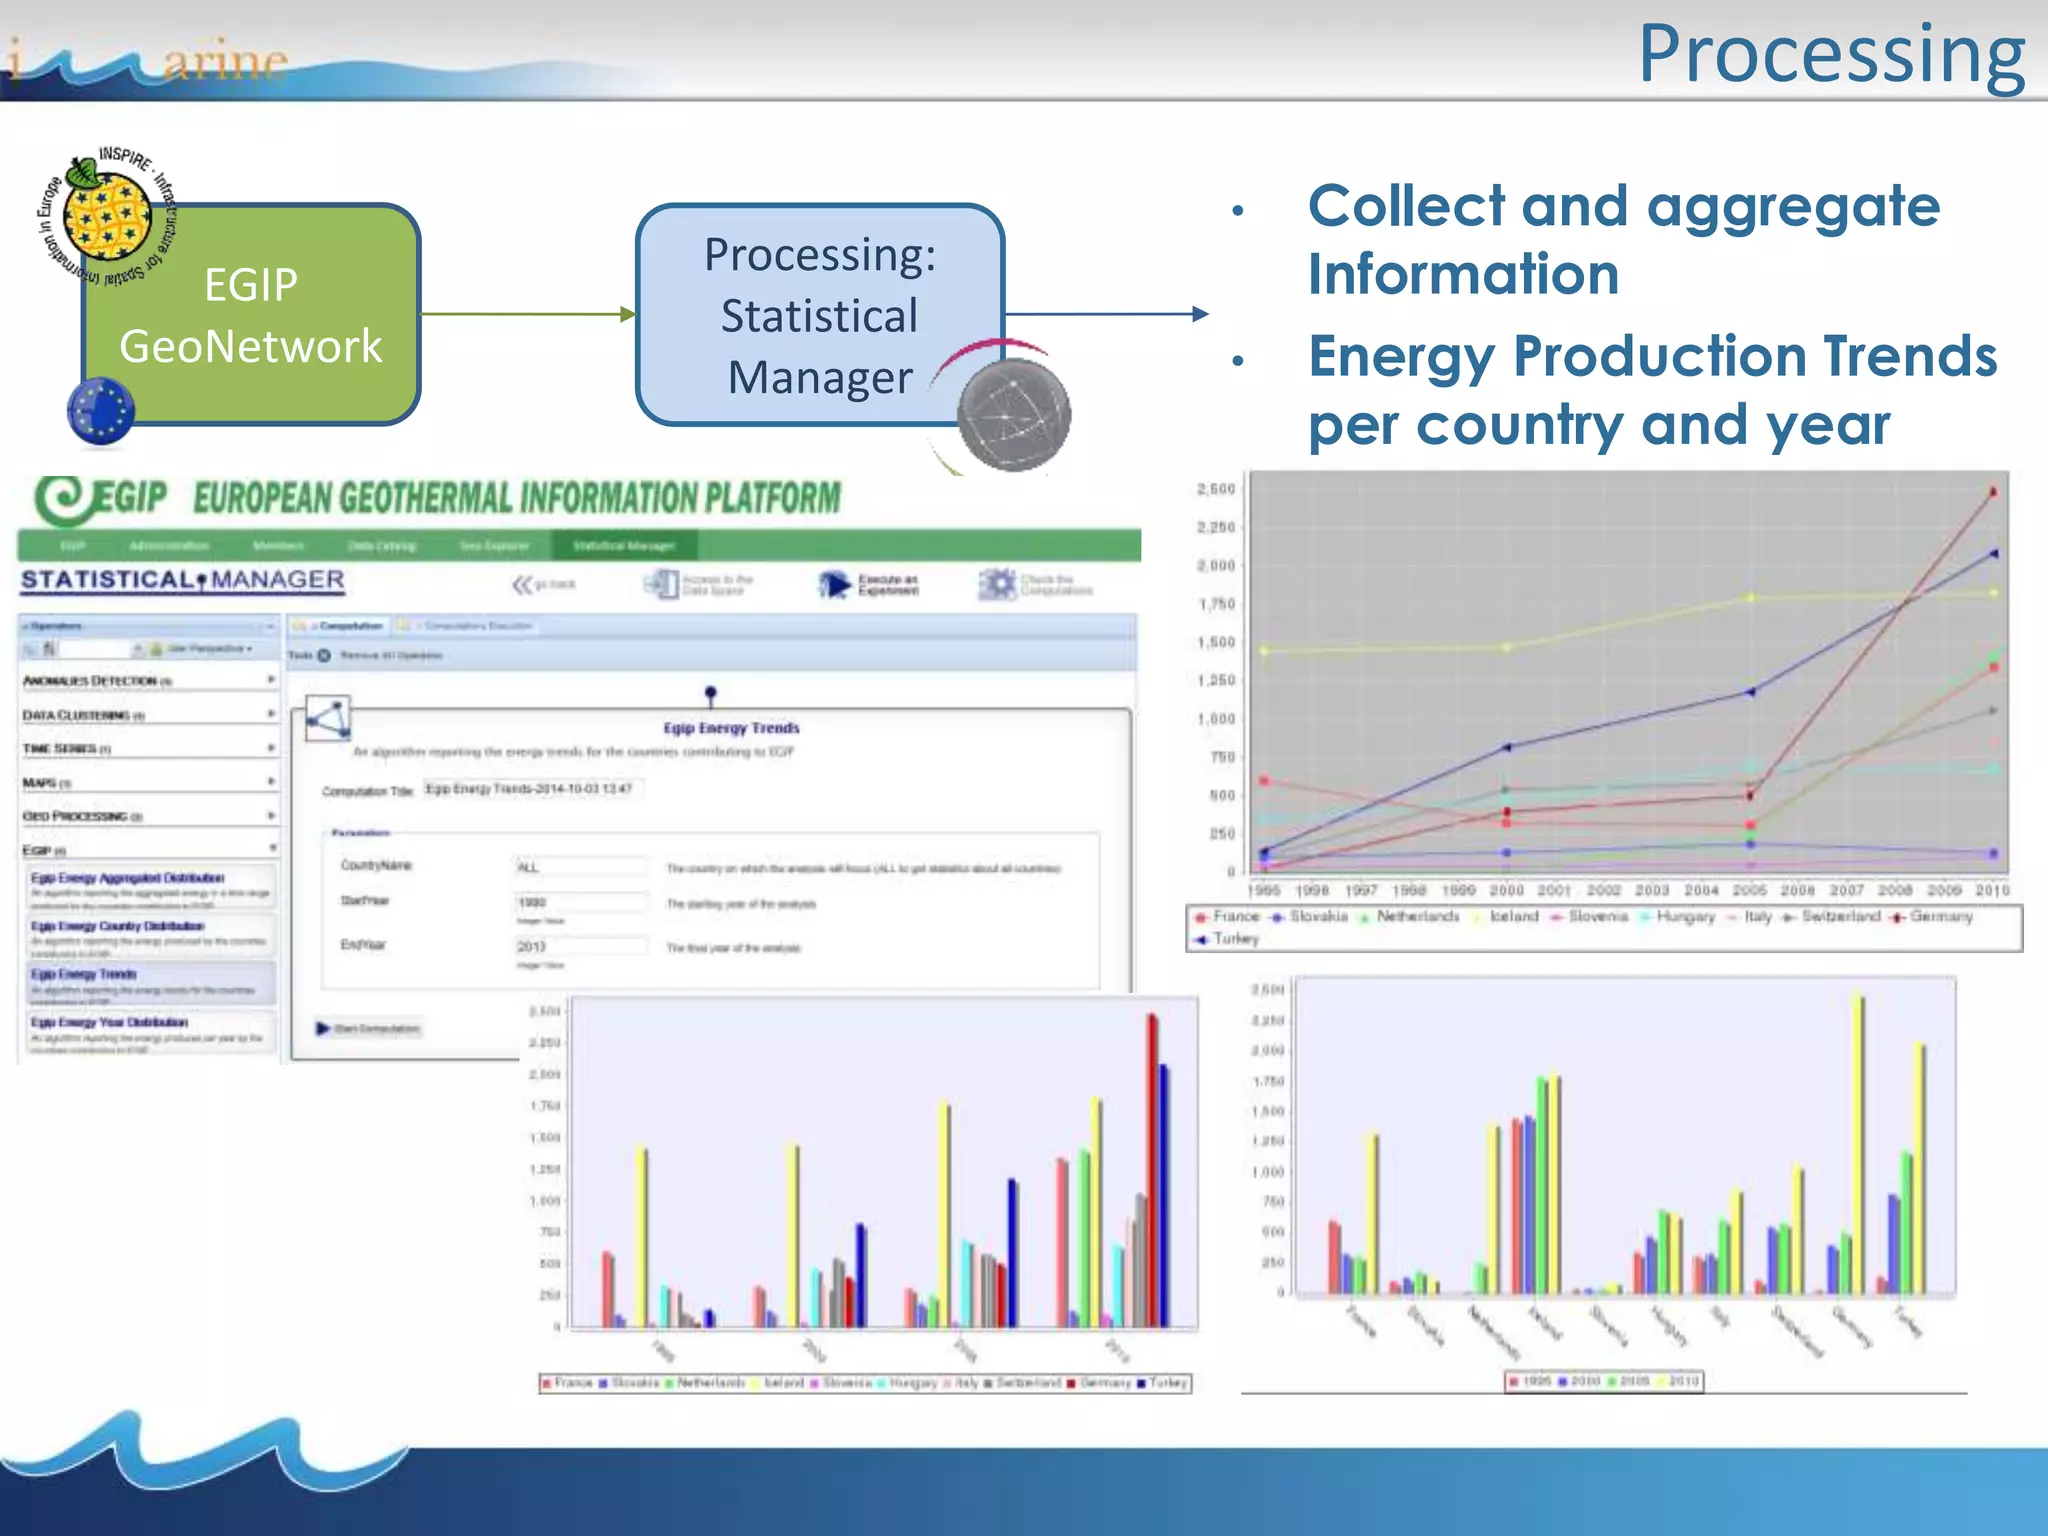
Processing:
Statistical
Manager
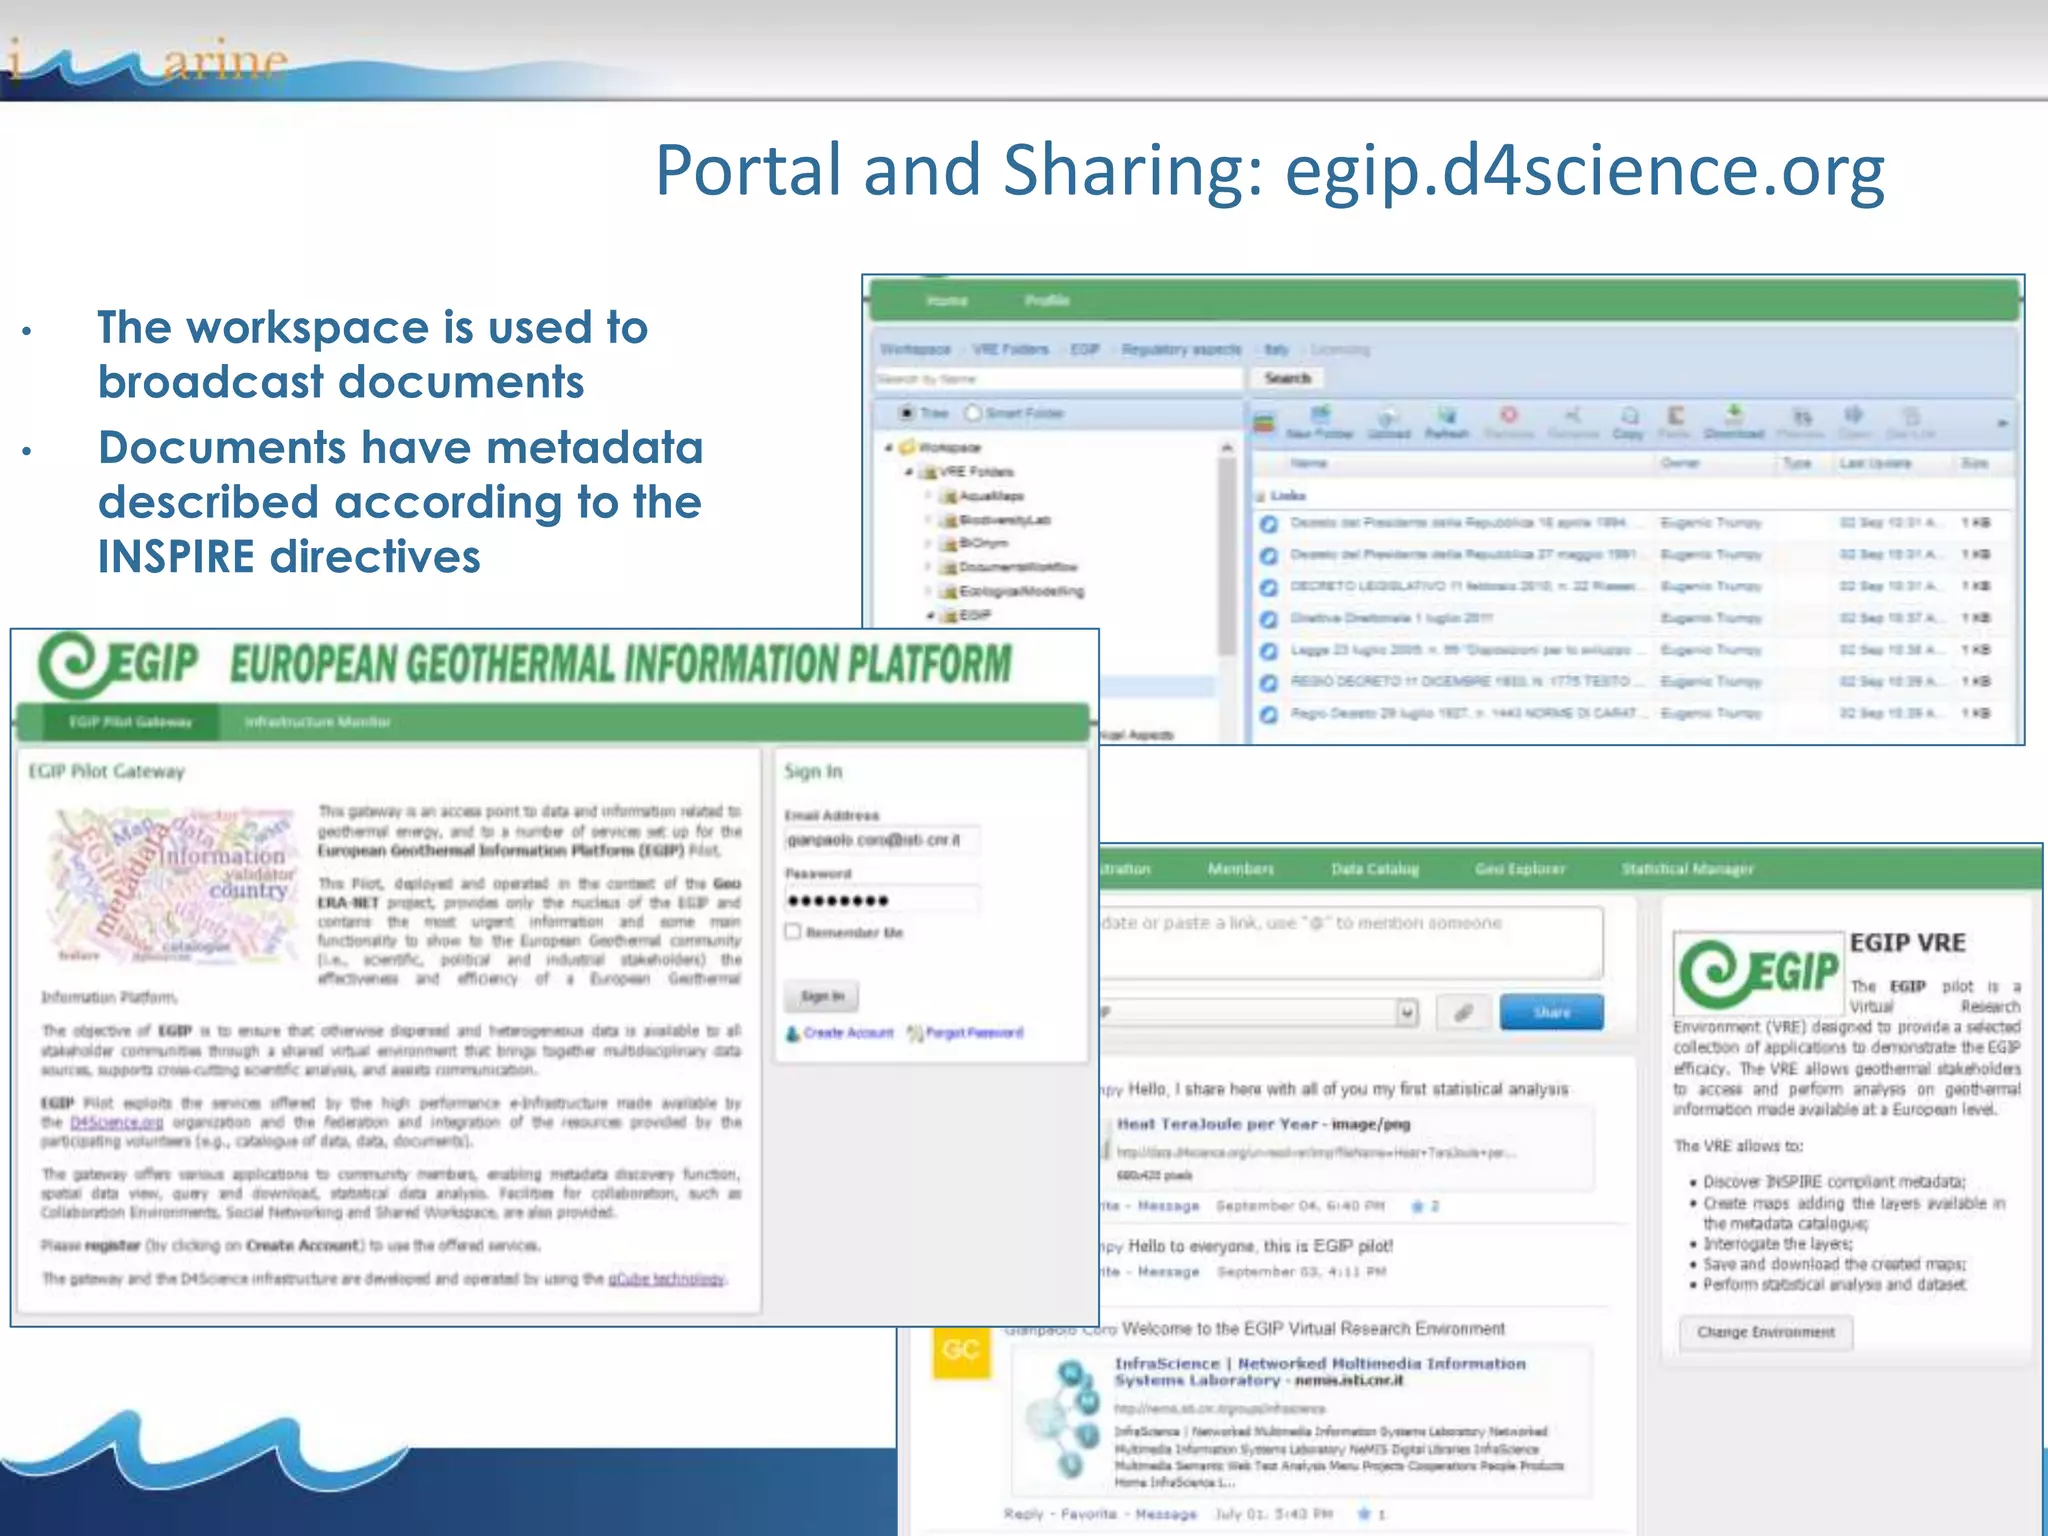
Documents
Sharing:
Workspace
Social
EGIP
GeoNetwork
GeoServer
Italy
GeoServer
Hungary
GeoServer
Switzerland
MapServer
France
D4S
I.S.
GeoServer
[Others]](https://image.slidesharecdn.com/coroimarine2015-module2-150518115516-lva1-app6891/75/USING-E-INFRASTRUCTURES-FOR-BIODIVERSITY-CONSERVATION-Module-2-40-2048.jpg)

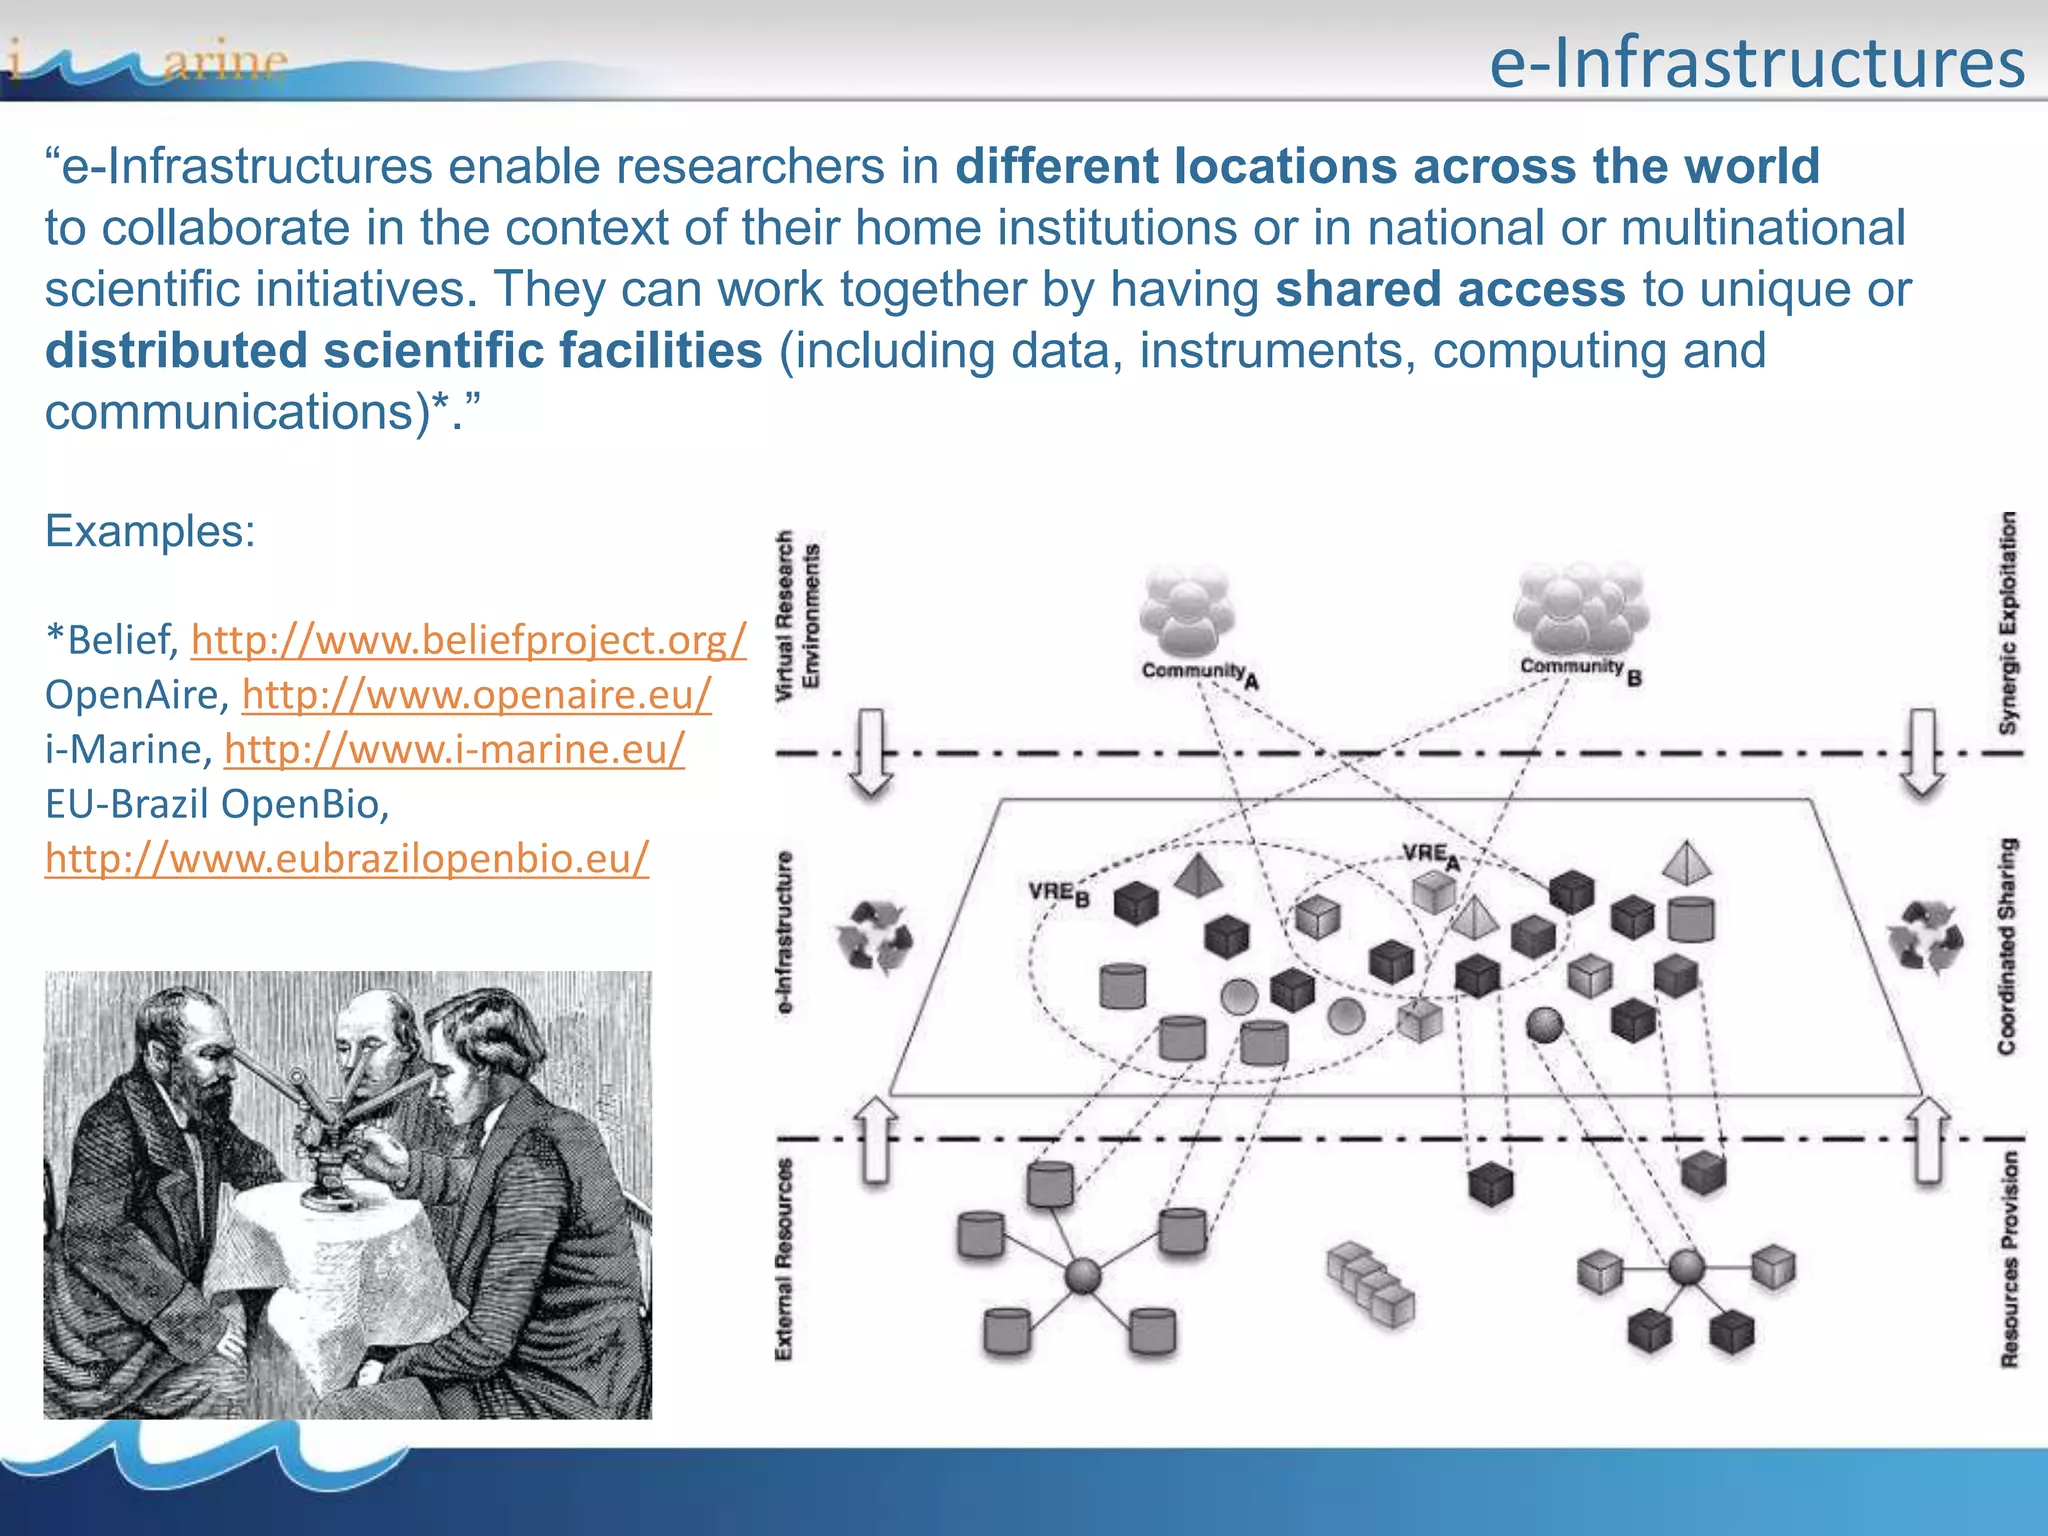
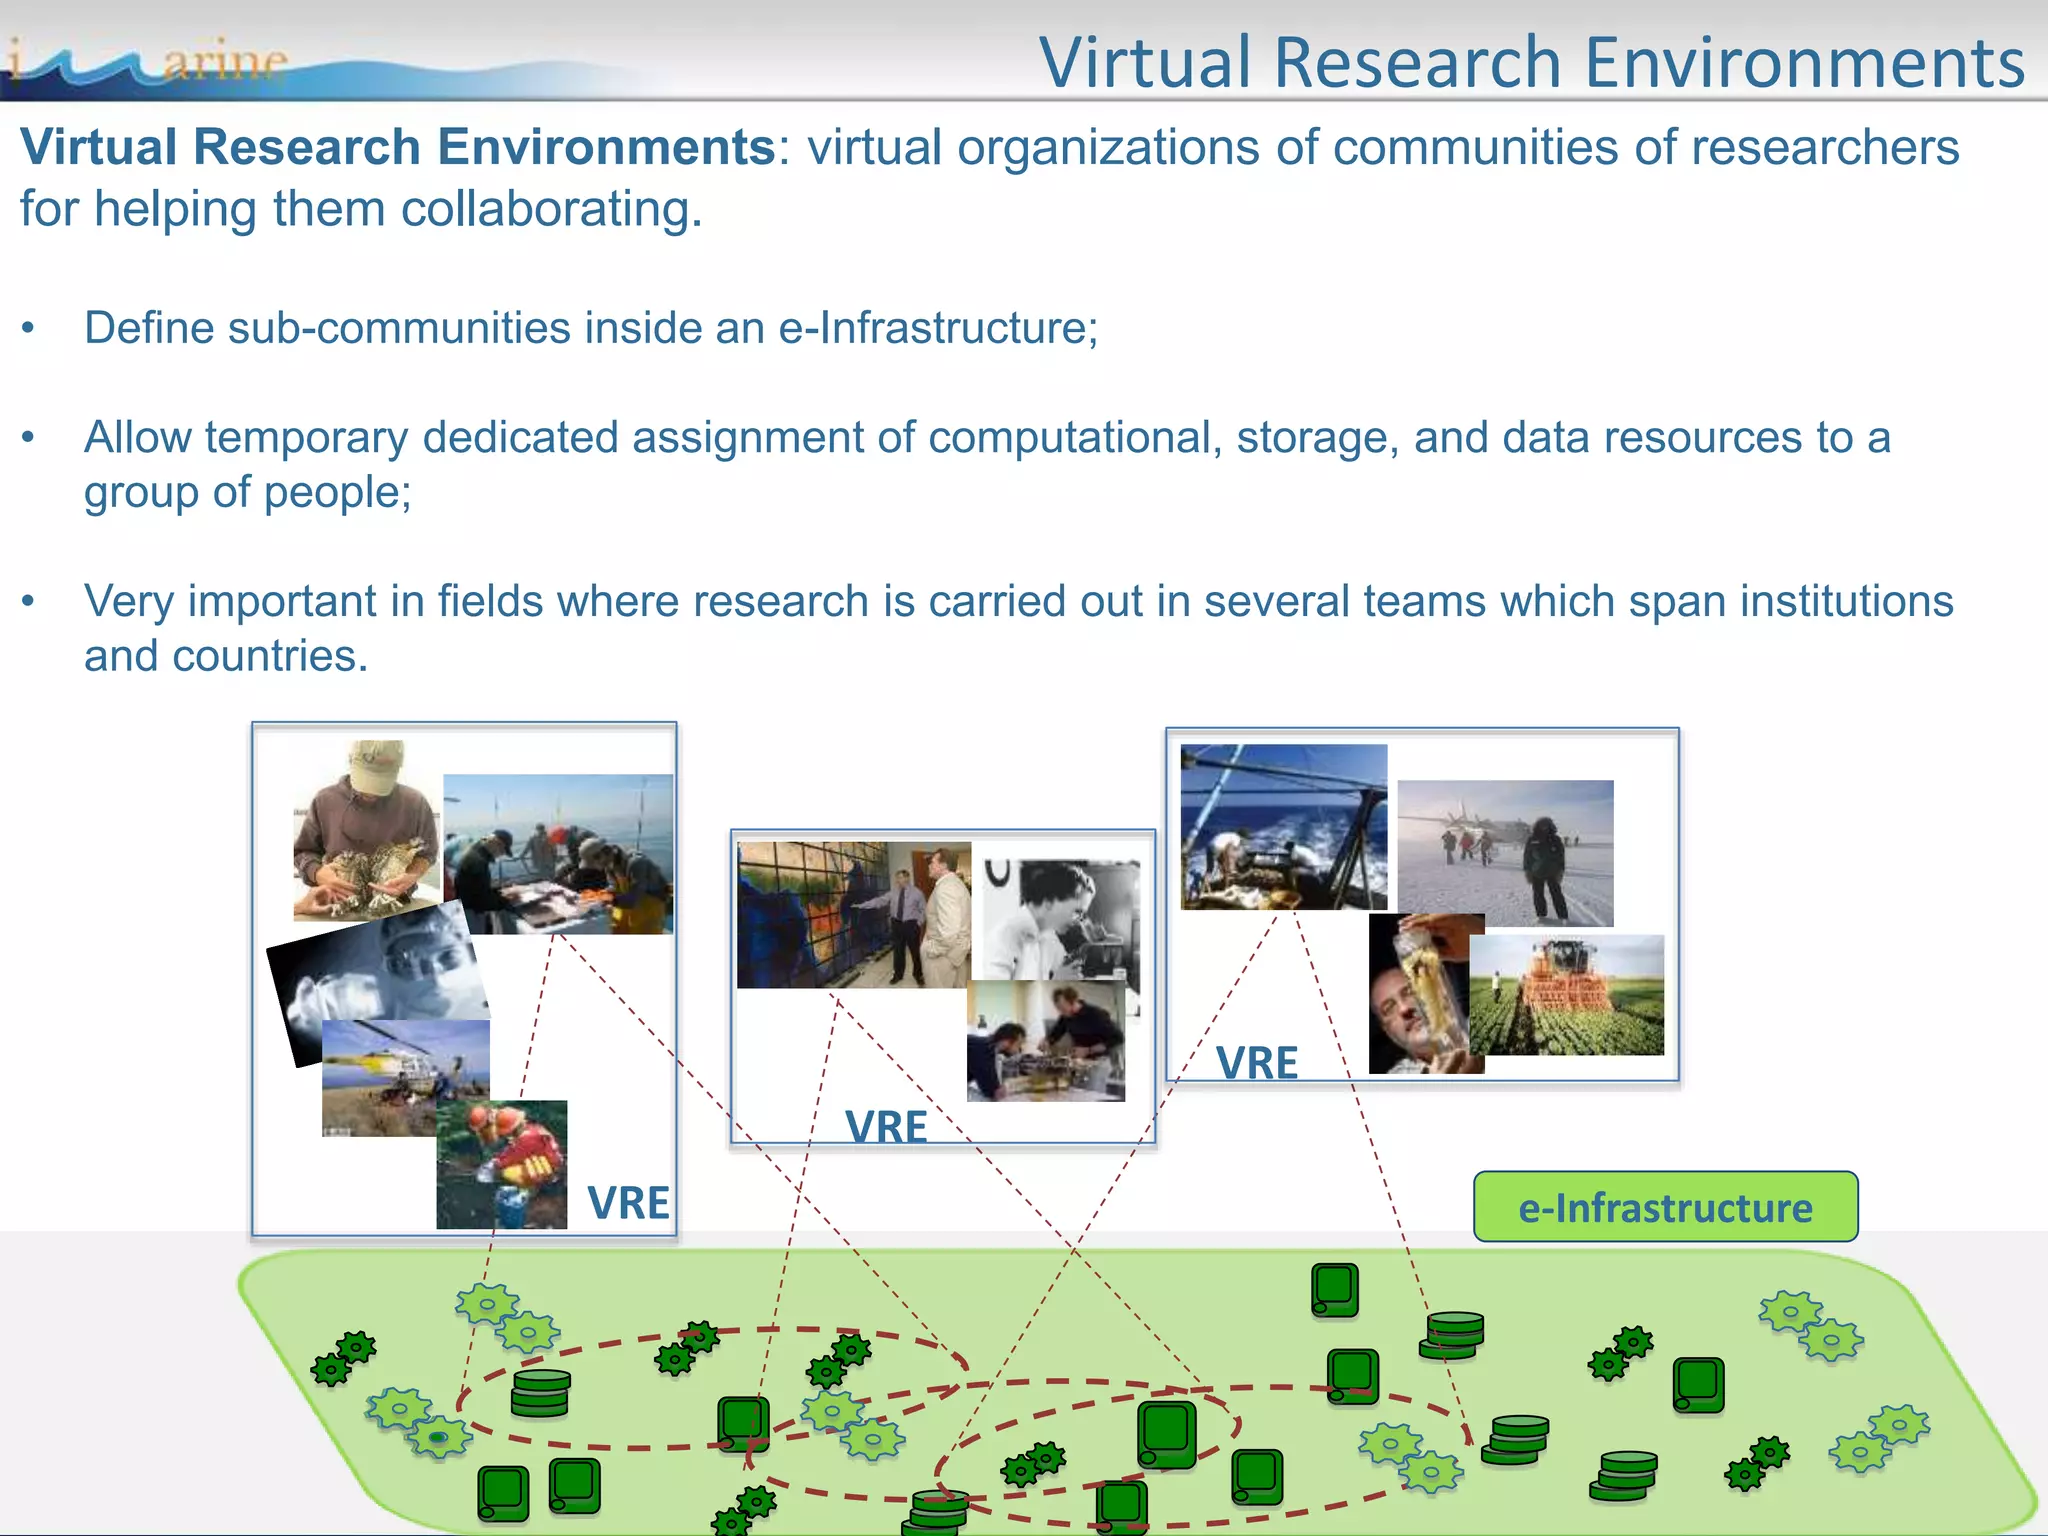
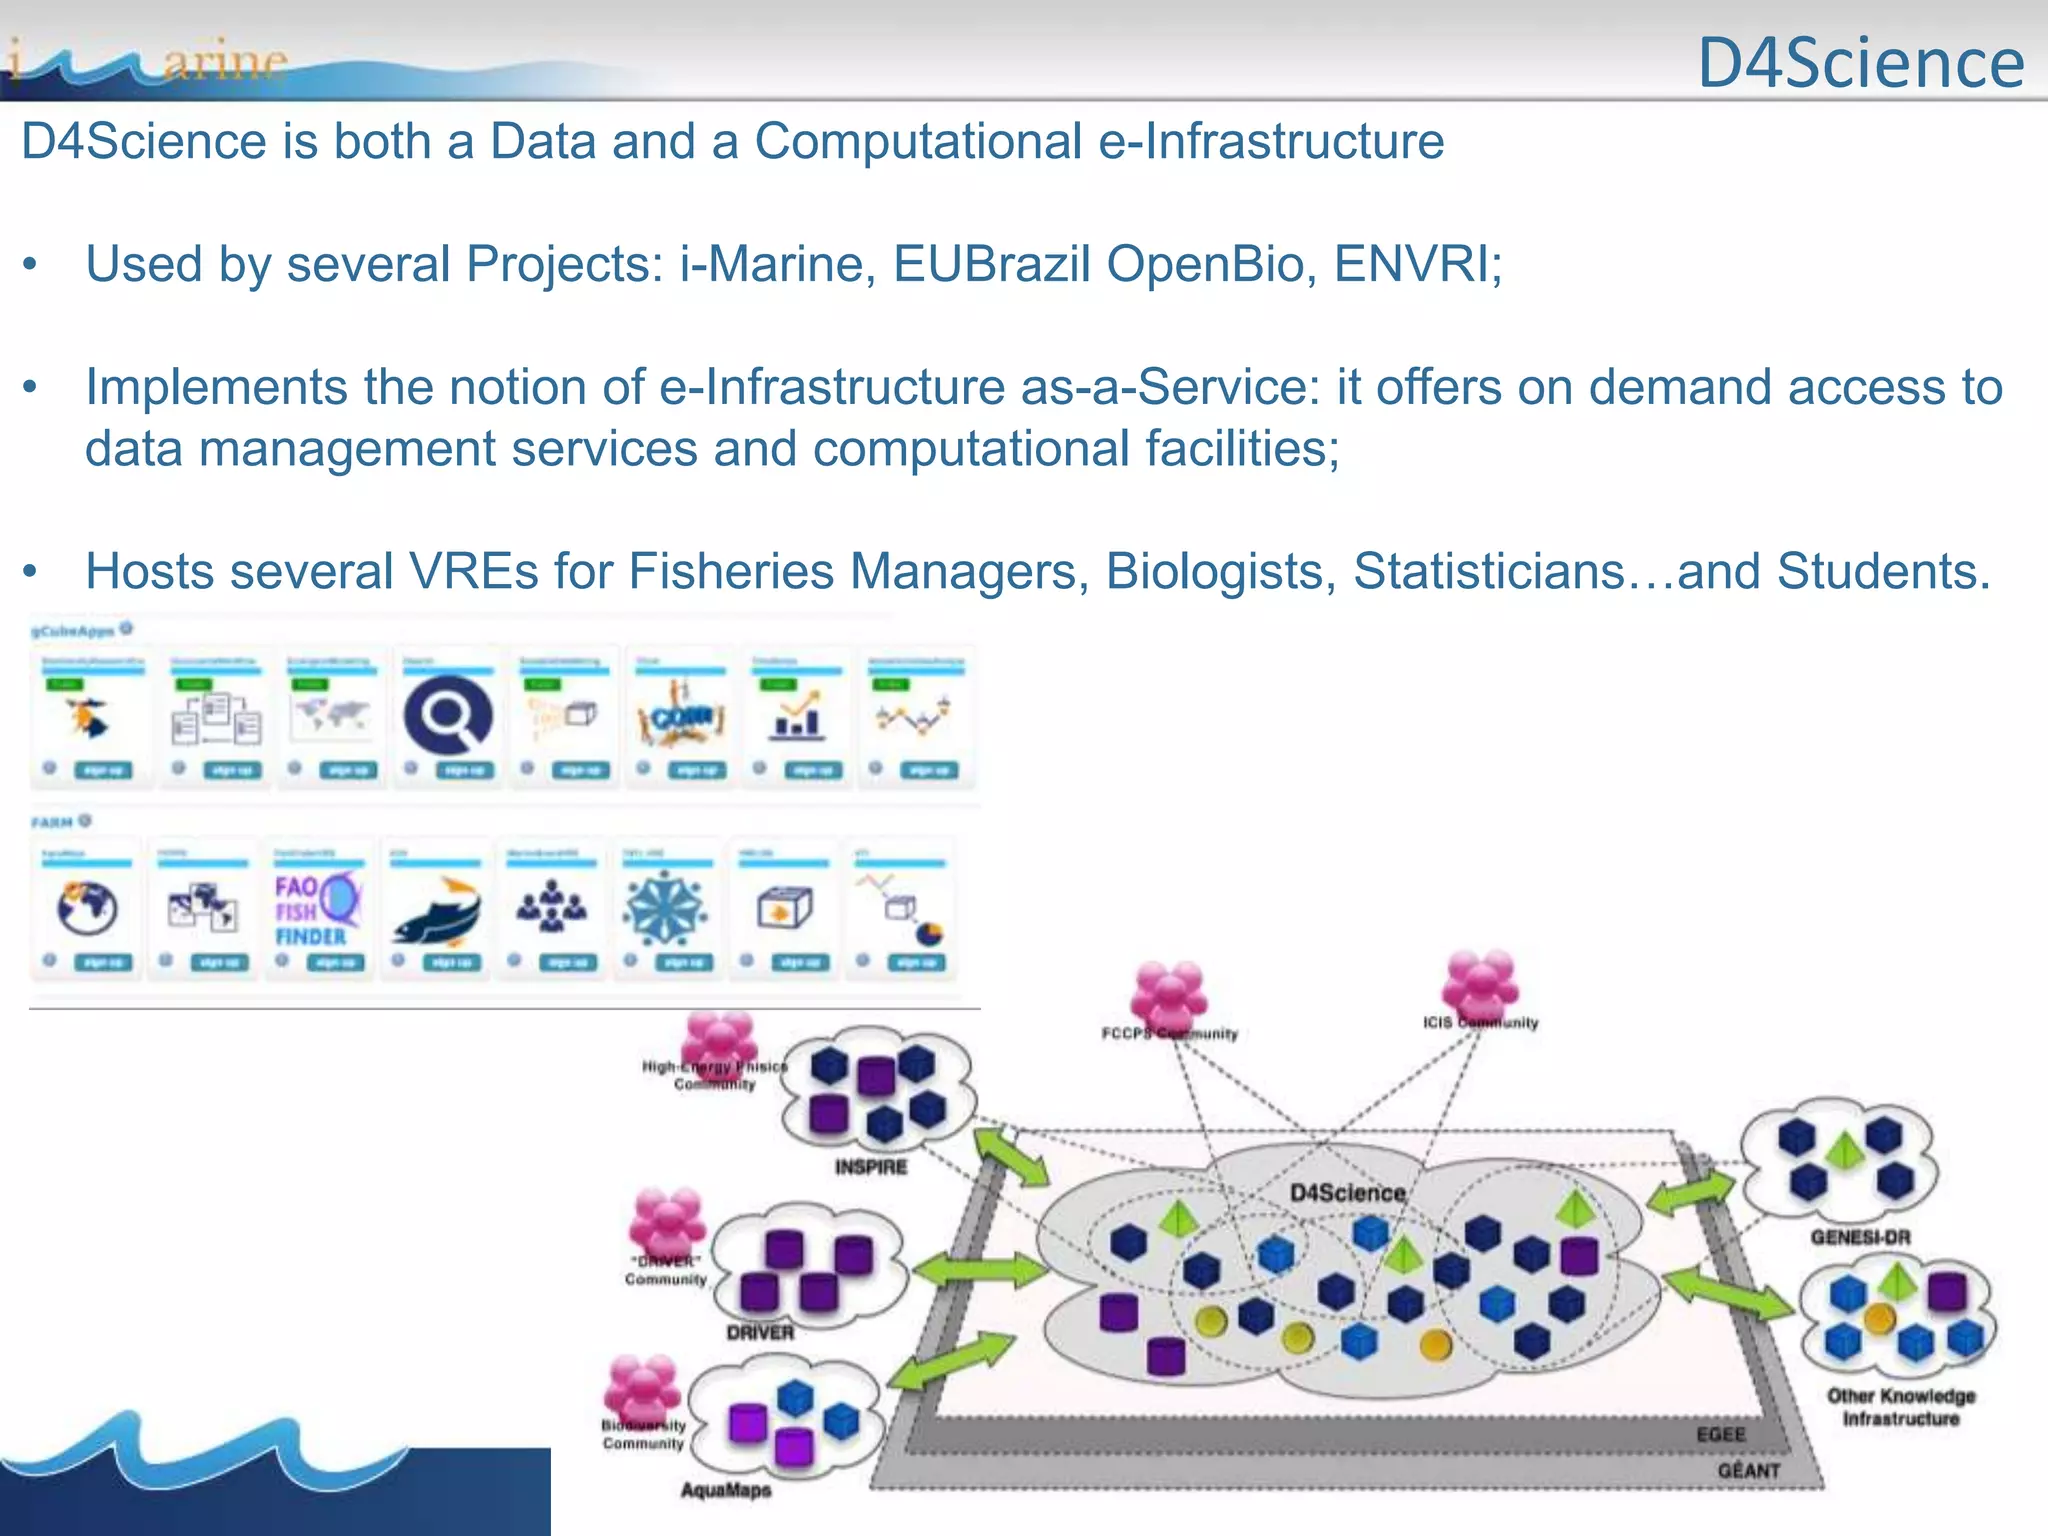
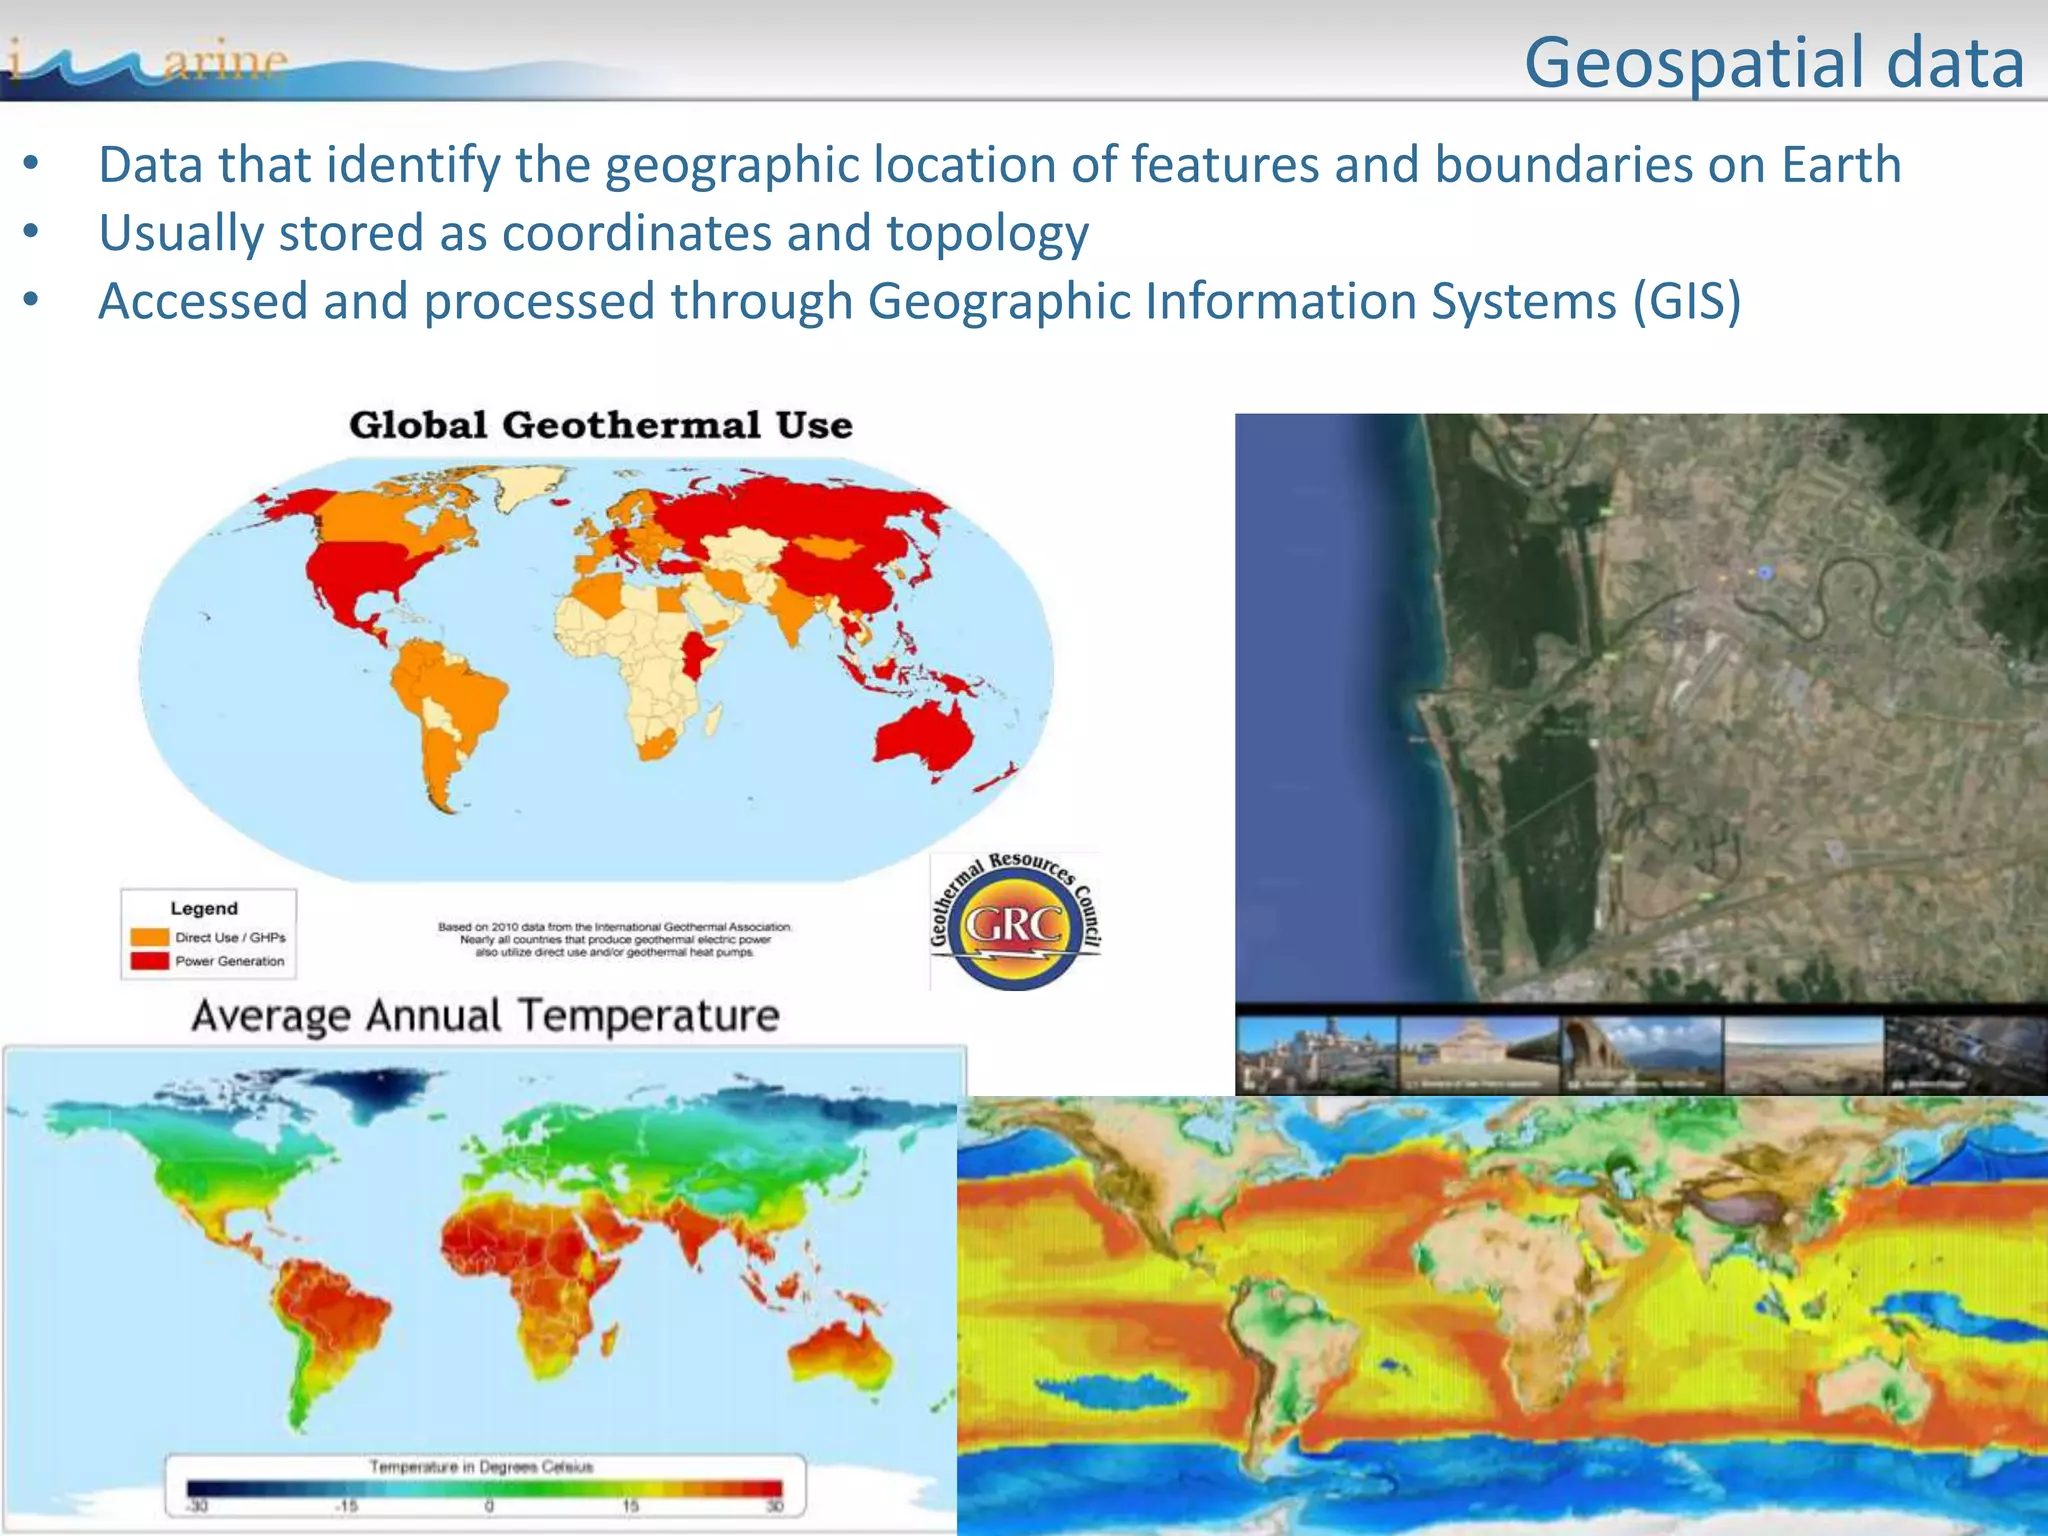
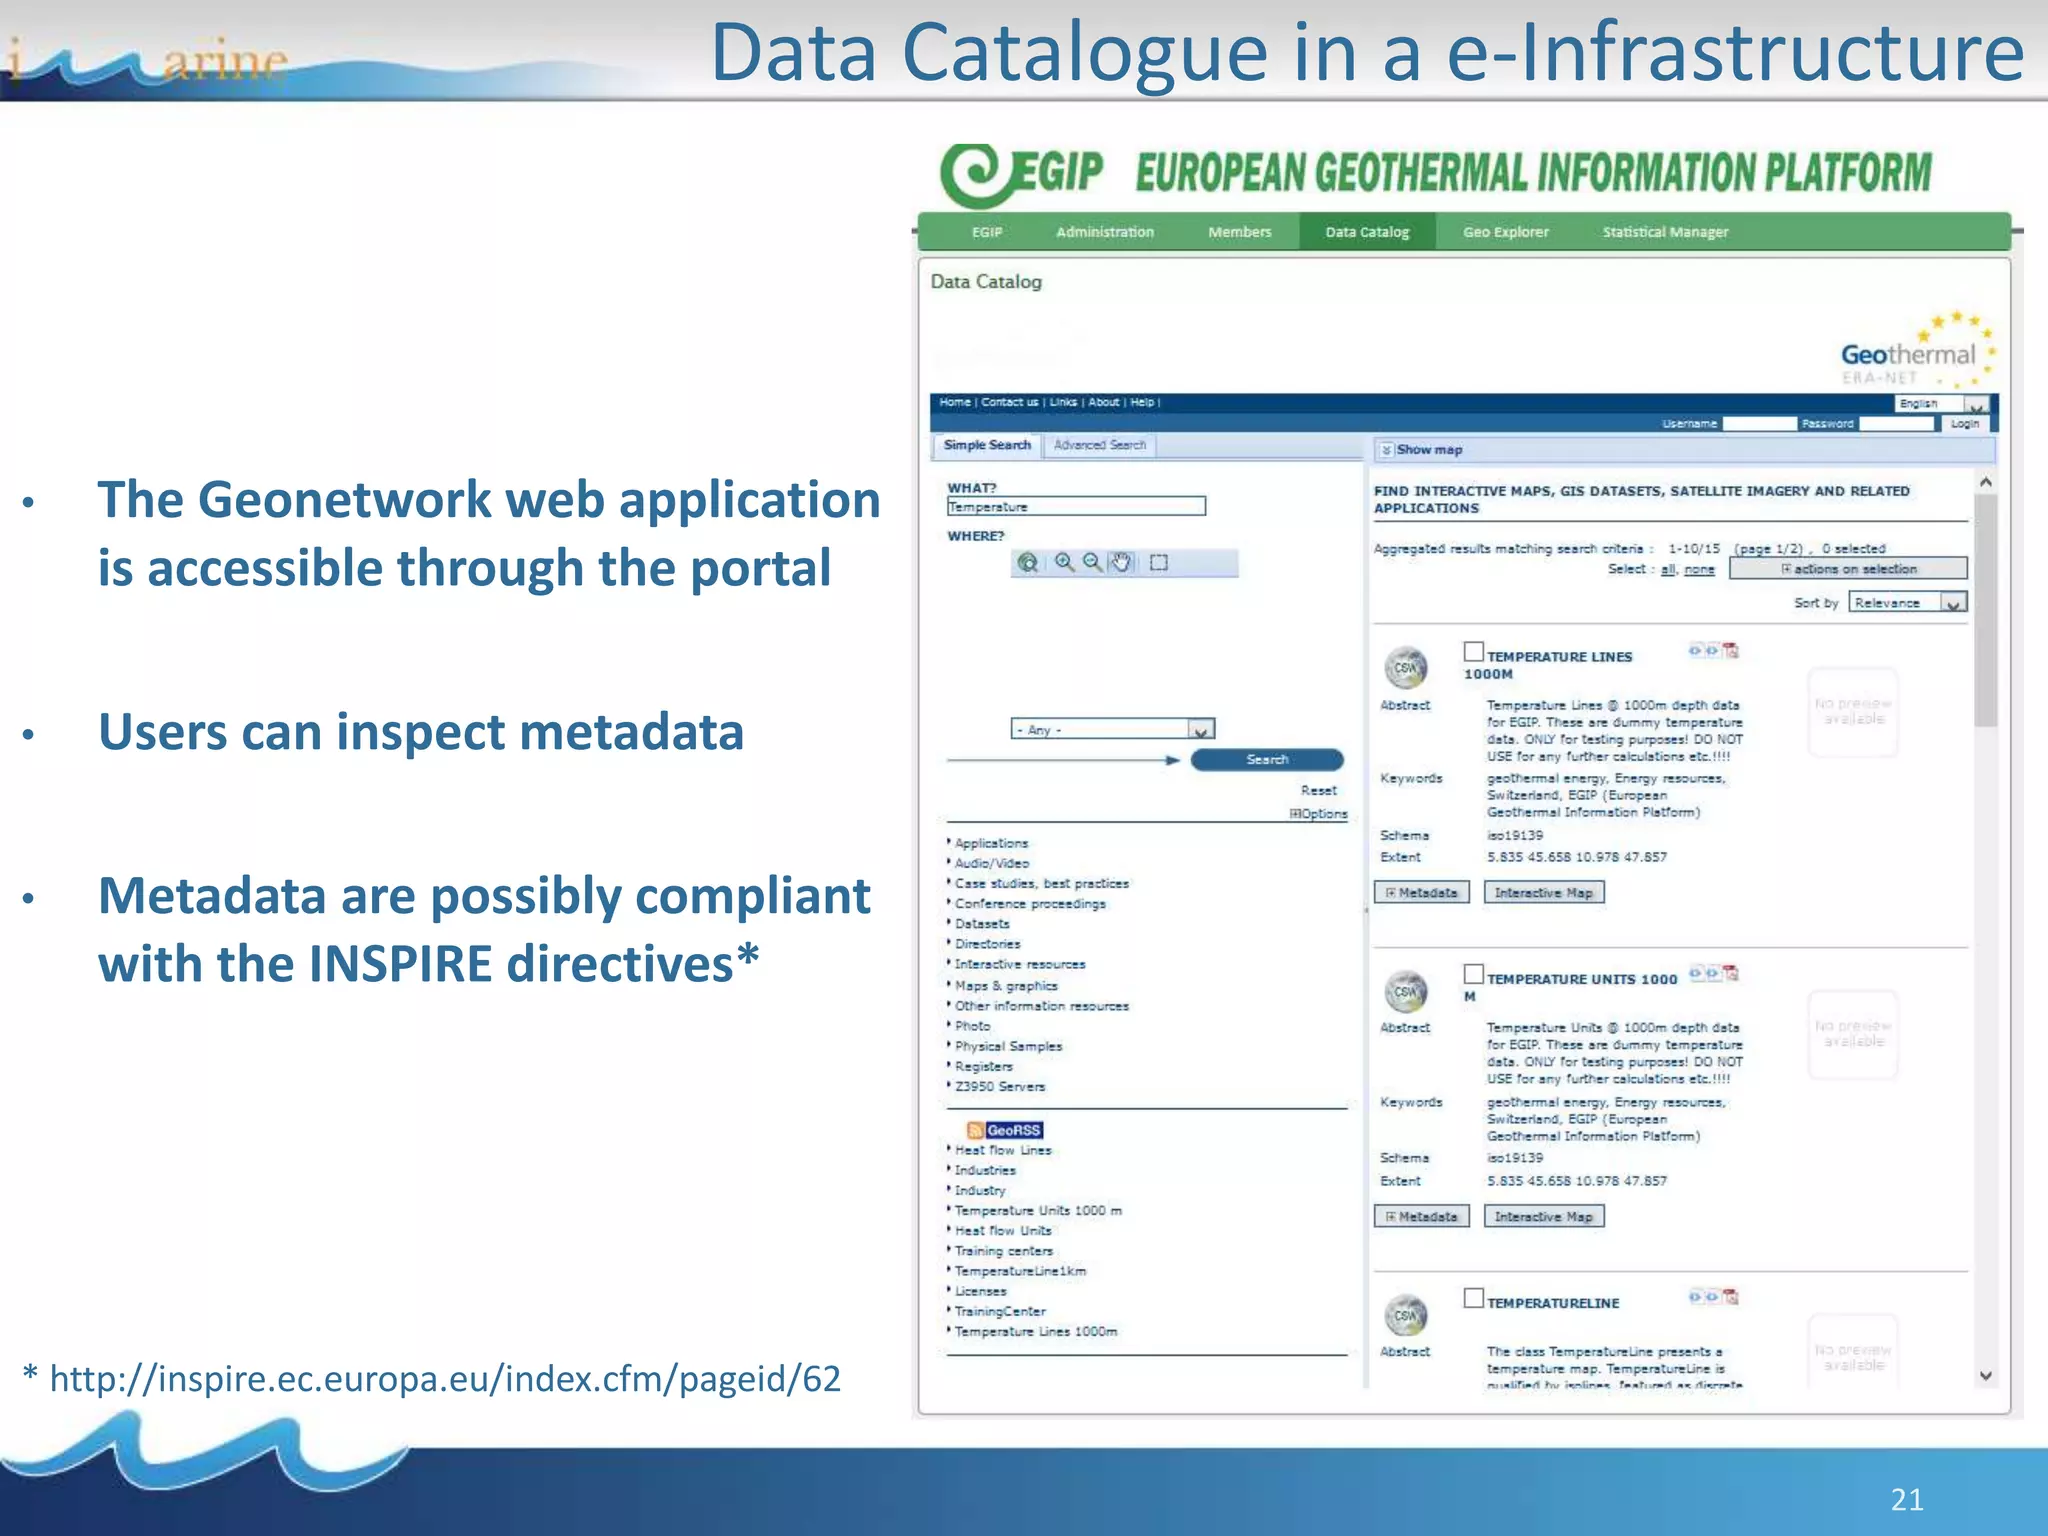
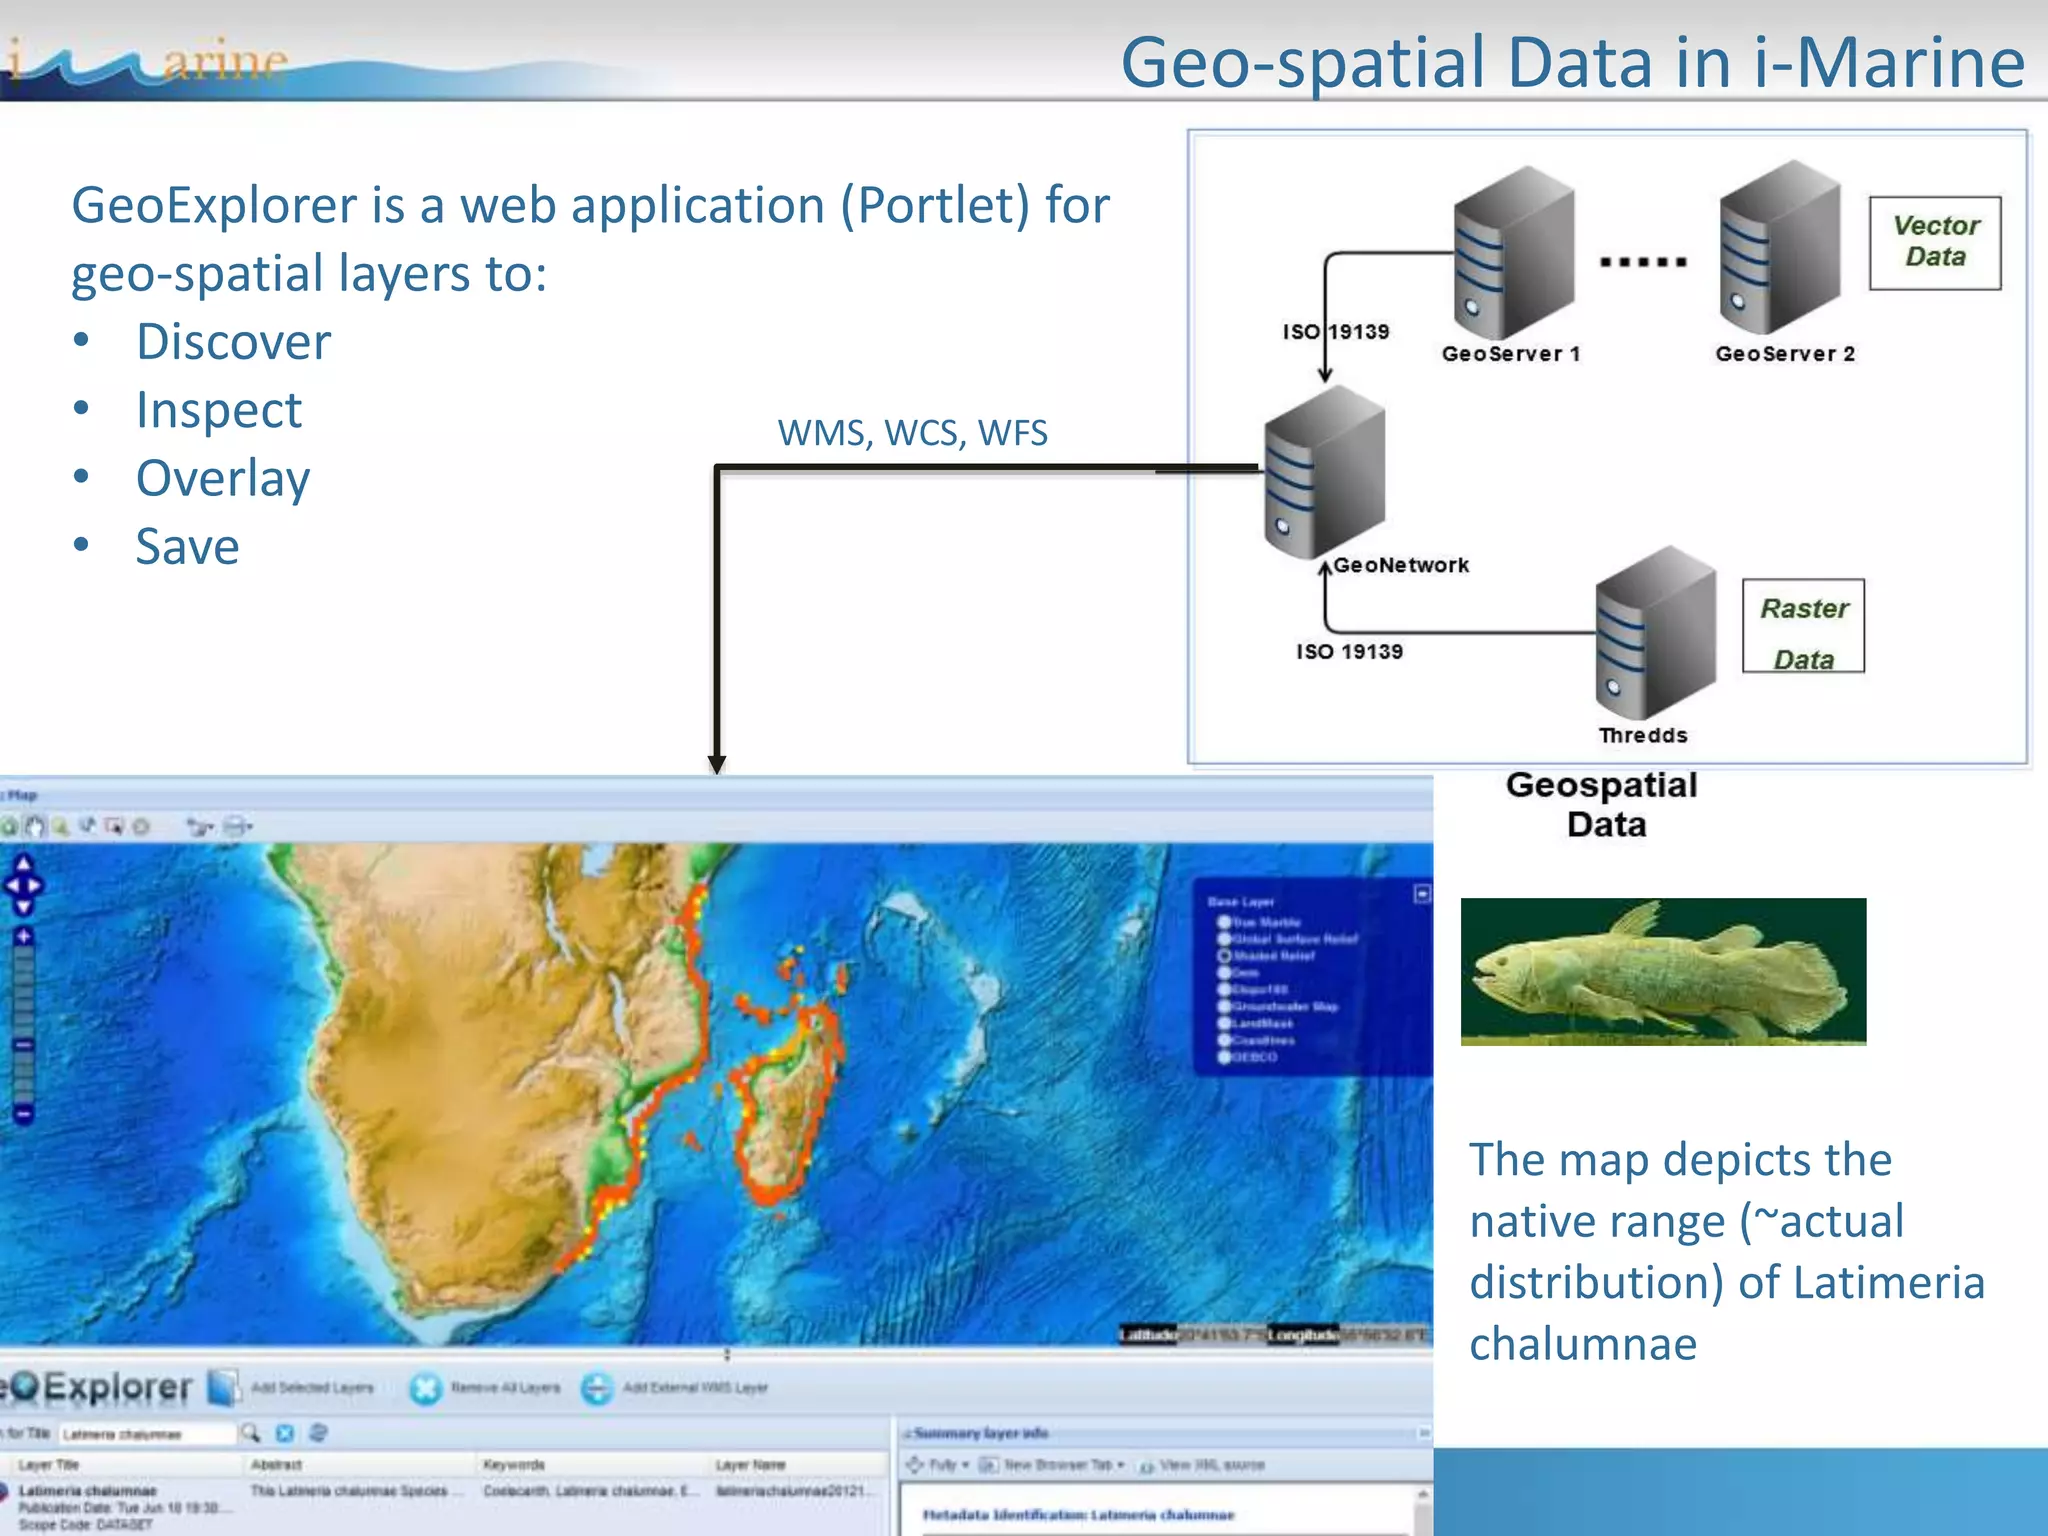
The document discusses the use of e-infrastructures for biodiversity conservation, focusing on tools, platforms, and data management solutions that facilitate international collaboration among researchers. It emphasizes geospatial data handling, including methods for visualization, processing, and the importance of standards set by the Open Geospatial Consortium. A specific case study is presented on the European Geothermal Information Platform (EGIP) which aims to provide accessible geothermal data to stakeholders.


