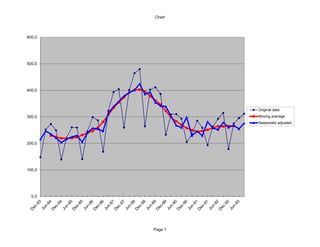
This chart shows three data series: original data, a moving average of the original data, and the original data seasonally adjusted. The y-axis ranges from 0 to 600 and the x-axis is unlabeled. The moving average line smooths out some of the fluctuations in the original data, while the seasonally adjusted data removes seasonal patterns to reveal underlying trends.