Download to read offline
![2
estimation has become the center of the battlegrounds in most, if not all, patent infringement cases.6
Second, reasonable royalties are the predominant measure of damages, accounting for about eighty
percent of the total damages awarded throughout the last decade.7
Methodologies for calculating reasonable royalties that the Federal Circuit8
has adopted largely
fall in two categories.9
First, the analytical approach focuses on infringer’s projection of profit for the
infringing product.10
Reasonable royalties under this approach are estimated from infringer’s extra
profit realized from sales of infringing devices.11
The second, more common approach is the so-called “hypothetical negotiation” or “willing
licensor-willing licensee” approach.12
This approach presumes that the patent claims at issue are valid
and infringed. It then attempts to ascertain the royalty a patentee and an infringer would have agreed to
just before the infringement began. This is an “ex ante licensing negotiation scenario” that willing
parties would have executed a negotiated royalty payment scheme.13
Georgia-Pacific Corp. v. U.S. Plywood Corp. established the legal framework for assessing
reasonable royalties and enumerated fifteen relevant factors to consider.14
The Federal Circuit has
5
The standard for awarding lost profits is established by Panduit Corp v. Stahlin Bros. Fibre Works, Inc., 575 F.2d 1152
(6th Cir. 1978), in which the Federal Circuit has adopted and applied in numerous patent infringement cases. Panduit
provides that the patentee must demonstrate with reasonable probability that bur-for the infringement, it would not have lost
profits. Thus, the patentee must show: (1) demand for the patented product; (2) absence of acceptable non-infringing
substitutes; (3) manufacturing capability to exploit the demand; and (4) the amount of profit the patentee would have made.
Id. at 1156.
6
E.g., Rembrandt Social Media, LP v. Facebook, Inc., 22 F. Supp. 3d 585 (E.D. Va. 2013).
7
BARRY ET AL., supra note 4, at 11. Reasonable royalties constitute eighty-one percent of whole damages awards in
between 2007 and 2012 and seventy-nine percent in between 2001-2006. Id. at 11. During that period, the second most
frequently awarded damages, lost profits, constituted only about thirty percent. Because each form of damages may be
awarded on a non-exclusive base, the totals exceed one hundred percent. Damages awards based on price erosion have
become miniscule.
8
The United States Court of Appeals for the Federal Circuit has exclusive jurisdiction over patent infringement actions
appealed from the district courts. 28 U.S.C. § 1295(a)(1).
9
Lucent Techs. Inc. v. Gateway, Inc., 580 F.3d 1301, 1324–25 (Fed. Cir. 2009).
10
Id. at 1324; TWM Mfg. Co. v. Dura Corp., 789 F.2d 895, 898–900 (Fed. Cir. 1986).
11
TWM Mfg., 789 F.2d at 899 (“[the expert] subtracted the infringer’s usual or acceptable net profit from its anticipated net
profit realized from sales of infringing devices”).
12
Lucent, 580 F.3d at 1324–25.
13
Id. at 1325.
14
318 F. Supp. 1116, 1120 (S.D.N.Y. 1970). Fifteen factors are: (1) royalties the patentee has received for the licensing of
the patent in suit; (2) royalty rates the licensee has paid for the use of other patents comparable to the patent in suit; (3) the
exclusivity and restrictiveness of the license; (4) patentee’s licensing policy to maintain or control patent monopoly by not
licensing the invention to others; (5) the commercial relationship between parties; (6) the effect of selling the patented
specialty in promoting sales of other products; (7) the duration of the patent and the term of the license; (8) the established
profitability of the products made under the patent; (9) advantages of the patented product over the old products; (10) the
commercial aspects of the patented invention; (11) the extent to which the infringer has used the invention; (12) the portion
of the profit customarily allowed for the use of the patent; (13) the portion of the realized profit attributable to the patent; (14)
qualified experts’ testimony; and (15) the outcome from a hypothetical arm’s-length negotiation between parties. Id.](https://image.slidesharecdn.com/ee567b2f-99e5-47e9-9a98-9181450641ed-151116043456-lva1-app6891/75/Conjoint-survey-paper-2-2048.jpg)
![3
adopted Georgia-Pacific analysis as the “legally-required framework.”15
The test is a flexible one: not
all factors are necessarily relevant to the case at bar, nor is any particular factor dispositive.16
A royalty – whether reasonable or unreasonable, or whether structured as a running royalty or a
lump-sum payment – is a product of two distinct quantities: a royalty base and a royalty rate.17
For
example, assume that a patent at issue claims a method of manufacturing a special polymer material.
The patentee/licensor may license the patented technology to a golf ball manufacturer who uses the
method to manufacture and sell golf balls to retailers at a wholesale price of $500 for a box. The
patentee and the manufacturer may enter into a license agreement, which specifies the royalty base to be
the wholesale price and the royalty rate to be 20%. Assuming further that the manufacturer sold 1,000
boxes, the agreement requires the manufacturer to pay 000,100$1000%20500$ =×× as a royalty to the
patentee. The patentee and another manufacturer may agree to use the royalty base as the
manufacturer’s profit margin and apply the royalty rate of 30%. If this manufacturer’s profit margin is
$150 for a box and it sold 2,000 boxes, the patentee is expected to receive royalty payment of
000,90$2000%30150$ =×× .
Although these examples assumed a voluntary, willing licensor-willing licensee scenario, the
same principle applies to post-infringement reasonable royalty calculations. The royalty base represents
“the revenue pool implicated by the infringement,” and the royalty rate accounts the percentage of the
revenue pool “adequate to compensate” the patentee for the infringement.18
Both the base and the rate,
as distinct quantities, must be reasonable to reach the end result of a reasonable royalty.19
A. Royalty Rate
The first two Georgia-Pacific factors examine “royalties the patentee receives for licensing the
patent in suit” and “[t]he rates paid by the licensee for the use of other patents comparable to the patent
15
Lucent, 580 F.3d at 1335.
16
Id.
17
Cornell Univ. Hewlett-Packard Co., 609 F. Supp. 2d 279, 285 (N.D.N.Y. 2009).
18
Id.
19
Id. (“An over-inclusive royalty base including revenues from the sale of non-infringing components is not permissible
simply because the royalty rate is adjustable.” (citing Rite-Hite Corp. v. Kelley Co., 56 F.3d 1538, 1549 n.9 (Fed. Cir. 1995)));
see Virnetx, Inc. v. Cisco Sys., 767 F.2d 1308, 1328–30 (Fed. Cir. 2014) (holding that the expert testimony on royalty base
was inadmissible and should have been excluded, whereas finding that the district court did not abuse its discretion in
permitting the testimony on royalty rate estimation). Mathematically, infinite combinations of the royalty base and rate are
possible to produce the same royalty payment. For example, 1% of $100 and 10% of $10 both result in $1 royalty. It
illustrates dangers of how easily one can manipulate the base and rate to reach the value that one conclusively has presumed
to be reasonable.](https://image.slidesharecdn.com/ee567b2f-99e5-47e9-9a98-9181450641ed-151116043456-lva1-app6891/75/Conjoint-survey-paper-3-2048.jpg)
![4
in suit.”20
Until recently, however, the so-called “25% rule of thumb” has been widely used by the
parties and accepted (or at least passively tolerated) by the court. It assumed, as a rule of thumb, that
“25% of the value of the product would go to the patent owner and the other 75% would remain with
[the infringer/licensee],” because the infringer/licensee also has substantially contributed to the
development or realization of the commercialization of the product embodying the patented
technology.21
At first glance, automatically allocating a quarter of the product’s value to the patentee is
methodologically unsound, even considering that 25% is but a temporary, adjustable baseline rate.
Simply stated, the 25% rule of thumb’s rationale (or lack thereof) does not reach the Daubert standard.22
The Federal Circuit in Uniloc conceded that it has tolerated the use of the 25% rule.23
The
Circuit court noted that lower courts have invariably admitted royalty evidence based on the 25% rule,
because of its widespread acceptance or because its admissibility was uncontested.24
Experts, in turn,
justified the use of the rule because courts have accepted the rule as an appropriate methodology in
determining damages.25
At last, Uniloc concluded that mere widespread use of the 25% rule is not
sufficient to pass the muster under Daubert and the Federal Rules of Evidence, and consequently held
that testimony based on the 25% rule inadmissible, because “it fails to tie a reasonable royalty base to
the facts of the case at issue.”26
B. Royalty Base
Likewise, the Federal Circuit has reviewed the reasonable royalty base calculation with
heightened scrutiny, demanding a scientific methodology that reflects case-specific, real-world data.
What have particularly troubled the court are the patentee’s attempts to inflate the royalty base.
Intuitively, the maximum royalty base that the patentee could seek is the entire value of the product that
embodies the patented feature. This so-called “entire market value rule” (EMVR) permits recovery of
damages based on the value of the entire product even though such product embodies many features not
encompassed by the patent at issue.
20
Georgia-Pacific Corp. v. U.S. Plywood Corp., 318 F. Supp. 1116, 1120 (S.D.N.Y. 1970).
21
Uniloc USA Inc. v. Microsoft Corp., 632 F.3d 1292, 1318 (Fed. Cir. 2011).
22
It is quite surprising that the Federal Circuit abolished the 25% rule of thumb in 2011 in Uniloc, about two decades after
the Supreme Court decided Daubert v. Merrell Dow Pharm., Inc., 509 U.S. 579 (1993). Measuring from Kumho Tire Co.,
Ltd. v. Carmichael, 526 U.S. 137 (1999), more than a decade has passed.
23
Uniloc, 632 F.3d at 1314 (“court has passively tolerated [25% rule’s] use where its acceptability has not been the focus of
the case . . . or where the parties disputed only the percentage to be applied (i.e., one-quarter to one-third), but agreed as to
the rule’s appropriateness”) (internal citations omitted).
24
Id.
25
Id. at 1311.
26
Id. at 1315.](https://image.slidesharecdn.com/ee567b2f-99e5-47e9-9a98-9181450641ed-151116043456-lva1-app6891/75/Conjoint-survey-paper-4-2048.jpg)
![5
The EMVR is permissible under certain circumstances. The value of the entire product may
reasonably represent the value of the patented feature if the product contains only one patented feature
or the patented feature is the single most important feature that draws a substantial consumer demand.
Assume that a product contains ten claimed inventions, one patentee holds all of them, and the accused
is found to be infringing all ten valid patents. In such a case, while it may be difficult to isolate the
estimated value of each patented feature, the patentee may be allowed to base her loyalty calculation on
the value of the entire product.
However, such a hypothetical situation is an exception rather than the norm in most of today’s
patent infringement suits where the accused products are multi-component, multi-functional systems.
For example, a smartphone contains about 250,000 patented technologies.27
Of course, many of the
quarter million patents are licensed (e.g., under reasonable and non-discriminatory licensing agreements
or by cross-licenses), have been expired or invalidated, probably should not have been issued at all, or
will likely be invalidated. The point is that most of today’s products or services consist of several, if not
hundreds or thousands of, patented invention.
As early as late nineteenth century, courts recognized the reality and risk of over-inclusiveness of
using the EMVR.28
The use of the infringing product’s entire market value as a royalty base is allowed
“only where the patented feature creates the ‘basis for customer demand’ or ‘substantially create[s] the
value of the component parts.’”29
Specifically, using the entire market value as a royalty base requires
adequate proof of following conditions: (1) the infringing components must be the basis for consumer
demand for the entire product, beyond the claimed invention; (2) the individual infringing and non-
infringing components must be sold together; and (3) the individual infringing and non-infringing
components must be analogous to a single functioning unit.30
Where the EMVR is inappropriate and exaggerates the royalty base, the royalty base must be tied
to the patented feature at issue. As required under Daubert and Federal Rules of Evidence, after all,
27
Innovation, TECHDIRT, There Are 250,000 Active Patents That Impact Smartphones; Representing One In Six Active
Patents Today, https://www.techdirt.com/blog/innovation/articles/20121017/10480520734/there-are-250000-active-patents-
that-impact-smartphones-representing-one-six-active-patents-today.shtml (last visited Apr. 2, 2015).
28
Lucent Techs. Inc. v. Gateway, Inc., 580 F.3d 1301, 1336–37 (Fed. Cir. 2009) (tracing the origins of the entire market
value rule to several Supreme Court cases).
29
Uniloc, 632 F.3d at 1318 (quoting Lucent, 580 F.3d at 1336; Rite-Hite Corp. v. Kelley Co., 56 F.3d 1538, 1549–50 (Fed.
Cir. 1995)) (emphasis added).
30
Cornell Univ. v. Hewlett-Packard Co., 609 F. Supp. 2d 279, 286–87 (N.D.N.Y. 2009).](https://image.slidesharecdn.com/ee567b2f-99e5-47e9-9a98-9181450641ed-151116043456-lva1-app6891/75/Conjoint-survey-paper-5-2048.jpg)
![10
B. Bundle of Attributes
Conjoint analysis conceptualizes products or services as bundles of attributes. Each attribute can
have one or more levels. The end product is assumed to be characterized solely by the set of attributes
with designated levels embodied in that product.
For example, a consumer who considers buying a laptop may consider following four attributes:
brand, display size, price, and storage type, to name but a few. Each attribute can have one or more
levels, and the levels can be either quantitative or qualitative. A brand may have four qualitative levels,
e.g., Apple, Dell, Lenovo, and Toshiba. Similarly, a storage type may consist of two qualitative levels,
e.g., Hard Disk Drive (HDD) and Solid State Drive (SSD). Three quantitative levels may comprise an
attribute display size, e.g., less than 13-inch, 14-to-16 inch, and 17-inch or larger. A price range may be
divided into three levels, e.g., less than $1,000, $1,000 to $1,200, and over $1,200.
A combination of attributes and corresponding levels, which referred to as a profile,
characterizes each laptop. One laptop may be an Apple laptop with 13-inch display and SSD storage,
sold at $1,299 (“Profile 00”). Another laptop may be a Lenovo laptop with 14-inch display and HDD
storage, sold at $1,099 (“Profile 01”). In theory, this example can generate up to 72 ( 2334 ××× )
profiles.
Conjoint analysis assumes that each consumer has a set of weights (or values) in units of utility
associated with each level of each attribute. They are referred to as partworth.51
Each partworth
contributes to the total value (or utility) of a product.52
Consumers are assumed to behave rationally in a
sense that they would choose the product with the maximum utility.53
Put differently, what an
individual selects is deemed to have the maximum utility to that individual among the available
alternatives. Thus, conjoint analysis is “consistent with economic and consumer-behavior theories of
approximate utility maximization.”54
Using the same laptop example, if a consumer was asked to choose one model from the 72
alternative laptops, and if Profile 00 was chosen, it is assumed that her choice has revealed or stated that
the Profile 00 gives her the maximum utility among 72 available alternatives. Comparing just two
51
Partworth and utility are used interchangeably. Strictly speaking, however, partworths are measured in units of utility.
For example, the partworth of the HDD is ten (units of utility) and that of the SDD is fifteen (units of utility).
52
The way partworth contributes to the total utility differs depending on how one models the utility function. See infra Part
III.
53
MOSHE BEN-AKIVA & STEVEN R. LERMAN, DISCRETE CHOICE ANALYSIS: THEORY AND APPLICATION TO TRAVEL DEMAND
38 (Marvin L. Manheim ed., 1985).
54
Expert Report of John R. Hauser at 11, Apple, Inc. v. Samsung Electronics Co., Ltd., No. 11–cv–01846–LHK (N.D. Cal.
July 26, 2012), ECF No. 1363–1 [hereinafter Hauser Report].](https://image.slidesharecdn.com/ee567b2f-99e5-47e9-9a98-9181450641ed-151116043456-lva1-app6891/75/Conjoint-survey-paper-10-2048.jpg)
![12
Figure 1. Three types of the utility function.60
Before jumping to Part II, it is worth mentioning briefly why marketing professionals prefer a
seemingly complex conjoint survey to a simple, direct questioning to isolate and assess the value of a
particular feature from a multi-component system.
D. Advantage & Validity
Academics recognize the unreliability of direct questioning to price a subject matter. One study
in particular shows that what a respondent says how she would value differs from how she actually
reacts. A classic example is a survey conducted on MBA students regarding their career choice.61
When asked directly prior to making decisions, they ranked salary as the sixth most important factor in
their career choice.62
However, salary was the most important factor influencing their choice as the
conjoint analysis analyzed after they actually had accepted a position.63
This study has made researchers
doubt the reliability of the data obtained from direct questioning. Academics also recognize that focus
bias (or hypothetical bias, which is similar to a leading question),64
upward bias for socially sensitive
60
Green et al., supra note 45, at S60 (originally from Green & Srinivasan, supra note 58, at 106).
61
Expert Report of Dr. V. Srinivasan (Blue-ray Players) at 7, TV Interactive Data Corp. v. Sony Corp., No. 4:10–cv–00475–
PJH (N.D. Cal. Jan. 21, 2013), ECF No. 580–1 [hereinafter Srinivasan Report] (citing David B. Montgomery, Conjoint
Calibration of the Customer/Competitor Interface in Industrial Markets, in INDUSTRIAL MARKETING: A GERMAN-AMERICAN
PERSPECTIVE 297–319 (Klaus Backhaus & David T. Wilson eds., 1985)).
62
Id.
63
Id.
64
Sentius Int’l, LLC v. Microsoft Corp., No. 5:13–cv–00825–PSG, 2015 U.S. Dist. LEXIS 8782, at *19–20 (N.D. Cal. Jan.
23, 2015). In Sentius, the survey expert recognized that the respondents might have overestimated their willingness-to-pay
for a particular feature of a product when answering direct open-ended questions. Id. at * 20. Therefore, the expert used a
calibration factor of 1.46 to adjust the respondents’ overestimation. Id.](https://image.slidesharecdn.com/ee567b2f-99e5-47e9-9a98-9181450641ed-151116043456-lva1-app6891/75/Conjoint-survey-paper-12-2048.jpg)
![15
A. Hypo74
A car manufacturer, MANU, is planning to launch a new model that uses light-emitting diodes
(LEDs) on its headlight. Before investing a chunk of money on R&D and implementation, MANU
wants to know how consumers would value its new model with LED headlights. It determines that only
three features would influence consumers’ decision-making. The three attributes MANU chooses are: (1)
whether the headlights are LEDs; (2) fuel efficiency as measured by mile-per-gallon (mpg); and (3)
price. It decides to test for two levels of the fuel efficiency: 30 mpg and 35 mpg. Price levels are set at
$30,000, $32,000, and $34,000, as MANU’s new model targets in that price range.
Table 1 summarizes three attributes and each level of the corresponding attributes. The first
column indicates that, for convenience, each level of an attribute will be coded with numbers 0, 1, or 2.
Accordingly, each mode/profile can be described by a set of codes. For example, a model that does not
have LEDs (“0”), with fuel efficiency of 35 mpg (“1”), and with a price tag of $32,000 (“1”)
corresponds to (0, 1, 1). Similarly, a model with LEDs and 30 mpg, and sold at $34,000 is represented
by (1, 0, 2).
Table 1. Attributes and levels for MANU cars.
Attributes/Levels LEDs Fuel Efficiency [mpg] Price [$]
0 No 30 30,000
1 Yes 35 32,000
2 34,000
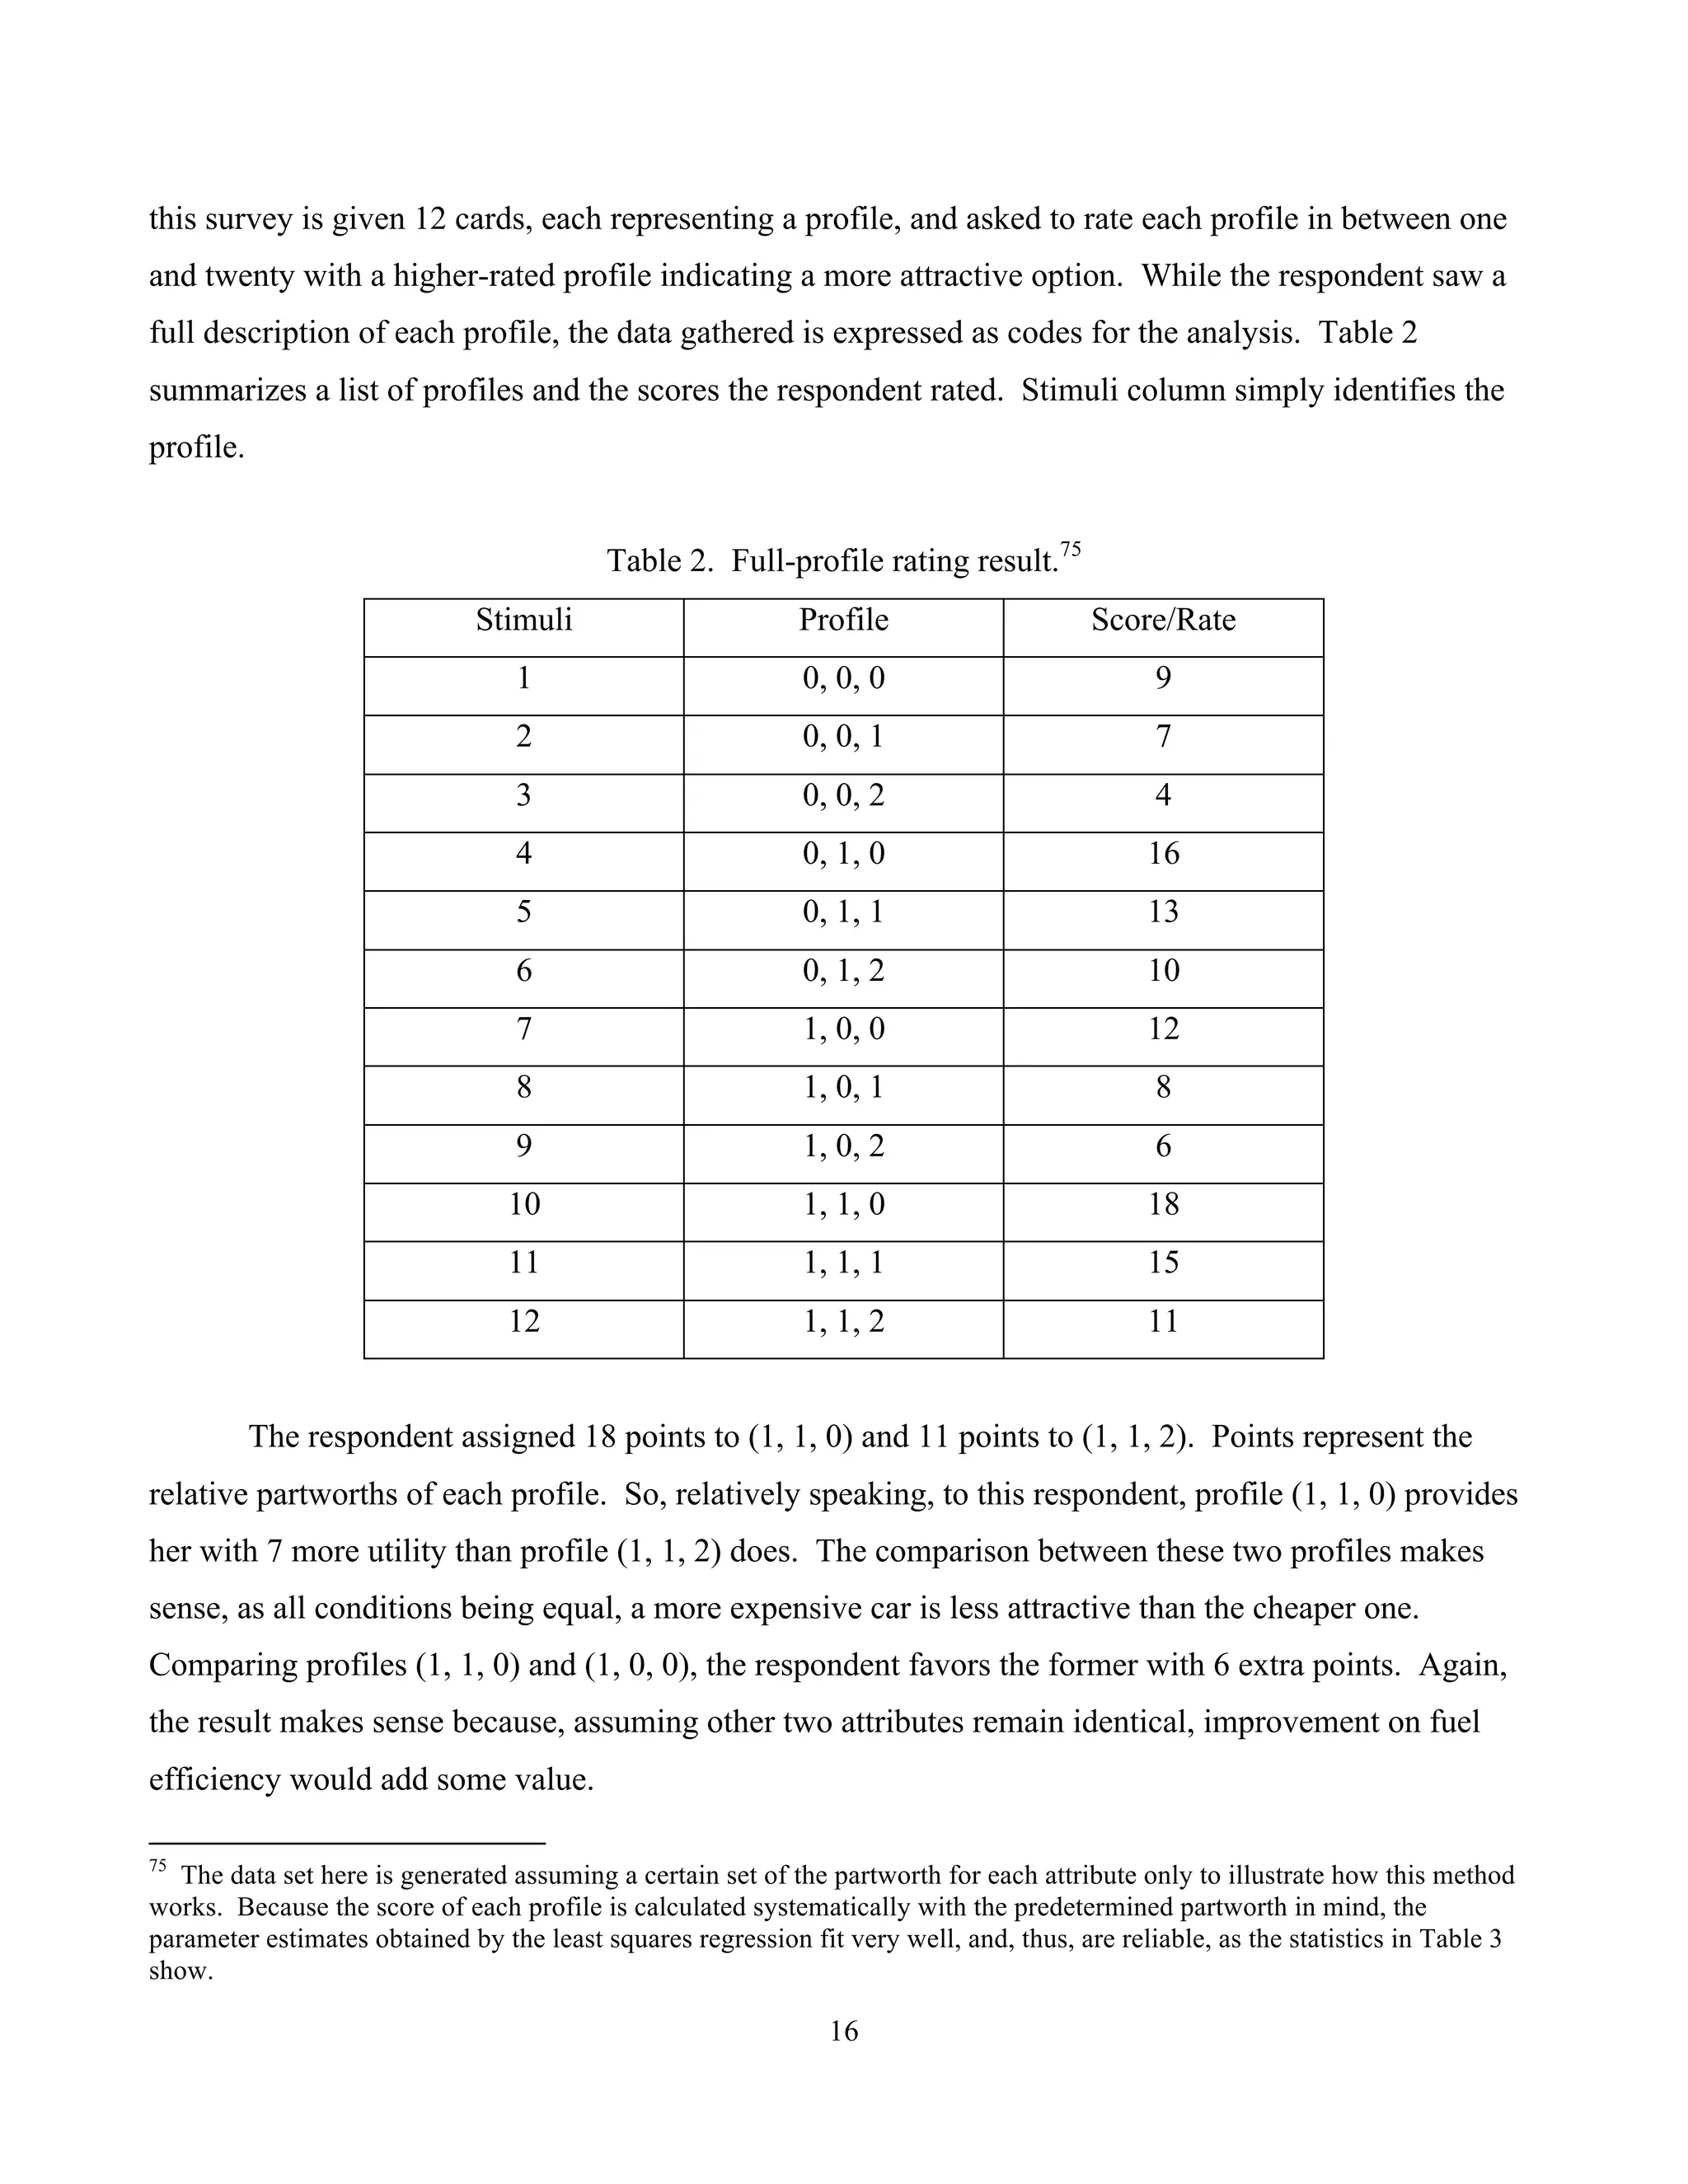
B. Full-Profile Rating Model
The combination of the attributes and levels can generate up to 12 ( 322 ×× ) profiles. In a full-
profile survey, respondents are shown a set of cards that fully describes the profile. Here, each card
describes: whether the headlights are made of LEDs; whether the fuel efficiency is 30 mpg or 35 mpg;
and the price of the car as one of the three amounts – $30,000, $32,000, or $34,000. The respondent in
74
The same fact pattern can be used in the context of a patent infringement suit, where the patentee attempts to evaluate the
value of the LED headlights. For example, an inventor INVE has a patent that claims a method of manufacturing LEDs.
MANU sells a model that INVE thinks incorporates the LEDs manufactured by the method claimed in his patent. While
MANU offers sub-models with a range of prices and other features, INVE cannot be certain about the value of the LED
headlights as all MANU models use the same LED headlights INVE thinks infringing. INVE conducts a conjoint survey
assuming that only the same three attributes characterize MANU cars and affect consumers’ purchasing decision.](https://image.slidesharecdn.com/ee567b2f-99e5-47e9-9a98-9181450641ed-151116043456-lva1-app6891/75/Conjoint-survey-paper-15-2048.jpg)
![20
coefficient. For example, the 95% confidence interval for LEDβ is (1.03577, 2.23090) and icePrβ is (-
3.52654, -2.77346). Both intervals do not include zero.
In addition to the estimate of the reliability of the parameter estimates, the regression result also
provides a measure of the overall goodness of fit, i.e., how well the regression equation fits the data. R-
squared (or 2
R ) is a statistic that “measures the percentage of variation in the dependent variable that is
accounted for by all the explanatory variables.”86
Its value ranges from 0 (the explanatory variables
explain none of the variation of the dependent variable) to 1 (the explanatory variables explain all of the
variation of the dependent variable). While there is a no clear-cut level that makes the model
satisfactory, a high 2
R is favored.87
In this example, 2
R is very high (0.99393), which means that the
three attributes explain more than 99% of the variation in this particular respondent’s rating (and total
utility).
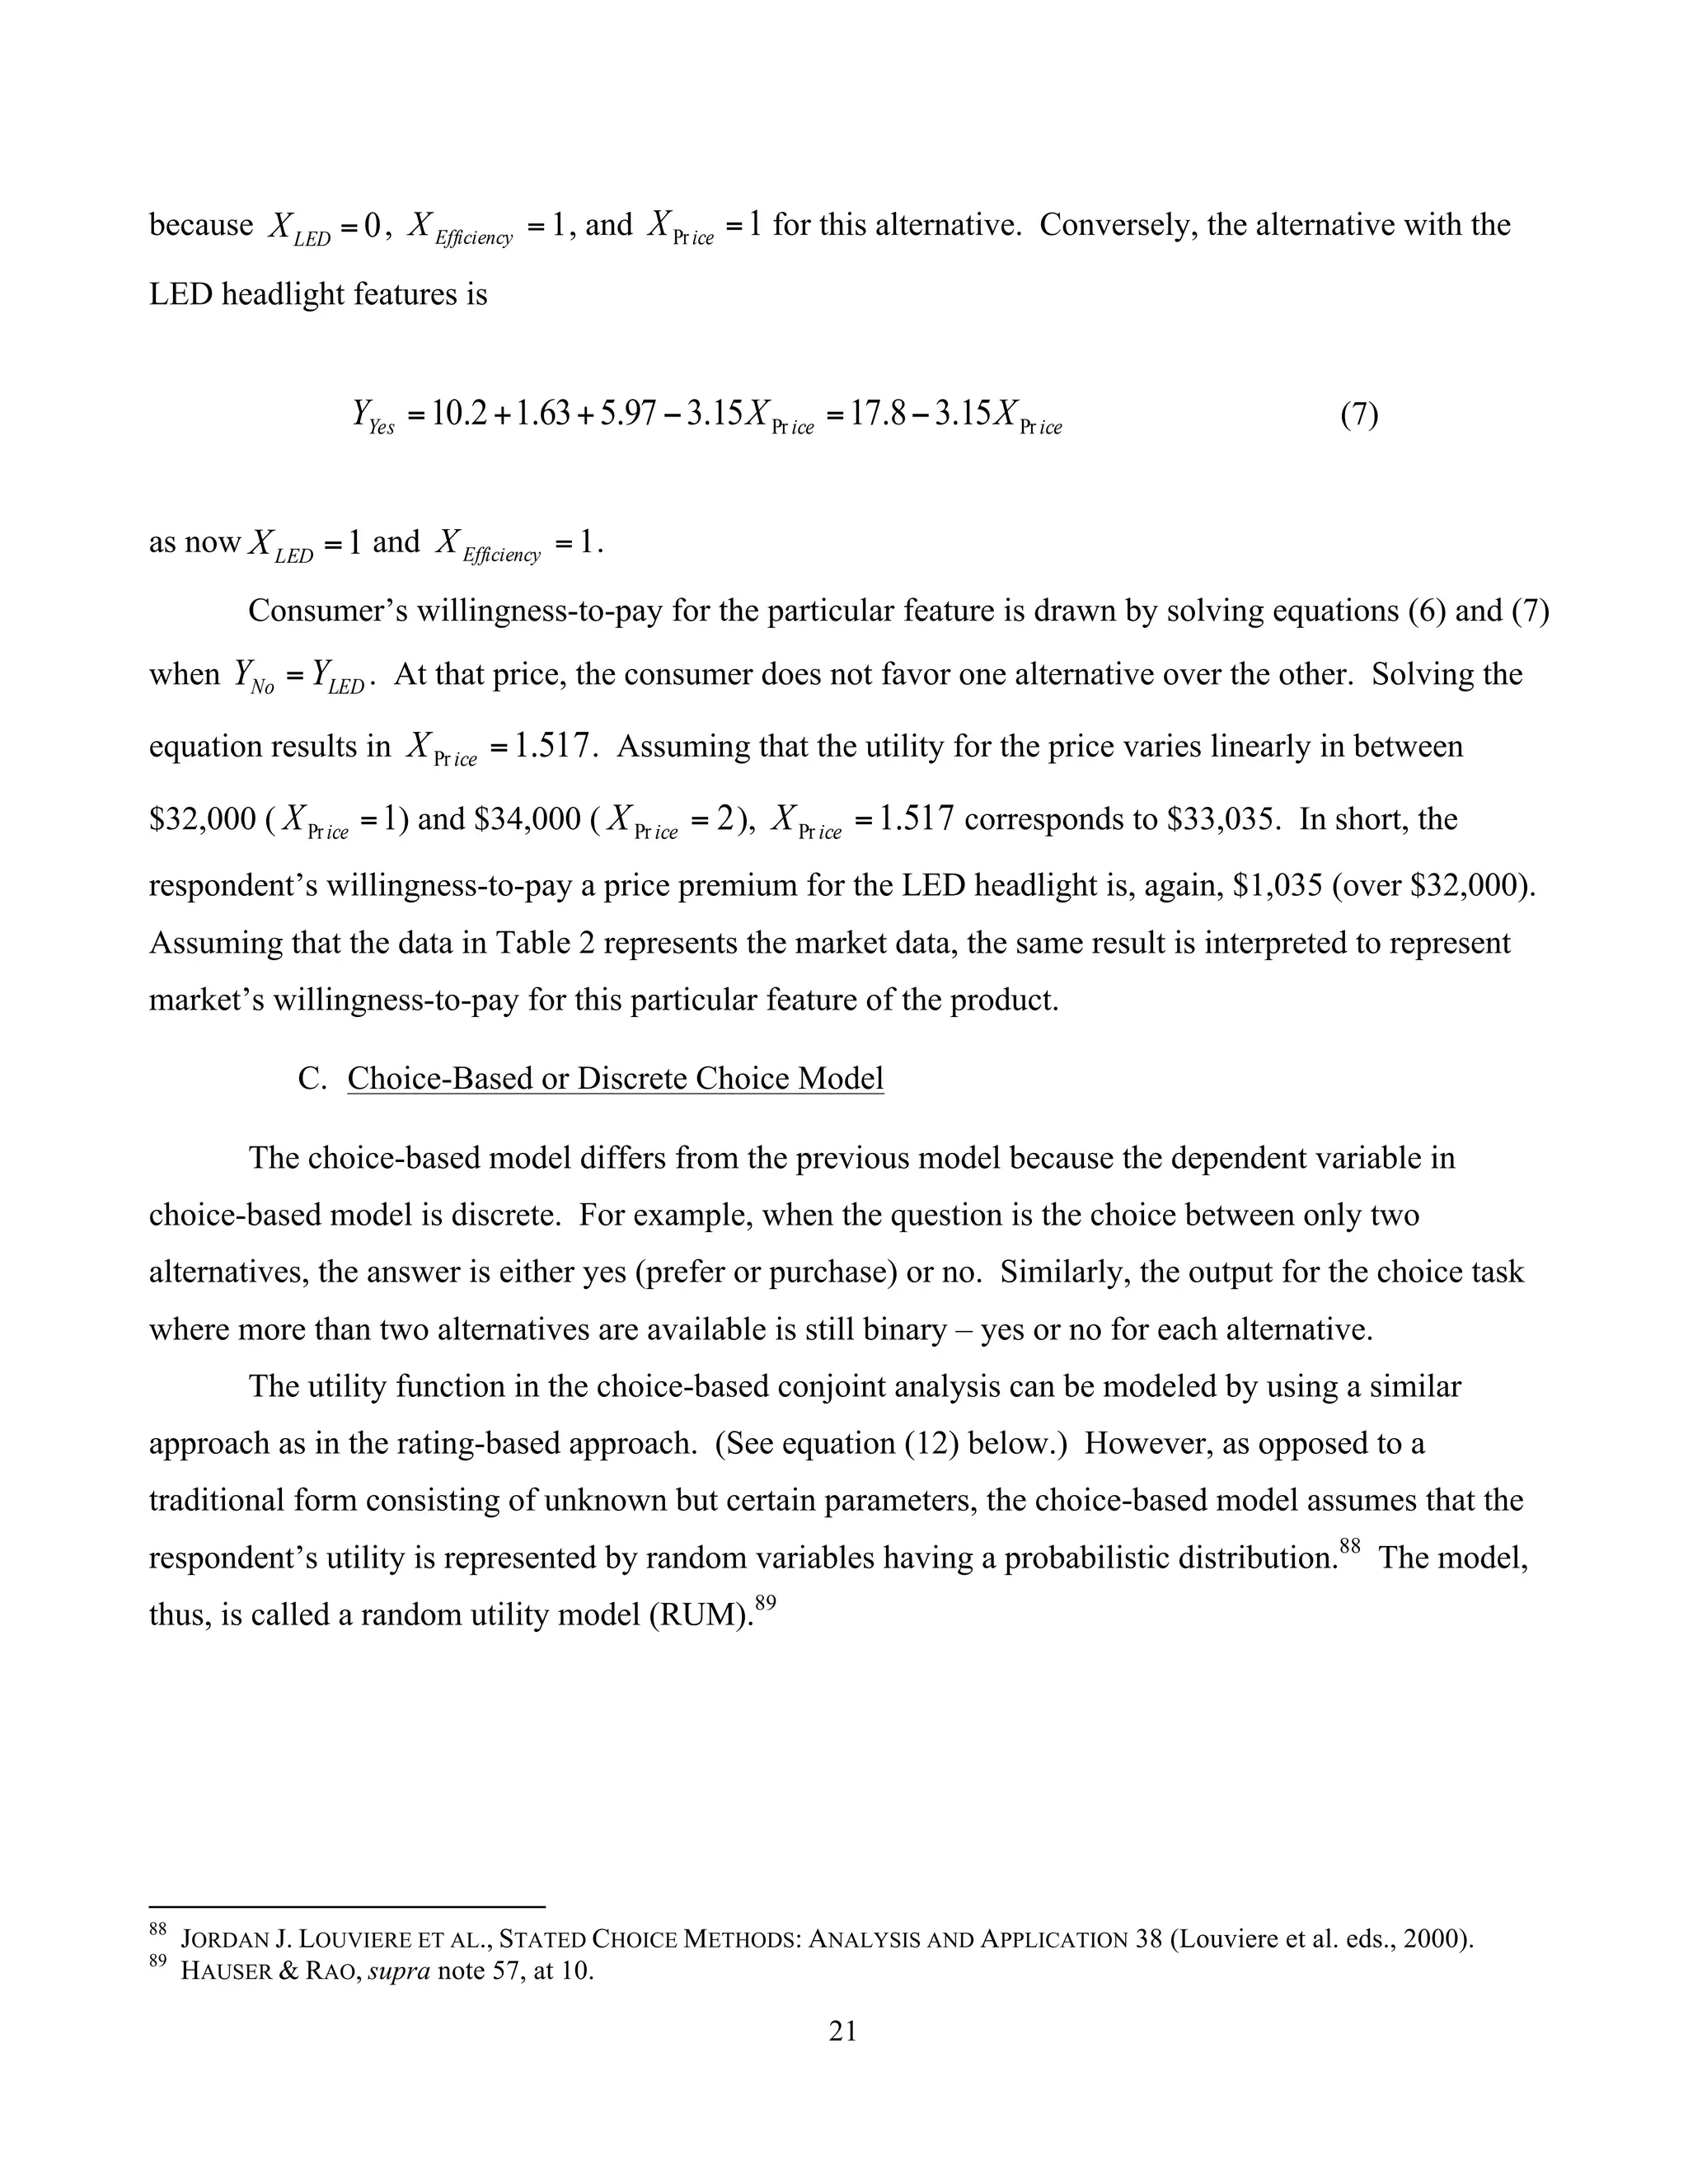
From Table 3 and equation (5), this respondent’s willingness-to-pay for the LED headlights in
MANU’s car can be derived. 15.3Pr −=iceβ means that the increase in price from $30,000 to $32,000
(or from $32,000 to $34,000) decreases the relative worth of the car at the rate of 3.15 units. That is,
$2,000 corresponds to the partworth of 3.15 units, and one unit of partworth represents
util
util
15.3
000,2$]/[$635 = . As the respondent’s utility with the LED headlights increase by 1.63
units, this adds 035,1$]/[$635][63.1 =× utilutil worth of value to the respondent. Thus, this
respondent’s willingness-to-pay for the LED headlights is $1,035 (when the price of the car ranges in
between $30,000 and $34,000).
A different approach would lead to the same result. Here, the task is to estimate the price
premium the respondent would be willing-to-pay for the LED headlights. Assume that the base model
has 35 mpg with a price tag at $32,000. The one model that does not have the LED headlight feature is
described by using equation (5) as
02.1315.397.52.10 =−+=NoY (6)
86
Id. at 345.
87
Id.](https://image.slidesharecdn.com/ee567b2f-99e5-47e9-9a98-9181450641ed-151116043456-lva1-app6891/75/Conjoint-survey-paper-20-2048.jpg)
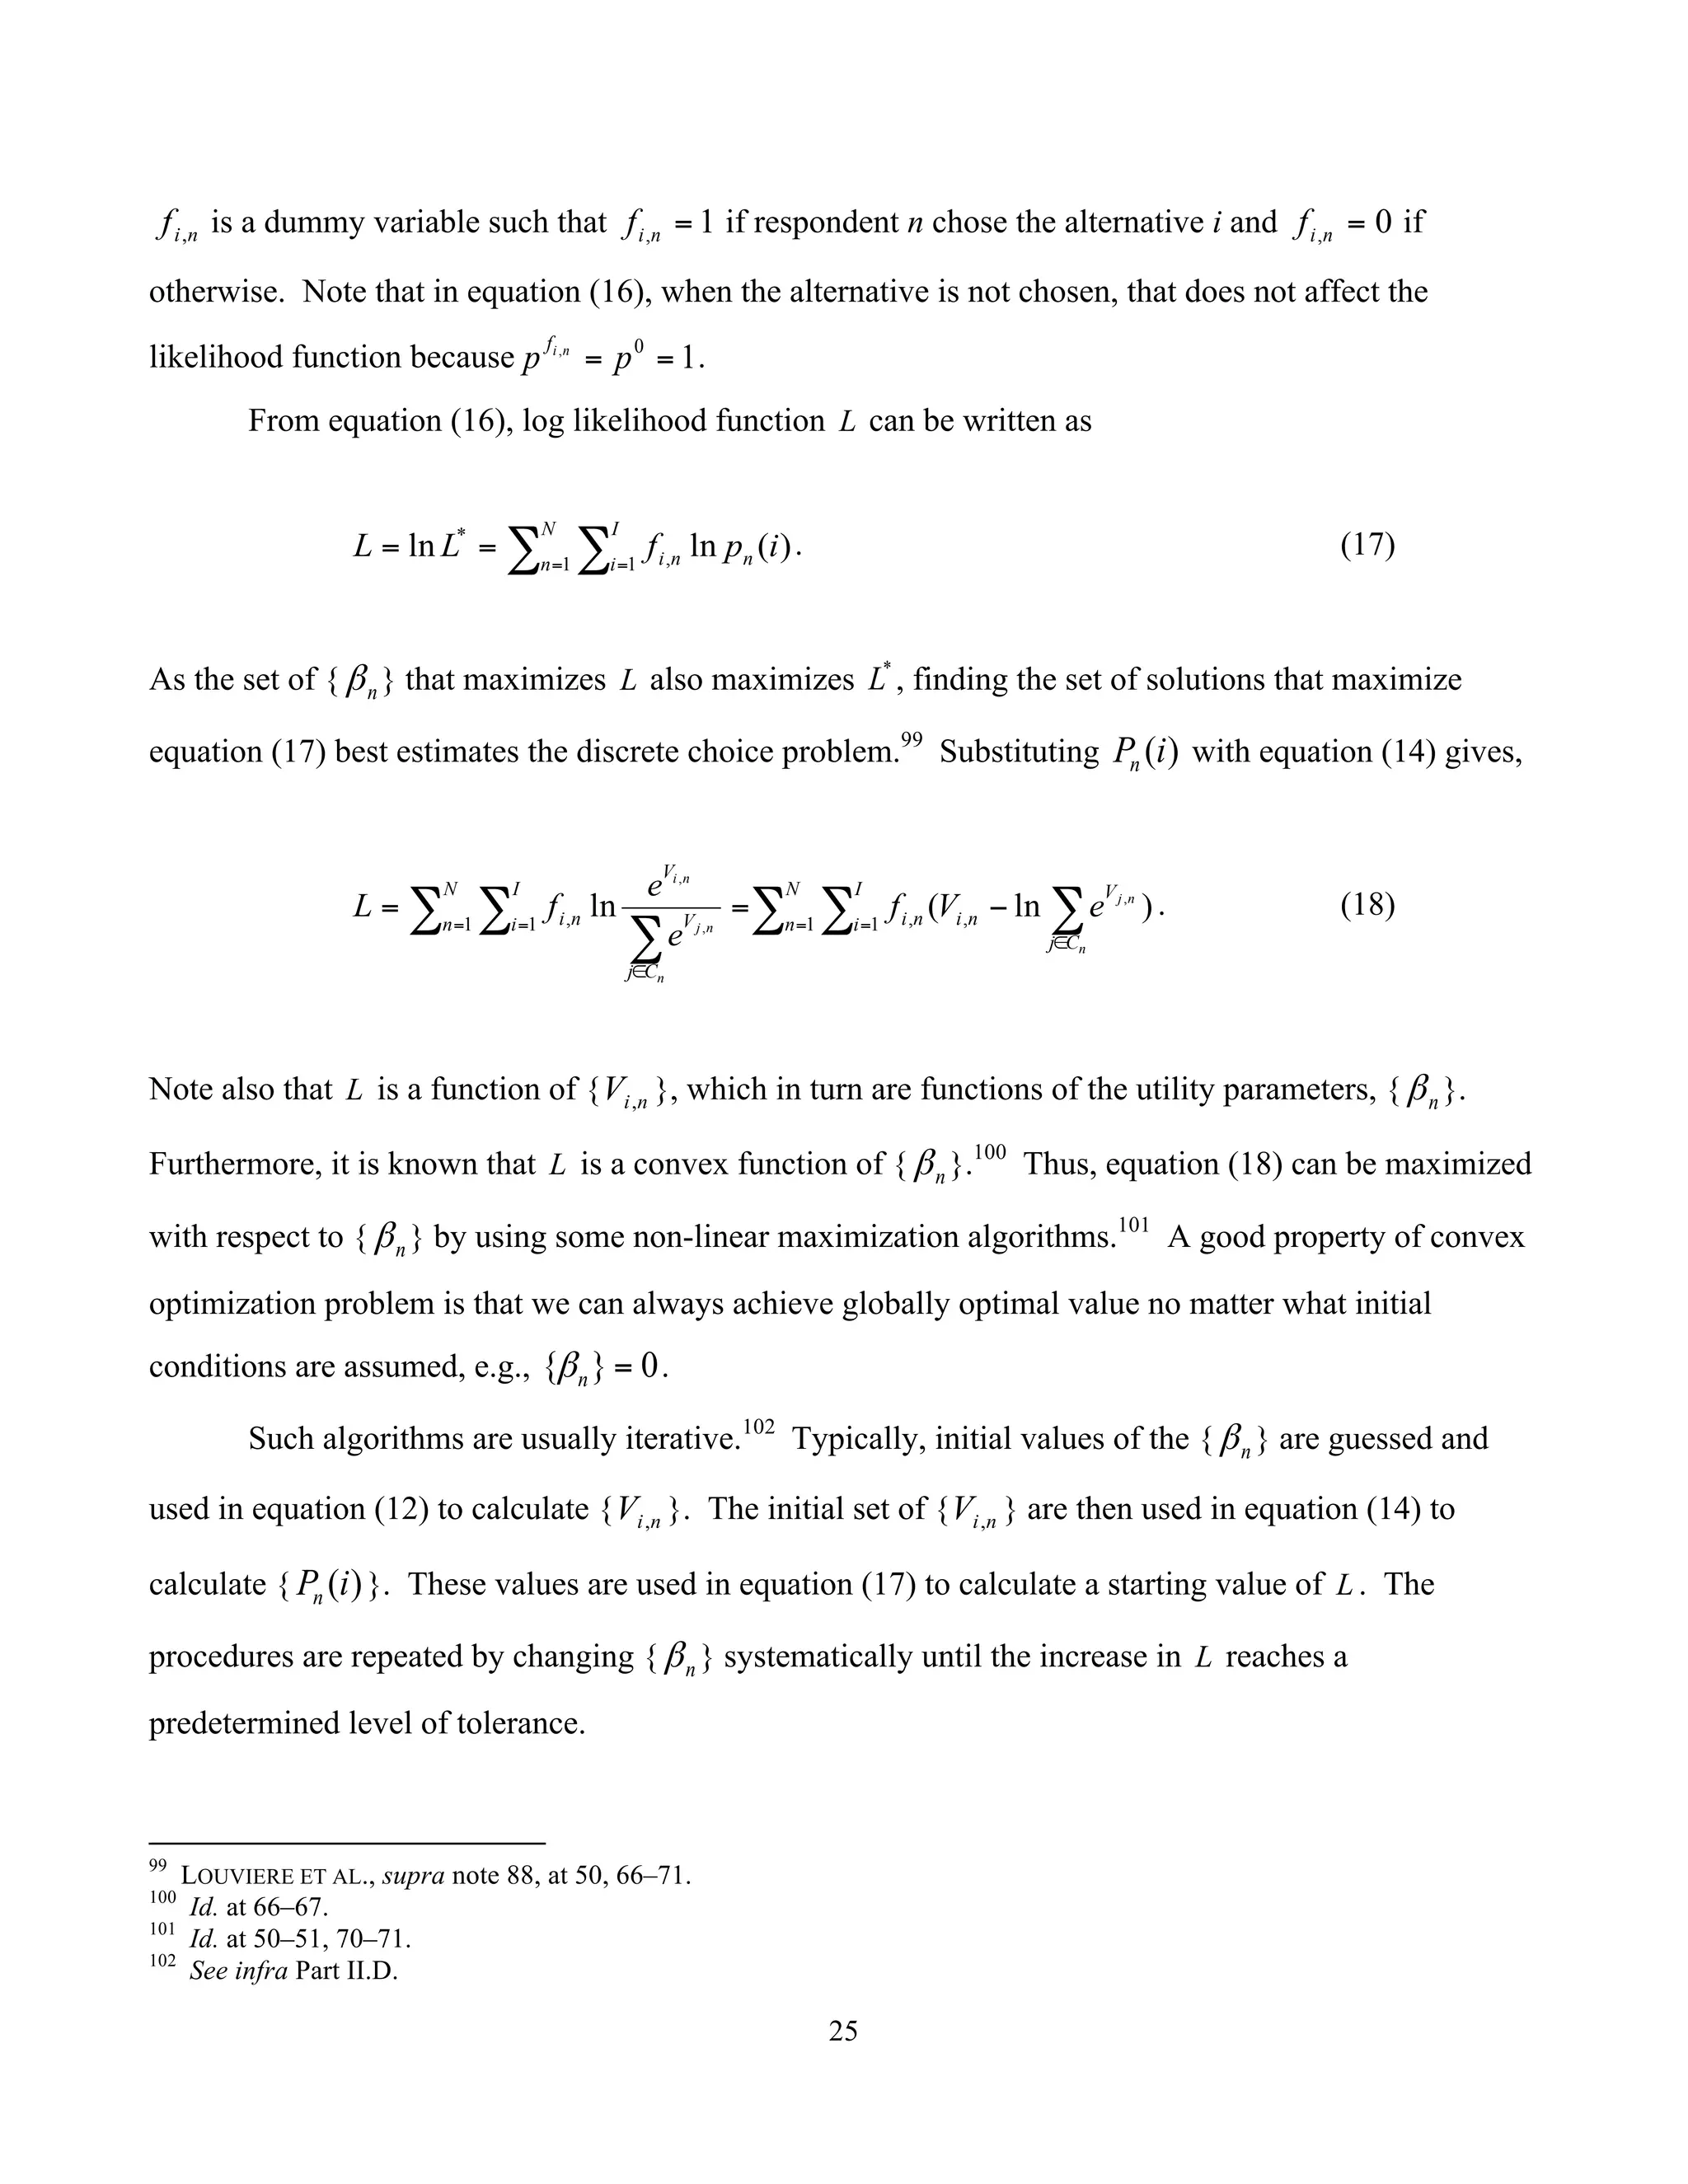
![27
)(
)()|(
)|(
DP
HPHDP
DHP
×
= . (21)
Here, the probability of the hypothesis given the data, )|( DHP , is known as its posterior
probability.105
This is the probability of the hypothesis that reflects the data upon which the hypothesis
is based. The probability of the hypothesis, )(HP , is known as its prior probability. It describes the
analyst’s belief about the hypothesis before she saw the data. The probability of the data given the
hypothesis, )|( HDP , is known as the likelihood of the data. It is the probability of seeing that
particular collection of data, conditioned on that hypothesis about the data. Thus, equation (21) tells that
the posterior probability of the hypothesis is proportional to the product of the likelihood of the data
under that hypothesis and the prior probability of that hypothesis. The Bayesian framework provides a
formula to update the prior estimate of the probability.
The HB method analyzes the model in a hierarchical form.106
That is, the model parameters in
one level (or hierarchy) are explained in subsequent levels. Re-writing equation (10) in a simple form,
we obtain
),()( ,,,, ijVVPiP njnjnini ≠∀+>+= εε . (22)
Re-writing equation (12) in a generalized form with more than three attributes, we obtain.
nnini xV β,,
ʹ= . (23)
nix ,
ʹ , attributes of the alternative i for the n respondent is expressed in a vector form. The HB method
further assumes that individual partworth, }{ nβ , has the multivariate normal distribution, i.e.,
),(~ ∑β
ββ Normaln (24)
105
The ACA/HB Module for Hierarchical Bayes Estimation v3, SAWTOOTH SOFTWARE INC., 6 (July 2006) [hereinafter
ACA/HB Module], https://www.sawtoothsoftware.com/download/techpap/acahbtec.pdf.
106
Greg M. Allenby & Peter E. Rossi, Perspectives Based on 10 Years of HB in Marketing Research, SAWTOOTH SOFTWARE
INC., 3 (2003), http://www.sawtoothsoftware.com/download/techpap/allenby.pdf.](https://image.slidesharecdn.com/ee567b2f-99e5-47e9-9a98-9181450641ed-151116043456-lva1-app6891/75/Conjoint-survey-paper-27-2048.jpg)
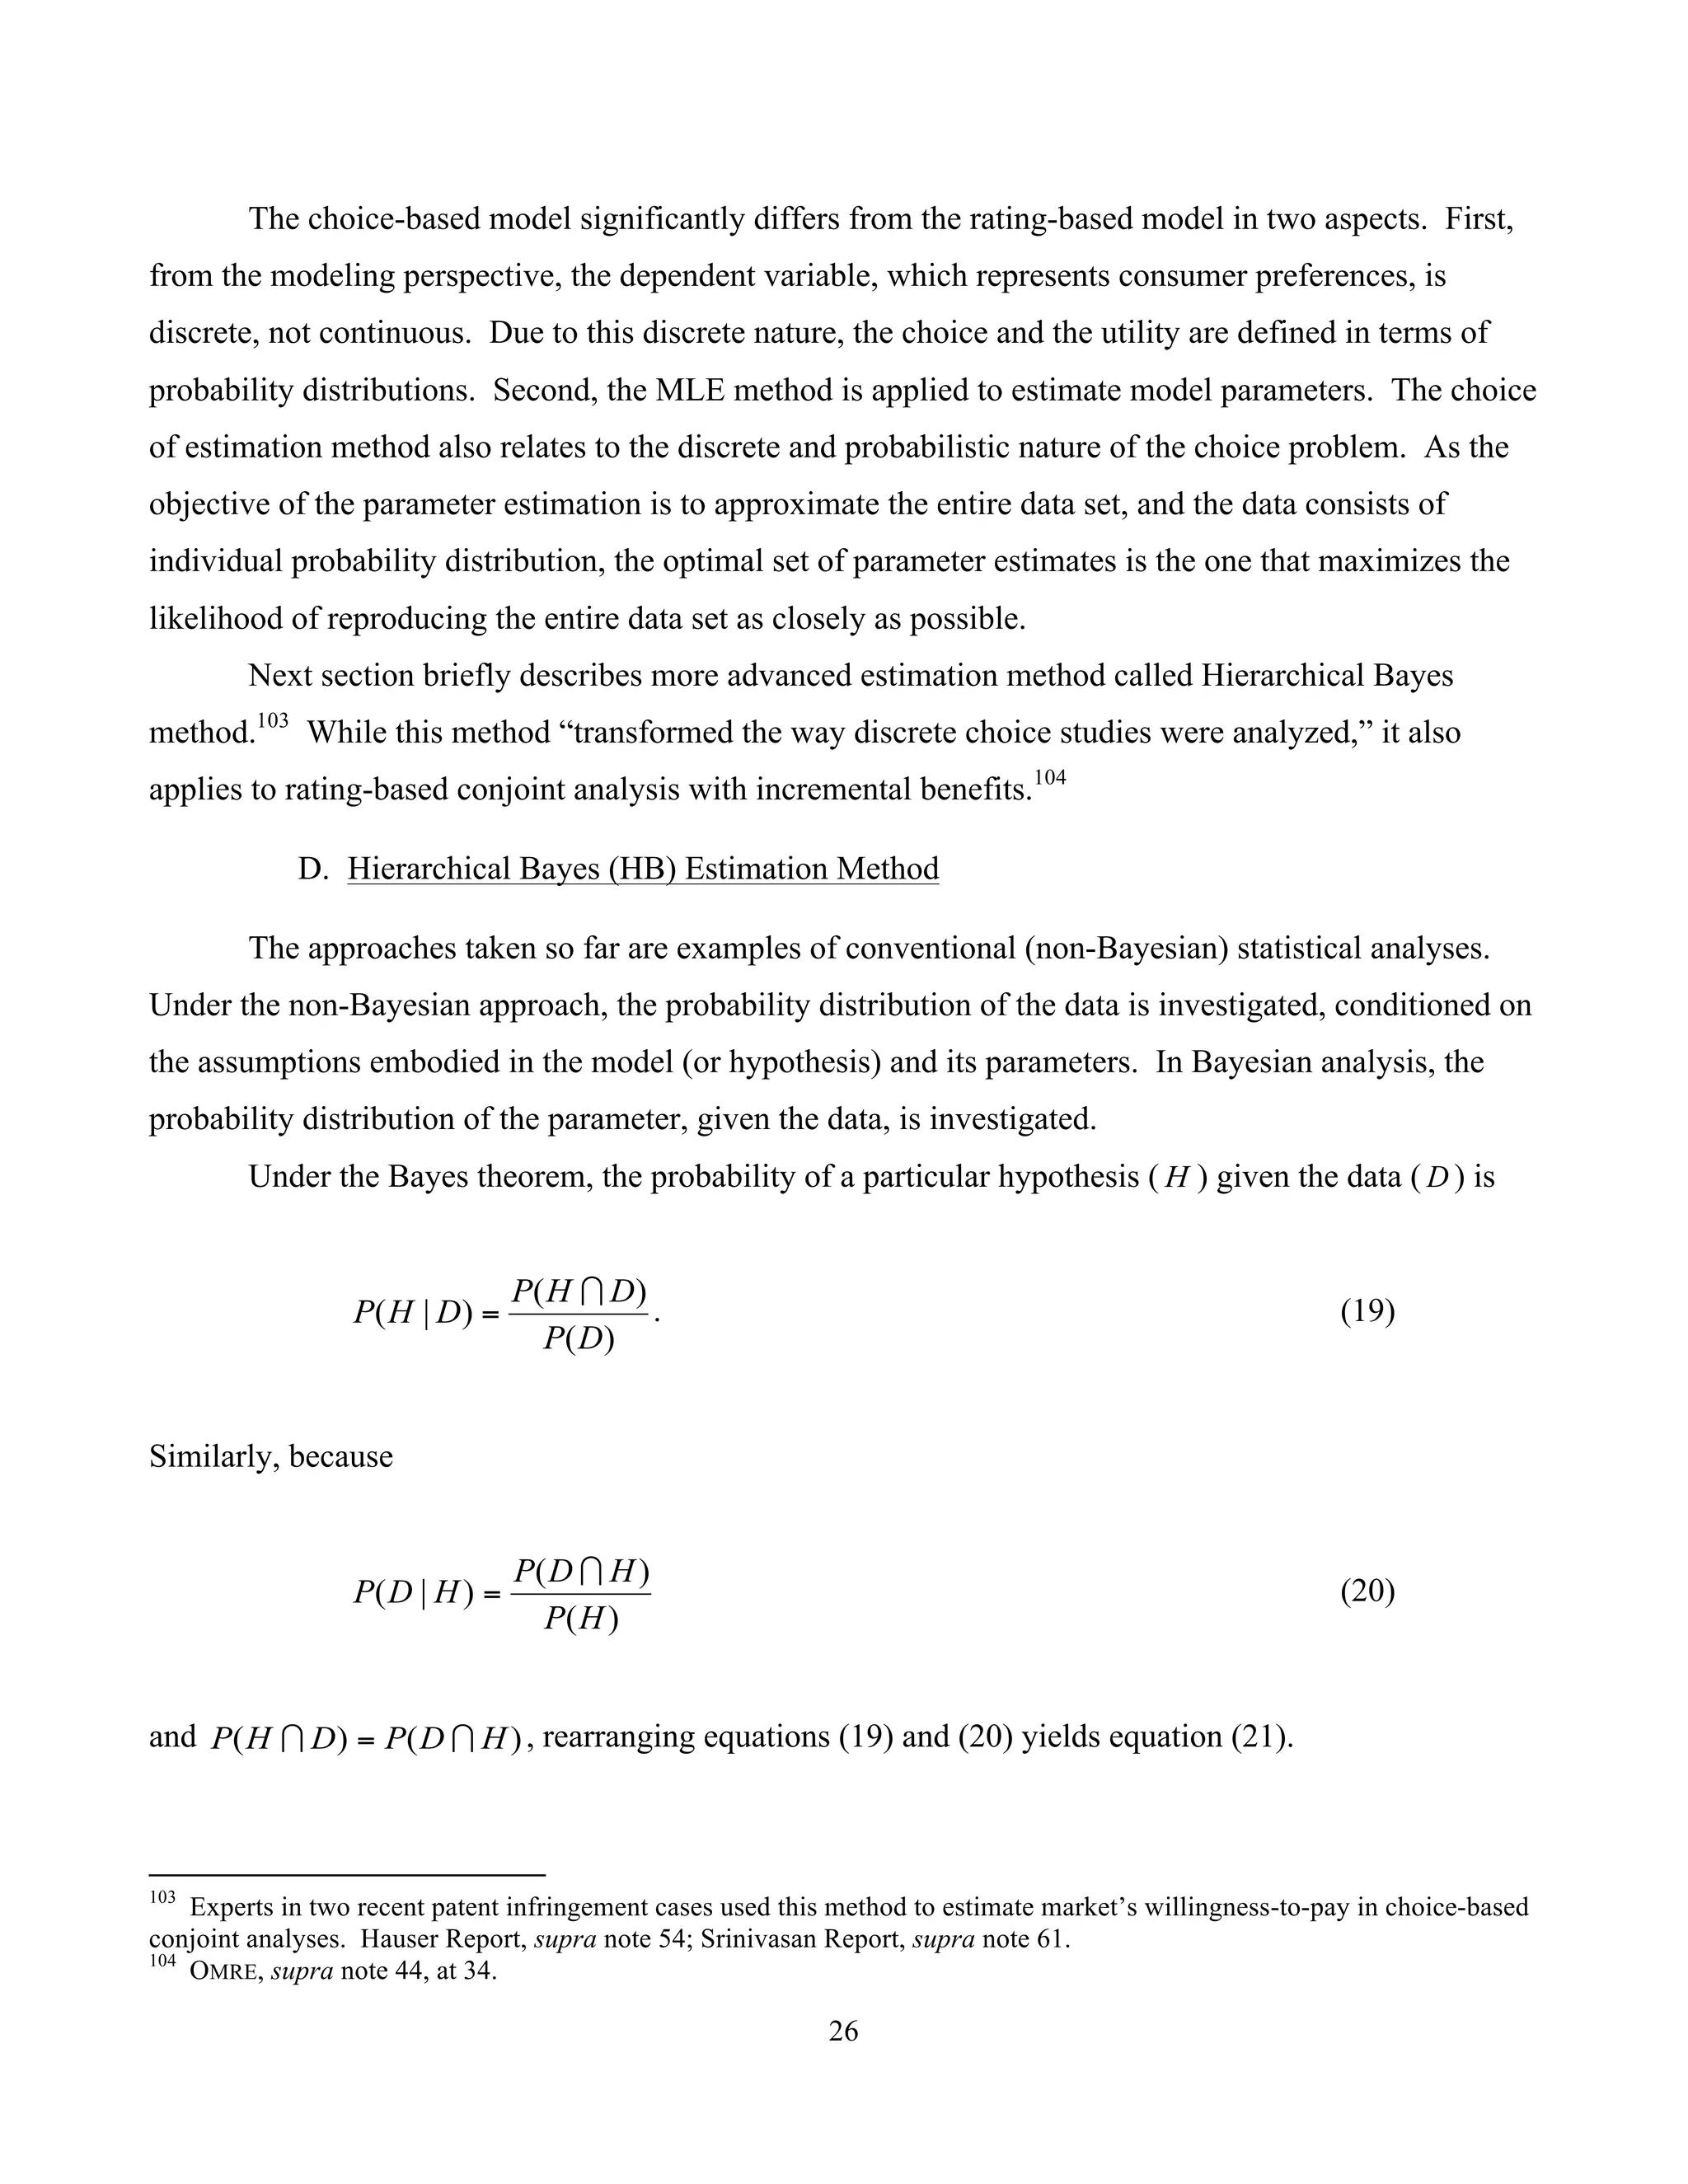
![28
where β is the mean of the distribution of individuals’ partworth and ∑β
denotes (a matrix of)
covariances of the distribution of the partworths across individuals.
Equation (22) describes the lowest level of the hierarchy. The same interpretation given in
equations (8)-(11) applies to equation (24). At the highest level, equation (24) allows for heterogeneity
among the respondents (i.e., variance within the sample). The individual partworth estimate, }{ nβ , are
linked by a common distribution, { ∑β
β , }, which represents the sample. (Note that { ∑β
β , } do
not contain individual-specific subscript, such as n.) { ∑β
β , } are known as hyper-parameters of the
model.107
Thus, in theory, estimates of individual level parameters give data, )|( DP nβ , can be obtained
by first obtaining the joint probability of all model parameters given the data,
),|()|( | ∑∏ × β
βββ n
n
nn PDP . And,
)|,},({)|( DPDP nn ∑= β
βββ
)(
),()],|()|([
)(
)()|( |
DP
PPDP
DP
PDP n
n
nn
nn
∑∑∏ ××
=
×
=
ββ
ββββ
ββ
. (25)108
Integrating equation (25) results in
∑∫ ∑ −= ββ
βββββ dddDPDP knn )|,},({)|( . (26)109
“-k” in k−β denotes “except k.” Equations (25) and (26), thus, provide an operational procedure for
estimating a specific individual’s set of partworths, }{ nβ , given all the data in the sample, D , not
merely her data, nD . As such, the Bayes theorem provides a method of bridging the analysis across the
respondents, which conjoint analysis essentially attempts to achieve.
107
Id. at 4.
108
Id.
109
Id.](https://image.slidesharecdn.com/ee567b2f-99e5-47e9-9a98-9181450641ed-151116043456-lva1-app6891/75/Conjoint-survey-paper-28-2048.jpg)
![30
So far, underlying principles of two major types of conjoint analysis rest on sound mathematical
theorems. The admissibility of the expert testimony based on conjoint analysis largely depends on the
minor premise. Expert’s major battleground is on how the survey gathers and supplies the data and the
validity of the statistical analysis rendered on the data. Part III identifies eight key areas where the
admissibility and credibility of conjoint survey evidence can be challenged.
III. CONJOINT ANALYSIS AS SURVEY EVIDENCE
Since conjoint analysis is a survey-based research tool, issues pertinent to admissibility and
credibility of the survey evidence apply to expert opinions based on conjoint analysis. Over the last half
century, the survey method has been proved to be an economical and systematic way to obtain data and
draw inferences about a large number of individuals or other units.113
A complete census of the universe
can be expensive, time-consuming, and sometimes impossible. With the increasing uses of the surveys
by academic researches, businesses, and the government, both federal and state courts have admitted
survey evidence on a variety of contexts such as: discrimination in jury panel composition; employment
discrimination; class certification; community standards for obscenity; antitrust; mass torts; consumer
perception and memory; trademark infringement; and patent infringement cases.114
One federal court in
a trademark infringement case treated the absence of a survey as the plaintiff’s failure to establish actual
consumer confusion.115
While survey evidence has been attacked as inadmissible on the theory that it is inadmissible
hearsay, the contemporary view is that the hearsay objection is unsound.116
The respondents’ answers
are either nonhearsay or admissible as exceptions to the hearsay rule as declarations of present state of
mind or under the residual exception.117
Under the Federal Rule of Evidence and Daubert, the
admissibility of survey result centers on the “validity of the techniques employed rather than [on]
relatively fruitless inquires whether hearsay is involved.”118
The key is on the quality of survey. To be admissible, surveys should generally satisfy following
foundational requirements: (1) a relevant population (or universe) was properly defined; (2) a
113
DIAMOND, supra note 79, at 367.
114
Id. at 364–67; see, e.g., Apple, Inc. v. Samsung Electronics Co., Ltd., No. 11–cv–01846–LHK, 2012 WL 2571332, at *9–
10 (N.D. Cal. June 30, 2012).
115
Morrison Entm’t Grp. v. Nintendo of Am., 56 F. App’x 782, 785 (9th Cir. 2003); DIAMOND, supra note 79, at 372
(“[S]everal courts have drawn negative inference from the absence of a survey, taking the position that failure to undertake a
survey may strongly suggest that a properly done survey would not support the plaintiff’s position.”).
116
1 PAUL C. GIANNELLI ET AL., SCIENTIFIC EVIDENCE, § 15.04[b], at 851–52 (5th ed., 2012).
117
Id.
118
FED. R. EVID. 703 advisory committee’s note.](https://image.slidesharecdn.com/ee567b2f-99e5-47e9-9a98-9181450641ed-151116043456-lva1-app6891/75/Conjoint-survey-paper-30-2048.jpg)
![31
representative sample of that population was selected; (3) the questions were presented in a clear and
non-leading manner; (4) interview procedures were sound and unbiased; (5) the data was accurately
gathered and reported; (6) the data was analyzed in accordance with accepted statistical principles; and
(7) objectivity of the process was assured.119
This Part examines each factor in turn. The third factor
will be addressed in two parts. Issues relating to the determination of survey attributes and levels will be
examined first. Then, the focus will move to the phrasing and/or presentation of the questionnaires.
A. Relevant Population
A population or universe is a complete set or all the units of interest to the researcher. The target
population must be relevant to the questions of the survey.120
The starting point in the development of a
methodologically sound survey is identification of the appropriate population. Thus, courts have
considered the selection of proper population “as one of the most important factors in assessing the
validity of a survey as well as the weight that it should receive.”121
Leelanau Wine Cellar v. Black & Red is a trademark infringement case between competing
wineries in Michigan.122
Leelanau’s primary theory of the case was based on the secondary meaning of
the disputed mark and the resulting consumer confusion. Specifically, Leelanau alleged that Black &
Red’s “Chateau de Leelanau” mark caused consumers of the defendant’s products to mistakenly believe
that the defendant’s products were from the same source as, or were connected with, the plaintiff’s
products.123
Leelanau retained an expert to conduct a consumer survey to measure the extent to which
consumers who encounter defendant’s Chateau de Leelanau wines believed them to be the same as or
related to Leelanau Wine Cellars.124
Leelanau’s expert defined the universe as “Michigan consumers
over 21 years of age who had either purchased a bottle of wine in the $ 5 to $ 14 price range in the last
119
Leelanau Wine Cellars, Ltd. v. Black & Red, Inc., 452 F. Supp. 2d 772, 778 (W.D. Mich. 2006) (citations omitted). The
court added that, “[b]ecause almost all surveys are subject to some sort of criticism, courts generally hold that flaws in survey
methodology go to the evidentiary weight of the survey rather than its admissibility.” Id. Manual for Complex Litigation
suggests the same seven factors in assessing the admissibility of a survey. MANUAL FOR COMPLEX LITIGATION (Fourth) §
11.493 (2004). See also DIAMOND, supra note 79, at 367 (“Several critical factors have emerged that have limited the value
of some of [the] surveys: problems in defining the relevant target population and identifying an appropriate sampling frame, a
response rates that raise questions about the representativeness of the results, and a failure to ask questions that assess
opinions on the relevant issue.”).
120
DIAMOND, supra note 79, at 377 (“A survey that provides information about a wholly irrelevant population is itself
irrelevant.”).
121
Leelanau Wine Cellars, 452 F. Supp. 2d at 781.
122
Id. at 772.
123
Id. at 779.
124
Id.](https://image.slidesharecdn.com/ee567b2f-99e5-47e9-9a98-9181450641ed-151116043456-lva1-app6891/75/Conjoint-survey-paper-31-2048.jpg)
![32
three months or who expected to purchase a bottle of wine in that price range in the three months
following the interview.”125
The court found this universe was flawed because it was significantly overbroad.126
The court
first concluded that when the dispute centers on secondary meaning of the mark, the proper universe is
the potential purchasers of defendant’s products.127
The court noted that Black & Red’s wines are
available only through their local tasting rooms and websites.128
That finding was crucial because, while
Leelanau’s universe would certainly include purchasers of the defendant’s wine, only a tiny percentage
of the respondents in Leelanau’s universe would probably purchase Black & Red’s wines in connection
with actual visits to its tasting rooms or websites.129
In another case, the court was more receptive to survey evidence. In a patent infringement suit
between competing smartphone manufacturers, Apple’s damages expert designed and conducted a
conjoint survey to determine price premium, if any, Samsung consumers would be willing to pay for the
touchscreen features associated with the Apple’s patents at issue.130
One of the arguments for
Samsung’s unsuccessful Daubert challenge was that Apple’s expert surveyed improper recent Samsung
purchasers, rather than potential Samsung purchasers.131
Rejecting Samsung’s motion to exclude the
expert opinion, the court first noted that Samsung failed to explain why recent Samsung purchasers are
not the proper universe for Apple’s survey.132
The court found that even if the category of recent
Samsung purchasers was underinclusive, they were at least members of the relevant universe of survey
participants.133
Concluding that the underinclusive population was still probative, the court stated,
“[g]enerally, underinclusiveness of a survey goes to weight, not admissibility.”134
B. Representative Sample
A sample is a subset of the population. The sample is drawn from the population for a particular
purpose of conducting the survey. Conjoint analysis quantifies sample’s preferences and estimates
sample’s partworth and willingness-to-pay. Thus, in addition to the appropriate identification of the
125
Id. at 782.
126
Id. at 782–83.
127
Id. at 782.
128
Id.
129
Id.
130
Apple, Inc. v. Samsung Electronics Co., Ltd., No. 11–cv–01846–LHK, 2012 WL 2571332, at *9–10 (N.D. Cal. June 30,
2012).
131
Id. at *9.
132
Id. at *10.
133
Id.
134
Id.; see also Microsoft Corp. v. Motorola, Inc., 905 F. Supp. 2d 1109, 1120 (W.D. Wash. 2012).](https://image.slidesharecdn.com/ee567b2f-99e5-47e9-9a98-9181450641ed-151116043456-lva1-app6891/75/Conjoint-survey-paper-32-2048.jpg)
![33
relevant population, it is essential to select a sample that properly represents the relevant characteristics
of the population. The ultimate goal of the sample survey is “to provide information on the relevant
population from which the sample was drawn,” even though the data are incomplete as not obtained
from the population.135
Largely, there are two types of concerns – quantitative and qualitative – about the sample.
Quantitatively, the statistician wants a sample large enough to generate reliable statistics. Courts have
barred samples in some cases when the sample was too small to yield reliable statistics.136
The rule of
thumb is that a sample size exceeding thirty may provide stable statistics.137
More is better in general,
but not always so. When the sample is systematically skewed or biased, a larger sample size would
aggravate, not reduce, the systematic error (even though the standard error is inversely proportional to
the square root of the sample size).138
Qualitatively, the sample must be unbiased.139
Most survey researchers employ probabilistic
approaches in sampling.140
Probability sampling is known to maximize both the representativeness of
the survey results and the reliability of estimates obtained from the survey.141
Probability sampling
methods range from a simple random sampling method to complex multistage sampling schemes.142
In
a basic simple random sampling method, every element in the population has equal non-zero probability
135
DIAMOND, supra note 79 at 361.
136
See 1 GIANNELLI ET AL., supra note 116, at § 15.04[b], 858.
137
Id. at 845.
138
Id. n.98. The classic example of the large sample with the systematic bias is the Literary Digest’s 1936 presidential
election poll. The Literary Digest was one of the most popular magazines of that era and had a history of accurately
predicting the winners of presidential elections since 1916. It sent out 10 million straw ballots asking people who they
planned to vote for the 1936 presidential election. The magazine received 2.4 million ballots. Based on the responses, it
predicted Alfred Landon would beat Franklin D. Roosevelt 57% to 43%. As it turned out, Roosevelt won, with a whopping
margin of 62% to 37%. There were two huge problems with the poll. First, the initial sample (initial 10 million recipients)
did not correctly represent the population, i.e., voters. Literary Digest used lists of phone numbers, drivers’ registration, and
country club memberships to identify the sample. However, at the time, these luxuries were more often available to the
middle- and upper-class voters, which tended to exclude lower-income voters. On the other side, Roosevelt’s campaign
centered on reviving the economy at the height of the depression, which appealed to the majority of the lower income people.
Second, the sample chosen suffered from voluntary response (or nonresponse) bias, with a huge nonresponse rate of more
than 75%. A high nonresponse rate suggests that the voters who supported Roosevelt were less inclined to respond to the
survey. Famous Statistical Blunders in History, THE OXFORD MATH CTR.,
http://www.oxfordmathcenter.com/drupal7/node/251 (last visited Apr. 14, 2015); Case Study I: The 1936 Literary Digest
Poll, UNIV. PA. DEP’T OF MATHEMATICS, http://www.math.upenn.edu/~deturck/m170/wk4/lecture/case1.html (last visited
Apr. 14, 2015).
139
1 GIANNELLI ET AL., supra note 116, at § 15.04[a], 846–47.
140
See DIAMOND, supra note 79, at 382.
141
Id. at 380 (“Probability sampling offers two important advantages over other types of sampling. First, the sample can
provide an unbiased estimate that summarizes the responses of all persons in the population from which the sample was
drawn; that is, the expected value of the sample estimate is the population value being estimated. Second, the researcher can
calculate a confidence interval that describes explicitly how reliable the sample estimate of the population is likely to be.”).
142
Id.](https://image.slidesharecdn.com/ee567b2f-99e5-47e9-9a98-9181450641ed-151116043456-lva1-app6891/75/Conjoint-survey-paper-33-2048.jpg)
![34
of being selected in the sample.143
In stratified random sampling, the population is first divided into
mutually exclusive and exhaustive strata, and samples are selected from within these strata by basic
random sampling.144
Courts have also admitted into evidence survey results drawn from non-
probabilistic sampling.145
However, the proponent should be prepared to justify why she took a specific
non-probabilistic method to select the sample respondents in the instant case.146
With recent technological innovations, businesses and academics have increasingly used Internet
surveys for a variety of purposes. Internet survey can reduce substantially the cost of reaching potential
respondents and, at the same time, can improve the way survey is designed and presented to the
respondents. It also eliminates risks involving interviewer biases and reduces inaccuracies of data-
recording/saving as the computer program presents survey questions and collects answers automatically.
The threshold issue in evaluating an Internet survey is that the web-surfers may not fairly
represent the relevant population whose responses the survey was designed to measure.147
For example,
some Internet market research service companies maintain a huge panel of volunteers (the “panel
population”) consisting of multi-million consumers.148
Although a subset of the panel may be randomly
sampled from the panel population for conducting a specific survey, the panel population itself may not
be the product of a random selection process. The panel population likely over-represents a group of
relatively active and informative market participants.149
They may have a particular viewpoint on
subject matters and/or a motive that might bias the survey results.
Other issues concern respondent qualification and duplication. As the Internet survey is
conducted over the online, security measures must be taken to confirm that the selected sample
conforms to the purpose of the study. The procedures that Apple’s expert took in Apple v. Samsung
illustrate the concerns.150
The expert and a market research company hired by him first checked the
143
Id.
144
Id.
145
Id. at 382.
146
Id.
147
Id. at 406.
148
E.g., Hauser Report, supra note 54, at 25 (“Research now . . . maintains an invitation-only panel over 3.6 million
consumers in the United States and over 6 million panelists worldwide.”); Srinivasan Report, supra note 61, at 12 (“Optimal
Strategix Group utilized Authentic Response’s US Adults panel of approximately 3 million respondents.”); see also
DIAMOND, supra note 79, at 382 n.102.
149
One expert report notes that the panel population held by a market survey company does not accurately represent the
whole population. Srinivasan Report, supra note 61, at 12 (“This [3 million] panel is maintained to be reflective of the U.S.
Census (adults), but it is not exactly balanced with respect to the U.S. Census (adults).”). Therefore, the survey company
weighted the sample population to be a more balanced representative of the U.S. Census of adults than the un-weighted
sample. Id.
150
Hauser Report, supra note 54, at 26.](https://image.slidesharecdn.com/ee567b2f-99e5-47e9-9a98-9181450641ed-151116043456-lva1-app6891/75/Conjoint-survey-paper-34-2048.jpg)
![35
identity of panelists by reviewing registered email addresses and their basic demographic information.151
Based on the information, they invited people who indicated that they own smartphones.152
The
invitation email included a link to actual survey, hosted on a website maintained by the market research
company affiliated with the expert.153
The email link contained an embedded identification number to
assure that only invited respondents could answer the survey and could do so only once.154
Before
starting the survey, respondents were prompted to a CAPTCHA challenge to ensure that responses were
not computer-generated.155
In addition, a high nonresponse rate can significantly bias the survey results and can be a ground
for excluding survey evidence.156, 157
Nonresponses aggravate systematic error more seriously when the
nonresponse is not random.158
The key in understanding the pattern and effect of the nonresponse in a
survey is to determine the extent to which nonrespondents differ from respondents with respect to the
dividing characteristics of these groups.159
The proponent must review the underlying raw data to investigate whether there exists
significant nonresponses and whether the nonresponses are systematic. However, mere low response
rate may not be damming.160
“Contrary to earlier assumptions, surprisingly comparable results have
151
Id.
152
Id. This initial criterion screens the pool of potential respondents by determining whether they belong to the target
population of the survey. As the target population in the survey was smartphone owners, online survey in itself does not pose
a serious underinclusive problem with respect to the availability of Internet access. “The screening questions must be drafted
so that they do not appeal to or deter specific groups within the target population, or convey information that will influence
the respondent’s answers on the main survey.” DIAMOND, supra note 79, at 385–86.
153
Hauser Report, supra note 54, at 26.
154
Id.
155
Id. at 27. CAPTCHA stands for Completely Automated Public Turing test to tell Computers and Humans Apart. “A
CAPTCHA challenge refers to a program that protects websites against bots (i.e., computer-generated responses) by
generating and grading tests that humans can pass, but current computer programs cannot.” Id. n.32.
156
Methods of computing response/nonresponse rates vary. “[A]lthough response rate can be generally defined as the
number of complete interviews with reporting units divided by the number of eligible reporting units in the sample, decisions
on how to treat partial completions and how to estimate the eligibility of nonrespondents can produce differences in measures
of response rate.” DIAMOND, supra note 79, at 384 n.109.
157
See id. at 383–85 (suggesting 80% or higher response rates are desirable); 1 GIANNELLI ET AL., supra note 116, at §
15.04[b], 860–63.
158
DIAMOND, supra note 79, at 383 (“for example, persons who are single typically have three times the ‘not at home’ rate in
U.S. Census Bureau surveys as do family members”). See supra text accompanying note 138 (regarding Literary Digest’s
1936 presidential election poll).
159
See DIAMOND, supra note 79, at 383–84 (“The key is whether nonresponse is associated with systematic differences in
response that cannot be adequately modeled or assessed.”).
160
For example, Apple’s expert reported that for his conjoint survey, only 22.8% of the invitees responded. Hauser Report,
supra note 54, at 37 n.47 (“Out of the total 38,795 participants invited for the smartphone survey, 8,844 began the survey,
resulting in a response rate of 22.8%. . . . Out of the total 8,844 participants who started the smartphone survey, 604 passed
through the screening questions and qualified for the choice tasks, resulting in an incidence rate of 6.8%.”). The survey result
was not excluded.](https://image.slidesharecdn.com/ee567b2f-99e5-47e9-9a98-9181450641ed-151116043456-lva1-app6891/75/Conjoint-survey-paper-35-2048.jpg)
![36
been obtained in many surveys with varying response rates, suggesting that surveys may achieve
reasonable estimates even with relatively low response rates.”161
Where a notable pattern is found
between the respondents and nonrespondents groups, the proponent must be prepared to explain the
cause and prove that either the high nonresponse rate does not bias the survey results or the effects are
insignificant.
The opponent must attack a survey’s high nonresponse rate. Even if the survey evidence with
high response rate might be admitted to the trier of fact, unexplained high nonresponse rate reduces its
probative value. On the other hand, the opponent should take a survey with a high response rate with no
less scrutiny. What matters are the determinants of the nonresponse.162
Even if the survey has a high
response rate, it still can underrepresent some portions of the relevant population.163
Therefore, the
opponent should examine the underlying raw data from which the results were drawn.
The following case illustrates the importance of recording and reporting nonresponse rates in a
survey. In a class action lawsuit, defendants-employers moved to exclude plaintiffs-employees’ expert
report by asserting that it failed to meet the standard for expert testimony outlined by Federal Rule of
Evidence 702 and Daubert.164
One of the defendants’ arguments was that the expert’s study suffered
from a substantial undocumented nonresponse bias, undermining the reliability of the opinion.165
The
plaintiffs responded that the nonresponse rate was low and that any bias was minimal.166
Noting that
“[t]he U.S. Office of Statistical Standards suggest that because nonresponse is often not random, a
survey should maintain a response rate of 75% or above[,]” the court sided with the defendants.167
The
court pointed out that the plaintiffs’ expert admitted that while the nonresponse rate was small, it was
not documented.168
The expert’s careless failure to record nonresponse rate was the ground that the
court found the expert testimony unreliable and inadmissible under Rule 702.169
161
DIAMOND, supra note 79, at 384.
162
Id. at 385.
163
Id. (“If a general population sample is used to chart changes in the proportion of the population that knows someone with
HIV, the survey would underestimate the population value if some groups more likely to know someone with HIV (e.g.,
intravenous drug users) are underrepresented in the sample.”).
164
Chavez v. IBP, Inc., No. CV–01–5093–RHW, 2004 U.S. Dist. LEXIS 28838, at *1–2 (E.D. Wash. Dec. 8, 2004).
165
Id. at *28.
166
Id.
167
Id.
168
Id.
169
Id. at *29–34. In this regard, Apple’s expert recorded and reported the initial (non)response rate and the end incidence
rate, although response and incidence rates were very low. See supra text accompanying note 160.](https://image.slidesharecdn.com/ee567b2f-99e5-47e9-9a98-9181450641ed-151116043456-lva1-app6891/75/Conjoint-survey-paper-36-2048.jpg)
![40
The court continued to criticize the survey’s methodology. The fact that the survey did not
include important product features such as battery life and WiFi capability, but instead selected an
arguably unimportant feature, voice dialing, exacerbated the focus bias problem.192
The expert, the
court found, failed to provide any reasonable criteria for choosing non-patented features in the survey
and instead forced the respondents to focus on the patented functionalities.193
In TV Interactive Data v. Sony, plaintiff’s damages expert designed the conjoint survey to
estimate consumers’ willingness-to-pay for the incremental benefit from using TV Interactive Data’s
patented technology, a so-called “Autoplay” function, in Sony’s Blue-ray players.194
The expert decided
to limit the number of attributes to five – the attribute representing the Autoplay function, price discount,
and three non-patented attributes.195
The expert attempted to select non-patented attributes that have
relatively similar values to that of the Autoplay function.196
He adopted a two-phase approach.
In Phase I of the study, the expert focused on generating enough attributes to be able to identify
six attributes for Phase II.197
(The partworth or the willingness-to-pay for the patented technology at
issue, Autoplay, was measured in the Phase II of the study.) The expert needed to identify six attributes
because he decided to conduct Phase II in two versions, using three non-patented attributes (with price
discount and the Autoplay function) in each version of the study. The expert, with the help of a hired
market research company, first collected information on Blu-ray players and their attributes from the
manufacturers’ and well-known retailers’ websites.198
The expert then sorted out sixteen attributes
based on a set of general considerations.199
To determine how respondents would value eighteen attributes, in Phase I the expert essentially
conducted a mini conjoint survey by using a method called Adaptive Self-Explication of Multi-Attribute
192
Id.
193
Id.
194
Srinivasan Report, supra note 61, at 3.
195
Id. at 5.
196
Id. at 10–12. Thus, the expert’s main concern in determination of non-patented attributes was slight different from that of
the Oracle court. In TV Interactive Data, the expert selected attributes that have “similar values” to the infringing feature. In
contrast, the court in Oracle criticized the expert’s failure to include “important” features. 2012 WL 850705, at * 10.
197
Id. at 9.
198
Id. at 8–9.
199
Id. at 9 (“(a) Avoid attributes that are nearly universally present (> 95% of the [Stock Keeping Units] have this attribute).
Such attributes are unlikely to be a basis for customer choice; (b) Avoid attributes that are nearly universally absent (<5% of
the [Stock Keeping Units] have this attribute). Such attributes are unlikely to be a basis for customer choice. (c) Avoid
attributes that have a large number of values (e.g., playable disc types, the physical measurements of the Blu-ray player). A
phenomenon called ‘number of levels effect’ in conjoint analysis indicates that the value for an attribute with a large number
of levels would be overstated. (d) Avoid attributes that include adjacent product categories (e.g., combinations of Blu-ray
players with Recorders, HD-DVD players) because such product categories have additional sets of attributes as well; (e)
Avoid attributes that were too highly technical to translate to customer language.”)](https://image.slidesharecdn.com/ee567b2f-99e5-47e9-9a98-9181450641ed-151116043456-lva1-app6891/75/Conjoint-survey-paper-40-2048.jpg)
![41
Preferences (ASEMAP).200
As the number of attributes was rather large, he first categorized the
eighteen attributes into two buckets – the more important nine and the less important nine.201
Respondents were then asked to rank attributes within each bucket.202
This created a rank order of the
importance of all eighteen attributes. Based on the list, respondents were asked to compare a pair of two
attributes in a relative scale.203
For example, a respondent was asked to compare Autoplay and price discount in the fixed scale
of 100 points. If the respondent valued Autoplay more and assigned 60 points on it, it was deemed that
the price discount received the remaining 40 points. The expert designed the pairs such that thirteen
strategically paired comparisons were sufficient to get accurate results with less than 5% average
error.204
Log-linear multiple regression was applied to analyze the data and estimate relative importance
of the eighteen attributes.205
Comparing the relative importance of all attributes, except price discount,
the expert could identify six attributes – three for each version – thought to have comparable values to
that of the patented feature.206
iv. Include non-infringing alternative levels207
The availability of non-infringing alternatives directly influences consumer’s willingness-to-pay
for the infringing attribute. The importance of the availability of the non-infringing alternatives has
been emphasized by the court, particularly when the calculation of the reasonable royalty base was
disputed.208
When the non-infringing alternatives exist, the proponent must assess the degree to which
consumers prefer the patented feature to then available non-infringing alternatives.209
Thus, the
200
Id. at 6.
201
Id. at 11.
202
Id.
203
Id.
204
Id.
205
Id. at 12; see also Oded Netzer & V. Srinivasan, Adaptive Self-Explication of Multi-Attribute Preferences, 48 J.
MARKETING RES. 140, 140–56 (2011).
206
The expert compared “the average importance from the weighted sample for [Autoplay]” as well. Srinivasan Report,
supra note 61, at 13.
207
Although sounds similar, this topic differs from the subject discussed in the preceding section. Here, the focus is on the
level, not on the attribute. For example, where the patented technology at issue is about an “X method” of accomplishing a
touchscreen functionality, the “touchscreen capability” attribute should include non-infringing “Y method” and “Z method,”
if such methods were available at the time of the infringement. On the other hand, non-patented attributes in the preceding
section concerned about including other important or comparable attributes such as battery life or WiFi capability, which are
not the subset of the touchscreen capability.
208
Cornell Univ. Hewlett-Packard Co., 609 F. Supp. 2d 279, 286–87 (N.D.N.Y. 2009).
209
Cameron et al., supra note 47.](https://image.slidesharecdn.com/ee567b2f-99e5-47e9-9a98-9181450641ed-151116043456-lva1-app6891/75/Conjoint-survey-paper-41-2048.jpg)
![43
the court excluded expert’s survey results finding that the survey did not properly capture the claimed
invention because survey question was overly broad and confused the issue.216
ii. Questions should be clear and unambiguous
Second, questions should be clear to the respondents when presented. Even questions that
appear clear to the surveyor can convey unexpected meanings and ambiguities to potential
respondents.217
The wording of such questions would naturally raise doubts about the validity of the
survey by potentially distorting response data. What the questions intended to ask simply may not
match what the answers deliver if the question is subject to multiple interpretations.
Precise questions without legal or technical jargons are preferred. If using jargon cannot be
avoided, these terms must be fully explained to the respondents before asking them to answer the
questions. Still, determining whether the question was clear enough to be accurately understood would
depend on the respondents’ identity and may go to weight rather than admissibility.218
Microsoft and Motorola disputed over the licensing of patented technology used in Microsoft’s
Xbox 360 console.219
Microsoft moved to exclude Motorola’s survey evidence by arguing that the
survey was unreliable.220
Microsoft pointed that the survey asked respondents to “select the types of
video content [he or she] has viewed on his or her Xbox console and providing options of ‘MBAFF
(Macroblock Adaptive Frame/Field),’ ‘Progressive,’ and ‘not sure.’” Finding the argument
unpersuasive, the court noted that the survey defined the disputed terms. The court added that since the
questions were given to respondents who owned an Xbox, the respondents were more likely to
understand the technical terms.221
The court held that “the clarity of the survey questionnaire is a
question of fact, best resolved at trial through cross examination.”222
216
Fractus, S.A. v. Samsung, No. 6:09–cv–203–LED–JDL, 2011 U.S. Dist. LEXIS 154697, at *13 (E.D. Tex. Apr. 29, 2011).
217
DIAMOND, supra note 79, at 387.
218
Microsoft Corp. v. Motorola, Inc., 905 F. Supp. 2d 1109, 1119–20 (2012). But see Firestone v. Crown Ctr.
Redevelopment Corp., 693 S.W.2d 99, 102–03 (Mo. 1985) (en banc). The court in Firestone concluded that the question
“Based on what you have heard, read or seen, do you believe that in the current compensatory damage trials, the defendants,
such as the contractors, designers, owners, and operators of the Hyatt Hotel, should be punished?” could neither be correctly
understood nor easily answered. Id. at 103. The court noted that the phrase “compensatory damage” was unlikely to be
meaningful for laypersons. Id.
219
Microsoft, 905 F. Supp. 2d at 1119–20.
220
Id.
221
Id. at 1120.
222
Id.](https://image.slidesharecdn.com/ee567b2f-99e5-47e9-9a98-9181450641ed-151116043456-lva1-app6891/75/Conjoint-survey-paper-43-2048.jpg)

1) Reasonable royalty calculations are important in patent infringement cases, as they represent the minimum damages a patent holder is entitled to and are the most common form of damages sought, particularly by non-practicing entities. 2) There are two main approaches to calculating reasonable royalties - the analytical approach based on infringer's profits, and the hypothetical negotiation approach which aims to determine the royalty the patent holder and infringer would have agreed to. 3) The Georgia-Pacific factors provide a legal framework for assessing reasonable royalties, considering factors relevant to a hypothetical negotiation between willing parties such as existing royalty agreements, industry standards, and the merits of the invention.


