Downloaded 179 times
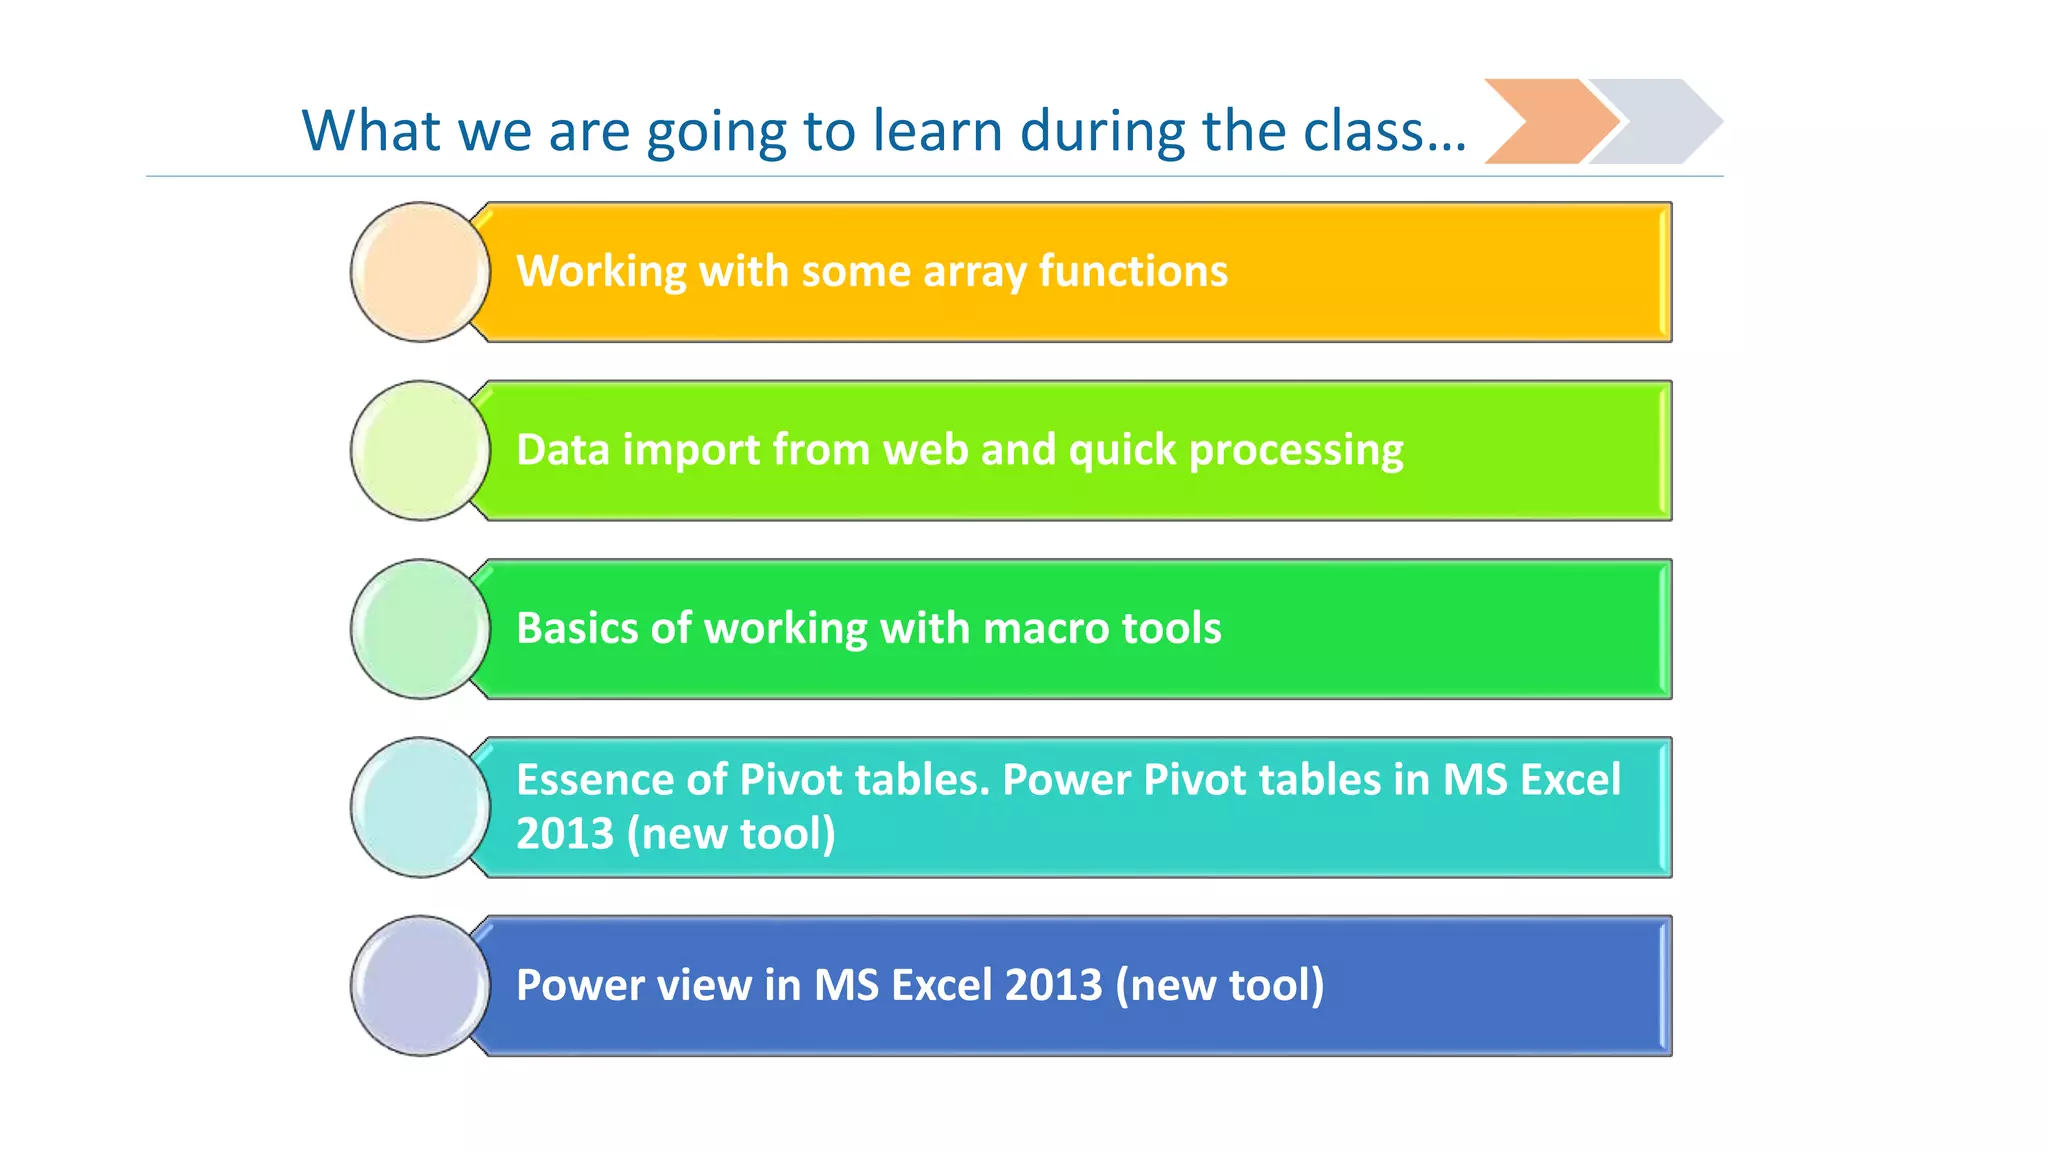
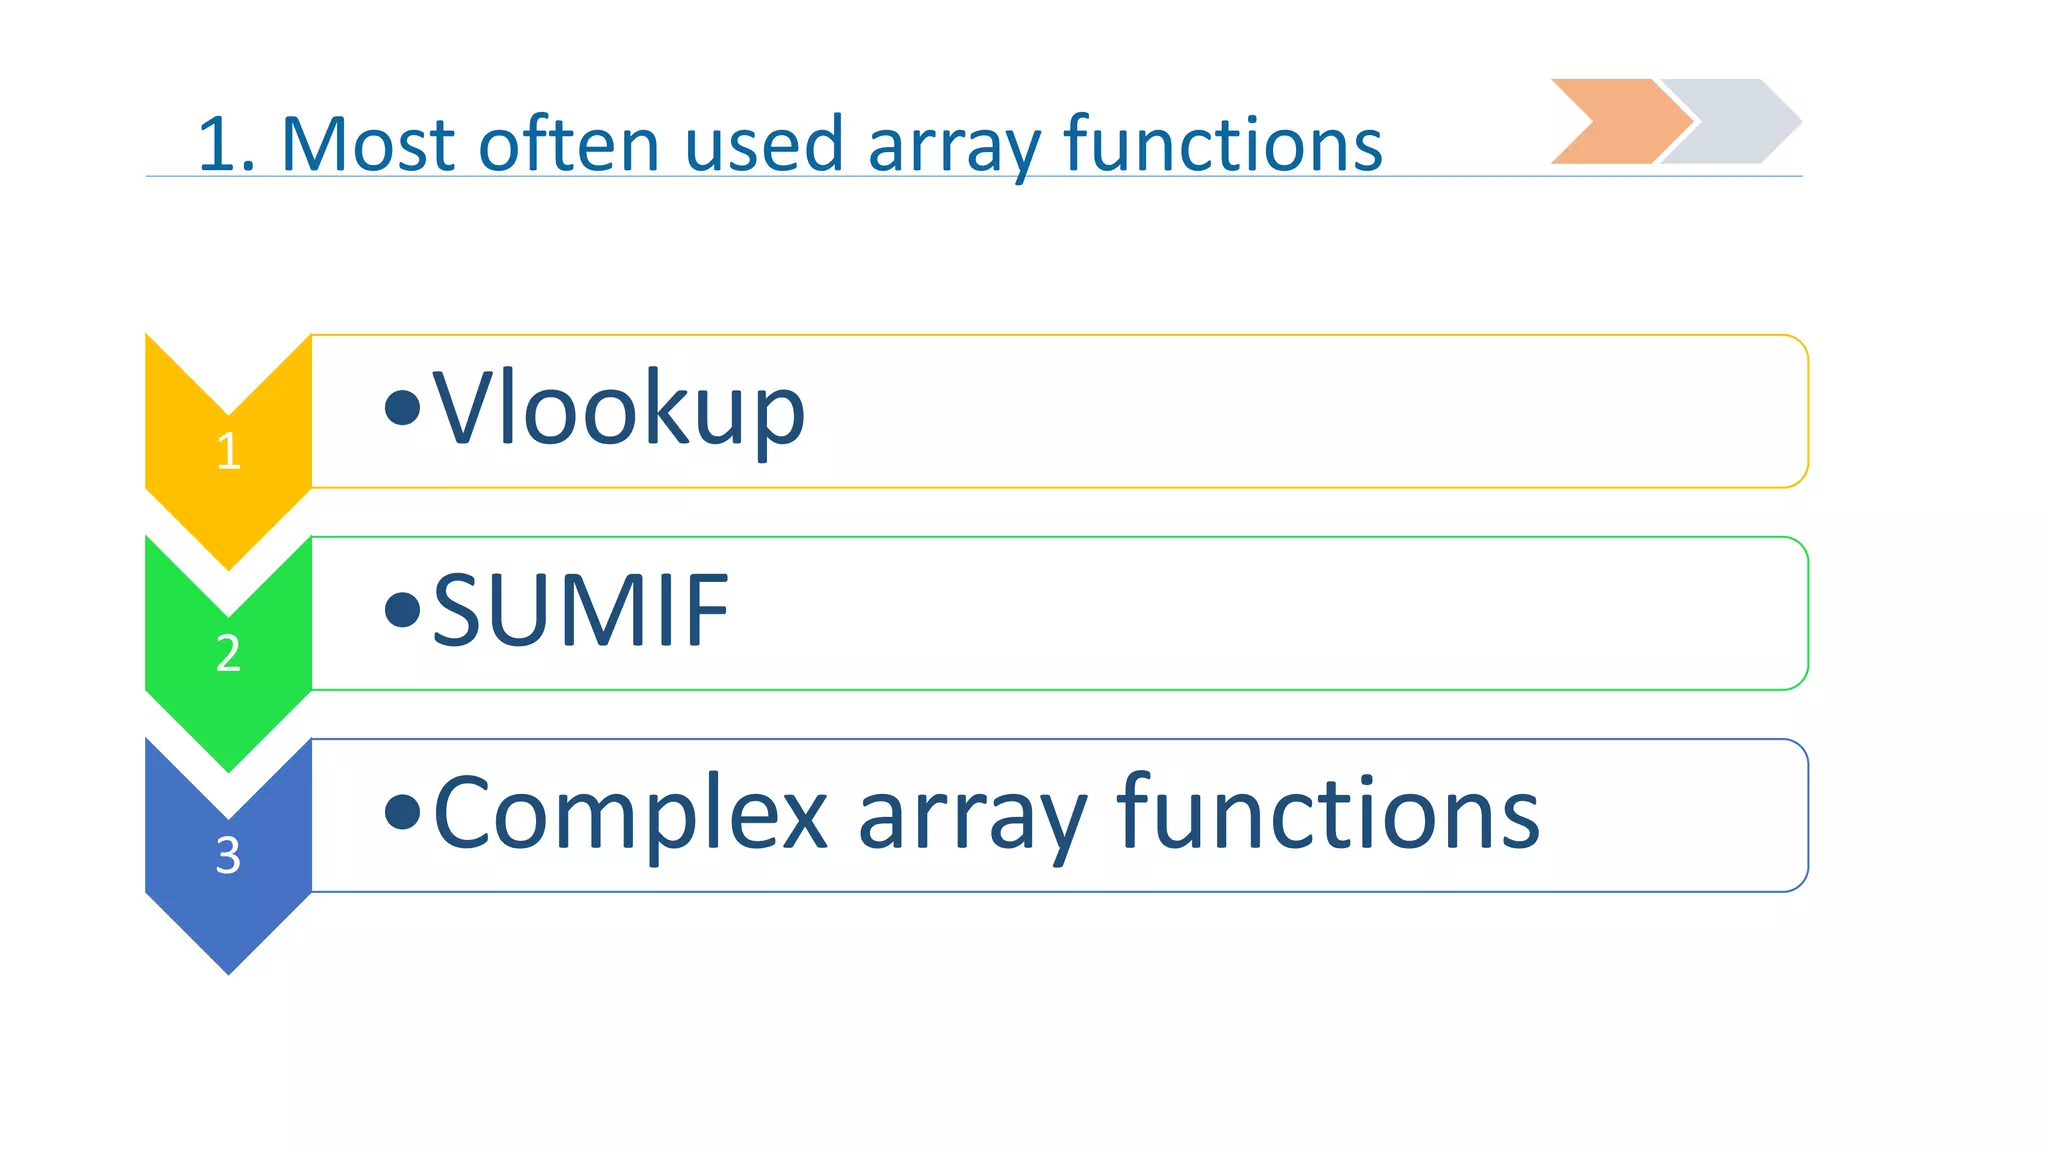
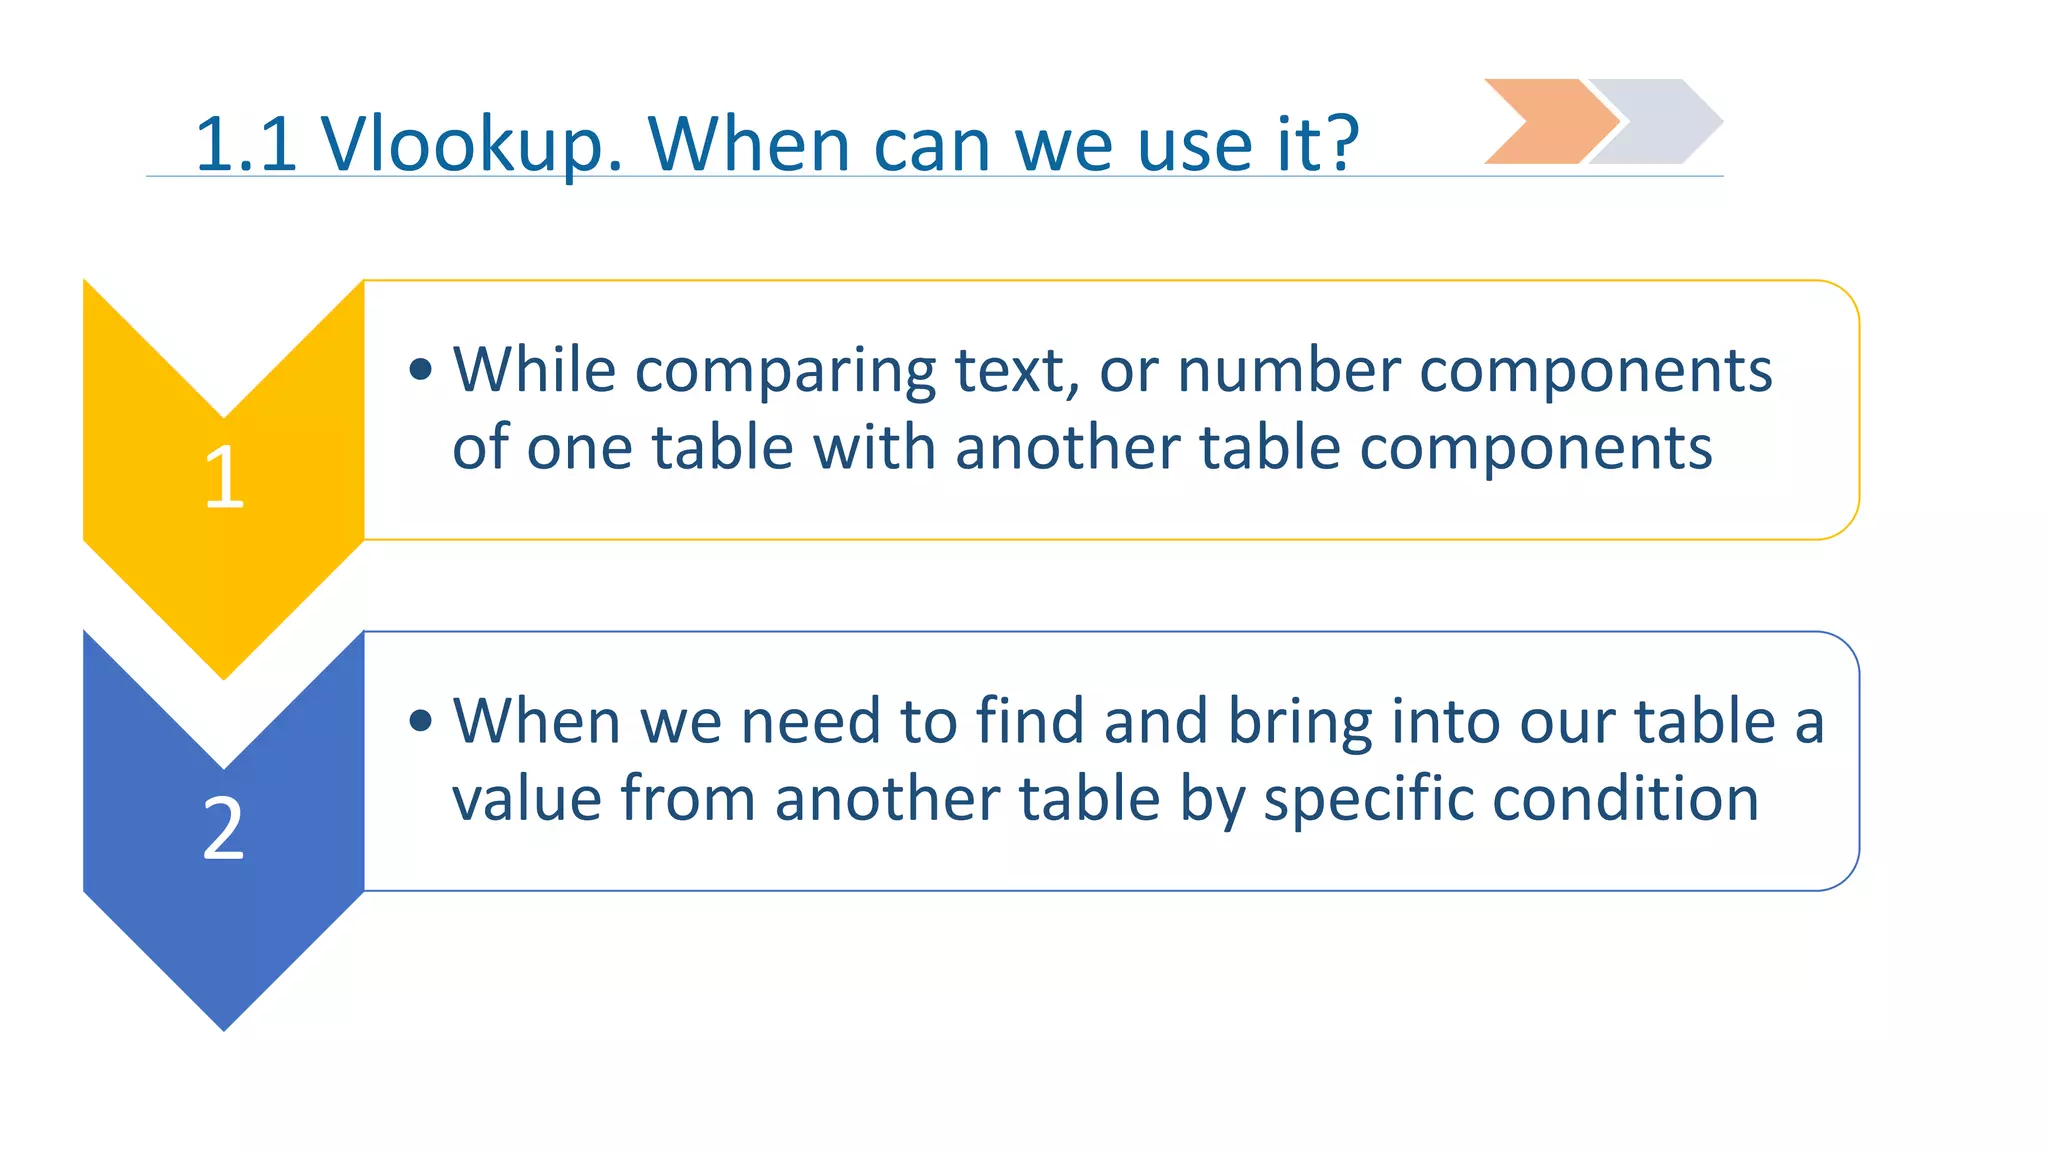
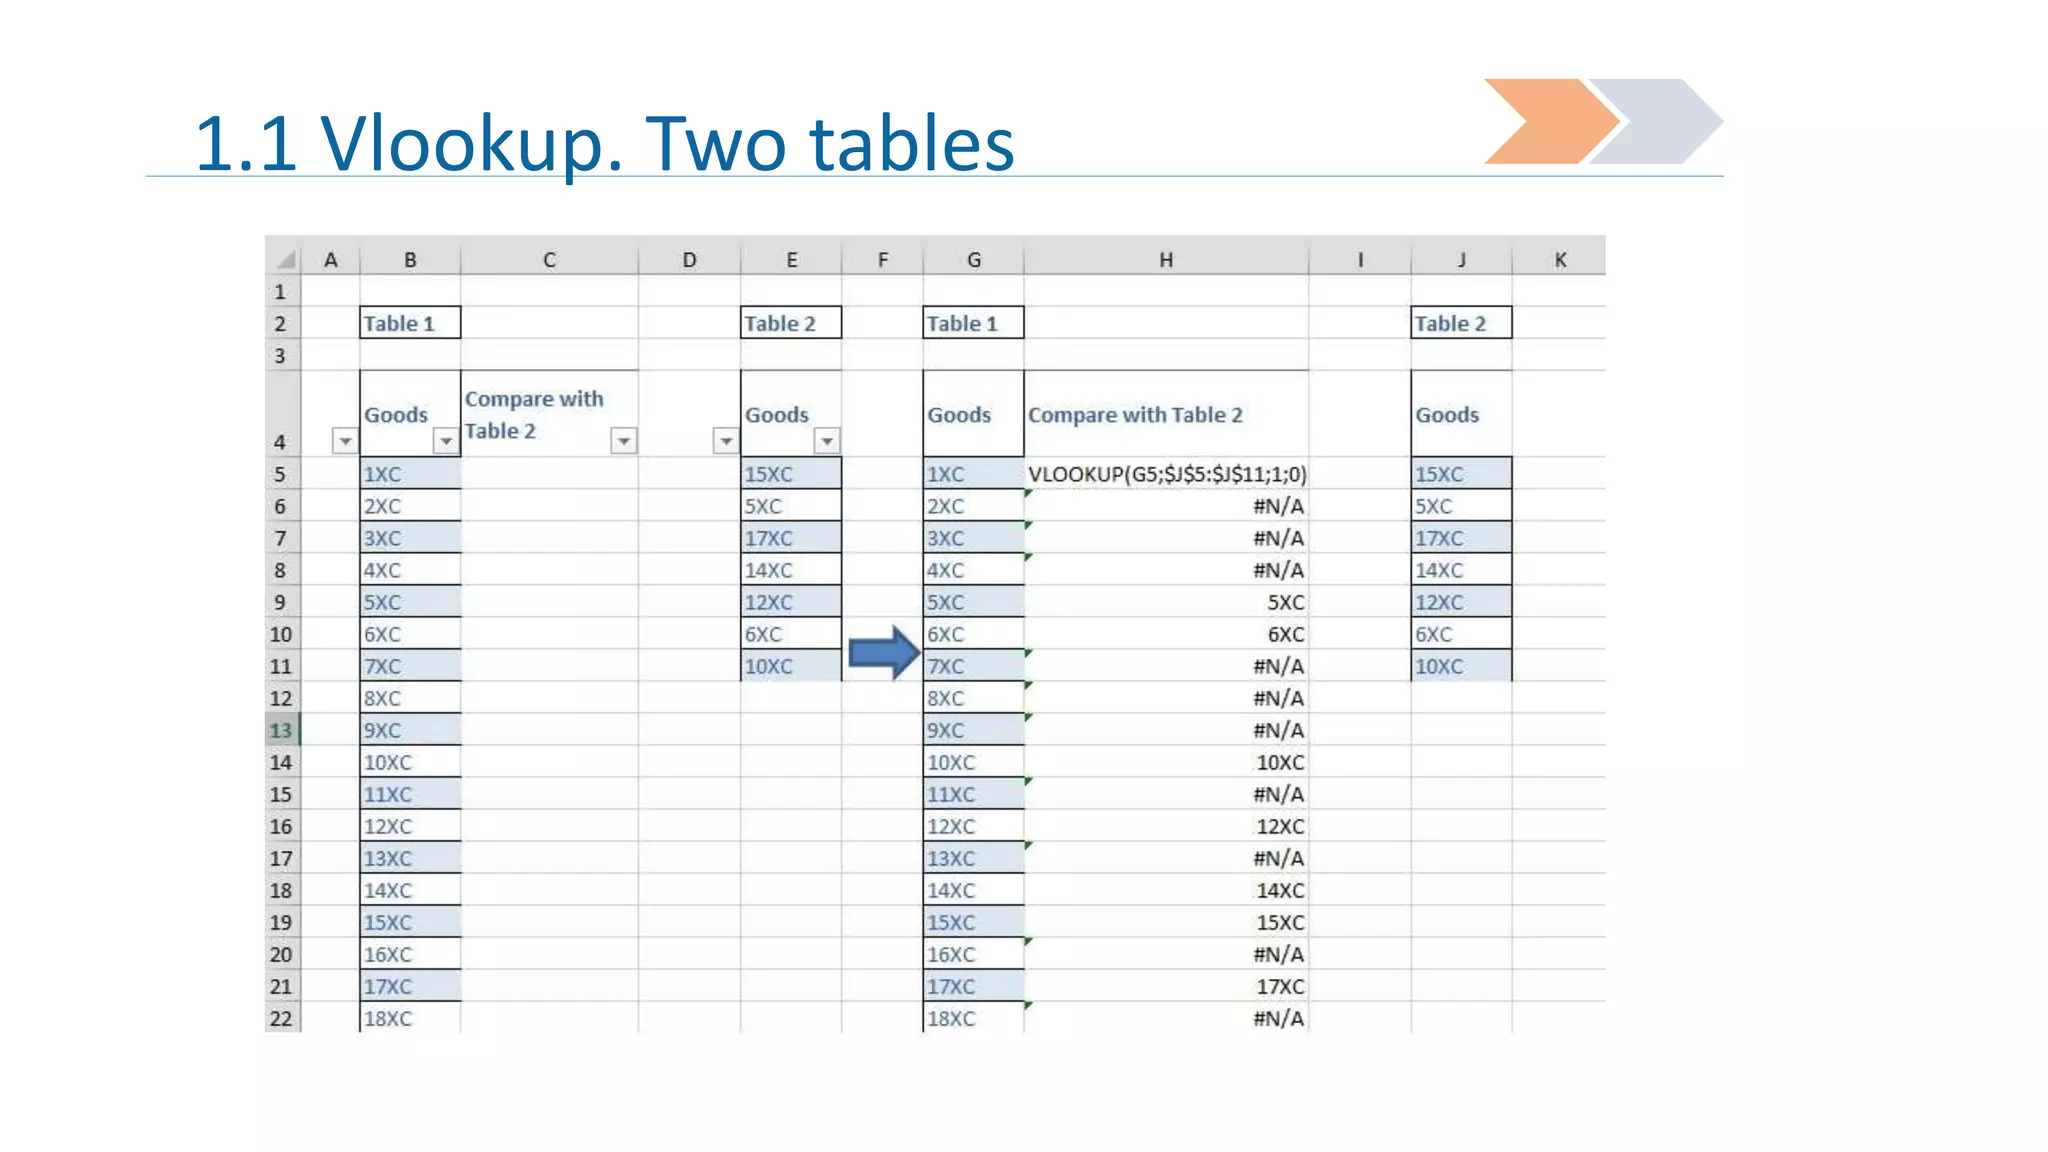
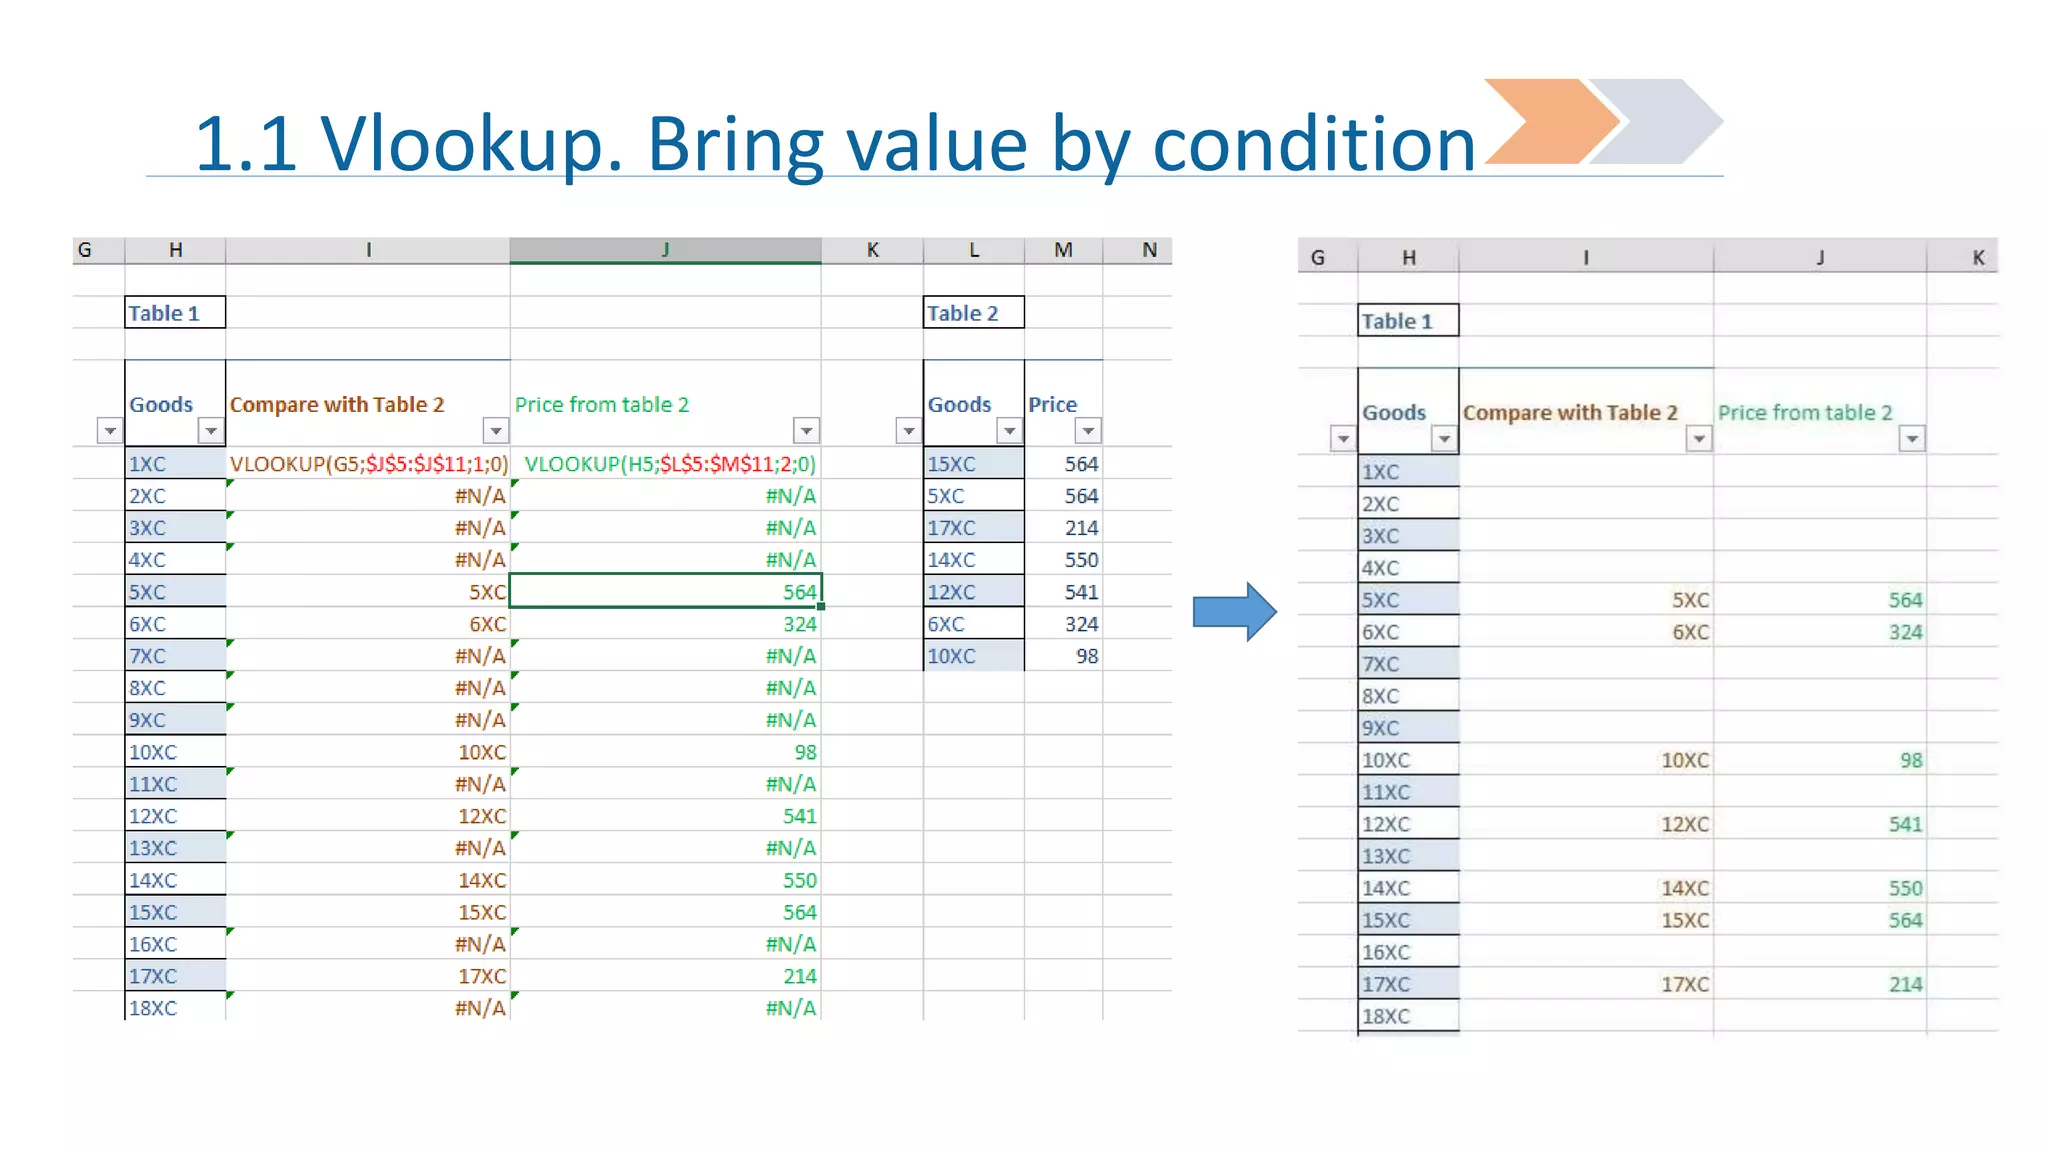
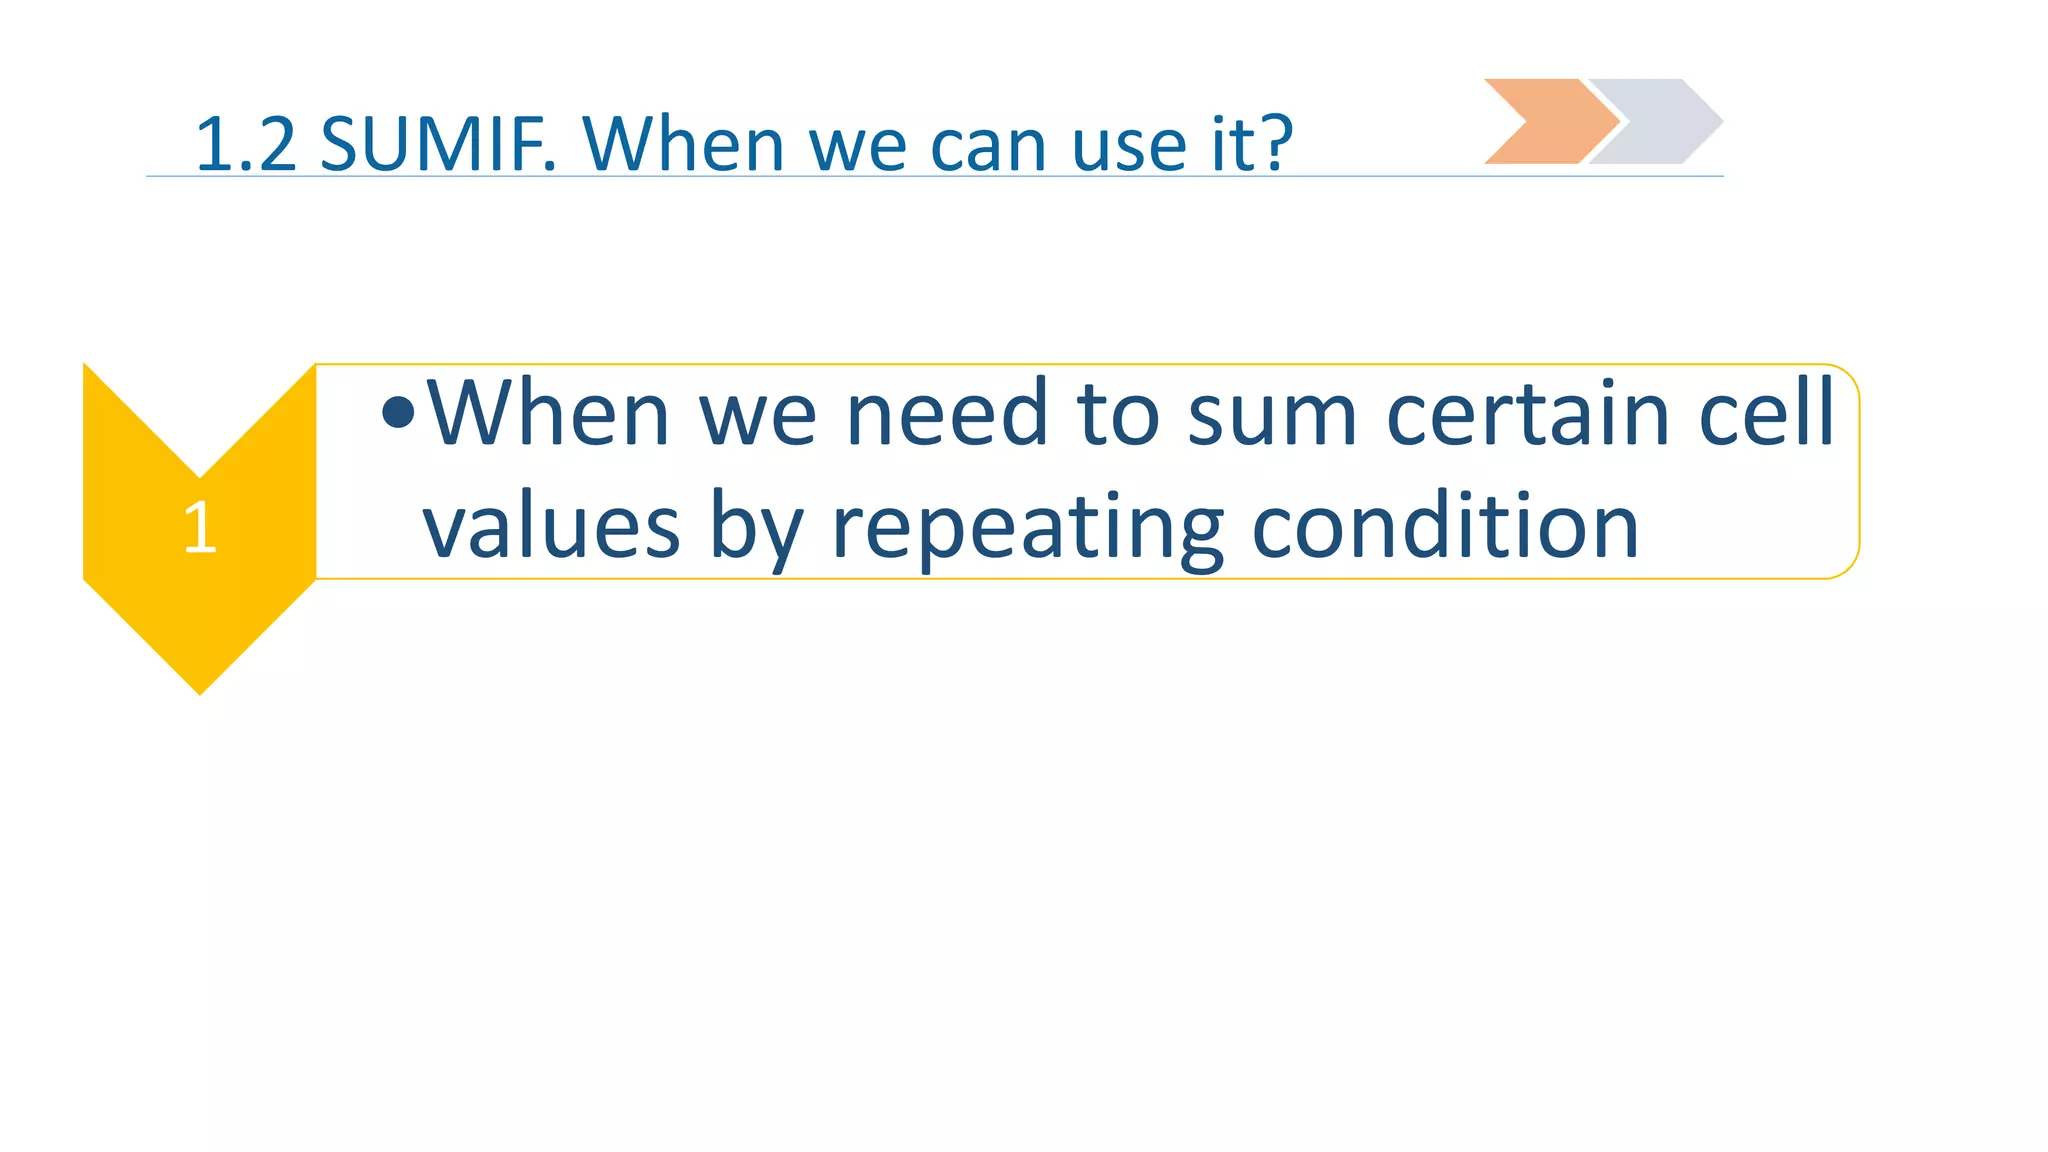
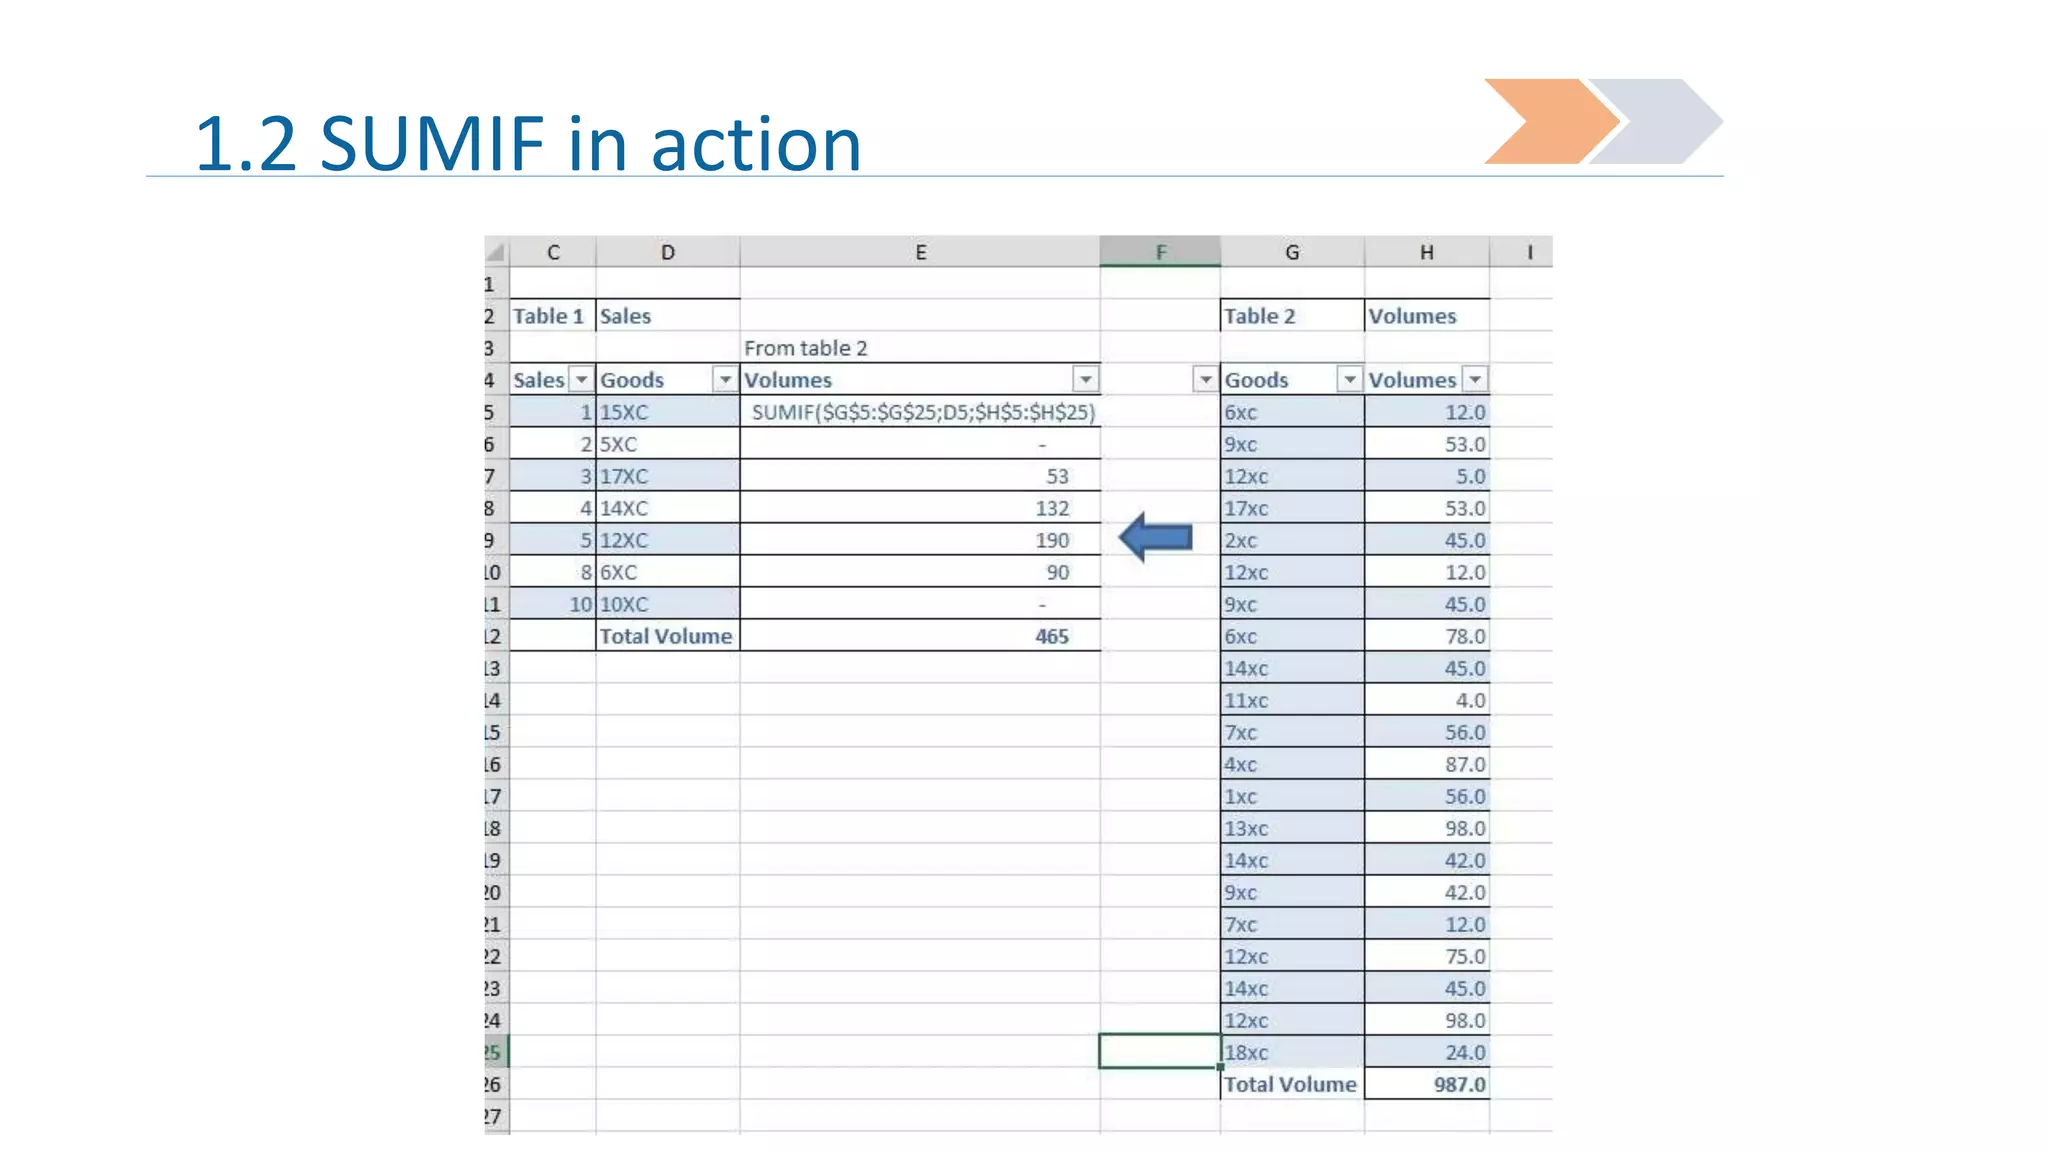
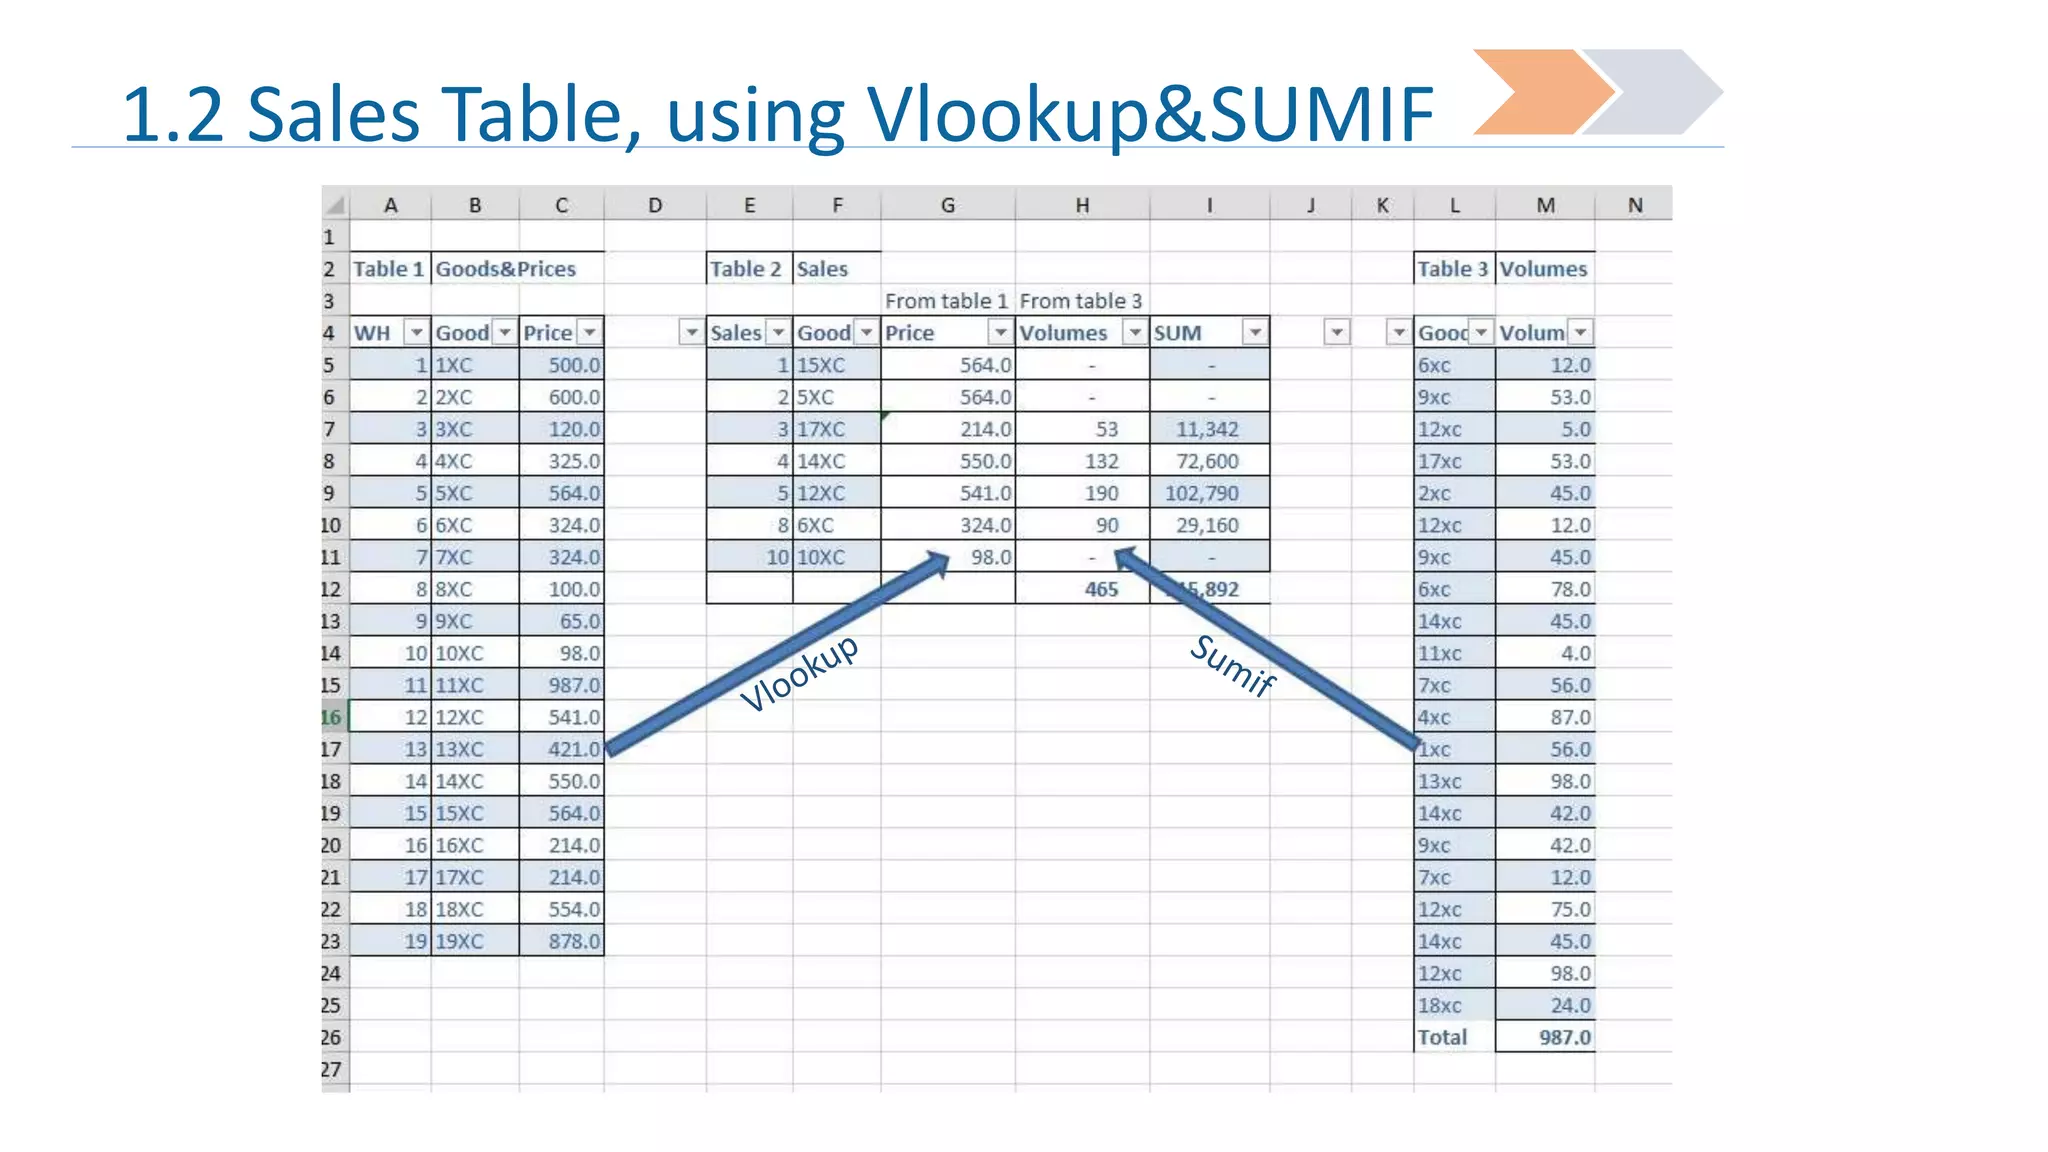
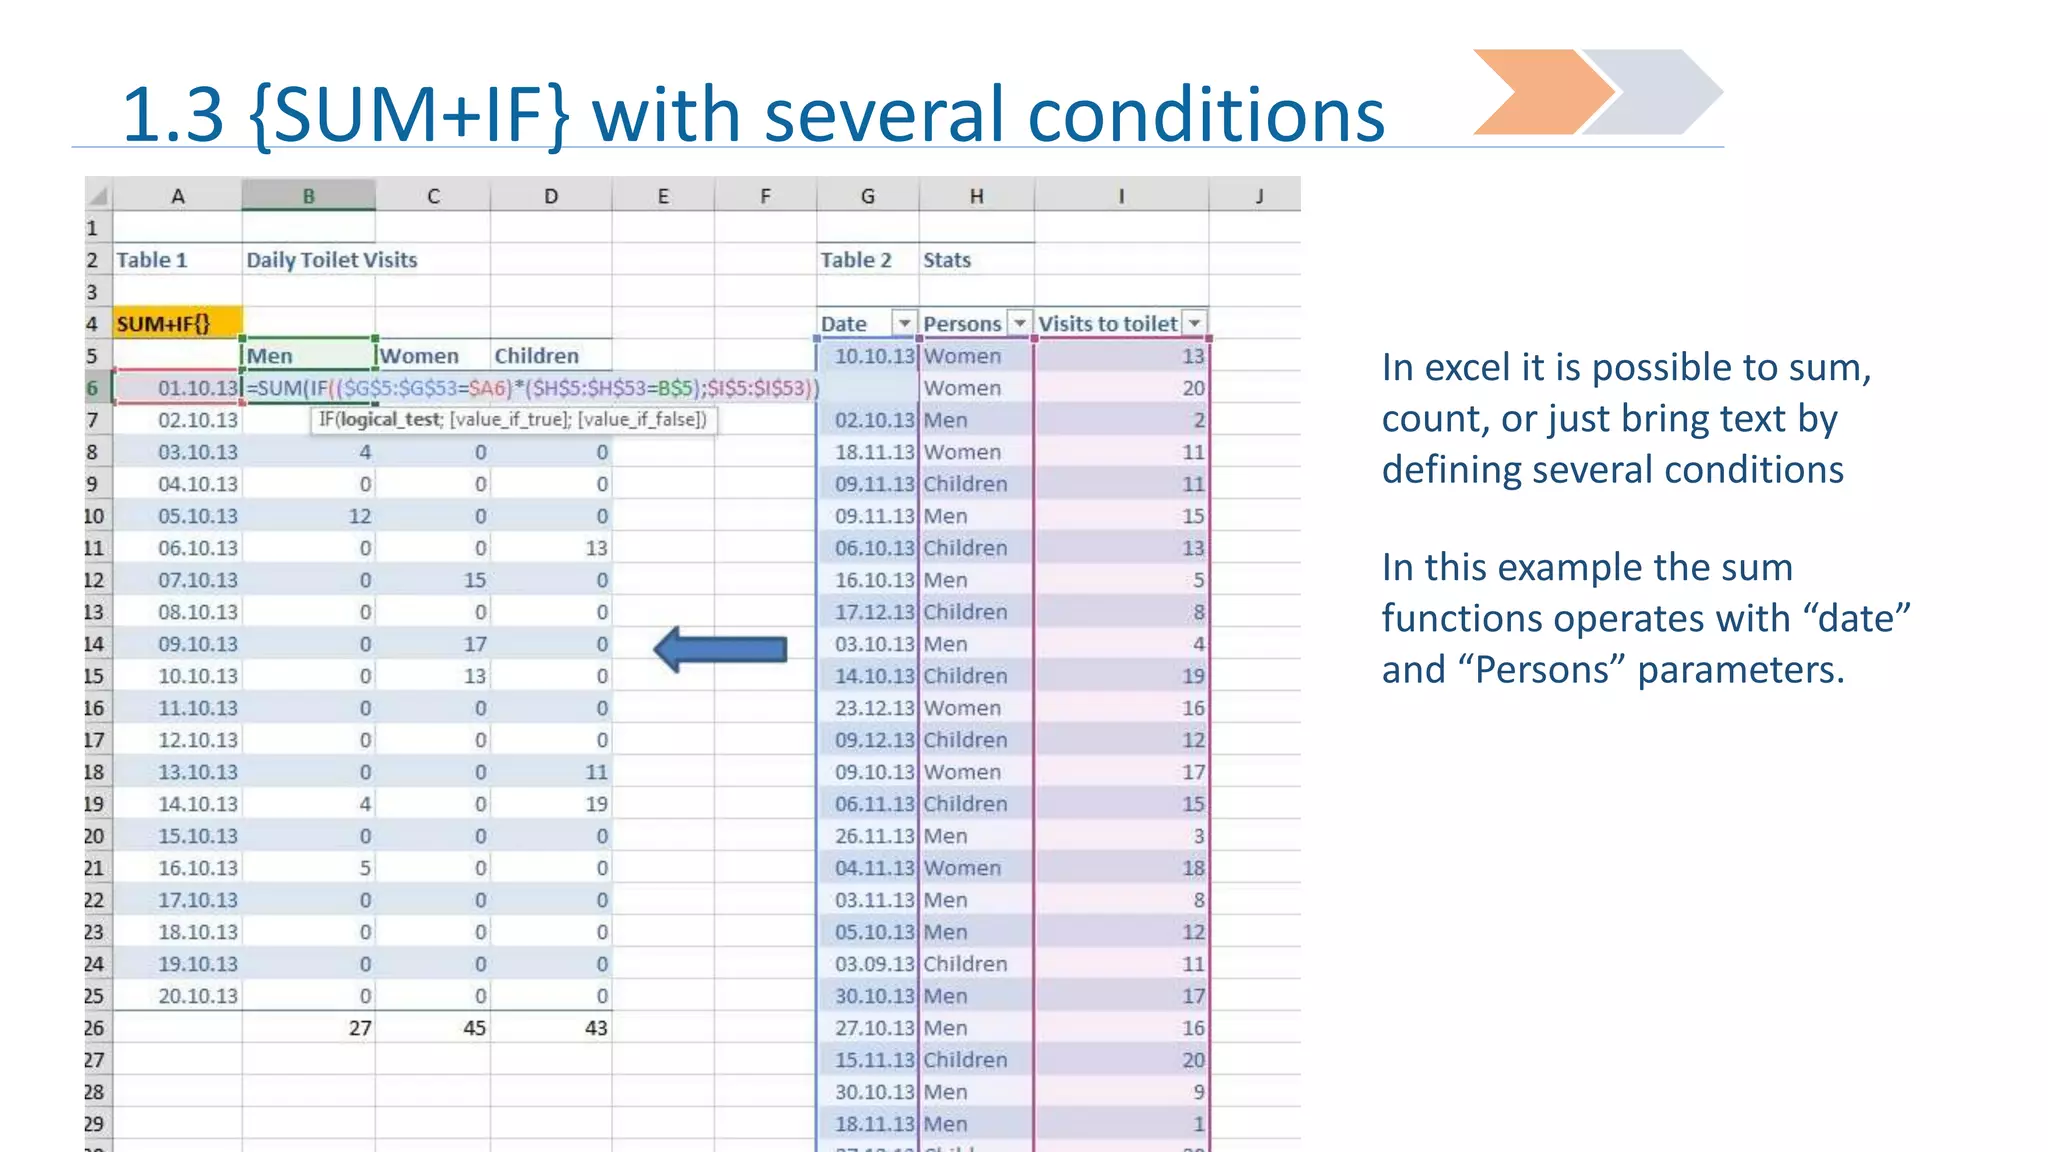
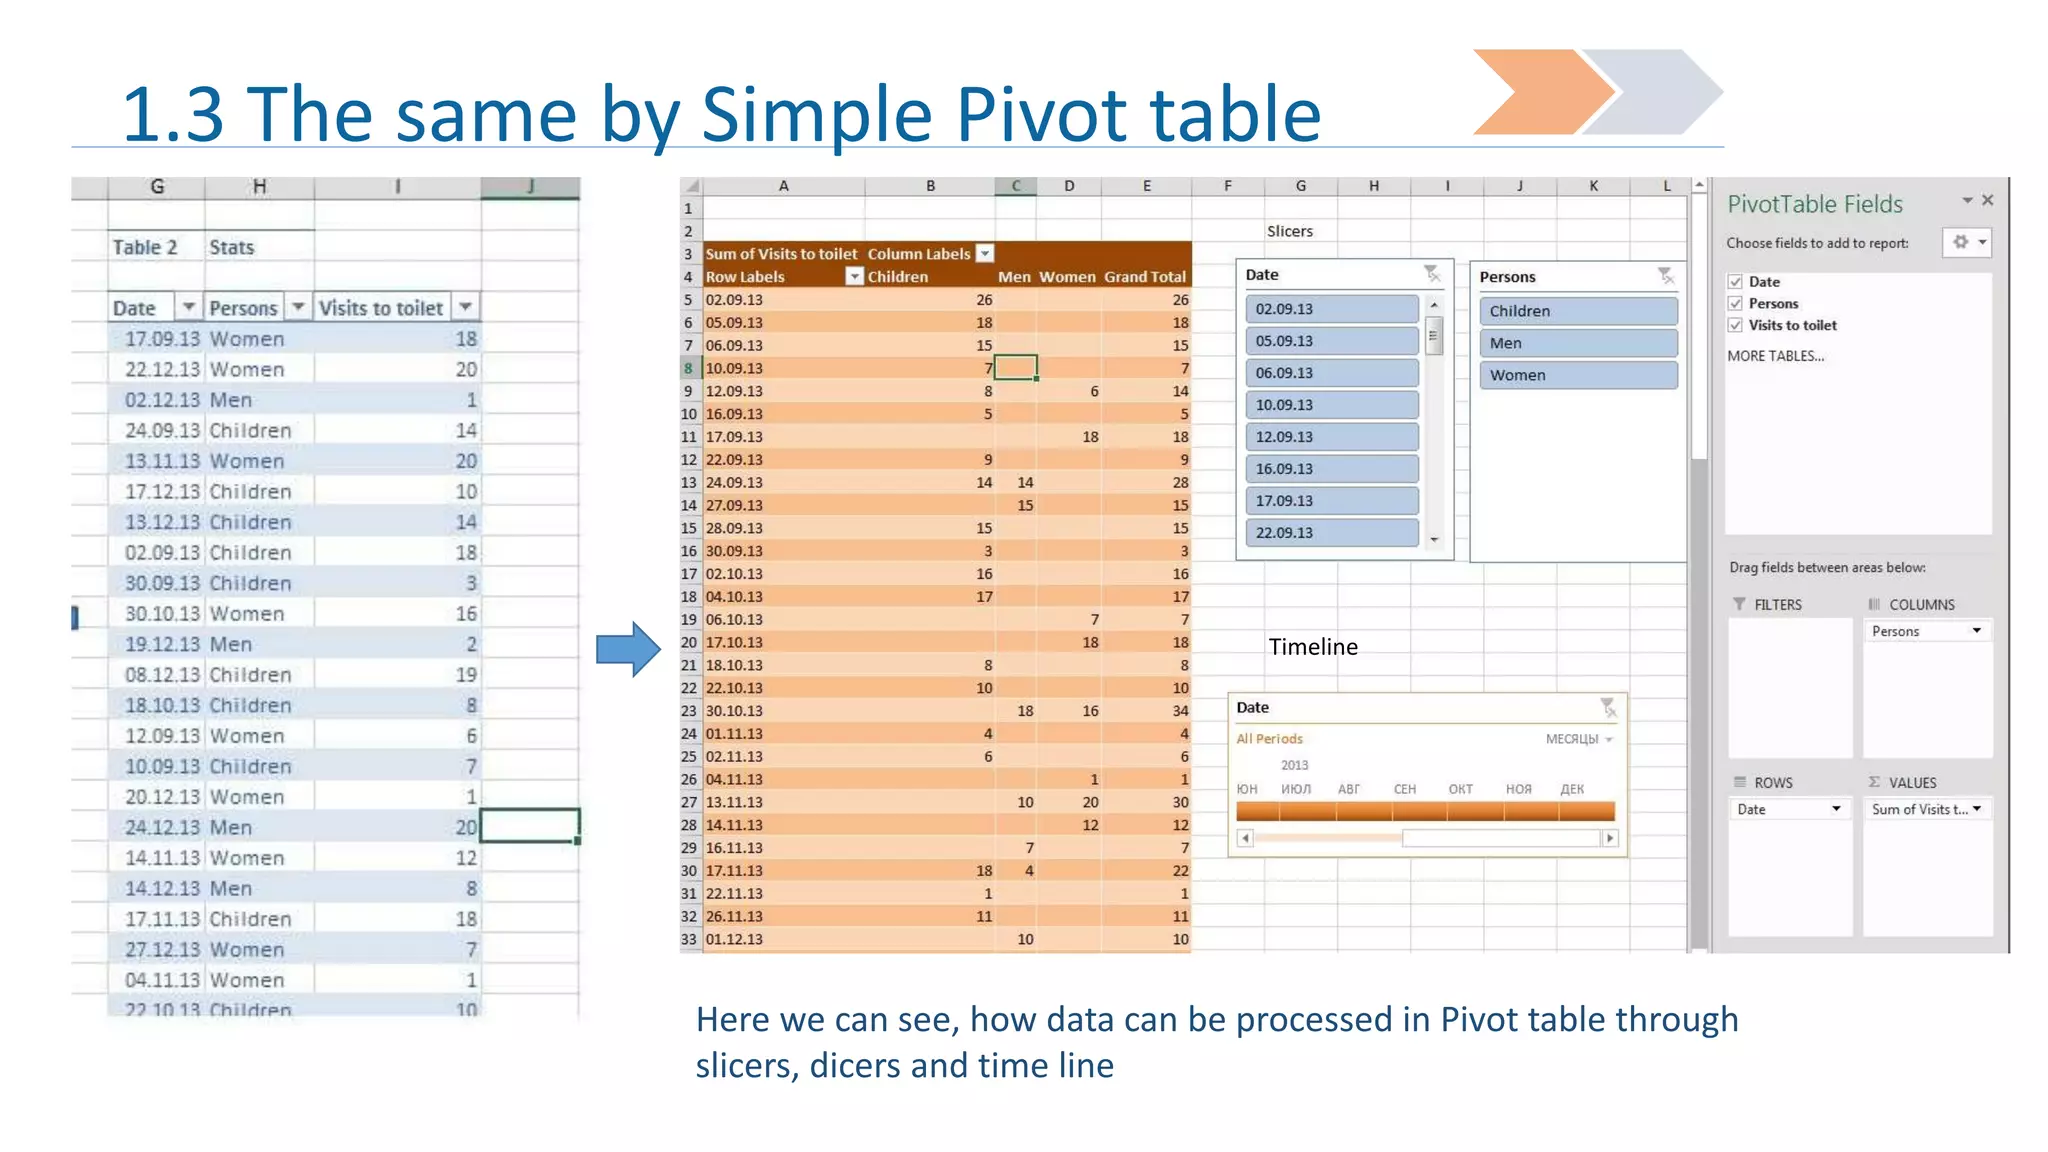
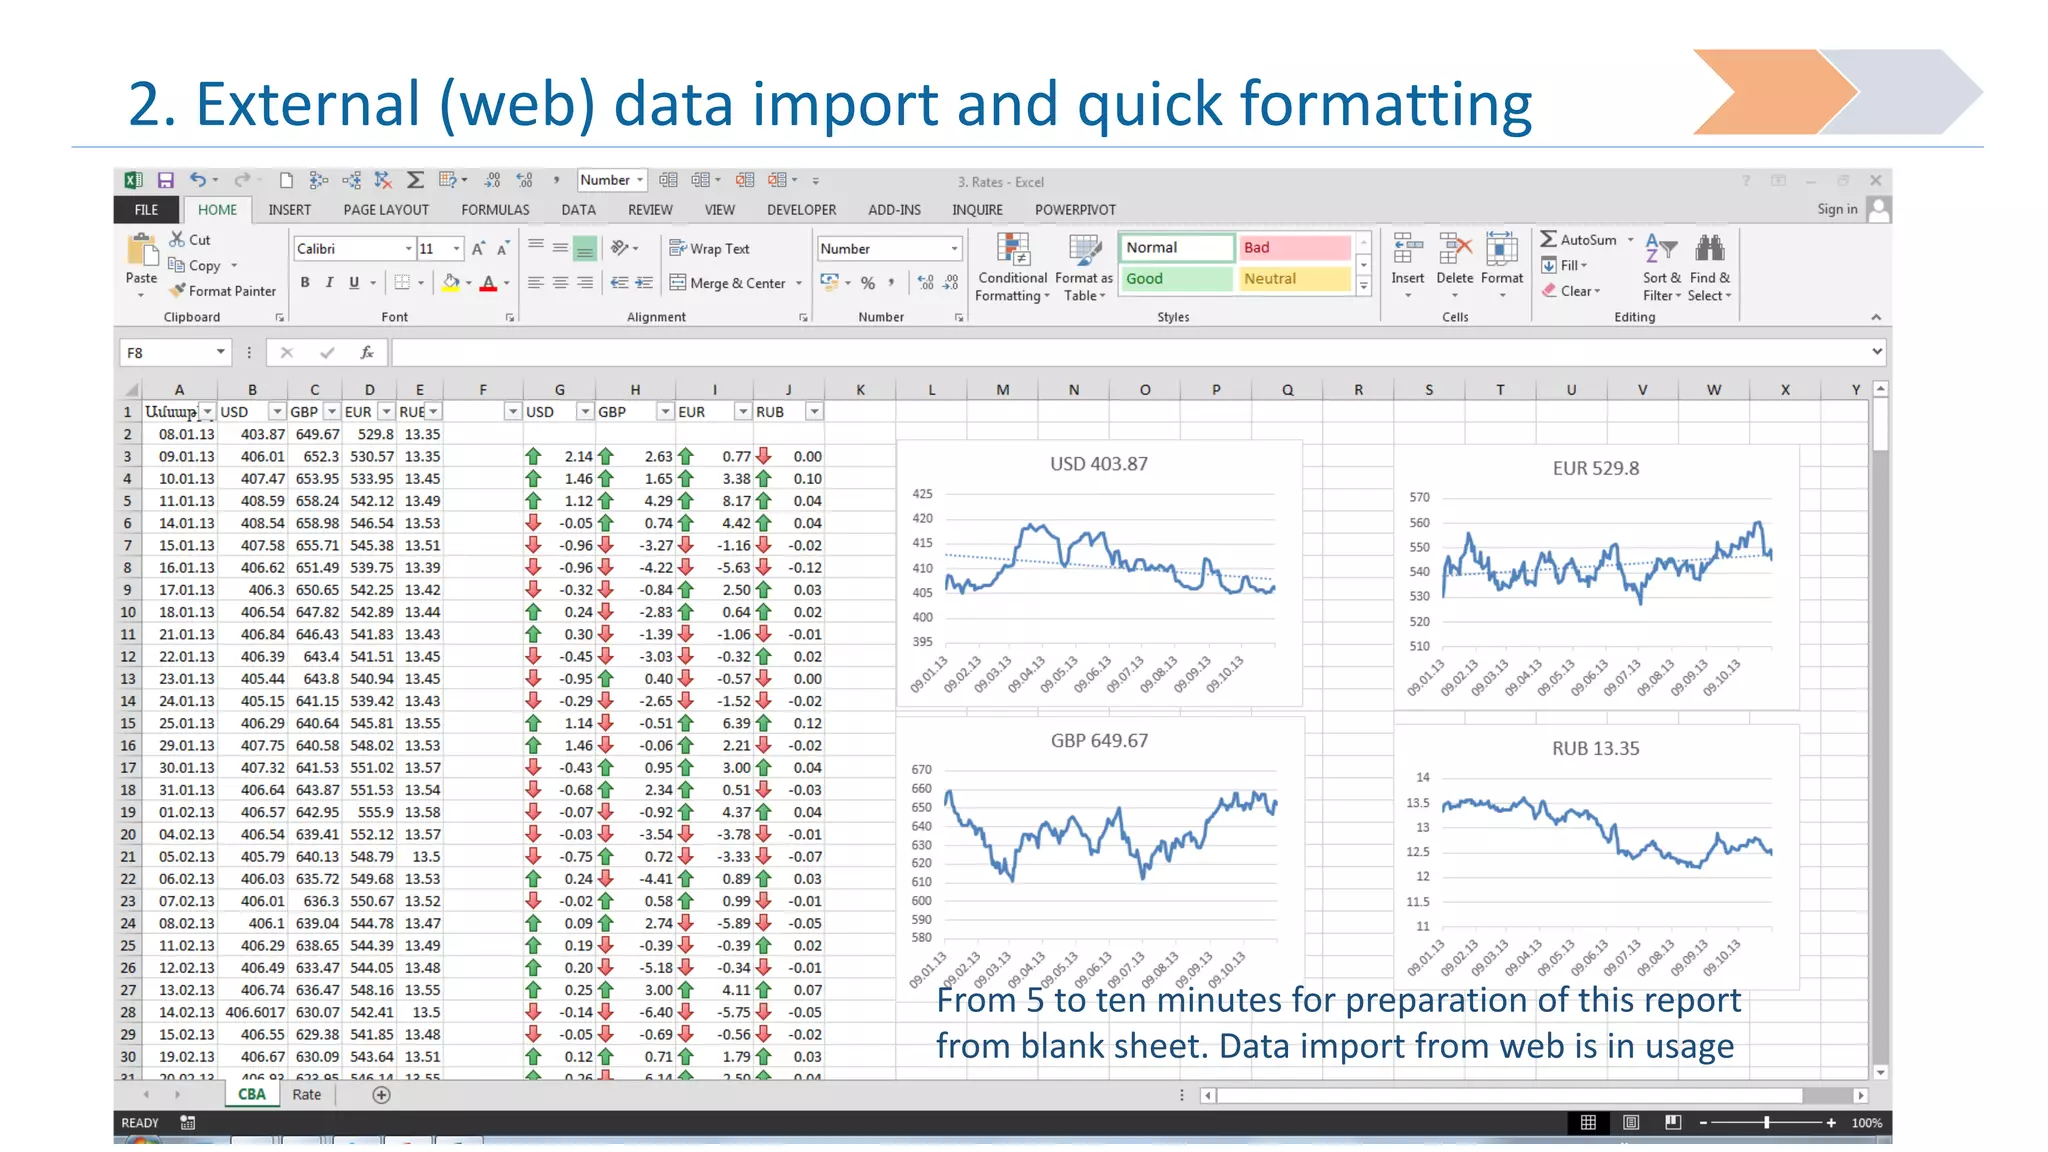
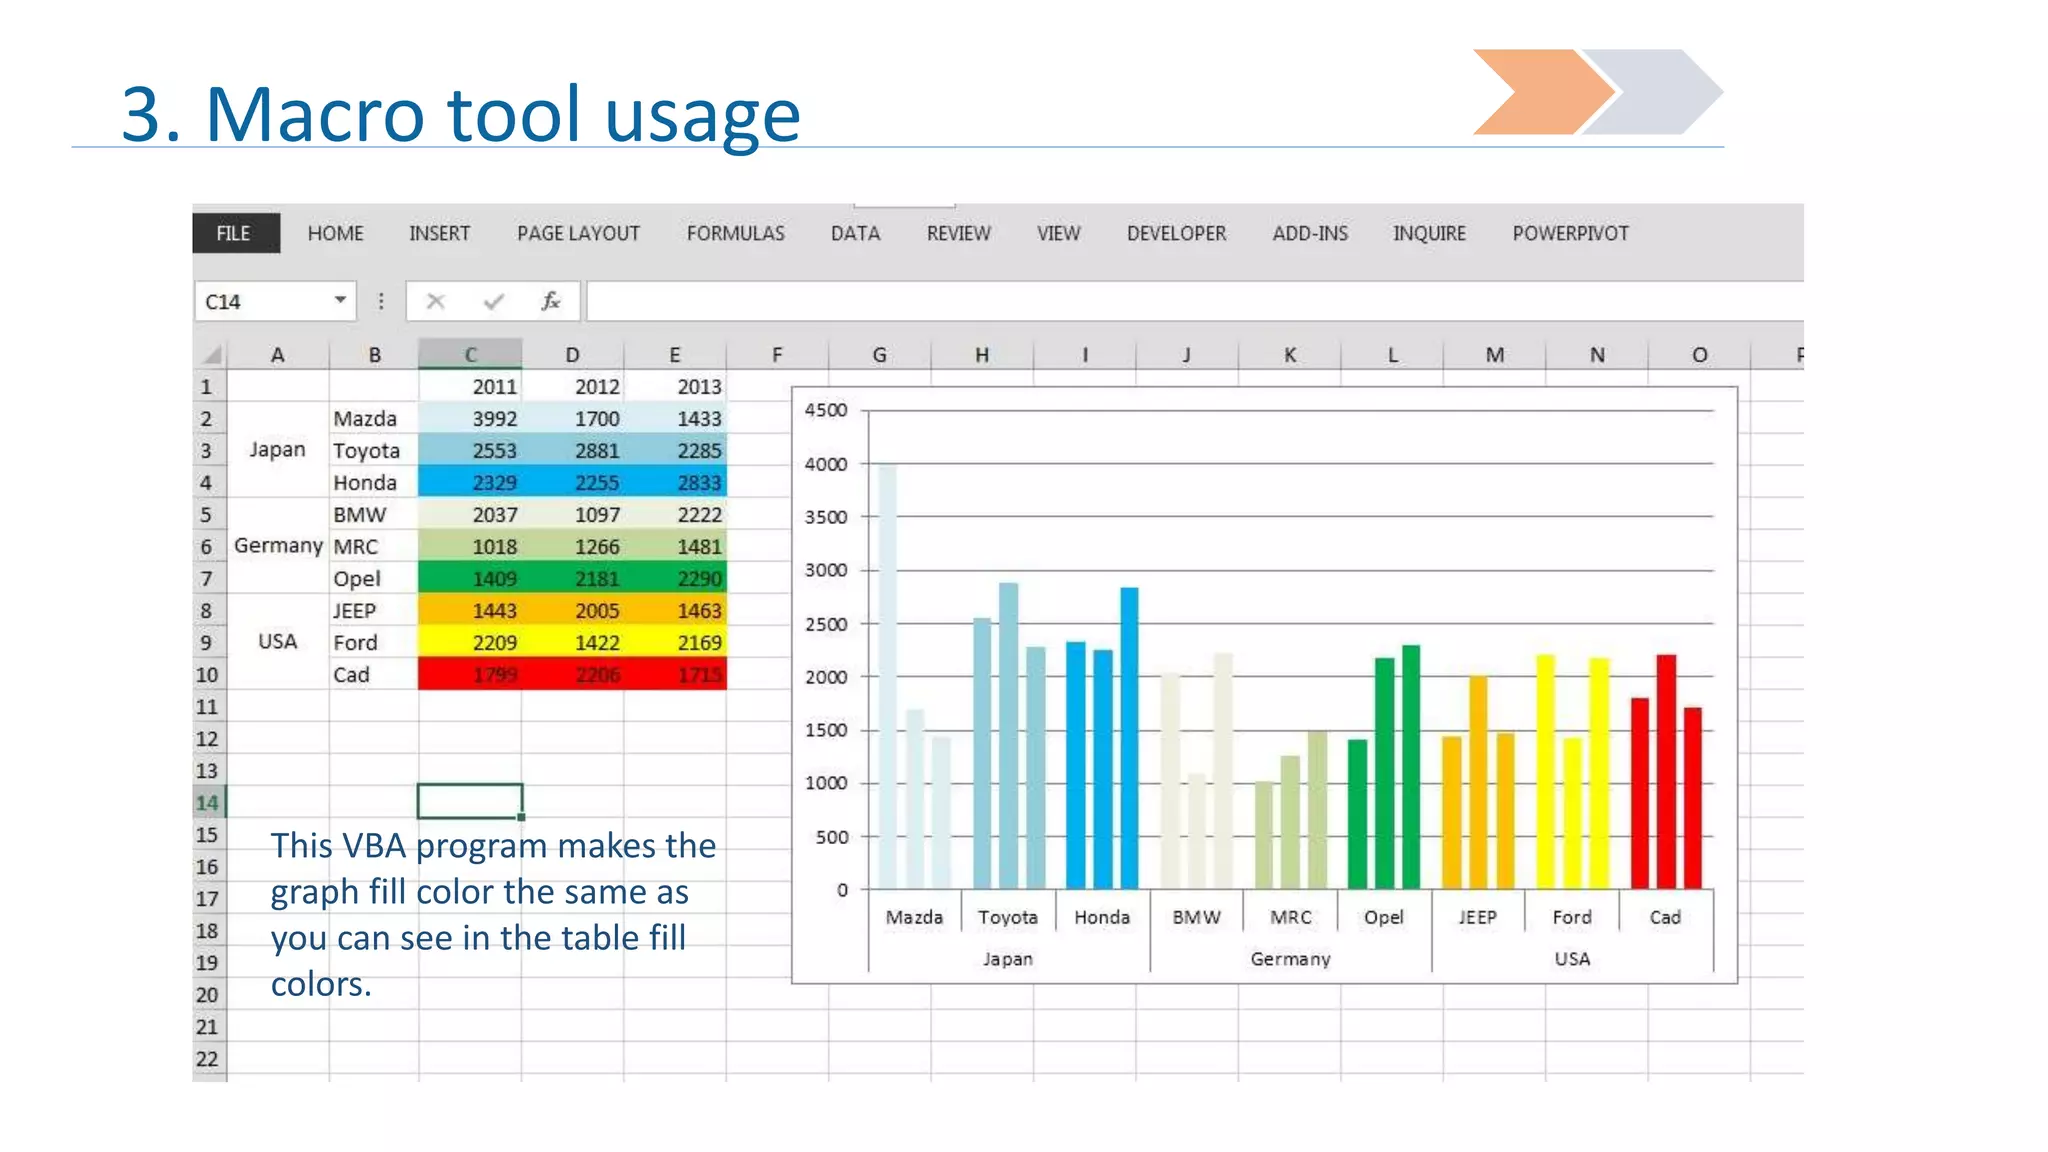
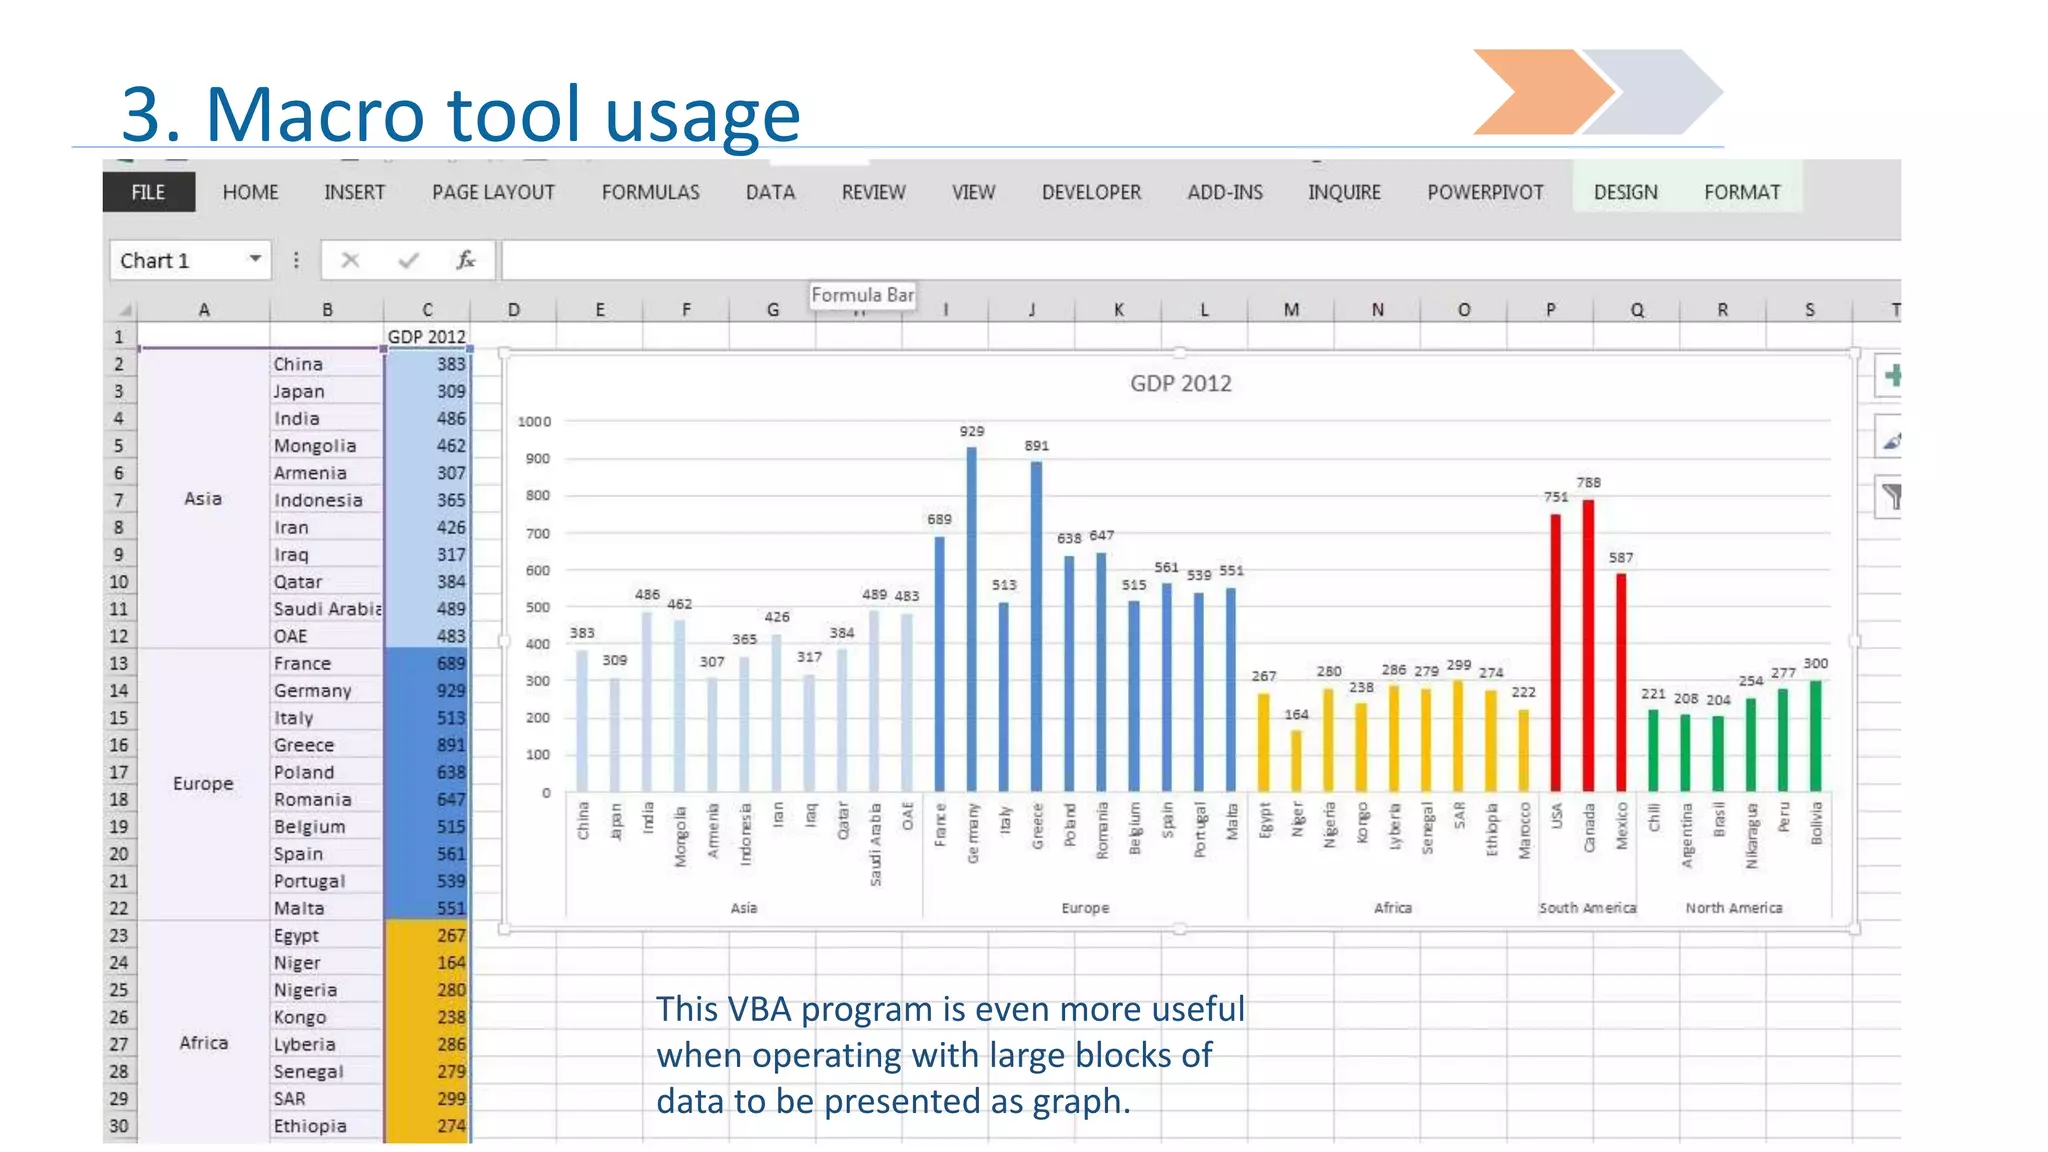
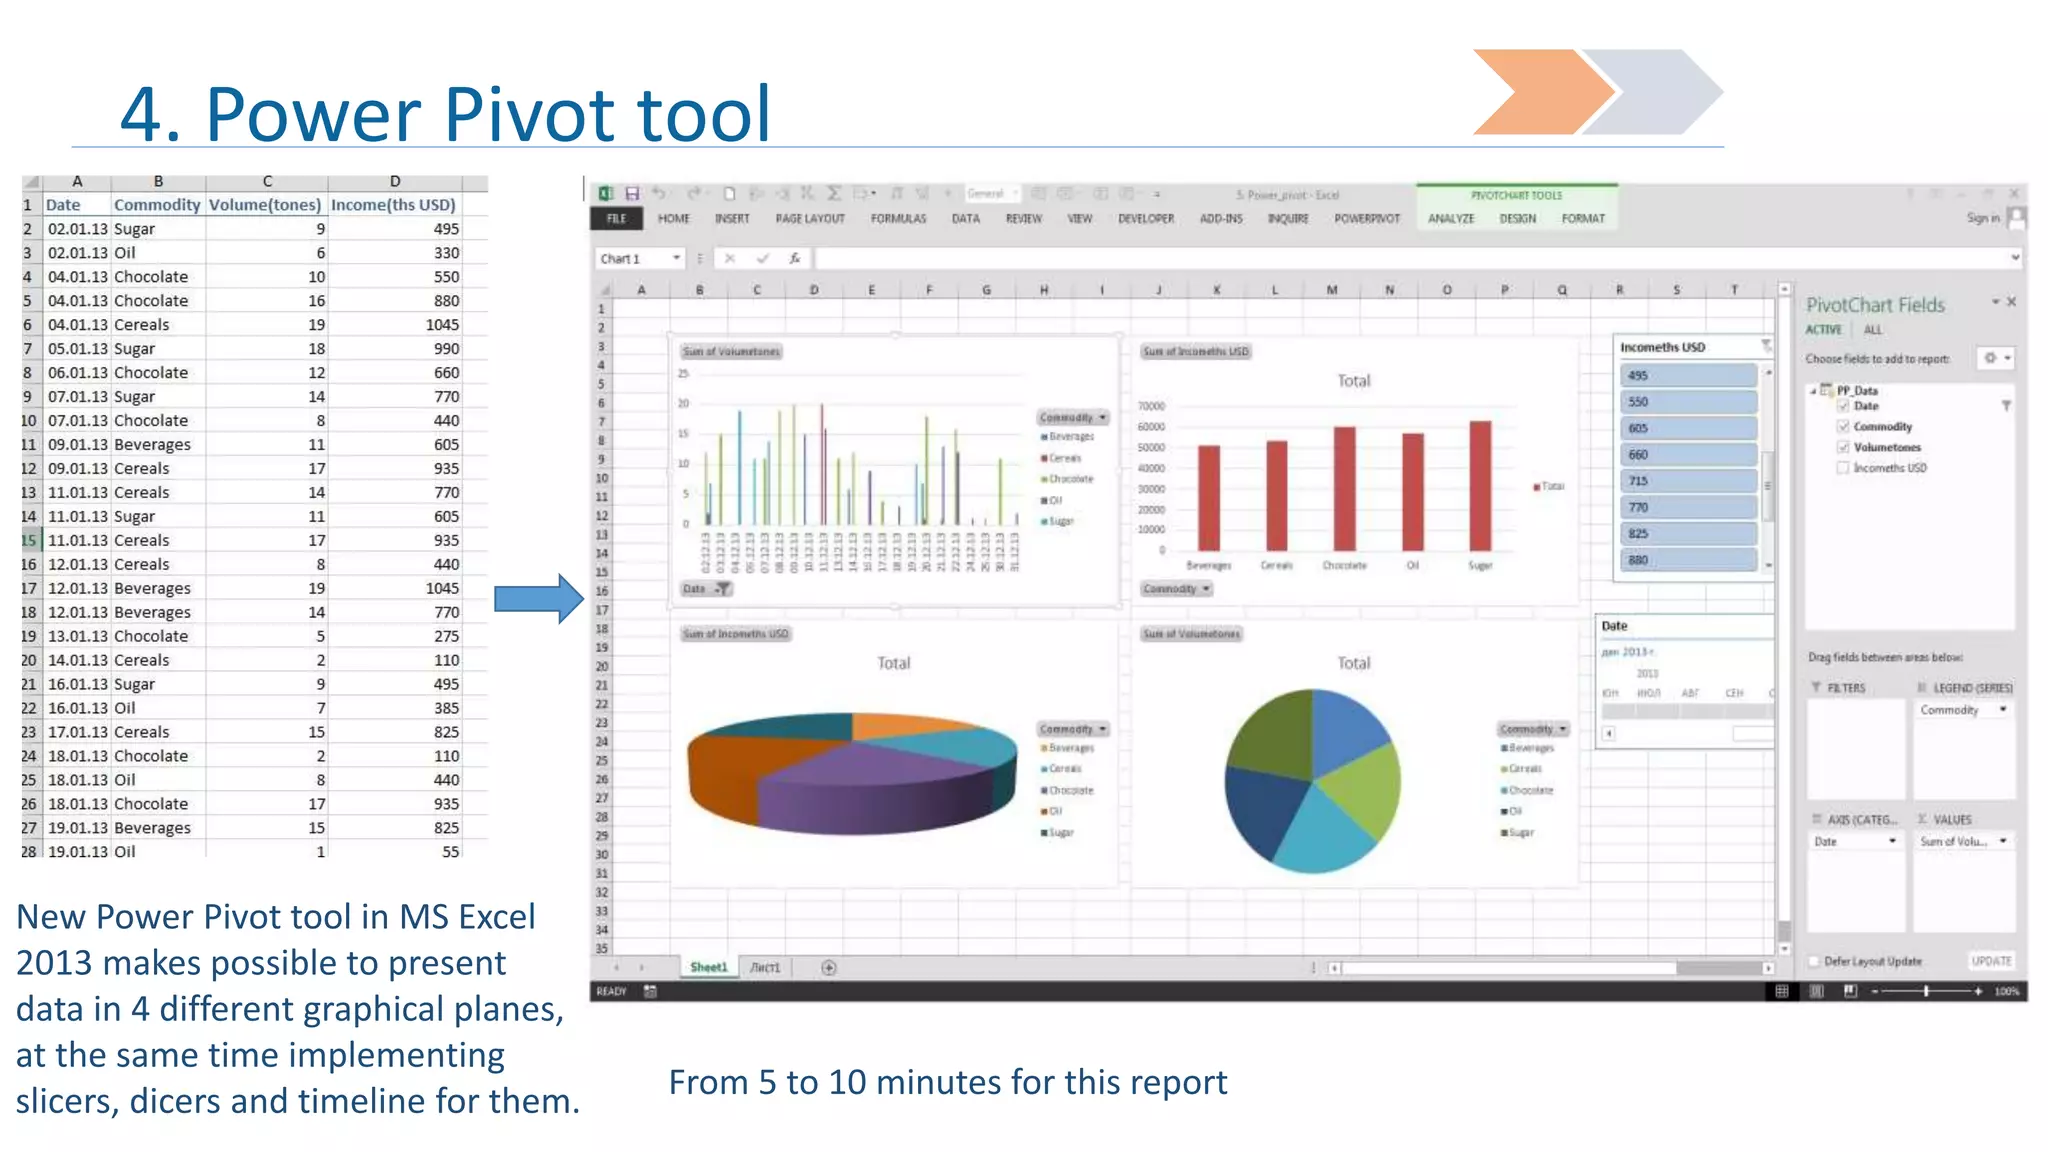
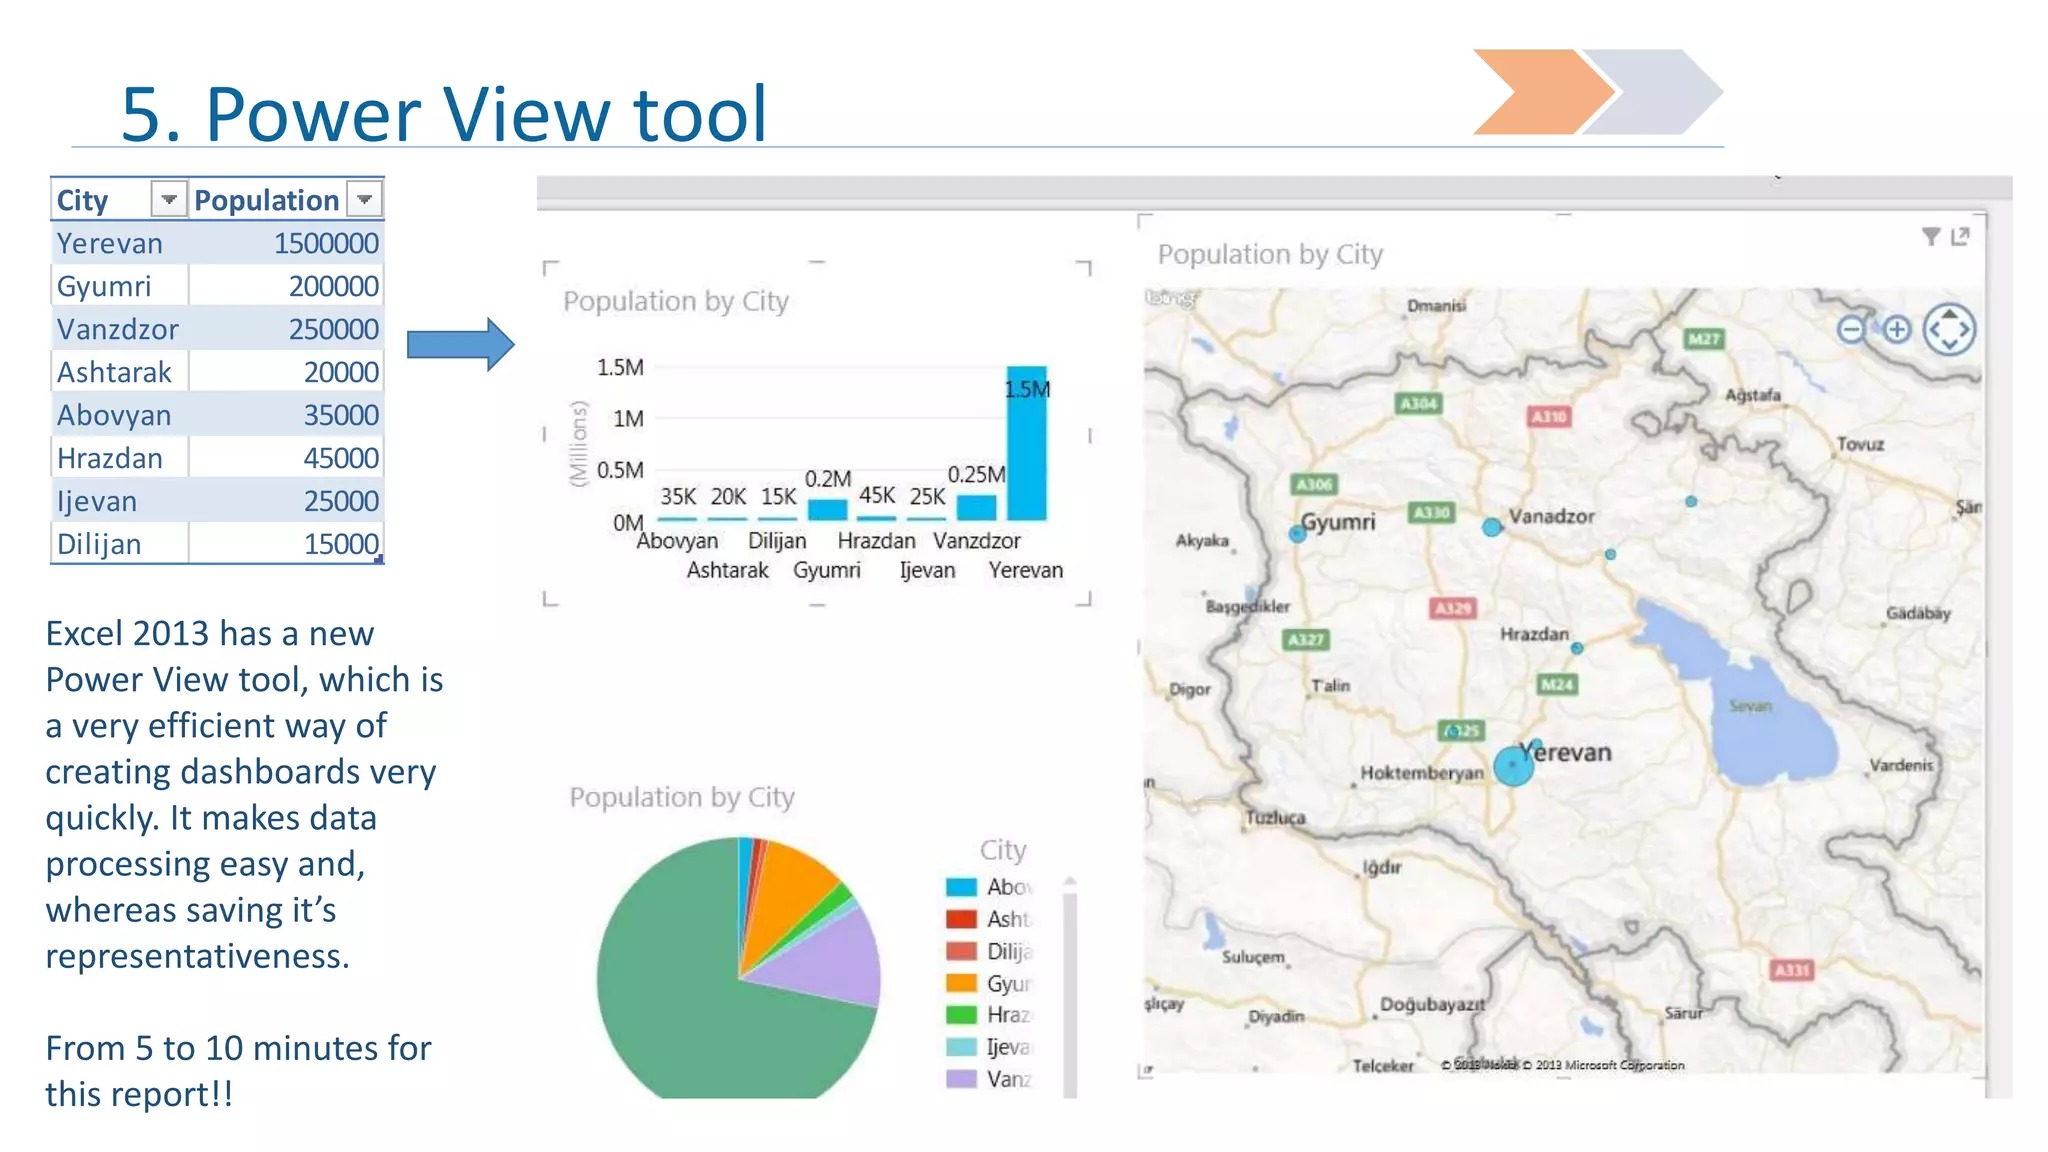


This master class will cover useful tricks in MS Excel and MS Excel 2013, including array functions like Vlookup and SUMIF, importing data from the web and quick processing, working with macro tools, Pivot tables and the new Power Pivot tool in Excel 2013, and the new Power View tool in Excel 2013. The class will demonstrate how to use Vlookup to bring values from one table to another based on a condition, how to use SUMIF to sum cell values based on a repeating condition, and how to define multiple conditions with functions like {SUM+IF}. It will also show how to import and format external web data quickly and how to use macro tools to automatically format graphs based on table data. Finally, it will