SlideShare a Scribd company logo
1 of 37
Download to read offline
PRESERVING THE PROJECT RETURN

        – An Analysis of Costs and Incentive and Non-Incentive Offsets for Improving
                 Sustainability Performance in a Residential Development.


About the Author

Shauna Coffey has over 10 years experience in driving sustainable outcomes in a variety of
industries with specialisations in organisational corporate responsibility and sustainability
strategy, GHG accounting, corporate communications, stakeholder engagement and
improving the resource efficiency of existing building stock.

As a recent graduate of Bond University’s Master of Real Estate (Sustainable Development)
program, Shauna has produced this research paper from work undertaken to satisfy the
requirements of the degree final capstone project for which she received the First in Class
prize. Supervisor: Professor George Earl.

Contact:
Phone       Australia: 0410-227-031                    US: 202-657-6356
Email       shaunacoffey@westnet.com.au


Confidentiality Limitations

Due to the commercially sensitive nature of the information on which the analysis detailed in
this report was performed, the identity of the participating developer, referred to throughout as
the Developer, has been kept confidential. Additionally only percentages, rather than specific
dollar amounts of costs and revenue are disclosed.


EXECUTIVE SUMMARY

Sustainable communities have been defined as places where people want to live and work,
now and in the future. They meet the diverse needs of existing and future residents; are
sensitive to their environment; and contribute to a high quality of life. They are safe and
inclusive, well planned, built and run, and offer equality of opportunity and good services for
all.


                                                                                                  i
While the benefits of such an approach to the delivery of new communities are obvious, the
uptake by residential developers has been limited, primarily due to a number of market and
non-market barriers to adoption beyond boutique special purpose developments. Principal of
those is the classic split incentive, the real world experience that the residential homebuyer
will not pay more for a more sustainable home, yet is happy to reap the benefits, especially
those related to lower operating expenses. While in order to deliver the more sustainable
home, the developer must accept a lower project return. Not a financially sustainable option.

Historically the cost of improved sustainability performance has been the focus, however
there are a number of points in the development process where delivering a higher
sustainability standard may provide returns that have not previously been accounted for.
Specifically the impact of increased sales rates, increased promotion and public awareness
and access to proposed incentives such as ‘green door’ development approvals which give
priority to development with sound sustainability credentials.

Additionally, by exploring and modelling incentives for residential developers to improve
sustainability performance from around the world, it is also possible to ascertain what impacts
these incentives may have on project return, therefore allowing for informed and targeted
lobbying of Governments.

This project provides an analysis of costs and incentive and non-incentive offsets for
improving sustainability performance in a residential development using two financial
performance metrics. The traditional Internal Rate of Return (IRR) and an additional in-house
metric utilised by the participating Developer, the Value Add (VA).

In all over 21 different offset scenarios have been modelled, with only one, the Section 94
construction cost offset, able to fully counter the impact on IRR and VA of development cost
increases. The tax credit for 8% of allowable construction cost increases was the least
effective, unsurprising, given the limited range of construction costs for which it could be
applied and therefore limited revenue impacts.

One of the most encouraging results was the impact of an increased sales rate. A modest
increase in sales rate of 2% increase over the first three months returned an IRR only 120
basis points (-4.1%) below the base case. The effect is further enhanced when combined with
other offsets such as reduced selling and marketing cost. It demonstrates that there are means,
already within the control of a developer, which can preserve the project return.


                                                                                                  ii
In order to crystallise this potential, recommendations are made in the following areas:

     1     Improve the communication of sustainability features to purchasers
     2     Increase the understanding in the general population of benefits of more
           sustainable homes
     3     Use the Developer’s position within industry groups to lobby for a number of
           incentives in the following order of preference:
           o Section 94 redistribution to the project
           o ‘Green-door’ expedited development approvals
           o Sizable rebates per dwelling

While the classic split incentive of costs being met by the developer and benefits accruing to
the purchaser remains, there will be no wholesale, voluntary adoption of more sustainable
residential development.

Project input has been sought from a range of sources, indirectly through published research
and directly through engagement with property industry players including in-house specialists
of the Developer, the Property Council of Australia the Residential Development Council of
Australia and the Green Building Council of Australia.


                                                                                                 iii
TABLE OF CONTENTS
EXECUTIVE SUMMARY.................................................................................................................................... I
1      SETTING THE SCENE FOR SUSTAINABLE RESIDENTIAL DEVELOPMENT ............................ 1
2      BARRIERS AND THE NEED FOR DEVELOPER INCENTIVES ....................................................... 2
    1.1         THE BARRIERS ....................................................................................................................................... 2
    1.2         THE GOVERNMENT RESPONSE AND THE NEED FOR INCENTIVES ............................................................ 3
    1.3         TYPES OF INCENTIVES ............................................................................................................................ 4
2      DEVELOPMENT FINANCIAL REVIEW................................................................................................ 6
    2.1         FINANCIAL PERFORMANCE METRICS ..................................................................................................... 6
    2.2         DEVELOPMENT COSTS ............................................................................................................................ 7
    2.3         ADJUSTMENTS IN THE MODEL ................................................................................................................ 7
    2.4         BASE CASE IRR AND VA ....................................................................................................................... 7
3      IMPROVING THE SUSTAINABILITY PERFORMANCE ................................................................... 8
    3.1         PERFORMANCE RATING TOOLS .............................................................................................................. 8
    3.2         REQUIREMENTS TO ACHIEVE IMPROVED PERFORMANCE ....................................................................... 9
    3.3         COSTS TO ACHIEVE IMPROVED PERFORMANCE .................................................................................... 11
4      OFFSET SCENARIOS .............................................................................................................................. 13
    4.1         INCENTIVE IMPACTS ............................................................................................................................. 13
    4.2         NON INCENTIVE IMPACTS ..................................................................................................................... 17
    4.3         COMBINED OFFSET SCENARIOS ............................................................................................................ 21
5      DISCUSSION ............................................................................................................................................. 23
6      RECOMMENDATIONS FOR ACTION ................................................................................................. 26
APPENDIX 1 ....................................................................................................................................................... 28
REFERENCES .................................................................................................................................................... 32

TABLE OF FIGURES
Figure 1: Percentage cost breakdown...................................................................................................................... 7
Figure 2: Impact of improved sustainability performance on financial base case................................................. 12
Figure 3: Impact of $2000 income tax credit ........................................................................................................ 13
Figure 4: Impact of sales tax exemption. .............................................................................................................. 14
Figure 5: Impact of tax credit for allowable construction costs. ........................................................................... 15
Figure 6: Impact of $8,600 rebate. ........................................................................................................................ 16
Figure 7: Impact of expedited permitting. ............................................................................................................. 16
Figure 8: Impact of Section 94 contribution exemption. ....................................................................................... 17
Figure 9: Impact of increased sales rate. ............................................................................................................... 19
Figure 10: Impact of reduced marketing and selling expenses. ............................................................................ 20
Figure 11: Impact of achieving a sales price uplift. .............................................................................................. 21
Figure 12: Impact of sales rate increase + marketing and selling cost savings. .................................................... 22
Figure 13: Impact of sales rate increase + tax credit. ............................................................................................ 22
Figure 14: Impact of sales rate increase + expedited approvals. ........................................................................... 23

LIST OF TABLES
Table 1: Changes to construction to achieve a 4 star Green Star Multi Unit Residential v1 rating. ..................... 10
Table 2: Changes to consultant costs to achieve a 4 star Green Star Multi Unit Residential v1 rating. ................ 11
Table 3: Modelled construction cost increases...................................................................................................... 12
Table 4: Construction materials considered to contribute to energy efficiency .................................................... 14
Table 5: Modelled sales timing changes ............................................................................................................... 18
Table 6: Modelled sales and marketing cost changes ........................................................................................... 19
Table 7: Ranked offset scenarios .......................................................................................................................... 24


                                                                                                                                                                    iv
1            SETTING THE SCENE FOR SUSTAINABLE RESIDENTIAL
             DEVELOPMENT

The building sector captures both residential and commercial activity that takes place within
our built environment and houses nearly 60 per cent of Australia’s economy in terms of
contribution to gross domestic product (GDP)1. The commercial sector comprises 11 major
economic sectors and the residential sector comprises the following building classifications
that make up the vast majority of residential buildings in Australia2:

      Class 1a (i) — detached houses;

      Class 1a (ii) — attached dwellings; and

      Class 2 — buildings containing two or more sole occupancy units.

It is estimated that the residential sector accounts for 74 CO2-e Mt or 13% of Australia’s
Greenhouse Gas (GHG) emissions profile3.

In considering the abatement opportunity within the residential sector, the Centre for
International Economics focussed on retrofitting “rebuilding” the existing building stock to
achieve a 48% efficiency gain at a technical cost saving of $113 per tonne of GHG emissions
abated through the following measures:

      lighting — substitution of energy inefficient with energy efficient light fittings;

      refrigeration — substitution of less efficient with more efficient fridges and freezers;

      hot water — adoption of more efficient appliances, improved fittings and reduced water
      use;

      standby electricity — adoption of devices that achieve low standby energy use;

      space heating — adoption of more efficient heating appliances and improvements in the
      thermal envelope, achieving 7-star energy rating; and

      cooling — adoption of more efficient appliances (as well as gains from thermal
      envelope improvements)4.

These are obvious areas for focus in the delivery of new residential buildings.

Beyond energy efficiency are the broader, but often overlooked benefits of delivering a more
sustainable residential built environment.

Sustainable communities have been defined as places where people want to live and work,
now and in the future. They meet the diverse needs of existing and future residents; are


                                                                                                 1
sensitive to their environment; and contribute to a high quality of life. They are safe and
inclusive, well planned, built and run, and offer equality of opportunity and good services for
all5.

It stands to reason that new housing stock and communities should seek to deliver these same
outcomes in sustainability performance.

2             BARRIERS AND THE NEED FOR DEVELOPER INCENTIVES

Incentives address the barriers which are hindering the wholesale delivery of improved
sustainability performance in the residential real estate market.

1.1           The Barriers
Whilst focussing specifically on energy efficiency, the Centre for International Economics
(CIE) identifies the presence of market and non-market barriers that prevent the building
sector from investing in opportunities to improve sustainability performance6. Those barriers
and how they are experienced in new residential development are described below:

      Information gaps – parties are often unaware of the options available to them. This is
      true on both the part of the developer and that of the homebuyer.

      Information asymmetries (adverse selection) — even when information is available, it
      can be difficult for both the developer and the homebuyer to determine with options are
      ‘good’ and which are ‘bad’. Specialist (read: expensive) advice is often required. When
      the costs of making poor choices are sufficiently high, which is most certainly the case for
      a developer, this may lead the decision maker making no choice at all. This is a real
      barrier to the adoption of new technology, as residential developers are traditionally
      building on past experiences, taking a new product forward and upsetting the successful
      ‘formula’ is a difficult move, especially when your brand is based on quality and long-
      term warranties are offered.

      Split incentives – where the costs and benefits of an investment to improve sustainability
      performance accrue to different parties. The costs to improve the sustainability
      performance of a new home are met by the developer. The benefits, in reduced utility
      costs, healthier spaces and better quality of life are received by the homebuyer. That the
      developer is unable to recover these increased costs from the homebuyer, acts as a
      significant deterrent to action.

      Unpriced externalities – the CIE describe an externality occurring when an economic
      activity causes costs or benefits to third parties, that is where the producers and consumers

                                                                                                   2
in a particular market either do not bear all of the costs or do not reap all of the benefits of
      the economic activity. This is certainly the case where the developer delivers a more
      sustainable home, one that uses less electricity, that is constructed with recycled content
      products with waste minimised to conserve resources and other such initiatives. The
      environment and the future users of those resources benefit. The cost of these benefits is
      not recovered by the developer.

      Bounded rationality — the opposite problem of incomplete information is having too
      much information. Where too much information is available, as is certainly becoming the
      case as new products and approaches emerge on a daily basis, decision makers often
      revert to ‘Rules of Thumb’ rather than more complete decision making processes. This
      can mean opportunities are overlooked or undervalued, which as individuals may not be
      significant, but can combine to become so.

      Regulatory problems – there are certainly significant regulatory barriers to more
      sustainable residential product, especially when exploring district approaches such as
      trigeneration where both strata and energy market regulation prevent a developer locking
      future residents into an energy supply contract, often scuttling the financial viability of
      such a significant investment. Also over regulating building standards can have perverse
      impacts, such as the six star NatHERS rating requirements of which there is anecdotal
      evidence of homes constructed with reduced windows or little natural ventilation in order
      to reach the standard.

1.2           The Government Response and the Need for Incentives
Government response to date has typically been to focus on closing information gaps and
asymmetries and provide financial incentives to overcome upfront costs and accelerate uptake
of sustainability options. However these financial incentives are focussed only on the owner
of an existing home and are not accessible by the residential developer. Examples of
Government and Government-mandated energy utility funded programs that a home owner
can access include rebates for water efficient washing machines, fridge buyback programs,
solar panel installation rebates, feed-in tariffs for domestic renewable energy and free ceiling
insulation.

Governments are also moving quickly to regulate for increased sustainability performance as
evidenced by July 2009 release of the Council of Australian Governments (COAG) National
Strategy on Energy Efficiency7. “Making buildings more efficient” is one of the key themes
of the Strategy which will see the following measures progressed in the residential space:


                                                                                                     3
Significantly increase the stringency of energy efficiency provisions for all new residential
      buildings in the Building Code of Australia (BCA) and broaden coverage of efficiency
      requirements. Minimum energy efficiency standards will be upgraded to 6-stars
      (NatHERS), or equivalent, nationally in the 2010 update of the BCA to be implemented
      by May 2011.

      Phase in mandatory disclosure of residential building energy, greenhouse and water
      performance at the time of sale or lease, commencing with energy efficiency by May
      2011.

      Address the opportunities that can be derived from building lot or precinct level layout
      that support appropriate solar access to living areas, solar hot water, and solar photovoltaic
      systems for new buildings.

      Provide and promote information on energy efficient housing options.

Whilst regulated standards do level the playing field for base case sustainability performance,
there has been little consideration of the fundamental barriers confronting developers of new
residential stock. The approach is regulatory with the developer to absorb the cost of
compliance. Australian research identified very few incentives for developers to move ahead
of or beyond legislation8. This was a position supported by property industry bodies, who
acknowledged a lack of Government action in incentivising developers9.

1.3           Types of Incentives
For examples of incentives for developers to deliver improved sustainability performance it
was necessary to look internationally. The programs detailed below is by no means an
exhaustive list, but serves to inform the type of incentives available as a basis for determining
IRR value in the development process.

1.3.1         Taxation Based Incentives
        Federal Government Energy-Efficient New Homes Tax Credit for Home Builders
        (US)
First established in the 2005, extended in 2008 and again in December 2009, the Energy-
Efficient New Homes Tax Credit for Home Builders enables tax credits of up to $2,000 for
builders of all new energy-efficient homes built to prescribed energy performance standards10.
A home with annual heating and cooling energy consumption which is at least 30% below the
annual level of heating and cooling energy consumption of a comparable dwelling unit and
constructed in accordance with the International Energy Conservation Code qualifies for
$1000. The building envelope component improvements must account for at least one-third of


                                                                                                   4
the reduction in energy consumption. A home 50% below a comparable and with the building
envelope improvements accounting for one-fifth of savings qualifies for $200011. Unused
current-year credits may be carried back one year or forward up to 20 years. This is
acknowledged as a considerable tax benefit12.

        Sales and Use Tax Exemption for Energy-Efficient Products (US)
The State of Connecticut offers an exemption from the state's sales and use tax for “residential
weatherization products” including programmable thermostats, window film, attic and wall
insulation, spray foam insulation, water pipe insulation, natural gas furnaces and windows
that meet the federal energy star standard. The exemption to applies to a property owner, a
tenant, or a contractor, and whether the products are to be used in existing real property or
new construction, but only for sales made by Connecticut retailers13.

        Corporate Income Tax Credit for Green Buildings (US)
Although no longer accepting applications, the State of Maryland Green Building Tax Credit
program provided a credit against a taxpayer’s corporate income tax of 6% to 8% of total
allowable construction costs for a building that meets Leadership in Energy and
Environmental Design Green Building Rating System (LEED) standards. Actual certification
was not necessary, simply a demonstration that criteria were met14. Non-residential and
residential multifamily buildings of at least 20,000 square feet, on a qualified brownfields site,
or in a priority funding area, and not in a wetlands area were eligible and allowable
construction costs related to three types of alternative energy sources: photovoltaics (PV),
wind turbines and fuel cells for either the green whole building, a green base building, or
green tenant space15.

1.3.2        Rebates and Subsidies
        Roseville Electric - Residential New Construction Rebate Program (US)
Roseville Electric, located in Placer County, Sacramento, California, a municipal owned
utility servicing 52,000 residential and business customers16, has established the Residential
New Construction Rebate Program. Builders of residential homes can access a rebate of up to
$8,600 for each new home that complies with the prescribed standard in excess of legislated
requirements and installation of grid-tied photovoltaic (PV) systems17. It’s worth noting that
Section 136 of the US Code Service - Energy conservation subsidies provided by public
utilities, energy conservation subsidies provided by public utilities either directly or
indirectly, are non-taxable18.


                                                                                                 5
Section 94 contribution exemption – for consideration
Section 94 of the Environmental Planning and Assessment Act 1979 (NSW) provides for a
requirement of property developers to make a contribution towards provision or improvement
of amenities or services, known commonly as Community Infrastructure Levies.

The contribution can be in the form of dedication of land free of cost, or the payment of a
monetary contribution or both. As an intended purpose of Section 94 contributions is to
provide for provision or improvement of amenities or services, the appropriate application of
the funds to this purpose will impact on the sustainability of the development.

If a developer were able to retain Section 94 contributions and apply them directly to
improving the sustainability performance of the development, the objectives would still be
met. This is not an incentive currently available but has been identified in discussions as an
attractive incentive, the impacts of which should be modelled.

1.3.3        Procedural Advantages
        Expedited Permitting for Green Buildings (US)
Section 8.108.050 of the Santa Monica Municipal Code, Priority plan check processing for
LEED certified buildings 19, provides for priority plan check processing by all City
departments for all new and qualifying existing buildings, that are registered with the United
States Green Building Council for, and are actively pursuing certification under the LEED
standards, including LEED for Homes (LEED-H), LEED for New Construction (LEED-NC),
and LEED for Core and Shell (LEED-CS). The Council reserves the right to impose a fine on
projects that receive priority plan check processing, but then fail to achieve LEED
certification.

2            DEVELOPMENT FINANCIAL REVIEW

The development analysed is a multi unit residential development comprised of a mix of 164
one, two and three bedroom apartments.

2.1          Financial Performance Metrics
Two financial performance metrics are utilised by the Developer: the traditional project
Internal Rate of Return (IRR), being the discount rate which generates a zero net present
value; and, an in-house Value Add (VA) metric.

The VA metric is based on the concept of time value of money and captures the timing of
profits – a key driver in value creation. Its measures the movement in the Net Present Value
(NPV) of a projects cash flow between the commencement of the project and the completion


                                                                                                 6
of the project using a predetermined discount rate. The VA metric provides a mechanism for
the Developer to assess the impacts of changes to cash flow totals and timing between
forecast and actual.

2.2         Development Costs
Elements of total development costs are presented as percentages in Figure 1. Construction
costs including labour and materials are by far the largest cost component, with land cost the
next largest.


Figure 1: Percentage cost breakdown


2.3         Adjustments in the Model
These costs were extracted from a project tracking report and verified with the project team.
Given some variances between the figures in the project tracking report and those in the
feasibility model, it was necessary to undertake a number of adjustments within the feasibility
model utilised for the scenario modelling. Where costs were higher or lower, the necessary
change was made to the line item in the feasibility report and the difference spread equally
across all months. It is acknowledged that this is unlikely to reflect the actual timing impact of
the variation, but with the information available it was not possible to pinpoint exact timing of
the variations.

2.4         Base Case IRR and VA
The project is returning an IRR of 29.34% and VA of $5.6 million.


                                                                                                 7
3              IMPROVING THE SUSTAINABILITY PERFORMANCE

3.1            Performance Rating Tools
3.1.1          Green Star – Multi Unit Residential v1
The Green Building Council of Australia (GBCA) launched the Green Star – Multi Unit
Residential v1 rating tool on 2 July 2009 to promote the design and construction of high-
performance green residential developments20.

All GBCA Green Star rating tools evaluates the green attributes of building projects based on
nine categories21.

      Management                       Transport                        Land Use & Ecology
      Indoor Environment Quality       Water                            Emissions
      Energy                           Materials                        Innovation


The Green Star rating is determined as a percentage score by summing the credits awarded
against each initiative in each category, then applying a category environmental weighting
factors and each resultant total category score summed including any innovation credits
awarded22.

Green Star ratings are awarded for scores of 45 or more as follows:

      Star Green Star Certified Rating (score 45-59) signifies 'Best Practice'.

      Star Green Star Certified Rating (score 60-74) signifies 'Australian Excellence'.

      Star Green Star Certified Rating (score 75-100) signifies 'World Leadership'.

Numerous Government bodies have moved to mandate Green Star within the develop process
and a means of meeting their sustainable development objectives.

However it should be noted that the GBCA’s suite of Green Star rating tools are voluntary.
The GBCA acknowledges there is great value in utilising the Green Star tools as the
performance measurement mechanism within an incentives framework and advocates that
governments lead by example and incorporate Green Star into their own building
requirements23.

With this is mind, it is considered appropriate that the Green Star rating (minimum 4 stars) be
set as the baseline for developer incentives and therefore the benchmark for the development
under analysis.


                                                                                                8
3.1.2         Developer Standards
The Developer also has a number of in-house sustainability commitments outside of Green
Star. These were also included in the requirements to be delivered to improve sustainability
performance however the specifics of the commitments and the required standards, beyond
the actual changes required for improved sustainability performance detailed herein, cannot
be disclosed.

3.2           Requirements to Achieve Improved Performance
To determine the costs to achieve a 4 star Green Star rating and the additional Developer
commitments, it was first necessary to determine what additional inclusions would be
required.

A review of the Green Star – Multi Unit Residential (“MUR”) v1 tool was undertaken, with
credits to be pursued identified. In consultation with Developer in-house specialists24, a
number of areas were identified where the selection of materials or additional features would
deliver the higher performance required.

It was not within the scope of this project to perform a certifiable Green Star MUR
assessment, as to do so would have required specialist and costly technical modelling,
particularly in the energy, water and emissions categories. Certain assumptions were
developed in consultation with the Developers design group25 to allow an indicative
performance score to be determined.

      1. That increasing insulation levels, external shading, the energy efficiency of lighting
         and installation of ceiling fans would achieve the Conditional Requirement for Energy
         - To meet the conditional requirement, the average thermal performance of the
         dwellings must be improved by 10% compared to the regulated thermal performance
         standard in the relevant jurisdiction.

      2. Also that the development having no central HVAC system, use of relatively energy
         efficient packaged air-conditioning units for heating and cooling, use energy efficient
         lighting, gas hot water service, exhaust systems, eco-lift system, no pool/sauna/spa
         and use of gas cook tops would likely achieve a 20% reduction on Green Star
         Greenhouse Gas Emissions benchmark.

      3. That upgrading fixtures and fittings to six star WELS rating and dual plumbing of
         'purple pipe' recycled water would achieve 3 credits under Occupant Amenity Water
         and a Discharge to Sewer credit.


                                                                                                   9
The materials or features modifications required to achieve the required sustainability
performance are detailed in Table 1 below.

Table 1: Changes to construction to achieve a 4 star Green Star Multi Unit Residential v1 rating.

                                   Appointment of a dedicated Green Star Accredited Professional on
 Wages - Green Star Manager        project team to manage process including preparation of Building
                                   Users' Guide and submit rating.
                                   Inclusion of low-emissivity glass in windows to control heat transfer
                                   and improve thermal performance to achieve Conditional
 Aluminium Windows
                                   Requirement for energy and reduction in Greenhouse Gas
                                   Emissions of 20% on Green Star benchmark.
                                   Inclusion of additional louvers and screens to increase shading and
                                   improve thermal performance to achieve Conditional Requirement
 External Louvers & Screens
                                   for energy and reduction in Greenhouse Gas Emissions of 20% on
                                   Green Star benchmark.
                                   Inclusion of additional sunshades to increase shading and improve
                                   thermal performance to achieve Conditional Requirement for energy
 Pergolas & Sunshades
                                   and reduction in Greenhouse Gas Emissions of 20% on Green Star
                                   benchmark.
                                   Inclusion of additional ceiling, wall and floor thermal and noise
                                   insulation to increase thermal performance and noise performance
 Insulation                        to achieve Conditional Requirement for energy and reduction in
                                   Greenhouse Gas Emissions of 20% on Green Star benchmark. Also
                                   Internal Noise Level credit.
 Carpenter Labour & Materials All engineered wood products contain no formaldehyde.
                                   Increase WELS rating of all fixtures and fittings to 6 star WELS
 Bathroom Fixtures
                                   rating.
                                   Use of low VOC carpets as specified in Green Star and upgrade
 Carpet                            choice to achieve 1 point, eco-content, high durability, responsible
                                   supplier, supplier take back.
 Tiling                            Use of low VOC adhesives in tiling as specified in Green Star.
 Painting                          Use of low VOC paints as specified in Green Star.
                                   Replacement of 30% of the total cost of PVC content with a non-
 Plumber & Drainer
                                   PVC alternative.
                                   Installation of ceiling fans in at least 95% of all apartments.
                                   Energy sub-metering for substantive energy uses within the building
                                   and smart metering for the consumption of electricity, water and gas
 Electrical Installation           in all apartments.
                                   Installation of a single shut down switch in all apartments.
                                   Upgrade of energy efficiency of lighting.
                                   Upgrade to ensure all HVAC refrigerants have an Ozone Depletion
 Mechanical Services
                                   Potential (ODP) of zero and a GWP100 of 10 or less.
 Landscaping                       Scheme improved to 2 points on ecological calculator.


                                                                                                          10
In additional to construction cost increase, cost increases should also be expected in
consultants to the development project to undertake additional tasks associated with Green
Star design and certification as detailed in Table 2.

Table 2: Changes to consultant costs to achieve a 4 star Green Star Multi Unit Residential v1 rating.

                                   To account for additional requirements of Green Star design and
 Architects Fees
                                   provide necessary documentation for certification.
                                   To provide additional advice, oversight of delivery and necessary
 Structural Engineer
                                   documentation Green Star certification.
                                   To provide additional advice, oversight of delivery and necessary
 Electrical Engineer
                                   documentation Green Star certification.
                                   To provide additional advice, oversight of delivery and necessary
                                   documentation Green Star certification including pre-
 Mechanical Engineer               commissioning, commissioning, and quality monitoring are
                                   contractually required and done in exact accordance with
                                   appropriate guidelines.
                                   To provide additional advice, oversight of delivery and necessary
 Hydraulic Engineer
                                   documentation Green Star certification.
                                   To provide additional advice and necessary documentation Green
                                   Star certification. The Developer Green Star professional will
 Environmental Consultant
                                   manage the bulk of the Green Star management and submission
                                   process.
                                   To provide additional advice, oversight of delivery and necessary
 Facade Engineering
                                   documentation Green Star certification.


3.3           Costs to Achieve Improved Performance
Given the inability to model specifics, particularly around the increased level of shading,
insulation, low-emissivity glass, an alternative approach to determining cost increases was
required. With input from Developer architects26 and construction27 professionals it was
determine at percentage increase could be applied to specific elements with a fair degree of
confidence.

However, one key outcome from these discussions was the identified need to differentiate
cost increases to supply of the product, fit of the product or both supply and fit. For example,
inclusion of low-emissivity glass would be an increased cost to supply, not fit.

The Developer generally employs a supply and fit arrangement, costs in project tracking
report reflect this total cost. Therefore in order to apply an increase to the supply, fit or supply
and fit elements, it was first necessary to determine the likely breakdown between the supply
and fit costs. To do this the industry accepted Labour and Material Trade Ratios were
applied28 to the construction costs.


                                                                                                        11
Each identified element was then determined to be a supply, fit or supply and fit item. For
supply only items, an agreed percentage increase was applied to the calculated supply cost.
For fit only items, and agreed percentage increase was applied to the fit cost. For supply and
fit items an agreed percentage increase was applied to both elements.

As it is not possible to disclose specific construction costs, a summary only of increased costs
as a percentage off base is provided in Table 3 below.

Table 3: Modelled construction cost increases.

 Cost Element                         Percent Increase
 CONSTRUCTION                               3.54%
 CONSULTANTS                                 10%


For the purpose of modelling the changes in construction and consultant costs were equally
apportioned over all periods. The reality would be different and the timing would impact on
the IRR, it was however not possible to accurately predict when the cost increases would
occur.

The modelling showed an IRR of 26.94%, a decrease of 240 basis points (-8.2%) from the
base case and a VA of $4.2 million a decrease of $1.4 million (-25.3%).


Figure 2: Impact of improved sustainability performance on financial base case.


                                                                                                 12
4            OFFSET SCENARIOS

A complete list of modelled offset scenarios and financial performance is provided in
Appendix 1.

4.1          Incentive Impacts
2.1.1        Federal Government Energy-Efficient New Homes Tax Credit for Home
             Builders (US)
The Developer feasibility model utilised does not allow for consideration of corporate tax
credits to be applied as a project level. Assuming the tax credit applied to the individual
project would be experienced as an increase in sales revenue, an increase in sales revenue of
$2,000 per apartment was modelled. Given the acknowledged impact of the time value of
money, the timing of the credit is critical and three difference scenarios were modelled: a
lump sum payment in advance, an equal monthly payment and payment in arrears.

The best case scenario was to receive the $2000 credit per apartment as a lump sum in
advance, delivering an IRR of 27.29%, up 35 basis points (1.3%) on the Green Star scenario
but still 205 basis points (-7%) below the base case. The VA is $4.4 million, $0.21 million
(5.0%) up on the Green Star scenario but $1.2 million (-21.5%) below the base case.


Figure 3: Impact of $2000 income tax credit


4.1.1        Sales and Use Tax Exemption for Energy-Efficient Products (US)
In order to model the impact of the sales tax exemption, construction materials considered to
contribute to energy efficiency were identified, see Table 4. To determine a cost to model, the
amount from the project finance report was apportioned based on the Riders Digest and then a
10% discount applied. This resulted in a total reduction in construction costs of 1.77%.


                                                                                                13
Table 4: Construction materials considered to contribute to energy efficiency

 Aluminium Windows                   Insulation                          Plumber & Drainer
 External Louvers & Screens          Bathroom Fixtures                   Electrical Installation
 Pergolas & Sunshades                Painting                            Mechanical Services
 Lift Installation


This resulted in an IRR of 28.03%, up 109 basis points (4.0%) on the Green Star scenario but
131 basis points (-4.5%) below the base case. The VA is $4.9 million, up $0.65 million
(15.5%) on the Green Star scenario but $0.77 million (-13.7%) below the base case.


Figure 4: Impact of sales tax exemption.


4.1.2        Corporate Income Tax Credit for Green Buildings (US)
Whilst similar to the Federal Government Energy-Efficient New Homes Tax Credit for Home
Builders, the tax credit value is calculated based on the construction costs, not the number of
units delivered. As with noted in modelling the previous tax credit, the Developers feasibility
model does not allow for consideration of corporate tax credits to be applied as a project level.

The State of Maryland Green Building Tax Credit applied only to allowable construction
costs related to three types of alternative energy sources: photovoltaics (PV), wind turbines
and fuel cells. Although none of these technologies was included in the Green Star scenario,
in order to determine the potential impact of such an offset an alternative application was
modelled. A tax credit, to the value of 8% of increased construction costs associated with
meeting the Green Star standard was calculated an added to revenue, an increase of 0.13%.
Again as timing is important, payment in advance, in equal monthly instalments and in arrears


                                                                                                   14
was modelled. The best case scenario, credit received in advance made little impact on the
Green Star scenario costs. An IRR of 27.09%, was up 15 basis points (0.6%) on the Green
Star scenario but 225 basis points (-7.7%) below the base case. The VA of $4.3 million, is up
$0.09 million (2.1%) on the Green Star scenario but $1.33 million (-23.7%) below the base
case.


Figure 5: Impact of tax credit for allowable construction costs.

4.1.3        Roseville Electric - Residential New Construction Rebate Program (US)
Again it was necessary to model this scenario as increased sales revenue, with an increase of
$8,600 per apartment modelled. Payment in advance, in equal monthly instalments and in
arrears was modelled.

The best case scenario, rebate received in advance resulted in an IRR of 28.44%, up 150 basis
points (5.6%) on the Green Star scenario, but 90 basis points (-3.1%) below the base case.
The VA of $5.1 million is up $0.9 million (21.6%) on the Green Star scenario, but remains
$0.5 million (-9.2%) below the base case.


                                                                                                15
Figure 6: Impact of $8,600 rebate.


4.1.4        Expedited Permitting for Green Buildings (US)
Expedited permitting allows for lowering of holding costs associated with the land. On advice
from Developer specialists29, it was determined the best means of modelling this was to
shorten the time period between acquisition of land and commencement of construction. This
period was shortened by two months.

This resulted in an IRR of 28.37% up 143 basis points (5.3%) on the Green Star scenario but
97 basis points (-3.3%) below the base case. The VA of $4.8 million is up $0.6 million
(13.4%) on the Green Star scenario but remains $0.9 million (-15.3%) below the base case.


Figure 7: Impact of expedited permitting.


                                                                                              16
4.1.5       For consideration - Section 94 contribution exemption
The Section 94 contributions for this development were 1.34% of total development costs. To
model the impact of the Section 94 contribution exemption, the Section 94 amount was
removed from Statutory Costs and deducted from Construction Costs.

This resulted in an IRR of 29.83% exceeding the base case scenario by 49 basis points (1.7%)
the VA of $5.8 million exceeded the base case scenario $0.2 million (4.0%).


            Figure 8: Impact of Section 94 contribution exemption.


4.2         Non Incentive Impacts
4.2.1       Increase sales rate
It is generally accepted and certainly shared as the experience of the Developer that improved
sustainability performance does not lead to an increase in sales price. However, it is similarly
acknowledged that sustainability performance is a ‘tie-breaker’ issue in the decision making
process, which may mean buyers choose the more sustainable product over a readily
comparable less sustainable product. Assuming that the area sales rate remains the same, this
could lead to an increase in sales rate for the more sustainable product.

A conservative 1% increase in monthly sales rate was applied for the first three months. This
increased the average sales rate from 7% to 10% and shorted the selling period by four
months. When a 2% increase in monthly sales rate was applied for the first three months, the
average sales rate increased to 13% shortening the sales period by a further two months.


                                                                                               17
Table 5: Modelled sales timing changes

                 Original -
                 monthly       1 percent   2 percent
                  percent      increase    increase
 Month 1            1%             2%         3%
 2                 65%            66%        67%
 3                 10%            11%        12%
 4                  9%             9%         9%
 5                  4%             4%         4%
 6                  2%             2%         2%
 7                  2%             2%         2%
 8                  2%             2%         1%
 9                  1%             1%
 10                1%              1%
 11                1%
 12                1%
 13                1%
 14                1%
 Average           7%            10%         13%

The 1% increase in sales rate resulted in an IRR of 27.63%, up 69 basis points (2.6%) on the
Green Star scenario but still 171 basis points (-5.8%) below the base case. The VA is $4.5
million, up $0.3 million (7.7%) on the Green Star scenario but $1.1 million (-19.5%) below
the base case.

The 2% increase in sales rate resulted in an IRR of 28.14%, up 120 basis points (4.4%) on the
Green Star scenario but still 120 basis points (-4.1%) below the base case. The VA is $4.8
million, up $0.6 million (13.2%) on the Green Star scenario but $0.9 million (-15.4%) below
the base case.


                                                                                               18
Figure 9: Impact of increased sales rate.


4.2.2       Reduced marketing and selling expenses
Again, whilst acknowledging improved sustainability performance does not lead to an
increase in sales price, it is conceivable that promoted well, the improved sustainability
performance may generate an additional level of interest in the property resulting in greater
word-of-mouth promotion or exposure through other channels such as media. This may allow
for a slight reduction in marketing and selling costs. The project financial report was analysed
for items where it was felt savings could be realised (Table 6), resulting in an overall
reduction of 3%. Selling costs which included agents’ costs and commissions was reduced
10%.

Table 6: Modelled sales and marketing cost changes

                                      Percent Change
 MARKETING
 Adv Design - Press                         10%
 Mkt Mat Des - Direct Mail                  10%
 Mkt Mat Des-Brochures                      10%
 Conslt - Public Relations                  10%
 TOTAL MARKETING                             3%


This resulted in an IRR of 27.25%, up 31 basis points (1.1%) on the Green Star scenario but
still 209 basis points (-7.1%) below the base case. The VA of $4.4 million is up $0.2 million
(4.4%) on the Green Star scenario but remains $1.2 million (-22.0%) below the base case.


                                                                                                19
Figure 10: Impact of reduced marketing and selling expenses.


4.2.3       Achieving a Sales price uplift
To inform project discussion, it was worthwhile to model what price increase would be
necessary to recover costs incurred in realising the Green Star scenario. A 1% and a 2.5%
uplift in sales price were modelled.

A modest 1% increase per unit resulted in an IRR of 27.98%, up 104 basis points (3.9%) on
the Green Star scenario but 136 basis points (-4.6%) below the base case. A VA of $4.9
million, up $0.7 million (15.5%) on the Green Star scenario is $0.8 million (-13.7%) below
the base case.

A 2.5% sales increase unit resulted in an IRR of 29.52%, exceeding the base case scenario by
18 basis points (0.6%). The VA of $5.8 million exceeded base case by $0.2 million (3.6%).


                                                                                             20
Figure 11: Impact of achieving a sales price uplift.


4.3          Combined Offset Scenarios
A number of combined offset scenarios were modelled based on the likelihood of the offsets
occurring concurrently, or where incentive based, what was considered a possibly palatable
incentive to propose.

In modelling these combined scenarios, it was noted that the impact on IRR and VA was in
fact cumulative, so that improvements from the Green Star scenario could be added to
determine the impact of multiple scenarios.

4.3.1        Sales Rate Increase + Marketing and Selling Cost Savings
As the increased sales rate and reduction in sales, marketing and selling costs would be felt
concurrently, their combined effect was modelled.

The 1 percent sales rate increase plus the reduced marketing and selling costs resulted in an
IRR of 27.95%, up 101 basis points (3.7%) on the Green Star scenario but 139 basis points (-
4.7%) below the base case. A VA of $4.7 million, up $0.2 million (12.2%) on the Green Star
scenario is $0.9 million (-16.2%) below the base case.

The 2 percent sales rate increase plus the reduced marketing and selling costs resulted in an
IRR of 28.46%, up 152 basis points (5.6%) on the Green Star scenario but 88 basis points (-
3.0%) below the base case. A VA of $4.9 million, up $0.7 million (17.6%) on the Green Star
scenario is $0.7 million (-12.1%) below the base case.


                                                                                                21
Figure 12: Impact of sales rate increase + marketing and selling cost savings.


4.3.2        Increased Sales Rate + Tax Credit
The combined effect of the lower of the two modelled increases in sales rate (1%) and the
$2000 tax credit per apartment as a lump sum in advance was modelled.

This scenario resulted in an IRR of 27.99%, up 105 basis points (3.9%) on the Green Star
scenario but still 135 basis points (-4.6%) below the base case. A VA of $4.7 million is up
$0.5 million (12.8%) on the Green Star scenario but remains $0.9 million (-15.8%) below the
base case.


Figure 13: Impact of sales rate increase + tax credit.


                                                                                              22
4.3.3        Increased Sales Rate 1% + Expedited Approvals
The combined effect of the lower of the two modelled increases in sales rate (1%) and the
impact of the expedited approvals process was modelled.

This resulted in an IRR of 29.14%, up 2.20% on the Green Star scenario is only 20 basis
points (-0.7%) below the base case. A VA of $5.1 million, up $0.9 million (21.1%) on the
Green Star scenario is $0.5 million (-9.5%) below the base case.


Figure 14: Impact of sales rate increase + expedited approvals.


5            DISCUSSION

In all over 21 different offset scenarios have been modelled, the impacts from best to worst
are presented in Table 7, with the Section 94 construction cost offset the best, exceeding the
base case IRR by 49 basis points (1.7%) and VA by $0.2 million (4.0%). The only non-price
increase offset scenarios to do so.

The least effective was the tax credit for 8% of allowable construction cost increases received
as a lump sum in arrears being 228 basis points (-7.8%) below the base case IRR and $1.4
million (-24.0%) below the VA. This is unsurprising, given the limited range of construction
costs for which it could be applied and therefore limited revenue impacts. And this assumes
the Australian tax system and the Developers internal treatment of tax would allow for the full
credit to be felt at the project level.


                                                                                                 23
Table 7: Ranked offset scenarios

                                                   IRR
                                                 Change       IRR          VA           VA
                                                  (basis     Change       Change       Change
                                                 points)      (%)           ($)         (%)
 Section 94 construction cost offset                49         1.7%       222,979       4.0%
 Increased sales price 2.5%                         18         0.6%       201,450       3.6%
 Increased Sales Rate 1% + Expedited
 Approvals                                         -20        -0.7%       -535,277      -9.5%
 Increased Sales Rate 2% + Reduced Selling
 and Marketing Costs                               -88        -3.0%       -684,113     -12.1%
 $8600 rebate per dwelling (in advance)            -90        -3.1%       -515,948      -9.2%
 Expedited Approvals                               -97        -3.3%       -861,074     -15.3%
 $8600 rebate per dwelling (monthly)               -109       -3.7%       -605,024     -10.7%
 Increased Sales Rate 2%                           -120       -4.1%       -870,073     -15.4%
 $8600 rebate per dwelling (in arrears)            -127       -4.3%       -688,849     -12.2%
 Sales tax exemption for energy efficient
 products                                          -131       -4.5%       -773,135     -13.7%
 Increased Sales Rate 1% + $2000 tax credit in
 advance                                           -135       -4.6%       -887,163     -15.8%
 Increased sales price 1%                          -136       -4.6%       -773,926     -13.7%
 Increased Sales Rate 1% + Reduced Selling
 and Marketing Costs                               -139       -4.7%       -912,420     -16.2%
 Increased Sales Rate 1%                           -171       -5.8%      -1,098,380    -19.5%
 $2000 income tax credit (lump sum in
 advance)                                          -205       -7.0%      -1,212,961    -21.5%
 Reduced Selling and Marketing Costs               -209       -7.1%      -1,238,218    -22.0%
 $2000 income tax credit (received monthly)        -209       -7.1%      -1,233,677    -21.9%
 $2000 income tax credit (lump sum in arrears)     -213       -7.3%      -1,253,171    -22.3%
 Tax credit for 8% of allowable construction
 cost increases (in advance)                       -225       -7.7%      -1,334,018    -23.7%
 Tax credit for 8% of allowable construction
 cost increases (monthly)                          -227       -7.7%      -1,342,860    -23.8%
 Tax credit for 8% of allowable construction
 cost increases (in arrears)                       -228       -7.8%      -1,351,181    -24.0%
 Green Star Costs                                  -240       -8.2%      -1,424,177    -25.3%


One of the most encouraging results was the impact of an increased sales rate. The very
modest increase in sales rate was tested with a number of parties30, with all agreeing that such
an increase was not unrealistic with focussed marketing efforts. For a 2% increase over the
first three months, or an increase from 7% to 13% overall to be only 120 basis points (-4.1%)

                                                                                                24
in IRR and $0.8 million (-15.4%) in VA behind the base case is exciting. It demonstrates that
there are means, already within the control of the Developer, which can preserve the project
return.

When an even more cautious 1% increase in sales rate over the first three months is combined
with an expedited approval process (modelled as a two month shortening of land holding
costs) the project return is within 20 basis points (-0.7%) off the IRR and $0.5 million (-9.5%)
VA of the base case. This provides a strong justification for a non-financial incentive that
councils can offer to developers to encourage more sustainable residential development.

However, with the 2% increased sales rate over the first three months combined with reduced
selling and marketing cost, both within the control of the Developer and not reliant on
external incentives, an IRR within 88 basis points (-3.0%) and VA within $0.7 million (-
12.1%) can be achieved. Such actions combined with efforts to control additional construction
costs have the strong potential to protect the original base case return.

It is necessary to discuss the development cost modelling, in that although it was ‘stress
tested’ with a number of parties, there were many assumptions drawn, particularly in the
extent of initiatives required to achieve the conditional energy requirement under Green Star.
Ideally, if cost and timeframes permitted, more detailed energy modelling and cost planning
would be undertaken. It was also noted in discussions that many of the substitute items should
not necessarily increase in price as a result of being ‘more sustainable’ and in fact the
Developer’s purchasing power could enable price parity in many respects. This should also be
the case with project consultants, appropriately briefed and contracted at commencement,
additional costs should be kept to a minimum. The research would also benefit from greater
analysis of revenue impacts of the international financial incentives modelled. The modelling
performed herein does not attempt to accurately reflect the intricacies of the different
incentives in application, but rather, as intended, provides an indication of different incentive
impacts.

Similarly in the application of the feasibility model itself there are avenues for improvement.
For example, when there was an increase in the development costs, this increase was applied
equally across all periods of the construction timeline. This was because the timing of
individual cost items was not readily available and to obtain and model these specifics would
have significantly expanded the scope of this study. This is an acknowledged weakness of the
modelling and creates a level of uncertainty worthy of further investigation. If one of the


                                                                                                25
bigger development cost items was to increase significantly and be incurred in one period
alone, this would certainly impact the IRR and VA.

6           RECOMMENDATIONS FOR ACTION

All of the incentive and non-incentive offsets have a demonstrated impact on the project IRR
and VA, only the scale and timing of the different scenarios determining which has the
biggest effect.

There has certainly been a lot of public discussion on what ‘the Government’, at all levels
should do to improve the sustainability performances of new residential developments. What
this modelling demonstrates so clearly is that both developers and multiple levels of
Government have a role to play to achieve this outcome.

To crystallise this potential the following is recommended:

    1. Improve the communication of sustainability features to purchasers – through the
        production of easily understood materials with benefits quantified, improving the
        training of sales staff so that they are better able to communicate benefits and include
        them in the discussion of features and undertake benchmarking of competing product
        on sustainability performance so that accurate comparisons can be drawn.

    2. Increase the understanding in the general population of benefits of more sustainable
        homes – though dissemination of information through the Developer’s internet and
        also through advocating investment from Government in a broad-scale, sustained
        public awareness programs.

Both of these measures would likely divert purchasers from other competing less sustainable
product delivering the necessary increase in sales rate. Of course it will be the early movers
that realise the greatest benefit.

    3. Use the Developer’s position within industry groups to lobby for a number of
        incentives in the following order of preference:

            o Section 94 redistribution to the project

            o ‘Green-door’ expedited development approvals

            o Sizable rebates per dwelling

As part of its lobbying position, the costs of improved sustainability performance and its
impact on project return will need to be clearly articulated. It will be necessary to break down


                                                                                                 26
and apparent belief within Australian Government that providing information will address all
barriers to improved performance, without regard to the financial reality facing developers.

As is evidenced by the snapshot of incentives detailed herein, other Governments have been
far more proactive in providing financial incentives that would have a material impact on
preserving and possibly enhancing project return.

While the classic split incentive of costs being met by the developer and benefits accruing to
the purchaser remains, there will be no wholesale, voluntary adoption of more sustainable
residential development.


                                                                                                 27
APPENDIX 1

                                                                                            IRR Change
                                                                                    IRR        (basis    IRR Change        VA       VA Change    VA Change
                                                                                    (%)       points)"      (%)            ($)         ($)          (%)
Original                                                                         29.34%                               5,632,000
Green Star Costs                                                                   26.94%                               4,207,823
                                                           Change to Original                  -240        -8.2%                    -1,424,177    -25.3%
Initiative Modelled
$2000 income tax credit
$2000 income tax credit (received monthly)                                         27.25%                               4,398,323
                                                    Change to Green Star Costs                  31         1.1%                      190,501       4.5%
                                                      Difference from Original                 -209        -7.1%                    -1,233,677    -21.9%
$2000 income tax credit (lump sum in advance)                                      27.29%                               4,419,039
                                                    Change to Green Star Costs                  35         1.3%                      211,216       5.0%
                                                      Difference from Original                 -205        -7.0%                    -1,212,961    -21.5%
$2000 income tax credit (lump sum in arrears)                                      27.21%                               4,378,829
                                                    Change to Green Star Costs                  26         1.0%                      171,007       4.1%
                                                      Difference from Original                 -213        -7.3%                    -1,253,171    -22.3%


Sales tax exemption for energy efficient products
Sales tax exemption for energy efficient products                                  28.03%                               4,858,865
                                                    Change to Green Star Costs                  109        4.0%                       651,043      15.5%
                                                      Difference from Original                 -131        -4.5%                     -773,135     -13.7%


                                                                                                                                                   28
Increased sales price
Increased sales price 1%                                                            27.98%                  4,858,074
                                                     Change to Green Star Costs               104   3.9%                 650,251      15.5%
                                                       Difference from Original              -136   -4.6%               -773,926     -13.7%
Increased sales price 2.5%                                                          29.52%                  5,833,450
                                                     Change to Green Star Costs              258    9.6%                1,625,628    38.6%
                                                       Difference from Original              018    0.6%                 201,450     3.6%


Tax credit for 8% of allowable construction cost increases
Tax credit for 8% of allowable construction cost increases (in advance)             27.09%                  4,297,982
                                                      Change to Green Star Costs              15    0.6%                  90,160      2.1%
                                                         Difference from Original            -225   -7.7%               -1,334,018   -23.7%
Tax credit for 8% of allowable construction cost increases (monthly)                27.07%                  4,289,140
                                                      Change to Green Star Costs              13    0.5%                  81,317      1.9%
                                                         Difference from Original            -227   -7.7%               -1,342,860   -23.8%
Tax credit for 8% of allowable construction cost increases (in arrears)             27.06%                  4,280,819
                                                      Change to Green Star Costs              11    0.4%                  72,996      1.7%
                                                         Difference from Original            -228   -7.8%               -1,351,181   -24.0%


$8600 rebate per dwelling
$8600 rebate per dwelling (monthly)                                                 28.25%                  5,026,976
                                                     Change to Green Star Costs               131   4.8%                 819,154      19.5%
                                                       Difference from Original              -109   -3.7%               -605,024     -10.7%
$8600 rebate per dwelling (in advance)                                              28.44%                  5,116,052
                                                     Change to Green Star Costs              150    5.6%                 908,230     21.6%
                                                       Difference from Original              -90    -3.1%               -515,948     -9.2%
$8600 rebate per dwelling (in arrears)                                              28.07%                  4,943,151
                                                     Change to Green Star Costs               113   4.2%                 735,329      17.5%
                                                       Difference from Original              -127   -4.3%               -688,849     -12.2%


                                                                                                                                      29
Expedited Approvals
Expedited Approvals                                                              28.37%                  4,770,926
                                                   Change to Green Star Costs             143    5.3%                 563,103      13.4%
                                                     Difference from Original             -97    -3.3%               -861,074     -15.3%


Section 94 Rebate
Section 94 construction cost offset                                              29.83%                  5,854,979
                                                   Change to Green Star Costs             289    10.7%               1,647,156    39.1%
                                                     Difference from Original             49     1.7%                 222,979     4.0%

Increased Sales Rate
Increased Sales Rate 1%                                                          27.63%                  4,533,620
                                                   Change to Green Star Costs              69    2.6%                 325,798      7.7%
                                                     Difference from Original             -171   -5.8%               -1,098,380   -19.5%
Increased Sales Rate 2%                                                          28.14%                  4,761,927
                                                   Change to Green Star Costs              120   4.4%                 554,104      13.2%
                                                     Difference from Original             -120   -4.1%               -870,073     -15.4%


Reduced Selling and Marketing Costs
Reduced Selling and Marketing Costs                                              27.25%                  4,393,782
                                                   Change to Green Star Costs              31    1.1%                 185,960      4.4%
                                                     Difference from Original             -209   -7.1%               -1,238,218   -22.0%

Combined - Increased Sales Rate + Lower Sell & Mkt Costs
Increased Sales Rate 1% + Reduced Selling and Marketing Costs                    27.95%                  4,719,580
                                                  Change to Green Star Costs               101   3.7%                 511,758      12.2%
                                                      Difference from Original            -139   -4.7%               -912,420     -16.2%
Increased Sales Rate 2% + Reduced Selling and Marketing Costs                    28.46%                  4,947,887
                                                  Change to Green Star Costs              152    5.6%                 740,064      17.6%
                                                      Difference from Original            -88    -3.0%               -684,113     -12.1%


                                                                                                                                   30
Combined - Increased Sales Rate + tax credit
Increased Sales Rate 1% + $2000 tax credit in advance                            27.99%                  4,744,837
                                                    Change to Green Star Costs             105   3.9%                 537,014    12.8%
                                                      Difference from Original            -135   -4.6%               -887,163   -15.8%

Combined - Increased Sales Rate + Expedited Approvals
Increased Sales Rate 1% + Expedited Approvals                                    29.14%                  5,096,723
                                               Change to Green Star Costs                 220    8.2%                 888,901   21.1%
                                                  Difference from Original                -20    -0.7%               -535,277   -9.5%


                                                                                                                                 31
REFERENCES


1
  CIE (Centre for International Economics) 2007, Capitalising on the building sector’s potential to
lessen the costs of a broad based GHG emissions cut, prepared for the ASBEC Climate Change Task
Group, Canberra & Sydney.
2
 AGO (Australian Greenhouse Office) 1999, Australian Residential Building Sector Greenhouse Gas
Emissions 1990–2010, Canberra.
3
    CIE (Centre for International Economics) 2007, pg 12.
4
    CIE (Centre for International Economics) 2007, pg 19.
5
 Communities and Local Government (2003), Communities and neighbourhoods, What is a
sustainable community? [Online] http://www.communities.gov.uk/archived/general-
content/communities/whatis/. Accessed 8 October 2009.
6
 CIE (Centre for International Economics) 2008, Improving energy efficiency in the building sector:
barriers and policy remedies, prepared for the Property Council of Australia, Canberra & Sydney.
7
 Council of Australian Governments (COAG) (2009) National Strategy on Energy Efficiency July 2009.
Canberra ACT.
8
 Green Building Council of Australia (GBCA) (2009) GBCA Green Guide to Government Policy.
Sydney, Australia.
9
 Kakas, C. Executive Director, Residential Development Council of Australia. Pers comms via
meeting Monday, 23 September 2009.
10
   Database of State Incentives for Renewables & Efficiency (DSIRE) (2009) Energy-Efficient New
Homes Tax Credit for Home Builders. [Online]
http://www.dsireusa.org/incentives/incentive.cfm?Incentive_Code=US41F&re=0&ee=1. Accessed 22
September 2009.
11
  United States Code, Title 26. Internal Revenue Code, 45L New energy efficient home credit.
[Online] http://www.dsireusa.org/documents/Incentives/US41F.htm. Accessed 22 September 2009.
12
  Watson II, Ralph S. Harvesting Tax Benefits of Green Building Incentives. Journal of Accountancy;
Aug 2009, Vol. 208 Issue 2, p44-48, 4p
13
   State of Connecticut, Department of Revenue Services (2007) SN 2007(4) 2007 Legislation
Affecting the Sales Tax on Home Weatherization Products
http://www.ct.gov/drs/cwp/view.asp?a=1514&q=384952
14
   Maryland Energy Administration, Green Building Tax Credit Overview [Online]
http://energy.maryland.gov/incentives/business/greenbuilding/documents/GBTCFAQ04-04-08.pdf.
Accessed 24 September 2009.
15
   DSIRE (2009) Income Tax Credit for Green Buildings (Corporate). [Online]
http://www.dsireusa.org/incentives/incentive.cfm?Incentive_Code=CA154F&re=0&ee=1. Accessed 24
September 2009.
16
   City of Roseville, Roseville Electric Profile [Online]
http://www.roseville.ca.us/electric/about/profile.asp. Accessed 24 September 2009.
17
   DSIRE (2009) Roseville Electric - Residential New Construction Rebate Program. [Online]
http://www.dsireusa.org/incentives/incentive.cfm?Incentive_Code=CA154F&re=0&ee=1. Accessed 24
September 2009.


                                                                                                      32
18
   United States Code Service, Title 26. Internal Revenue Code, Section 136 Energy conservation
subsidies provided by public utilities. [Online]
http://www.dsireusa.org/documents/Incentives/US31F.htm Accessed 22 September 2009.
19
   Santa Monica Municipal Code Chapter 8.108 Green Building, Landscape Design, Resource
Conservation and Construction and Demolition Waste Management Standards
http://www.qualitycodepublishing.com/codes/santamonica/view.php?topic=8-8_108&showAll=1.
Accessed 21 September 2009.
20
   Green Building Council of Australia (GBCA) (2009) Green Star - Multi Unit Residential v1. [Online]
http://www.gbca.org.au/green-star/rating-tools/green-star-multi-unit-residential-v1/1930.htm. Accessed
26 September 2009.
21
  (GBCA) (2009) What is Green Star? [Online] http://www.gbca.org.au/green-star/green-star-
overview/. Accessed 26 September 2009.
22
  (GBCA) (2009) Green Star rating calculation [Online] http://www.gbca.org.au/green-star/what-is-
green-star/green-star-rating-calculation/1542.htm. Accessed 26 September 2009.
23
  Madew, R. Green Building Council of Australia, Chief Executive. Pers comms via meeting Thursday,
15 October 2009.
24
     Developer. National Technical Director, Design. Pers comms, numerous.
25
     Developer. National Technical Director, Design. Pers comms, numerous.
26
     Developer. National Technical Director, Design. Pers comms, numerous.
27
     Developer. Estimating Manager, Construction. Pers comms, numerous.
28
  Rider Levett Bucknall (2008) Riders Digest – Sydney, Canberra, Newcastle and Western Sydney
2008. Rider Levett Bucknall, Seaford, Victoria.
29
     Developer, CEO, Pers comms 20 November 2009.
30
  Developer. Marketing & Customer Relations Manager, Victoria and CEO Development Australia,
Pers comms numerous.


                                                                                                    33

More Related Content

Similar to Sustainable Residential Development - Preserving the Project Return

Zne action planfinal83110
Zne action planfinal83110Zne action planfinal83110
Zne action planfinal83110Tev Tlov
 
Achola_Strategic Responses To Changing Environment By Kenya Electricity Gener...
Achola_Strategic Responses To Changing Environment By Kenya Electricity Gener...Achola_Strategic Responses To Changing Environment By Kenya Electricity Gener...
Achola_Strategic Responses To Changing Environment By Kenya Electricity Gener...gurucyber4
 
Capital_projects_life_cycle_managemant_Oil_and_Gas
Capital_projects_life_cycle_managemant_Oil_and_GasCapital_projects_life_cycle_managemant_Oil_and_Gas
Capital_projects_life_cycle_managemant_Oil_and_GasMircea Tomescu
 
MCE Learning and Teaching Version 2.0 Page 1 of 6 Cour
MCE  Learning and Teaching Version 2.0  Page 1 of 6 CourMCE  Learning and Teaching Version 2.0  Page 1 of 6 Cour
MCE Learning and Teaching Version 2.0 Page 1 of 6 CourAbramMartino96
 
Ipd Convention 2009 Lessons Learned Presentation Final
Ipd Convention 2009 Lessons Learned Presentation FinalIpd Convention 2009 Lessons Learned Presentation Final
Ipd Convention 2009 Lessons Learned Presentation FinalAndrew Huseman
 
How Complying Development Certificates Facilitate Construction!
How Complying Development Certificates Facilitate Construction!How Complying Development Certificates Facilitate Construction!
How Complying Development Certificates Facilitate Construction!ESDESIGN1
 
Property Development Finance Guide-20 Steps to Success-Blueray Capital.pdf
Property Development Finance Guide-20 Steps to Success-Blueray Capital.pdfProperty Development Finance Guide-20 Steps to Success-Blueray Capital.pdf
Property Development Finance Guide-20 Steps to Success-Blueray Capital.pdfBlueray Capital
 
Mining Project Management Systems: Driving Predictable Project Outcomes
Mining Project Management Systems: Driving Predictable Project OutcomesMining Project Management Systems: Driving Predictable Project Outcomes
Mining Project Management Systems: Driving Predictable Project OutcomesJamie Morien
 
Development project appraisal and sd(L6)1
Development project appraisal and sd(L6)1Development project appraisal and sd(L6)1
Development project appraisal and sd(L6)1Farha Sharmin
 
BioLife Solutions (NASDAQ: BLFS) Investor Presentation September 2021
BioLife Solutions (NASDAQ: BLFS) Investor Presentation September 2021 BioLife Solutions (NASDAQ: BLFS) Investor Presentation September 2021
BioLife Solutions (NASDAQ: BLFS) Investor Presentation September 2021 tberard
 
Itt product project report
Itt product project reportItt product project report
Itt product project reportVarun Bansal
 
Impact of Sustainable Construction on Business Decisions
Impact of Sustainable Construction on Business DecisionsImpact of Sustainable Construction on Business Decisions
Impact of Sustainable Construction on Business DecisionsIRJET Journal
 
Videocon industries BTL activations
Videocon  industries BTL activationsVideocon  industries BTL activations
Videocon industries BTL activationsKaran Kukreja
 
How to Strategize and Implement Sustainability in Real Estate.pdf
How to Strategize and Implement Sustainability in Real Estate.pdfHow to Strategize and Implement Sustainability in Real Estate.pdf
How to Strategize and Implement Sustainability in Real Estate.pdfTEWMAGAZINE
 
Project Execution in Changing Times - Focus on the Essentials
Project Execution in Changing Times - Focus on the EssentialsProject Execution in Changing Times - Focus on the Essentials
Project Execution in Changing Times - Focus on the EssentialsEndeavor Management
 

Similar to Sustainable Residential Development - Preserving the Project Return (20)

bbbb
bbbbbbbb
bbbb
 
Zne action planfinal83110
Zne action planfinal83110Zne action planfinal83110
Zne action planfinal83110
 
Achola_Strategic Responses To Changing Environment By Kenya Electricity Gener...
Achola_Strategic Responses To Changing Environment By Kenya Electricity Gener...Achola_Strategic Responses To Changing Environment By Kenya Electricity Gener...
Achola_Strategic Responses To Changing Environment By Kenya Electricity Gener...
 
Capital_projects_life_cycle_managemant_Oil_and_Gas
Capital_projects_life_cycle_managemant_Oil_and_GasCapital_projects_life_cycle_managemant_Oil_and_Gas
Capital_projects_life_cycle_managemant_Oil_and_Gas
 
International Zero-Energy Housing
International Zero-Energy HousingInternational Zero-Energy Housing
International Zero-Energy Housing
 
MCE Learning and Teaching Version 2.0 Page 1 of 6 Cour
MCE  Learning and Teaching Version 2.0  Page 1 of 6 CourMCE  Learning and Teaching Version 2.0  Page 1 of 6 Cour
MCE Learning and Teaching Version 2.0 Page 1 of 6 Cour
 
Ipd Convention 2009 Lessons Learned Presentation Final
Ipd Convention 2009 Lessons Learned Presentation FinalIpd Convention 2009 Lessons Learned Presentation Final
Ipd Convention 2009 Lessons Learned Presentation Final
 
How Complying Development Certificates Facilitate Construction!
How Complying Development Certificates Facilitate Construction!How Complying Development Certificates Facilitate Construction!
How Complying Development Certificates Facilitate Construction!
 
Property Development Finance Guide-20 Steps to Success-Blueray Capital.pdf
Property Development Finance Guide-20 Steps to Success-Blueray Capital.pdfProperty Development Finance Guide-20 Steps to Success-Blueray Capital.pdf
Property Development Finance Guide-20 Steps to Success-Blueray Capital.pdf
 
Mining Project Management Systems: Driving Predictable Project Outcomes
Mining Project Management Systems: Driving Predictable Project OutcomesMining Project Management Systems: Driving Predictable Project Outcomes
Mining Project Management Systems: Driving Predictable Project Outcomes
 
Development project appraisal and sd(L6)1
Development project appraisal and sd(L6)1Development project appraisal and sd(L6)1
Development project appraisal and sd(L6)1
 
BioLife Solutions (NASDAQ: BLFS) Investor Presentation September 2021
BioLife Solutions (NASDAQ: BLFS) Investor Presentation September 2021 BioLife Solutions (NASDAQ: BLFS) Investor Presentation September 2021
BioLife Solutions (NASDAQ: BLFS) Investor Presentation September 2021
 
Itt product project report
Itt product project reportItt product project report
Itt product project report
 
ISS_5
ISS_5ISS_5
ISS_5
 
Impact of Sustainable Construction on Business Decisions
Impact of Sustainable Construction on Business DecisionsImpact of Sustainable Construction on Business Decisions
Impact of Sustainable Construction on Business Decisions
 
ISS_3
ISS_3ISS_3
ISS_3
 
Videocon industries BTL activations
Videocon  industries BTL activationsVideocon  industries BTL activations
Videocon industries BTL activations
 
How to Strategize and Implement Sustainability in Real Estate.pdf
How to Strategize and Implement Sustainability in Real Estate.pdfHow to Strategize and Implement Sustainability in Real Estate.pdf
How to Strategize and Implement Sustainability in Real Estate.pdf
 
Project Execution in Changing Times - Focus on the Essentials
Project Execution in Changing Times - Focus on the EssentialsProject Execution in Changing Times - Focus on the Essentials
Project Execution in Changing Times - Focus on the Essentials
 
Bryce book notes
Bryce book notesBryce book notes
Bryce book notes
 

Sustainable Residential Development - Preserving the Project Return

  • 1. PRESERVING THE PROJECT RETURN – An Analysis of Costs and Incentive and Non-Incentive Offsets for Improving Sustainability Performance in a Residential Development. About the Author Shauna Coffey has over 10 years experience in driving sustainable outcomes in a variety of industries with specialisations in organisational corporate responsibility and sustainability strategy, GHG accounting, corporate communications, stakeholder engagement and improving the resource efficiency of existing building stock. As a recent graduate of Bond University’s Master of Real Estate (Sustainable Development) program, Shauna has produced this research paper from work undertaken to satisfy the requirements of the degree final capstone project for which she received the First in Class prize. Supervisor: Professor George Earl. Contact: Phone Australia: 0410-227-031 US: 202-657-6356 Email shaunacoffey@westnet.com.au Confidentiality Limitations Due to the commercially sensitive nature of the information on which the analysis detailed in this report was performed, the identity of the participating developer, referred to throughout as the Developer, has been kept confidential. Additionally only percentages, rather than specific dollar amounts of costs and revenue are disclosed. EXECUTIVE SUMMARY Sustainable communities have been defined as places where people want to live and work, now and in the future. They meet the diverse needs of existing and future residents; are sensitive to their environment; and contribute to a high quality of life. They are safe and inclusive, well planned, built and run, and offer equality of opportunity and good services for all. i
  • 2. While the benefits of such an approach to the delivery of new communities are obvious, the uptake by residential developers has been limited, primarily due to a number of market and non-market barriers to adoption beyond boutique special purpose developments. Principal of those is the classic split incentive, the real world experience that the residential homebuyer will not pay more for a more sustainable home, yet is happy to reap the benefits, especially those related to lower operating expenses. While in order to deliver the more sustainable home, the developer must accept a lower project return. Not a financially sustainable option. Historically the cost of improved sustainability performance has been the focus, however there are a number of points in the development process where delivering a higher sustainability standard may provide returns that have not previously been accounted for. Specifically the impact of increased sales rates, increased promotion and public awareness and access to proposed incentives such as ‘green door’ development approvals which give priority to development with sound sustainability credentials. Additionally, by exploring and modelling incentives for residential developers to improve sustainability performance from around the world, it is also possible to ascertain what impacts these incentives may have on project return, therefore allowing for informed and targeted lobbying of Governments. This project provides an analysis of costs and incentive and non-incentive offsets for improving sustainability performance in a residential development using two financial performance metrics. The traditional Internal Rate of Return (IRR) and an additional in-house metric utilised by the participating Developer, the Value Add (VA). In all over 21 different offset scenarios have been modelled, with only one, the Section 94 construction cost offset, able to fully counter the impact on IRR and VA of development cost increases. The tax credit for 8% of allowable construction cost increases was the least effective, unsurprising, given the limited range of construction costs for which it could be applied and therefore limited revenue impacts. One of the most encouraging results was the impact of an increased sales rate. A modest increase in sales rate of 2% increase over the first three months returned an IRR only 120 basis points (-4.1%) below the base case. The effect is further enhanced when combined with other offsets such as reduced selling and marketing cost. It demonstrates that there are means, already within the control of a developer, which can preserve the project return. ii
  • 3. In order to crystallise this potential, recommendations are made in the following areas: 1 Improve the communication of sustainability features to purchasers 2 Increase the understanding in the general population of benefits of more sustainable homes 3 Use the Developer’s position within industry groups to lobby for a number of incentives in the following order of preference: o Section 94 redistribution to the project o ‘Green-door’ expedited development approvals o Sizable rebates per dwelling While the classic split incentive of costs being met by the developer and benefits accruing to the purchaser remains, there will be no wholesale, voluntary adoption of more sustainable residential development. Project input has been sought from a range of sources, indirectly through published research and directly through engagement with property industry players including in-house specialists of the Developer, the Property Council of Australia the Residential Development Council of Australia and the Green Building Council of Australia. iii
  • 4. TABLE OF CONTENTS EXECUTIVE SUMMARY.................................................................................................................................... I 1 SETTING THE SCENE FOR SUSTAINABLE RESIDENTIAL DEVELOPMENT ............................ 1 2 BARRIERS AND THE NEED FOR DEVELOPER INCENTIVES ....................................................... 2 1.1 THE BARRIERS ....................................................................................................................................... 2 1.2 THE GOVERNMENT RESPONSE AND THE NEED FOR INCENTIVES ............................................................ 3 1.3 TYPES OF INCENTIVES ............................................................................................................................ 4 2 DEVELOPMENT FINANCIAL REVIEW................................................................................................ 6 2.1 FINANCIAL PERFORMANCE METRICS ..................................................................................................... 6 2.2 DEVELOPMENT COSTS ............................................................................................................................ 7 2.3 ADJUSTMENTS IN THE MODEL ................................................................................................................ 7 2.4 BASE CASE IRR AND VA ....................................................................................................................... 7 3 IMPROVING THE SUSTAINABILITY PERFORMANCE ................................................................... 8 3.1 PERFORMANCE RATING TOOLS .............................................................................................................. 8 3.2 REQUIREMENTS TO ACHIEVE IMPROVED PERFORMANCE ....................................................................... 9 3.3 COSTS TO ACHIEVE IMPROVED PERFORMANCE .................................................................................... 11 4 OFFSET SCENARIOS .............................................................................................................................. 13 4.1 INCENTIVE IMPACTS ............................................................................................................................. 13 4.2 NON INCENTIVE IMPACTS ..................................................................................................................... 17 4.3 COMBINED OFFSET SCENARIOS ............................................................................................................ 21 5 DISCUSSION ............................................................................................................................................. 23 6 RECOMMENDATIONS FOR ACTION ................................................................................................. 26 APPENDIX 1 ....................................................................................................................................................... 28 REFERENCES .................................................................................................................................................... 32 TABLE OF FIGURES Figure 1: Percentage cost breakdown...................................................................................................................... 7 Figure 2: Impact of improved sustainability performance on financial base case................................................. 12 Figure 3: Impact of $2000 income tax credit ........................................................................................................ 13 Figure 4: Impact of sales tax exemption. .............................................................................................................. 14 Figure 5: Impact of tax credit for allowable construction costs. ........................................................................... 15 Figure 6: Impact of $8,600 rebate. ........................................................................................................................ 16 Figure 7: Impact of expedited permitting. ............................................................................................................. 16 Figure 8: Impact of Section 94 contribution exemption. ....................................................................................... 17 Figure 9: Impact of increased sales rate. ............................................................................................................... 19 Figure 10: Impact of reduced marketing and selling expenses. ............................................................................ 20 Figure 11: Impact of achieving a sales price uplift. .............................................................................................. 21 Figure 12: Impact of sales rate increase + marketing and selling cost savings. .................................................... 22 Figure 13: Impact of sales rate increase + tax credit. ............................................................................................ 22 Figure 14: Impact of sales rate increase + expedited approvals. ........................................................................... 23 LIST OF TABLES Table 1: Changes to construction to achieve a 4 star Green Star Multi Unit Residential v1 rating. ..................... 10 Table 2: Changes to consultant costs to achieve a 4 star Green Star Multi Unit Residential v1 rating. ................ 11 Table 3: Modelled construction cost increases...................................................................................................... 12 Table 4: Construction materials considered to contribute to energy efficiency .................................................... 14 Table 5: Modelled sales timing changes ............................................................................................................... 18 Table 6: Modelled sales and marketing cost changes ........................................................................................... 19 Table 7: Ranked offset scenarios .......................................................................................................................... 24 iv
  • 5. 1 SETTING THE SCENE FOR SUSTAINABLE RESIDENTIAL DEVELOPMENT The building sector captures both residential and commercial activity that takes place within our built environment and houses nearly 60 per cent of Australia’s economy in terms of contribution to gross domestic product (GDP)1. The commercial sector comprises 11 major economic sectors and the residential sector comprises the following building classifications that make up the vast majority of residential buildings in Australia2: Class 1a (i) — detached houses; Class 1a (ii) — attached dwellings; and Class 2 — buildings containing two or more sole occupancy units. It is estimated that the residential sector accounts for 74 CO2-e Mt or 13% of Australia’s Greenhouse Gas (GHG) emissions profile3. In considering the abatement opportunity within the residential sector, the Centre for International Economics focussed on retrofitting “rebuilding” the existing building stock to achieve a 48% efficiency gain at a technical cost saving of $113 per tonne of GHG emissions abated through the following measures: lighting — substitution of energy inefficient with energy efficient light fittings; refrigeration — substitution of less efficient with more efficient fridges and freezers; hot water — adoption of more efficient appliances, improved fittings and reduced water use; standby electricity — adoption of devices that achieve low standby energy use; space heating — adoption of more efficient heating appliances and improvements in the thermal envelope, achieving 7-star energy rating; and cooling — adoption of more efficient appliances (as well as gains from thermal envelope improvements)4. These are obvious areas for focus in the delivery of new residential buildings. Beyond energy efficiency are the broader, but often overlooked benefits of delivering a more sustainable residential built environment. Sustainable communities have been defined as places where people want to live and work, now and in the future. They meet the diverse needs of existing and future residents; are 1
  • 6. sensitive to their environment; and contribute to a high quality of life. They are safe and inclusive, well planned, built and run, and offer equality of opportunity and good services for all5. It stands to reason that new housing stock and communities should seek to deliver these same outcomes in sustainability performance. 2 BARRIERS AND THE NEED FOR DEVELOPER INCENTIVES Incentives address the barriers which are hindering the wholesale delivery of improved sustainability performance in the residential real estate market. 1.1 The Barriers Whilst focussing specifically on energy efficiency, the Centre for International Economics (CIE) identifies the presence of market and non-market barriers that prevent the building sector from investing in opportunities to improve sustainability performance6. Those barriers and how they are experienced in new residential development are described below: Information gaps – parties are often unaware of the options available to them. This is true on both the part of the developer and that of the homebuyer. Information asymmetries (adverse selection) — even when information is available, it can be difficult for both the developer and the homebuyer to determine with options are ‘good’ and which are ‘bad’. Specialist (read: expensive) advice is often required. When the costs of making poor choices are sufficiently high, which is most certainly the case for a developer, this may lead the decision maker making no choice at all. This is a real barrier to the adoption of new technology, as residential developers are traditionally building on past experiences, taking a new product forward and upsetting the successful ‘formula’ is a difficult move, especially when your brand is based on quality and long- term warranties are offered. Split incentives – where the costs and benefits of an investment to improve sustainability performance accrue to different parties. The costs to improve the sustainability performance of a new home are met by the developer. The benefits, in reduced utility costs, healthier spaces and better quality of life are received by the homebuyer. That the developer is unable to recover these increased costs from the homebuyer, acts as a significant deterrent to action. Unpriced externalities – the CIE describe an externality occurring when an economic activity causes costs or benefits to third parties, that is where the producers and consumers 2
  • 7. in a particular market either do not bear all of the costs or do not reap all of the benefits of the economic activity. This is certainly the case where the developer delivers a more sustainable home, one that uses less electricity, that is constructed with recycled content products with waste minimised to conserve resources and other such initiatives. The environment and the future users of those resources benefit. The cost of these benefits is not recovered by the developer. Bounded rationality — the opposite problem of incomplete information is having too much information. Where too much information is available, as is certainly becoming the case as new products and approaches emerge on a daily basis, decision makers often revert to ‘Rules of Thumb’ rather than more complete decision making processes. This can mean opportunities are overlooked or undervalued, which as individuals may not be significant, but can combine to become so. Regulatory problems – there are certainly significant regulatory barriers to more sustainable residential product, especially when exploring district approaches such as trigeneration where both strata and energy market regulation prevent a developer locking future residents into an energy supply contract, often scuttling the financial viability of such a significant investment. Also over regulating building standards can have perverse impacts, such as the six star NatHERS rating requirements of which there is anecdotal evidence of homes constructed with reduced windows or little natural ventilation in order to reach the standard. 1.2 The Government Response and the Need for Incentives Government response to date has typically been to focus on closing information gaps and asymmetries and provide financial incentives to overcome upfront costs and accelerate uptake of sustainability options. However these financial incentives are focussed only on the owner of an existing home and are not accessible by the residential developer. Examples of Government and Government-mandated energy utility funded programs that a home owner can access include rebates for water efficient washing machines, fridge buyback programs, solar panel installation rebates, feed-in tariffs for domestic renewable energy and free ceiling insulation. Governments are also moving quickly to regulate for increased sustainability performance as evidenced by July 2009 release of the Council of Australian Governments (COAG) National Strategy on Energy Efficiency7. “Making buildings more efficient” is one of the key themes of the Strategy which will see the following measures progressed in the residential space: 3
  • 8. Significantly increase the stringency of energy efficiency provisions for all new residential buildings in the Building Code of Australia (BCA) and broaden coverage of efficiency requirements. Minimum energy efficiency standards will be upgraded to 6-stars (NatHERS), or equivalent, nationally in the 2010 update of the BCA to be implemented by May 2011. Phase in mandatory disclosure of residential building energy, greenhouse and water performance at the time of sale or lease, commencing with energy efficiency by May 2011. Address the opportunities that can be derived from building lot or precinct level layout that support appropriate solar access to living areas, solar hot water, and solar photovoltaic systems for new buildings. Provide and promote information on energy efficient housing options. Whilst regulated standards do level the playing field for base case sustainability performance, there has been little consideration of the fundamental barriers confronting developers of new residential stock. The approach is regulatory with the developer to absorb the cost of compliance. Australian research identified very few incentives for developers to move ahead of or beyond legislation8. This was a position supported by property industry bodies, who acknowledged a lack of Government action in incentivising developers9. 1.3 Types of Incentives For examples of incentives for developers to deliver improved sustainability performance it was necessary to look internationally. The programs detailed below is by no means an exhaustive list, but serves to inform the type of incentives available as a basis for determining IRR value in the development process. 1.3.1 Taxation Based Incentives Federal Government Energy-Efficient New Homes Tax Credit for Home Builders (US) First established in the 2005, extended in 2008 and again in December 2009, the Energy- Efficient New Homes Tax Credit for Home Builders enables tax credits of up to $2,000 for builders of all new energy-efficient homes built to prescribed energy performance standards10. A home with annual heating and cooling energy consumption which is at least 30% below the annual level of heating and cooling energy consumption of a comparable dwelling unit and constructed in accordance with the International Energy Conservation Code qualifies for $1000. The building envelope component improvements must account for at least one-third of 4
  • 9. the reduction in energy consumption. A home 50% below a comparable and with the building envelope improvements accounting for one-fifth of savings qualifies for $200011. Unused current-year credits may be carried back one year or forward up to 20 years. This is acknowledged as a considerable tax benefit12. Sales and Use Tax Exemption for Energy-Efficient Products (US) The State of Connecticut offers an exemption from the state's sales and use tax for “residential weatherization products” including programmable thermostats, window film, attic and wall insulation, spray foam insulation, water pipe insulation, natural gas furnaces and windows that meet the federal energy star standard. The exemption to applies to a property owner, a tenant, or a contractor, and whether the products are to be used in existing real property or new construction, but only for sales made by Connecticut retailers13. Corporate Income Tax Credit for Green Buildings (US) Although no longer accepting applications, the State of Maryland Green Building Tax Credit program provided a credit against a taxpayer’s corporate income tax of 6% to 8% of total allowable construction costs for a building that meets Leadership in Energy and Environmental Design Green Building Rating System (LEED) standards. Actual certification was not necessary, simply a demonstration that criteria were met14. Non-residential and residential multifamily buildings of at least 20,000 square feet, on a qualified brownfields site, or in a priority funding area, and not in a wetlands area were eligible and allowable construction costs related to three types of alternative energy sources: photovoltaics (PV), wind turbines and fuel cells for either the green whole building, a green base building, or green tenant space15. 1.3.2 Rebates and Subsidies Roseville Electric - Residential New Construction Rebate Program (US) Roseville Electric, located in Placer County, Sacramento, California, a municipal owned utility servicing 52,000 residential and business customers16, has established the Residential New Construction Rebate Program. Builders of residential homes can access a rebate of up to $8,600 for each new home that complies with the prescribed standard in excess of legislated requirements and installation of grid-tied photovoltaic (PV) systems17. It’s worth noting that Section 136 of the US Code Service - Energy conservation subsidies provided by public utilities, energy conservation subsidies provided by public utilities either directly or indirectly, are non-taxable18. 5
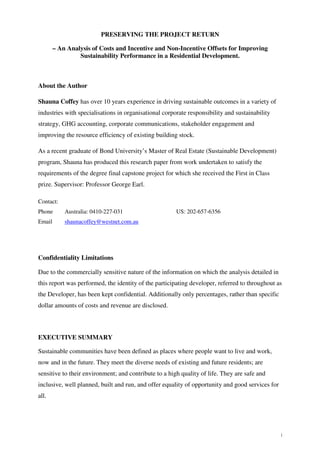
  • 10. Section 94 contribution exemption – for consideration Section 94 of the Environmental Planning and Assessment Act 1979 (NSW) provides for a requirement of property developers to make a contribution towards provision or improvement of amenities or services, known commonly as Community Infrastructure Levies. The contribution can be in the form of dedication of land free of cost, or the payment of a monetary contribution or both. As an intended purpose of Section 94 contributions is to provide for provision or improvement of amenities or services, the appropriate application of the funds to this purpose will impact on the sustainability of the development. If a developer were able to retain Section 94 contributions and apply them directly to improving the sustainability performance of the development, the objectives would still be met. This is not an incentive currently available but has been identified in discussions as an attractive incentive, the impacts of which should be modelled. 1.3.3 Procedural Advantages Expedited Permitting for Green Buildings (US) Section 8.108.050 of the Santa Monica Municipal Code, Priority plan check processing for LEED certified buildings 19, provides for priority plan check processing by all City departments for all new and qualifying existing buildings, that are registered with the United States Green Building Council for, and are actively pursuing certification under the LEED standards, including LEED for Homes (LEED-H), LEED for New Construction (LEED-NC), and LEED for Core and Shell (LEED-CS). The Council reserves the right to impose a fine on projects that receive priority plan check processing, but then fail to achieve LEED certification. 2 DEVELOPMENT FINANCIAL REVIEW The development analysed is a multi unit residential development comprised of a mix of 164 one, two and three bedroom apartments. 2.1 Financial Performance Metrics Two financial performance metrics are utilised by the Developer: the traditional project Internal Rate of Return (IRR), being the discount rate which generates a zero net present value; and, an in-house Value Add (VA) metric. The VA metric is based on the concept of time value of money and captures the timing of profits – a key driver in value creation. Its measures the movement in the Net Present Value (NPV) of a projects cash flow between the commencement of the project and the completion 6
  • 11. of the project using a predetermined discount rate. The VA metric provides a mechanism for the Developer to assess the impacts of changes to cash flow totals and timing between forecast and actual. 2.2 Development Costs Elements of total development costs are presented as percentages in Figure 1. Construction costs including labour and materials are by far the largest cost component, with land cost the next largest. Figure 1: Percentage cost breakdown 2.3 Adjustments in the Model These costs were extracted from a project tracking report and verified with the project team. Given some variances between the figures in the project tracking report and those in the feasibility model, it was necessary to undertake a number of adjustments within the feasibility model utilised for the scenario modelling. Where costs were higher or lower, the necessary change was made to the line item in the feasibility report and the difference spread equally across all months. It is acknowledged that this is unlikely to reflect the actual timing impact of the variation, but with the information available it was not possible to pinpoint exact timing of the variations. 2.4 Base Case IRR and VA The project is returning an IRR of 29.34% and VA of $5.6 million. 7
  • 12. 3 IMPROVING THE SUSTAINABILITY PERFORMANCE 3.1 Performance Rating Tools 3.1.1 Green Star – Multi Unit Residential v1 The Green Building Council of Australia (GBCA) launched the Green Star – Multi Unit Residential v1 rating tool on 2 July 2009 to promote the design and construction of high- performance green residential developments20. All GBCA Green Star rating tools evaluates the green attributes of building projects based on nine categories21. Management Transport Land Use & Ecology Indoor Environment Quality Water Emissions Energy Materials Innovation The Green Star rating is determined as a percentage score by summing the credits awarded against each initiative in each category, then applying a category environmental weighting factors and each resultant total category score summed including any innovation credits awarded22. Green Star ratings are awarded for scores of 45 or more as follows: Star Green Star Certified Rating (score 45-59) signifies 'Best Practice'. Star Green Star Certified Rating (score 60-74) signifies 'Australian Excellence'. Star Green Star Certified Rating (score 75-100) signifies 'World Leadership'. Numerous Government bodies have moved to mandate Green Star within the develop process and a means of meeting their sustainable development objectives. However it should be noted that the GBCA’s suite of Green Star rating tools are voluntary. The GBCA acknowledges there is great value in utilising the Green Star tools as the performance measurement mechanism within an incentives framework and advocates that governments lead by example and incorporate Green Star into their own building requirements23. With this is mind, it is considered appropriate that the Green Star rating (minimum 4 stars) be set as the baseline for developer incentives and therefore the benchmark for the development under analysis. 8
  • 13. 3.1.2 Developer Standards The Developer also has a number of in-house sustainability commitments outside of Green Star. These were also included in the requirements to be delivered to improve sustainability performance however the specifics of the commitments and the required standards, beyond the actual changes required for improved sustainability performance detailed herein, cannot be disclosed. 3.2 Requirements to Achieve Improved Performance To determine the costs to achieve a 4 star Green Star rating and the additional Developer commitments, it was first necessary to determine what additional inclusions would be required. A review of the Green Star – Multi Unit Residential (“MUR”) v1 tool was undertaken, with credits to be pursued identified. In consultation with Developer in-house specialists24, a number of areas were identified where the selection of materials or additional features would deliver the higher performance required. It was not within the scope of this project to perform a certifiable Green Star MUR assessment, as to do so would have required specialist and costly technical modelling, particularly in the energy, water and emissions categories. Certain assumptions were developed in consultation with the Developers design group25 to allow an indicative performance score to be determined. 1. That increasing insulation levels, external shading, the energy efficiency of lighting and installation of ceiling fans would achieve the Conditional Requirement for Energy - To meet the conditional requirement, the average thermal performance of the dwellings must be improved by 10% compared to the regulated thermal performance standard in the relevant jurisdiction. 2. Also that the development having no central HVAC system, use of relatively energy efficient packaged air-conditioning units for heating and cooling, use energy efficient lighting, gas hot water service, exhaust systems, eco-lift system, no pool/sauna/spa and use of gas cook tops would likely achieve a 20% reduction on Green Star Greenhouse Gas Emissions benchmark. 3. That upgrading fixtures and fittings to six star WELS rating and dual plumbing of 'purple pipe' recycled water would achieve 3 credits under Occupant Amenity Water and a Discharge to Sewer credit. 9
  • 14. The materials or features modifications required to achieve the required sustainability performance are detailed in Table 1 below. Table 1: Changes to construction to achieve a 4 star Green Star Multi Unit Residential v1 rating. Appointment of a dedicated Green Star Accredited Professional on Wages - Green Star Manager project team to manage process including preparation of Building Users' Guide and submit rating. Inclusion of low-emissivity glass in windows to control heat transfer and improve thermal performance to achieve Conditional Aluminium Windows Requirement for energy and reduction in Greenhouse Gas Emissions of 20% on Green Star benchmark. Inclusion of additional louvers and screens to increase shading and improve thermal performance to achieve Conditional Requirement External Louvers & Screens for energy and reduction in Greenhouse Gas Emissions of 20% on Green Star benchmark. Inclusion of additional sunshades to increase shading and improve thermal performance to achieve Conditional Requirement for energy Pergolas & Sunshades and reduction in Greenhouse Gas Emissions of 20% on Green Star benchmark. Inclusion of additional ceiling, wall and floor thermal and noise insulation to increase thermal performance and noise performance Insulation to achieve Conditional Requirement for energy and reduction in Greenhouse Gas Emissions of 20% on Green Star benchmark. Also Internal Noise Level credit. Carpenter Labour & Materials All engineered wood products contain no formaldehyde. Increase WELS rating of all fixtures and fittings to 6 star WELS Bathroom Fixtures rating. Use of low VOC carpets as specified in Green Star and upgrade Carpet choice to achieve 1 point, eco-content, high durability, responsible supplier, supplier take back. Tiling Use of low VOC adhesives in tiling as specified in Green Star. Painting Use of low VOC paints as specified in Green Star. Replacement of 30% of the total cost of PVC content with a non- Plumber & Drainer PVC alternative. Installation of ceiling fans in at least 95% of all apartments. Energy sub-metering for substantive energy uses within the building and smart metering for the consumption of electricity, water and gas Electrical Installation in all apartments. Installation of a single shut down switch in all apartments. Upgrade of energy efficiency of lighting. Upgrade to ensure all HVAC refrigerants have an Ozone Depletion Mechanical Services Potential (ODP) of zero and a GWP100 of 10 or less. Landscaping Scheme improved to 2 points on ecological calculator. 10
  • 15. In additional to construction cost increase, cost increases should also be expected in consultants to the development project to undertake additional tasks associated with Green Star design and certification as detailed in Table 2. Table 2: Changes to consultant costs to achieve a 4 star Green Star Multi Unit Residential v1 rating. To account for additional requirements of Green Star design and Architects Fees provide necessary documentation for certification. To provide additional advice, oversight of delivery and necessary Structural Engineer documentation Green Star certification. To provide additional advice, oversight of delivery and necessary Electrical Engineer documentation Green Star certification. To provide additional advice, oversight of delivery and necessary documentation Green Star certification including pre- Mechanical Engineer commissioning, commissioning, and quality monitoring are contractually required and done in exact accordance with appropriate guidelines. To provide additional advice, oversight of delivery and necessary Hydraulic Engineer documentation Green Star certification. To provide additional advice and necessary documentation Green Star certification. The Developer Green Star professional will Environmental Consultant manage the bulk of the Green Star management and submission process. To provide additional advice, oversight of delivery and necessary Facade Engineering documentation Green Star certification. 3.3 Costs to Achieve Improved Performance Given the inability to model specifics, particularly around the increased level of shading, insulation, low-emissivity glass, an alternative approach to determining cost increases was required. With input from Developer architects26 and construction27 professionals it was determine at percentage increase could be applied to specific elements with a fair degree of confidence. However, one key outcome from these discussions was the identified need to differentiate cost increases to supply of the product, fit of the product or both supply and fit. For example, inclusion of low-emissivity glass would be an increased cost to supply, not fit. The Developer generally employs a supply and fit arrangement, costs in project tracking report reflect this total cost. Therefore in order to apply an increase to the supply, fit or supply and fit elements, it was first necessary to determine the likely breakdown between the supply and fit costs. To do this the industry accepted Labour and Material Trade Ratios were applied28 to the construction costs. 11
  • 16. Each identified element was then determined to be a supply, fit or supply and fit item. For supply only items, an agreed percentage increase was applied to the calculated supply cost. For fit only items, and agreed percentage increase was applied to the fit cost. For supply and fit items an agreed percentage increase was applied to both elements. As it is not possible to disclose specific construction costs, a summary only of increased costs as a percentage off base is provided in Table 3 below. Table 3: Modelled construction cost increases. Cost Element Percent Increase CONSTRUCTION 3.54% CONSULTANTS 10% For the purpose of modelling the changes in construction and consultant costs were equally apportioned over all periods. The reality would be different and the timing would impact on the IRR, it was however not possible to accurately predict when the cost increases would occur. The modelling showed an IRR of 26.94%, a decrease of 240 basis points (-8.2%) from the base case and a VA of $4.2 million a decrease of $1.4 million (-25.3%). Figure 2: Impact of improved sustainability performance on financial base case. 12
  • 17. 4 OFFSET SCENARIOS A complete list of modelled offset scenarios and financial performance is provided in Appendix 1. 4.1 Incentive Impacts 2.1.1 Federal Government Energy-Efficient New Homes Tax Credit for Home Builders (US) The Developer feasibility model utilised does not allow for consideration of corporate tax credits to be applied as a project level. Assuming the tax credit applied to the individual project would be experienced as an increase in sales revenue, an increase in sales revenue of $2,000 per apartment was modelled. Given the acknowledged impact of the time value of money, the timing of the credit is critical and three difference scenarios were modelled: a lump sum payment in advance, an equal monthly payment and payment in arrears. The best case scenario was to receive the $2000 credit per apartment as a lump sum in advance, delivering an IRR of 27.29%, up 35 basis points (1.3%) on the Green Star scenario but still 205 basis points (-7%) below the base case. The VA is $4.4 million, $0.21 million (5.0%) up on the Green Star scenario but $1.2 million (-21.5%) below the base case. Figure 3: Impact of $2000 income tax credit 4.1.1 Sales and Use Tax Exemption for Energy-Efficient Products (US) In order to model the impact of the sales tax exemption, construction materials considered to contribute to energy efficiency were identified, see Table 4. To determine a cost to model, the amount from the project finance report was apportioned based on the Riders Digest and then a 10% discount applied. This resulted in a total reduction in construction costs of 1.77%. 13
  • 18. Table 4: Construction materials considered to contribute to energy efficiency Aluminium Windows Insulation Plumber & Drainer External Louvers & Screens Bathroom Fixtures Electrical Installation Pergolas & Sunshades Painting Mechanical Services Lift Installation This resulted in an IRR of 28.03%, up 109 basis points (4.0%) on the Green Star scenario but 131 basis points (-4.5%) below the base case. The VA is $4.9 million, up $0.65 million (15.5%) on the Green Star scenario but $0.77 million (-13.7%) below the base case. Figure 4: Impact of sales tax exemption. 4.1.2 Corporate Income Tax Credit for Green Buildings (US) Whilst similar to the Federal Government Energy-Efficient New Homes Tax Credit for Home Builders, the tax credit value is calculated based on the construction costs, not the number of units delivered. As with noted in modelling the previous tax credit, the Developers feasibility model does not allow for consideration of corporate tax credits to be applied as a project level. The State of Maryland Green Building Tax Credit applied only to allowable construction costs related to three types of alternative energy sources: photovoltaics (PV), wind turbines and fuel cells. Although none of these technologies was included in the Green Star scenario, in order to determine the potential impact of such an offset an alternative application was modelled. A tax credit, to the value of 8% of increased construction costs associated with meeting the Green Star standard was calculated an added to revenue, an increase of 0.13%. Again as timing is important, payment in advance, in equal monthly instalments and in arrears 14
  • 19. was modelled. The best case scenario, credit received in advance made little impact on the Green Star scenario costs. An IRR of 27.09%, was up 15 basis points (0.6%) on the Green Star scenario but 225 basis points (-7.7%) below the base case. The VA of $4.3 million, is up $0.09 million (2.1%) on the Green Star scenario but $1.33 million (-23.7%) below the base case. Figure 5: Impact of tax credit for allowable construction costs. 4.1.3 Roseville Electric - Residential New Construction Rebate Program (US) Again it was necessary to model this scenario as increased sales revenue, with an increase of $8,600 per apartment modelled. Payment in advance, in equal monthly instalments and in arrears was modelled. The best case scenario, rebate received in advance resulted in an IRR of 28.44%, up 150 basis points (5.6%) on the Green Star scenario, but 90 basis points (-3.1%) below the base case. The VA of $5.1 million is up $0.9 million (21.6%) on the Green Star scenario, but remains $0.5 million (-9.2%) below the base case. 15
  • 20. Figure 6: Impact of $8,600 rebate. 4.1.4 Expedited Permitting for Green Buildings (US) Expedited permitting allows for lowering of holding costs associated with the land. On advice from Developer specialists29, it was determined the best means of modelling this was to shorten the time period between acquisition of land and commencement of construction. This period was shortened by two months. This resulted in an IRR of 28.37% up 143 basis points (5.3%) on the Green Star scenario but 97 basis points (-3.3%) below the base case. The VA of $4.8 million is up $0.6 million (13.4%) on the Green Star scenario but remains $0.9 million (-15.3%) below the base case. Figure 7: Impact of expedited permitting. 16
  • 21. 4.1.5 For consideration - Section 94 contribution exemption The Section 94 contributions for this development were 1.34% of total development costs. To model the impact of the Section 94 contribution exemption, the Section 94 amount was removed from Statutory Costs and deducted from Construction Costs. This resulted in an IRR of 29.83% exceeding the base case scenario by 49 basis points (1.7%) the VA of $5.8 million exceeded the base case scenario $0.2 million (4.0%). Figure 8: Impact of Section 94 contribution exemption. 4.2 Non Incentive Impacts 4.2.1 Increase sales rate It is generally accepted and certainly shared as the experience of the Developer that improved sustainability performance does not lead to an increase in sales price. However, it is similarly acknowledged that sustainability performance is a ‘tie-breaker’ issue in the decision making process, which may mean buyers choose the more sustainable product over a readily comparable less sustainable product. Assuming that the area sales rate remains the same, this could lead to an increase in sales rate for the more sustainable product. A conservative 1% increase in monthly sales rate was applied for the first three months. This increased the average sales rate from 7% to 10% and shorted the selling period by four months. When a 2% increase in monthly sales rate was applied for the first three months, the average sales rate increased to 13% shortening the sales period by a further two months. 17
  • 22. Table 5: Modelled sales timing changes Original - monthly 1 percent 2 percent percent increase increase Month 1 1% 2% 3% 2 65% 66% 67% 3 10% 11% 12% 4 9% 9% 9% 5 4% 4% 4% 6 2% 2% 2% 7 2% 2% 2% 8 2% 2% 1% 9 1% 1% 10 1% 1% 11 1% 12 1% 13 1% 14 1% Average 7% 10% 13% The 1% increase in sales rate resulted in an IRR of 27.63%, up 69 basis points (2.6%) on the Green Star scenario but still 171 basis points (-5.8%) below the base case. The VA is $4.5 million, up $0.3 million (7.7%) on the Green Star scenario but $1.1 million (-19.5%) below the base case. The 2% increase in sales rate resulted in an IRR of 28.14%, up 120 basis points (4.4%) on the Green Star scenario but still 120 basis points (-4.1%) below the base case. The VA is $4.8 million, up $0.6 million (13.2%) on the Green Star scenario but $0.9 million (-15.4%) below the base case. 18
  • 23. Figure 9: Impact of increased sales rate. 4.2.2 Reduced marketing and selling expenses Again, whilst acknowledging improved sustainability performance does not lead to an increase in sales price, it is conceivable that promoted well, the improved sustainability performance may generate an additional level of interest in the property resulting in greater word-of-mouth promotion or exposure through other channels such as media. This may allow for a slight reduction in marketing and selling costs. The project financial report was analysed for items where it was felt savings could be realised (Table 6), resulting in an overall reduction of 3%. Selling costs which included agents’ costs and commissions was reduced 10%. Table 6: Modelled sales and marketing cost changes Percent Change MARKETING Adv Design - Press 10% Mkt Mat Des - Direct Mail 10% Mkt Mat Des-Brochures 10% Conslt - Public Relations 10% TOTAL MARKETING 3% This resulted in an IRR of 27.25%, up 31 basis points (1.1%) on the Green Star scenario but still 209 basis points (-7.1%) below the base case. The VA of $4.4 million is up $0.2 million (4.4%) on the Green Star scenario but remains $1.2 million (-22.0%) below the base case. 19
  • 24. Figure 10: Impact of reduced marketing and selling expenses. 4.2.3 Achieving a Sales price uplift To inform project discussion, it was worthwhile to model what price increase would be necessary to recover costs incurred in realising the Green Star scenario. A 1% and a 2.5% uplift in sales price were modelled. A modest 1% increase per unit resulted in an IRR of 27.98%, up 104 basis points (3.9%) on the Green Star scenario but 136 basis points (-4.6%) below the base case. A VA of $4.9 million, up $0.7 million (15.5%) on the Green Star scenario is $0.8 million (-13.7%) below the base case. A 2.5% sales increase unit resulted in an IRR of 29.52%, exceeding the base case scenario by 18 basis points (0.6%). The VA of $5.8 million exceeded base case by $0.2 million (3.6%). 20
  • 25. Figure 11: Impact of achieving a sales price uplift. 4.3 Combined Offset Scenarios A number of combined offset scenarios were modelled based on the likelihood of the offsets occurring concurrently, or where incentive based, what was considered a possibly palatable incentive to propose. In modelling these combined scenarios, it was noted that the impact on IRR and VA was in fact cumulative, so that improvements from the Green Star scenario could be added to determine the impact of multiple scenarios. 4.3.1 Sales Rate Increase + Marketing and Selling Cost Savings As the increased sales rate and reduction in sales, marketing and selling costs would be felt concurrently, their combined effect was modelled. The 1 percent sales rate increase plus the reduced marketing and selling costs resulted in an IRR of 27.95%, up 101 basis points (3.7%) on the Green Star scenario but 139 basis points (- 4.7%) below the base case. A VA of $4.7 million, up $0.2 million (12.2%) on the Green Star scenario is $0.9 million (-16.2%) below the base case. The 2 percent sales rate increase plus the reduced marketing and selling costs resulted in an IRR of 28.46%, up 152 basis points (5.6%) on the Green Star scenario but 88 basis points (- 3.0%) below the base case. A VA of $4.9 million, up $0.7 million (17.6%) on the Green Star scenario is $0.7 million (-12.1%) below the base case. 21
  • 26. Figure 12: Impact of sales rate increase + marketing and selling cost savings. 4.3.2 Increased Sales Rate + Tax Credit The combined effect of the lower of the two modelled increases in sales rate (1%) and the $2000 tax credit per apartment as a lump sum in advance was modelled. This scenario resulted in an IRR of 27.99%, up 105 basis points (3.9%) on the Green Star scenario but still 135 basis points (-4.6%) below the base case. A VA of $4.7 million is up $0.5 million (12.8%) on the Green Star scenario but remains $0.9 million (-15.8%) below the base case. Figure 13: Impact of sales rate increase + tax credit. 22
  • 27. 4.3.3 Increased Sales Rate 1% + Expedited Approvals The combined effect of the lower of the two modelled increases in sales rate (1%) and the impact of the expedited approvals process was modelled. This resulted in an IRR of 29.14%, up 2.20% on the Green Star scenario is only 20 basis points (-0.7%) below the base case. A VA of $5.1 million, up $0.9 million (21.1%) on the Green Star scenario is $0.5 million (-9.5%) below the base case. Figure 14: Impact of sales rate increase + expedited approvals. 5 DISCUSSION In all over 21 different offset scenarios have been modelled, the impacts from best to worst are presented in Table 7, with the Section 94 construction cost offset the best, exceeding the base case IRR by 49 basis points (1.7%) and VA by $0.2 million (4.0%). The only non-price increase offset scenarios to do so. The least effective was the tax credit for 8% of allowable construction cost increases received as a lump sum in arrears being 228 basis points (-7.8%) below the base case IRR and $1.4 million (-24.0%) below the VA. This is unsurprising, given the limited range of construction costs for which it could be applied and therefore limited revenue impacts. And this assumes the Australian tax system and the Developers internal treatment of tax would allow for the full credit to be felt at the project level. 23
  • 28. Table 7: Ranked offset scenarios IRR Change IRR VA VA (basis Change Change Change points) (%) ($) (%) Section 94 construction cost offset 49 1.7% 222,979 4.0% Increased sales price 2.5% 18 0.6% 201,450 3.6% Increased Sales Rate 1% + Expedited Approvals -20 -0.7% -535,277 -9.5% Increased Sales Rate 2% + Reduced Selling and Marketing Costs -88 -3.0% -684,113 -12.1% $8600 rebate per dwelling (in advance) -90 -3.1% -515,948 -9.2% Expedited Approvals -97 -3.3% -861,074 -15.3% $8600 rebate per dwelling (monthly) -109 -3.7% -605,024 -10.7% Increased Sales Rate 2% -120 -4.1% -870,073 -15.4% $8600 rebate per dwelling (in arrears) -127 -4.3% -688,849 -12.2% Sales tax exemption for energy efficient products -131 -4.5% -773,135 -13.7% Increased Sales Rate 1% + $2000 tax credit in advance -135 -4.6% -887,163 -15.8% Increased sales price 1% -136 -4.6% -773,926 -13.7% Increased Sales Rate 1% + Reduced Selling and Marketing Costs -139 -4.7% -912,420 -16.2% Increased Sales Rate 1% -171 -5.8% -1,098,380 -19.5% $2000 income tax credit (lump sum in advance) -205 -7.0% -1,212,961 -21.5% Reduced Selling and Marketing Costs -209 -7.1% -1,238,218 -22.0% $2000 income tax credit (received monthly) -209 -7.1% -1,233,677 -21.9% $2000 income tax credit (lump sum in arrears) -213 -7.3% -1,253,171 -22.3% Tax credit for 8% of allowable construction cost increases (in advance) -225 -7.7% -1,334,018 -23.7% Tax credit for 8% of allowable construction cost increases (monthly) -227 -7.7% -1,342,860 -23.8% Tax credit for 8% of allowable construction cost increases (in arrears) -228 -7.8% -1,351,181 -24.0% Green Star Costs -240 -8.2% -1,424,177 -25.3% One of the most encouraging results was the impact of an increased sales rate. The very modest increase in sales rate was tested with a number of parties30, with all agreeing that such an increase was not unrealistic with focussed marketing efforts. For a 2% increase over the first three months, or an increase from 7% to 13% overall to be only 120 basis points (-4.1%) 24
  • 29. in IRR and $0.8 million (-15.4%) in VA behind the base case is exciting. It demonstrates that there are means, already within the control of the Developer, which can preserve the project return. When an even more cautious 1% increase in sales rate over the first three months is combined with an expedited approval process (modelled as a two month shortening of land holding costs) the project return is within 20 basis points (-0.7%) off the IRR and $0.5 million (-9.5%) VA of the base case. This provides a strong justification for a non-financial incentive that councils can offer to developers to encourage more sustainable residential development. However, with the 2% increased sales rate over the first three months combined with reduced selling and marketing cost, both within the control of the Developer and not reliant on external incentives, an IRR within 88 basis points (-3.0%) and VA within $0.7 million (- 12.1%) can be achieved. Such actions combined with efforts to control additional construction costs have the strong potential to protect the original base case return. It is necessary to discuss the development cost modelling, in that although it was ‘stress tested’ with a number of parties, there were many assumptions drawn, particularly in the extent of initiatives required to achieve the conditional energy requirement under Green Star. Ideally, if cost and timeframes permitted, more detailed energy modelling and cost planning would be undertaken. It was also noted in discussions that many of the substitute items should not necessarily increase in price as a result of being ‘more sustainable’ and in fact the Developer’s purchasing power could enable price parity in many respects. This should also be the case with project consultants, appropriately briefed and contracted at commencement, additional costs should be kept to a minimum. The research would also benefit from greater analysis of revenue impacts of the international financial incentives modelled. The modelling performed herein does not attempt to accurately reflect the intricacies of the different incentives in application, but rather, as intended, provides an indication of different incentive impacts. Similarly in the application of the feasibility model itself there are avenues for improvement. For example, when there was an increase in the development costs, this increase was applied equally across all periods of the construction timeline. This was because the timing of individual cost items was not readily available and to obtain and model these specifics would have significantly expanded the scope of this study. This is an acknowledged weakness of the modelling and creates a level of uncertainty worthy of further investigation. If one of the 25
  • 30. bigger development cost items was to increase significantly and be incurred in one period alone, this would certainly impact the IRR and VA. 6 RECOMMENDATIONS FOR ACTION All of the incentive and non-incentive offsets have a demonstrated impact on the project IRR and VA, only the scale and timing of the different scenarios determining which has the biggest effect. There has certainly been a lot of public discussion on what ‘the Government’, at all levels should do to improve the sustainability performances of new residential developments. What this modelling demonstrates so clearly is that both developers and multiple levels of Government have a role to play to achieve this outcome. To crystallise this potential the following is recommended: 1. Improve the communication of sustainability features to purchasers – through the production of easily understood materials with benefits quantified, improving the training of sales staff so that they are better able to communicate benefits and include them in the discussion of features and undertake benchmarking of competing product on sustainability performance so that accurate comparisons can be drawn. 2. Increase the understanding in the general population of benefits of more sustainable homes – though dissemination of information through the Developer’s internet and also through advocating investment from Government in a broad-scale, sustained public awareness programs. Both of these measures would likely divert purchasers from other competing less sustainable product delivering the necessary increase in sales rate. Of course it will be the early movers that realise the greatest benefit. 3. Use the Developer’s position within industry groups to lobby for a number of incentives in the following order of preference: o Section 94 redistribution to the project o ‘Green-door’ expedited development approvals o Sizable rebates per dwelling As part of its lobbying position, the costs of improved sustainability performance and its impact on project return will need to be clearly articulated. It will be necessary to break down 26
  • 31. and apparent belief within Australian Government that providing information will address all barriers to improved performance, without regard to the financial reality facing developers. As is evidenced by the snapshot of incentives detailed herein, other Governments have been far more proactive in providing financial incentives that would have a material impact on preserving and possibly enhancing project return. While the classic split incentive of costs being met by the developer and benefits accruing to the purchaser remains, there will be no wholesale, voluntary adoption of more sustainable residential development. 27
  • 32. APPENDIX 1 IRR Change IRR (basis IRR Change VA VA Change VA Change (%) points)" (%) ($) ($) (%) Original 29.34% 5,632,000 Green Star Costs 26.94% 4,207,823 Change to Original -240 -8.2% -1,424,177 -25.3% Initiative Modelled $2000 income tax credit $2000 income tax credit (received monthly) 27.25% 4,398,323 Change to Green Star Costs 31 1.1% 190,501 4.5% Difference from Original -209 -7.1% -1,233,677 -21.9% $2000 income tax credit (lump sum in advance) 27.29% 4,419,039 Change to Green Star Costs 35 1.3% 211,216 5.0% Difference from Original -205 -7.0% -1,212,961 -21.5% $2000 income tax credit (lump sum in arrears) 27.21% 4,378,829 Change to Green Star Costs 26 1.0% 171,007 4.1% Difference from Original -213 -7.3% -1,253,171 -22.3% Sales tax exemption for energy efficient products Sales tax exemption for energy efficient products 28.03% 4,858,865 Change to Green Star Costs 109 4.0% 651,043 15.5% Difference from Original -131 -4.5% -773,135 -13.7% 28
  • 33. Increased sales price Increased sales price 1% 27.98% 4,858,074 Change to Green Star Costs 104 3.9% 650,251 15.5% Difference from Original -136 -4.6% -773,926 -13.7% Increased sales price 2.5% 29.52% 5,833,450 Change to Green Star Costs 258 9.6% 1,625,628 38.6% Difference from Original 018 0.6% 201,450 3.6% Tax credit for 8% of allowable construction cost increases Tax credit for 8% of allowable construction cost increases (in advance) 27.09% 4,297,982 Change to Green Star Costs 15 0.6% 90,160 2.1% Difference from Original -225 -7.7% -1,334,018 -23.7% Tax credit for 8% of allowable construction cost increases (monthly) 27.07% 4,289,140 Change to Green Star Costs 13 0.5% 81,317 1.9% Difference from Original -227 -7.7% -1,342,860 -23.8% Tax credit for 8% of allowable construction cost increases (in arrears) 27.06% 4,280,819 Change to Green Star Costs 11 0.4% 72,996 1.7% Difference from Original -228 -7.8% -1,351,181 -24.0% $8600 rebate per dwelling $8600 rebate per dwelling (monthly) 28.25% 5,026,976 Change to Green Star Costs 131 4.8% 819,154 19.5% Difference from Original -109 -3.7% -605,024 -10.7% $8600 rebate per dwelling (in advance) 28.44% 5,116,052 Change to Green Star Costs 150 5.6% 908,230 21.6% Difference from Original -90 -3.1% -515,948 -9.2% $8600 rebate per dwelling (in arrears) 28.07% 4,943,151 Change to Green Star Costs 113 4.2% 735,329 17.5% Difference from Original -127 -4.3% -688,849 -12.2% 29
  • 34. Expedited Approvals Expedited Approvals 28.37% 4,770,926 Change to Green Star Costs 143 5.3% 563,103 13.4% Difference from Original -97 -3.3% -861,074 -15.3% Section 94 Rebate Section 94 construction cost offset 29.83% 5,854,979 Change to Green Star Costs 289 10.7% 1,647,156 39.1% Difference from Original 49 1.7% 222,979 4.0% Increased Sales Rate Increased Sales Rate 1% 27.63% 4,533,620 Change to Green Star Costs 69 2.6% 325,798 7.7% Difference from Original -171 -5.8% -1,098,380 -19.5% Increased Sales Rate 2% 28.14% 4,761,927 Change to Green Star Costs 120 4.4% 554,104 13.2% Difference from Original -120 -4.1% -870,073 -15.4% Reduced Selling and Marketing Costs Reduced Selling and Marketing Costs 27.25% 4,393,782 Change to Green Star Costs 31 1.1% 185,960 4.4% Difference from Original -209 -7.1% -1,238,218 -22.0% Combined - Increased Sales Rate + Lower Sell & Mkt Costs Increased Sales Rate 1% + Reduced Selling and Marketing Costs 27.95% 4,719,580 Change to Green Star Costs 101 3.7% 511,758 12.2% Difference from Original -139 -4.7% -912,420 -16.2% Increased Sales Rate 2% + Reduced Selling and Marketing Costs 28.46% 4,947,887 Change to Green Star Costs 152 5.6% 740,064 17.6% Difference from Original -88 -3.0% -684,113 -12.1% 30
  • 35. Combined - Increased Sales Rate + tax credit Increased Sales Rate 1% + $2000 tax credit in advance 27.99% 4,744,837 Change to Green Star Costs 105 3.9% 537,014 12.8% Difference from Original -135 -4.6% -887,163 -15.8% Combined - Increased Sales Rate + Expedited Approvals Increased Sales Rate 1% + Expedited Approvals 29.14% 5,096,723 Change to Green Star Costs 220 8.2% 888,901 21.1% Difference from Original -20 -0.7% -535,277 -9.5% 31
  • 36. REFERENCES 1 CIE (Centre for International Economics) 2007, Capitalising on the building sector’s potential to lessen the costs of a broad based GHG emissions cut, prepared for the ASBEC Climate Change Task Group, Canberra & Sydney. 2 AGO (Australian Greenhouse Office) 1999, Australian Residential Building Sector Greenhouse Gas Emissions 1990–2010, Canberra. 3 CIE (Centre for International Economics) 2007, pg 12. 4 CIE (Centre for International Economics) 2007, pg 19. 5 Communities and Local Government (2003), Communities and neighbourhoods, What is a sustainable community? [Online] http://www.communities.gov.uk/archived/general- content/communities/whatis/. Accessed 8 October 2009. 6 CIE (Centre for International Economics) 2008, Improving energy efficiency in the building sector: barriers and policy remedies, prepared for the Property Council of Australia, Canberra & Sydney. 7 Council of Australian Governments (COAG) (2009) National Strategy on Energy Efficiency July 2009. Canberra ACT. 8 Green Building Council of Australia (GBCA) (2009) GBCA Green Guide to Government Policy. Sydney, Australia. 9 Kakas, C. Executive Director, Residential Development Council of Australia. Pers comms via meeting Monday, 23 September 2009. 10 Database of State Incentives for Renewables & Efficiency (DSIRE) (2009) Energy-Efficient New Homes Tax Credit for Home Builders. [Online] http://www.dsireusa.org/incentives/incentive.cfm?Incentive_Code=US41F&re=0&ee=1. Accessed 22 September 2009. 11 United States Code, Title 26. Internal Revenue Code, 45L New energy efficient home credit. [Online] http://www.dsireusa.org/documents/Incentives/US41F.htm. Accessed 22 September 2009. 12 Watson II, Ralph S. Harvesting Tax Benefits of Green Building Incentives. Journal of Accountancy; Aug 2009, Vol. 208 Issue 2, p44-48, 4p 13 State of Connecticut, Department of Revenue Services (2007) SN 2007(4) 2007 Legislation Affecting the Sales Tax on Home Weatherization Products http://www.ct.gov/drs/cwp/view.asp?a=1514&q=384952 14 Maryland Energy Administration, Green Building Tax Credit Overview [Online] http://energy.maryland.gov/incentives/business/greenbuilding/documents/GBTCFAQ04-04-08.pdf. Accessed 24 September 2009. 15 DSIRE (2009) Income Tax Credit for Green Buildings (Corporate). [Online] http://www.dsireusa.org/incentives/incentive.cfm?Incentive_Code=CA154F&re=0&ee=1. Accessed 24 September 2009. 16 City of Roseville, Roseville Electric Profile [Online] http://www.roseville.ca.us/electric/about/profile.asp. Accessed 24 September 2009. 17 DSIRE (2009) Roseville Electric - Residential New Construction Rebate Program. [Online] http://www.dsireusa.org/incentives/incentive.cfm?Incentive_Code=CA154F&re=0&ee=1. Accessed 24 September 2009. 32
  • 37. 18 United States Code Service, Title 26. Internal Revenue Code, Section 136 Energy conservation subsidies provided by public utilities. [Online] http://www.dsireusa.org/documents/Incentives/US31F.htm Accessed 22 September 2009. 19 Santa Monica Municipal Code Chapter 8.108 Green Building, Landscape Design, Resource Conservation and Construction and Demolition Waste Management Standards http://www.qualitycodepublishing.com/codes/santamonica/view.php?topic=8-8_108&showAll=1. Accessed 21 September 2009. 20 Green Building Council of Australia (GBCA) (2009) Green Star - Multi Unit Residential v1. [Online] http://www.gbca.org.au/green-star/rating-tools/green-star-multi-unit-residential-v1/1930.htm. Accessed 26 September 2009. 21 (GBCA) (2009) What is Green Star? [Online] http://www.gbca.org.au/green-star/green-star- overview/. Accessed 26 September 2009. 22 (GBCA) (2009) Green Star rating calculation [Online] http://www.gbca.org.au/green-star/what-is- green-star/green-star-rating-calculation/1542.htm. Accessed 26 September 2009. 23 Madew, R. Green Building Council of Australia, Chief Executive. Pers comms via meeting Thursday, 15 October 2009. 24 Developer. National Technical Director, Design. Pers comms, numerous. 25 Developer. National Technical Director, Design. Pers comms, numerous. 26 Developer. National Technical Director, Design. Pers comms, numerous. 27 Developer. Estimating Manager, Construction. Pers comms, numerous. 28 Rider Levett Bucknall (2008) Riders Digest – Sydney, Canberra, Newcastle and Western Sydney 2008. Rider Levett Bucknall, Seaford, Victoria. 29 Developer, CEO, Pers comms 20 November 2009. 30 Developer. Marketing & Customer Relations Manager, Victoria and CEO Development Australia, Pers comms numerous. 33