1. IS 372-1001 Fall2016 Exam 1 CodyVito
The Success Rate of Pick-Up Lines
Executive Summary
This study seeks to comprehend how men have a hard time understanding how women respond
to different pickup lines, specifically the effects that funniness and sexual content have. Chat-Up
Lines data1 were analyzed in an effort to answer the Research Question: Does the funniness and
sexual content of a pickup line determine its success? Supporting both Hypothesis 1 and 2,
multiple regression results show a positive relationship between the funniness and sexual content
of a pickup line used by men and its success rate with women. A conclusion discussing the
impacts of these results is provided.
Research Question
Does the funniness and sexual content of a pickup line determine its success?
Theory
One should never underestimate the power of humor. According to a study from Men’s Health,
when men and women were shown 40 situations in which a man tried to start a conversation with
a woman, women gave higher ratings to humorous approaches than men thought they would.
Specifically, they state that using the right kind of humor can be a great conversation starter.
Susan Rabin, director of schoolofflirting.com and author of 101 Ways to Flirt, added that “most
sexual pickup lines don’t work because they indicate that you’re only after one thing – and that’s
not what women are looking for”. According to Lisa Daily, a dating expert and author of Stop
Getting Dumped!, sexually explicit pickup lines have the opposite effect on most women and
repel them.2
Based on this evidence, the following hypotheses are proposed:
Hypotheses
1. A pickup line with higher sexual content decreases the chances of success.
2. A pickup line that lacks comedy increases the chances of rejection.
Variables
Variables were measured as follows:
Funniness of Chat-Up Line was measured between 0 (not funny) and 10 (hilarious).
Sexual Content of Chat-Up Line was measured between 0 (low sexual content) and 10 (high
sexual content).
Success of Chat-Up Line was measured using a 0 to 2 scale and anchored by the following: 0 =
“No Response/Walk Off”, 1 = “Get Phone Number”, and 2 = “Go Home with Person”.
1 Padgett, R. J. (n.d.). SPSS Data Sets – Butler.edu. Retrieved October 21, 2016, from
https://rpadgett.butler.edu/ps310/classdata.php
2
Risher, B. (2010, October 5). Dating Tips: The Art of the Pick-Up Line | Men's Health. Retrieved October 21,
2016, from http://www.menshealth.com/sex-women/dating-tips-the-art-of-the-pickup-line
2. IS 372-1001 Fall2016 Exam 1 CodyVito
Graphs
The following table of contents depicts the graphical and statistical data necessary for the
Funniness and Sexual Content of Chat-Up Lines:
Figure 1.1 Tests of Normality for both IV (Independent Variables)
Figure 1.2 Normal Distribution Graphs for Funniness of Chat-Up Line
Figure 1.3 Normal Distribution Graphs for Sexual Content of Chat-Up Line
Figure 2.1 Multiple Regression for both IV (Independent Variables)
Figure 3.1 Linear Graphical Results of the Success Rate based on the Funniness of Chat-Up
Line
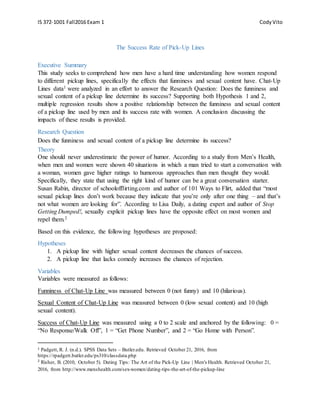
Figure 3.2 Linear Graphical Results of the Success Rate based on the Sexual Content of
Chat-Up Line
Figure 1.1
Figure 1.2
6. IS 372-1001 Fall2016 Exam 1 CodyVito
Figure 3.2
Analysis
The dataset used in this report, Chat-Up Lines.sav, was taken from a website operated by
Robert J. Padgett, Ph. D. of Butler University. An article of how the data was collected and its
evidence were not found at the location of the dataset; however, the top rated article when doing
my research seemed to have matched almost exactly with the dataset I chose which was
convenient.
The first step when analyzing data is to graph it; tests of normality and histograms of both IV in
relation to the DV displayed approximations of normal distribution. Because the predicted
relationship between the funniness and sexual content of pickup lines used by men with its
success rate on women was expected to be somewhat positive, multiple regression was used to
analyze the data.
Results
The tests of normality (see Figure 1.1) of both IVs as well as the histograms of the relationships
between them and the DV (see Figures 1.2 and 1.3) depict an approximate normal distribution.
Upon running multiple regression (see Figure 2.1), the first aspect that is noticeable is the
extremely high Sig. F Change. The first variable, Funniness of Chat-Up Line, has a variance of
3.4% (R2 = .034). The second variable, Sexual Content of Chat-Up Line, has an additional
variance of 0.3% (R2 change = .003) which explains a total variance of 3.7% for both variables.
This means that there is 96.3% variance left unexplained due to additional variables such as
7. IS 372-1001 Fall2016 Exam 1 CodyVito
physical appearance, clothing, smell, venue, initial approach, sexual orientation, mood of the
woman being approached, and others. The significant F change of the variable, Funny, held at
.000 which is highly significant. This means that the Funniness of a Chat-Up Line helps improve
my hypotheses greatly. The significant F change of the variable, Sex, held at .060 which is still
significant. This means that the Sexual Content of a Chat-Up Line helps improve my hypotheses
but not as much as Funny does. Figure 3.1 and 3.2 graphically depicts the results of this dataset
to produce a positive relationship between funniness and sexual content of pickup lines used by
men and its success with women.
Conclusion
Based on information gathered from several of sources including Men’s Health, predictions were
that funniness and sexual content of pickup lines are positively related to its success rate.
Although the hypotheses were supported, the effect size was small. Thus any conclusions from
these results must be made with caution. Future research should investigate these relationships
further.