![Logs Example: LogMessage
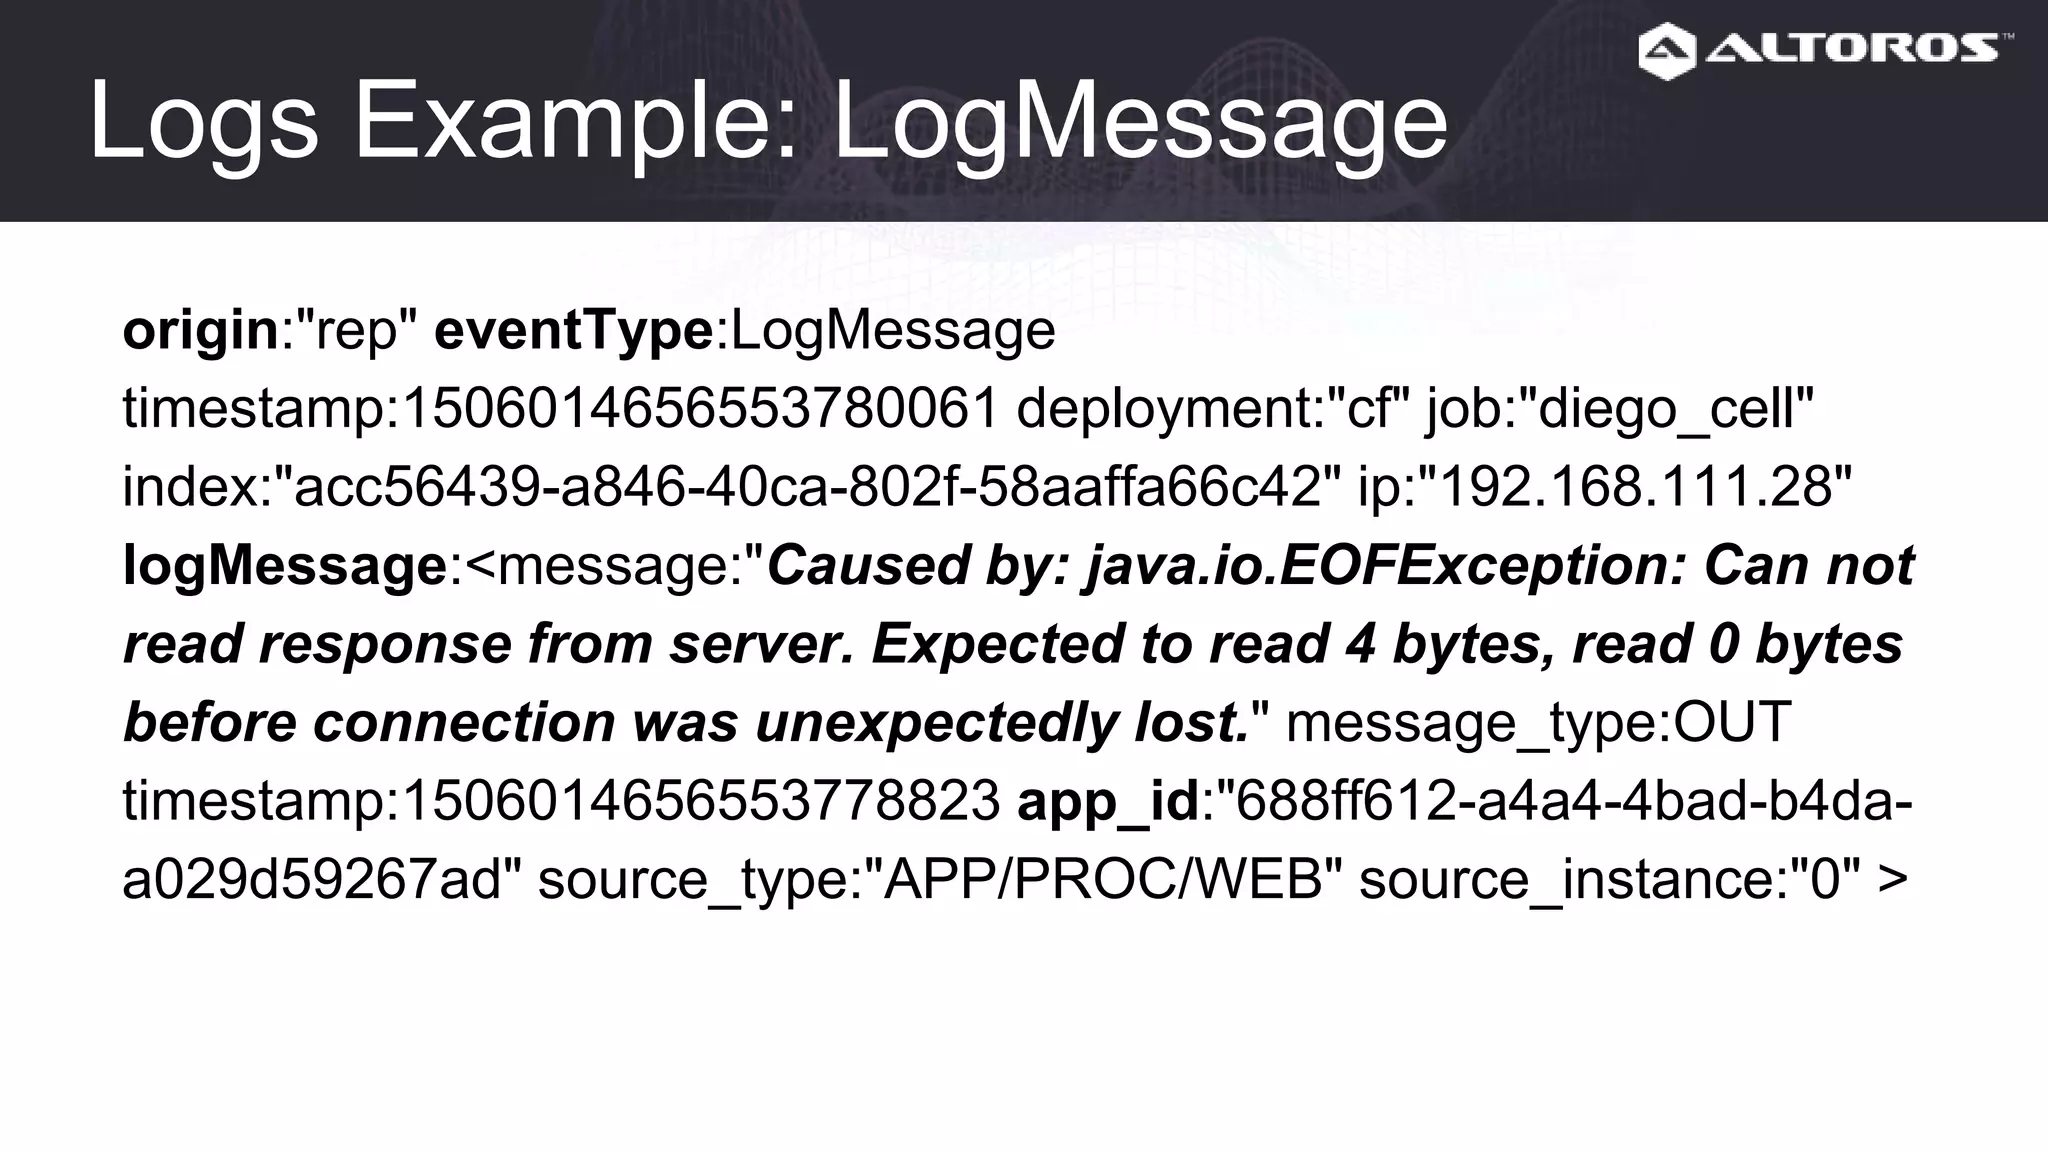
origin:"gorouter" eventType:LogMessage
timestamp:1506013802423591256 deployment:"cf" job:"router"
index:"96a3dc0c-1f24-47fc-af5b-51b848214627" ip:"192.168.111.30"
logMessage:<message:"dora.demo.altoros.com - [2017-09-
21T17:10:02.416+0000] "GET / HTTP/1.1" 200 0 13 "-" "Mozilla/5.0
(X11; Ubuntu; Linux x86_64; rv:47.0) Gecko/20100101 Firefox/47.0" ...
app_id:"deb57035-9763-448c-9cd4-99312078b6e6" ...>](https://image.slidesharecdn.com/cloudfoundrymonitoringhow-tocollectingmetricsandlogs-170929112653/75/Cloud-Foundry-Monitoring-How-To-Collecting-Metrics-and-Logs-10-2048.jpg)
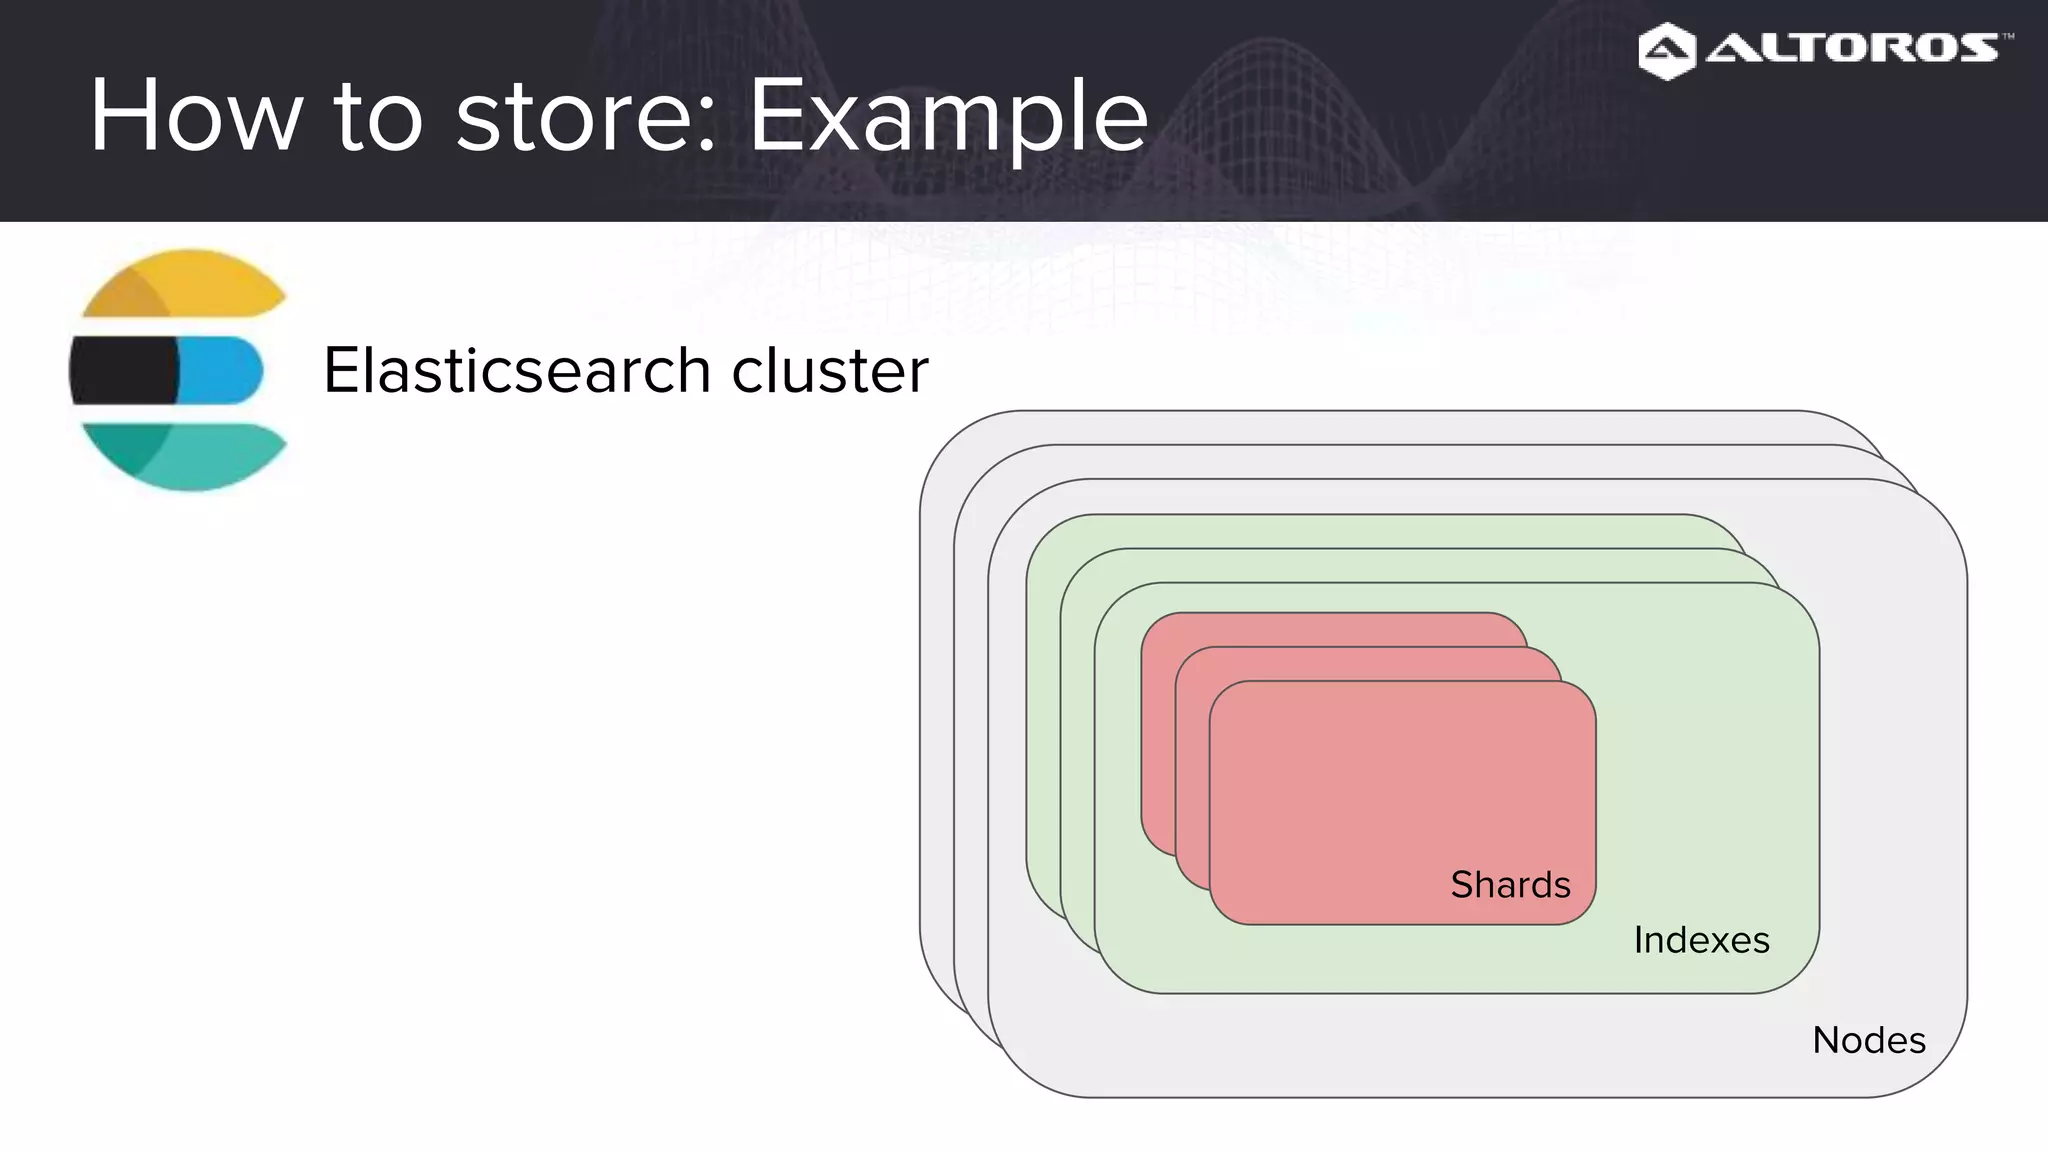
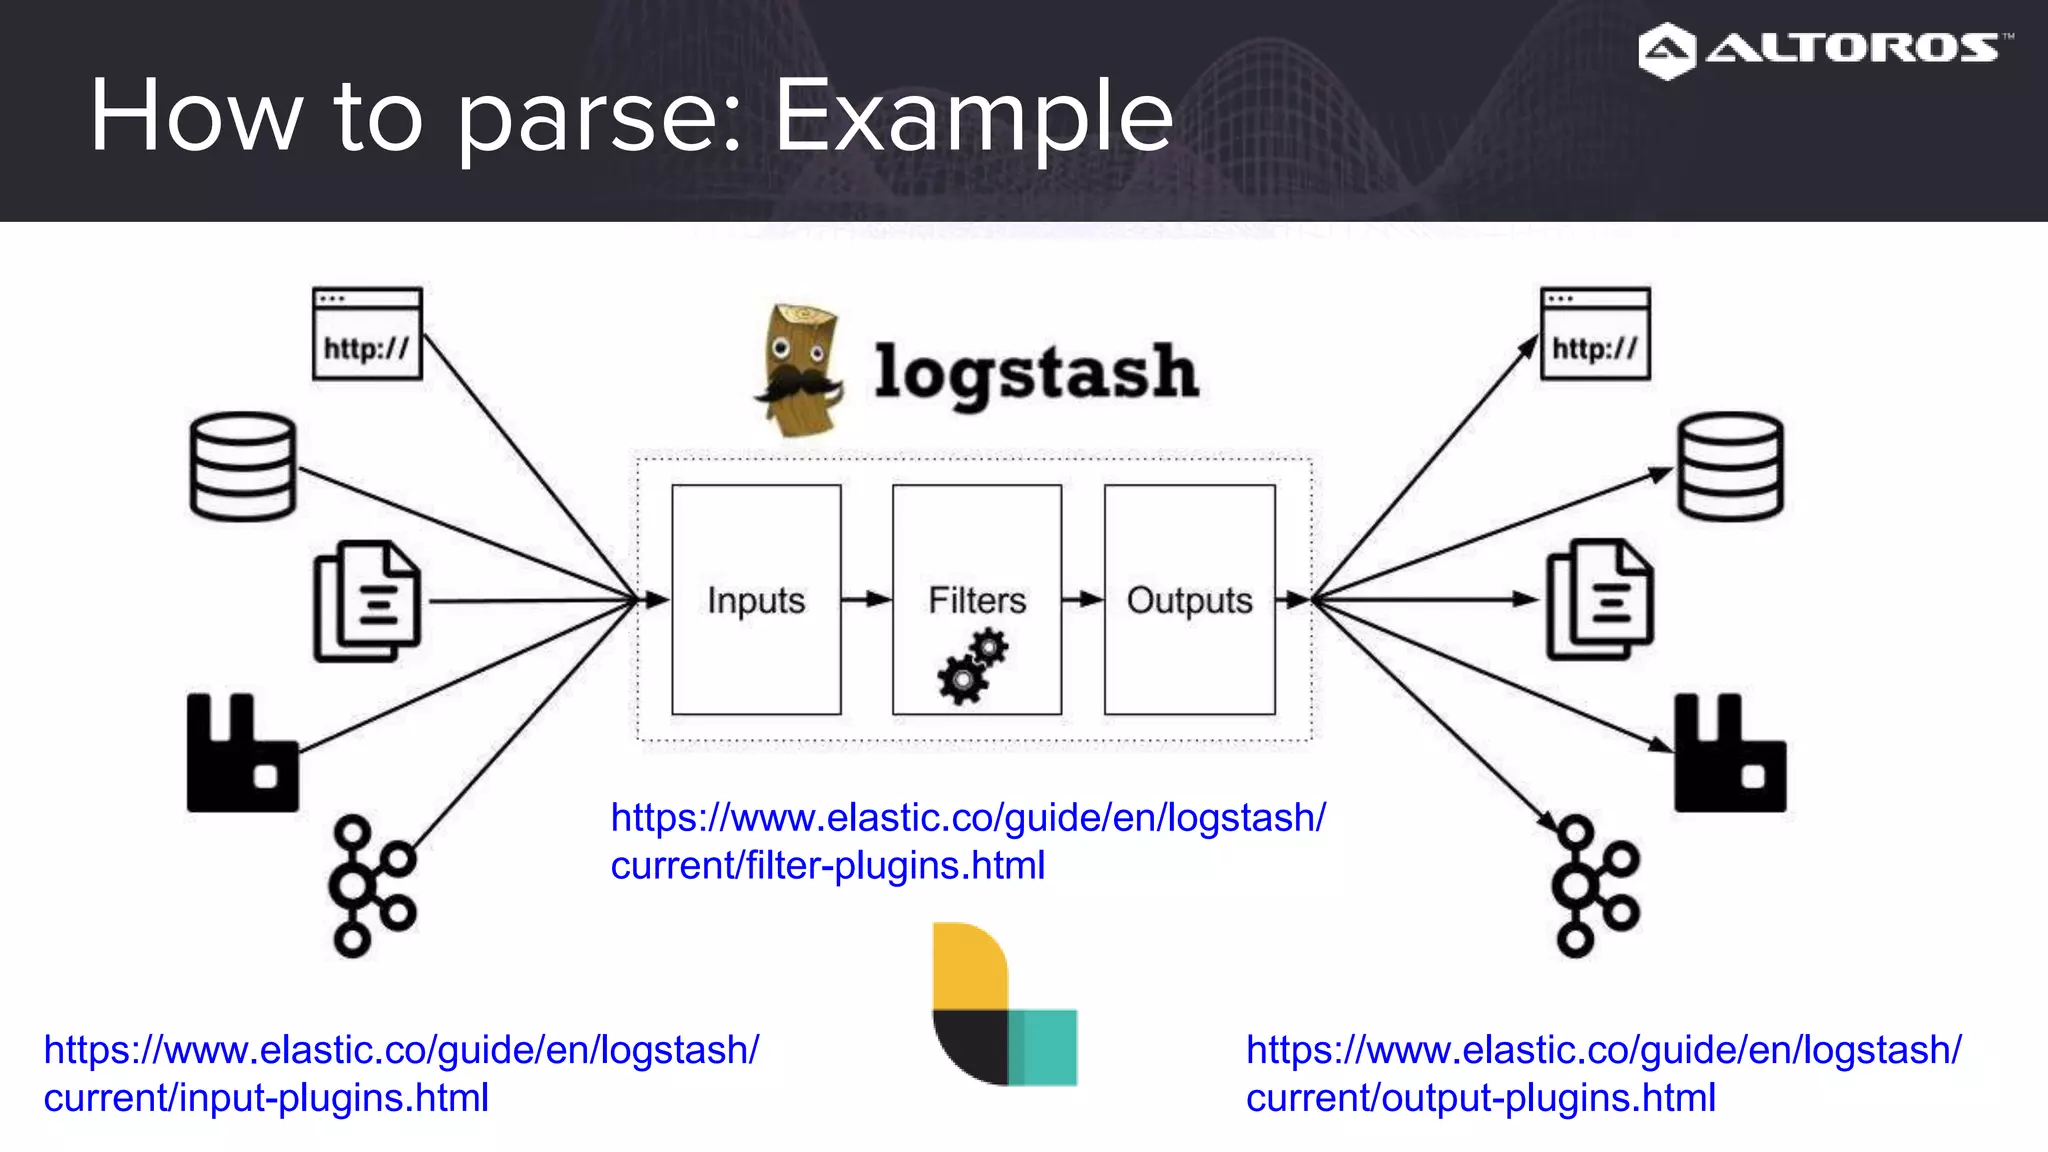
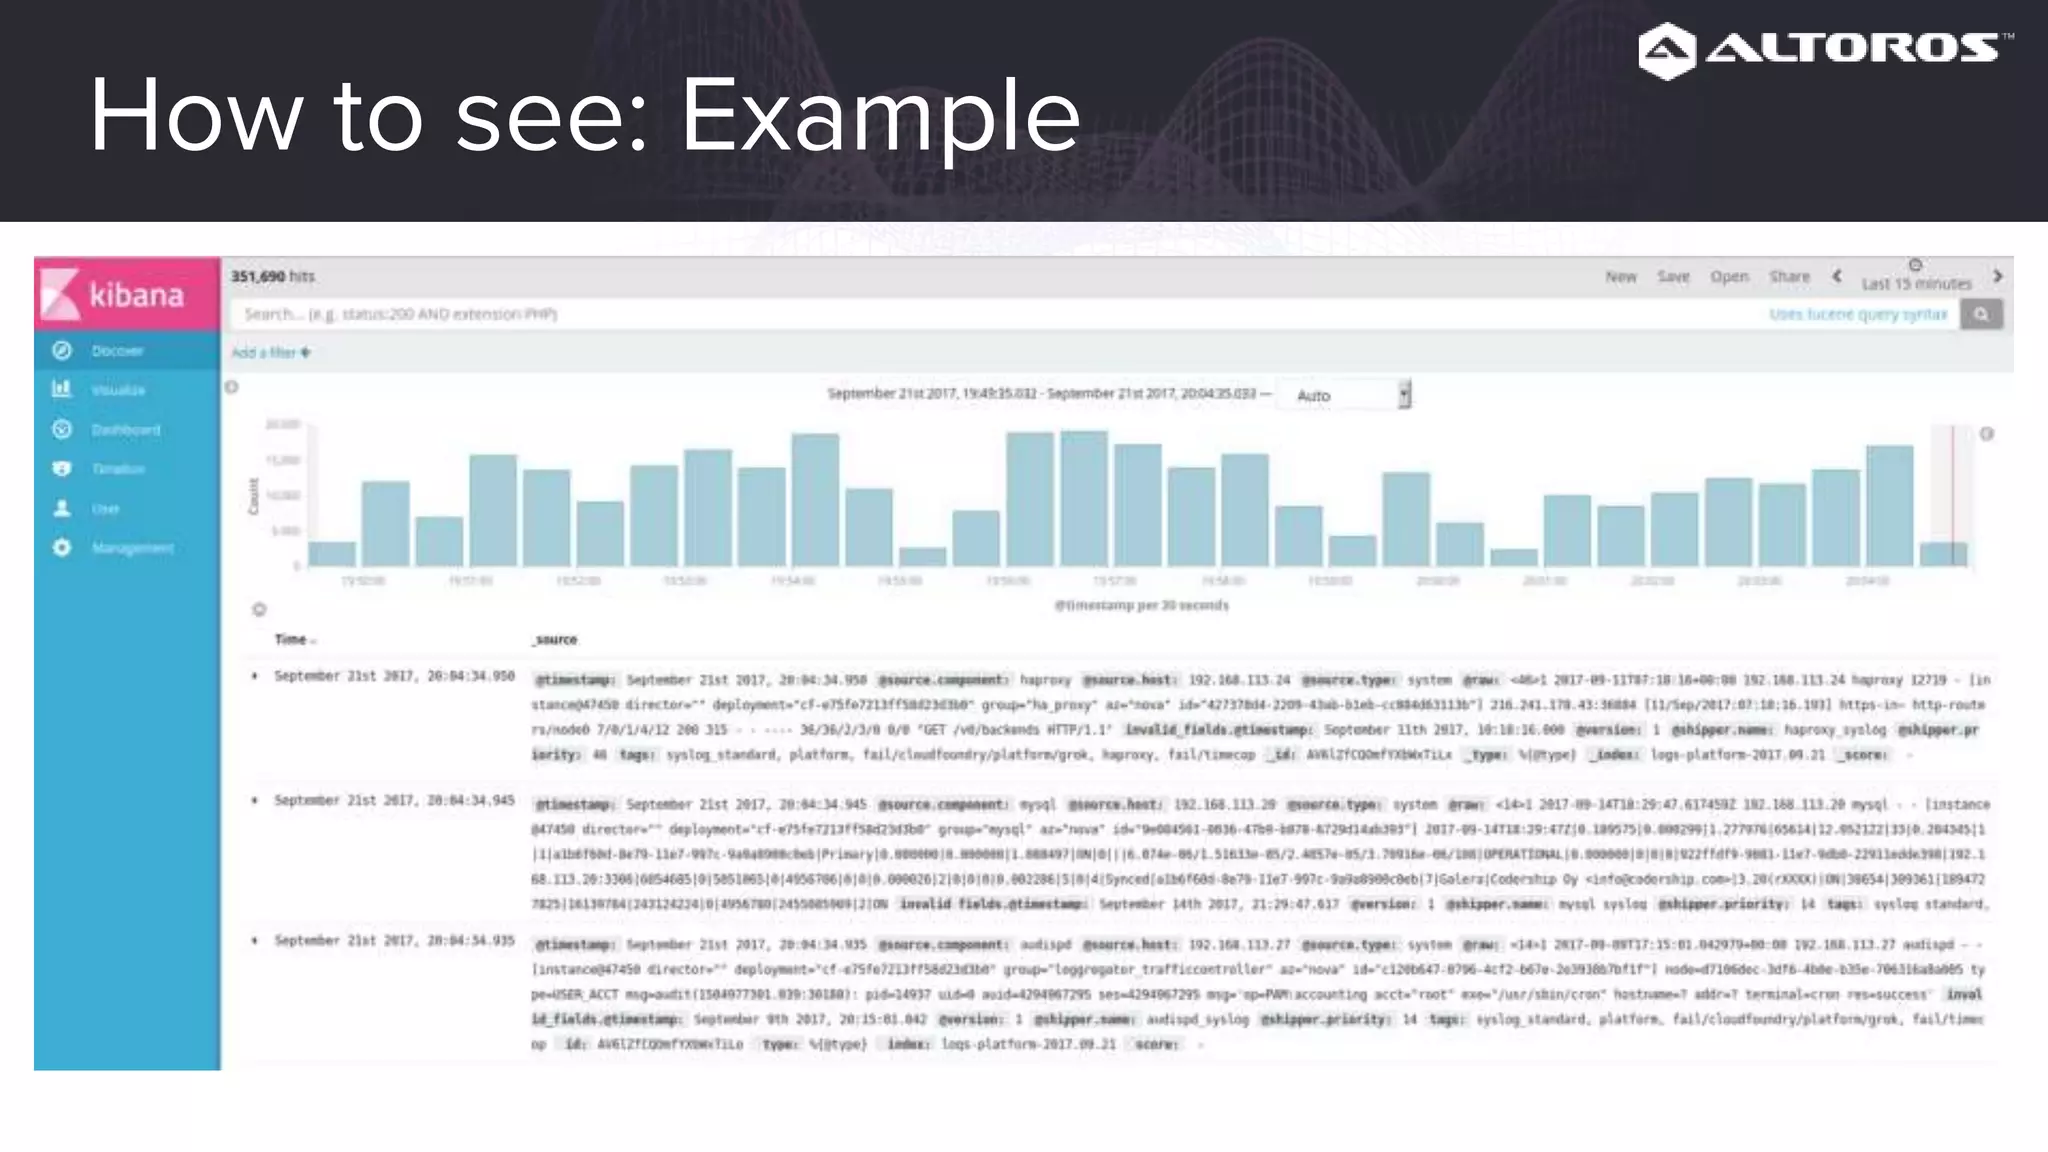
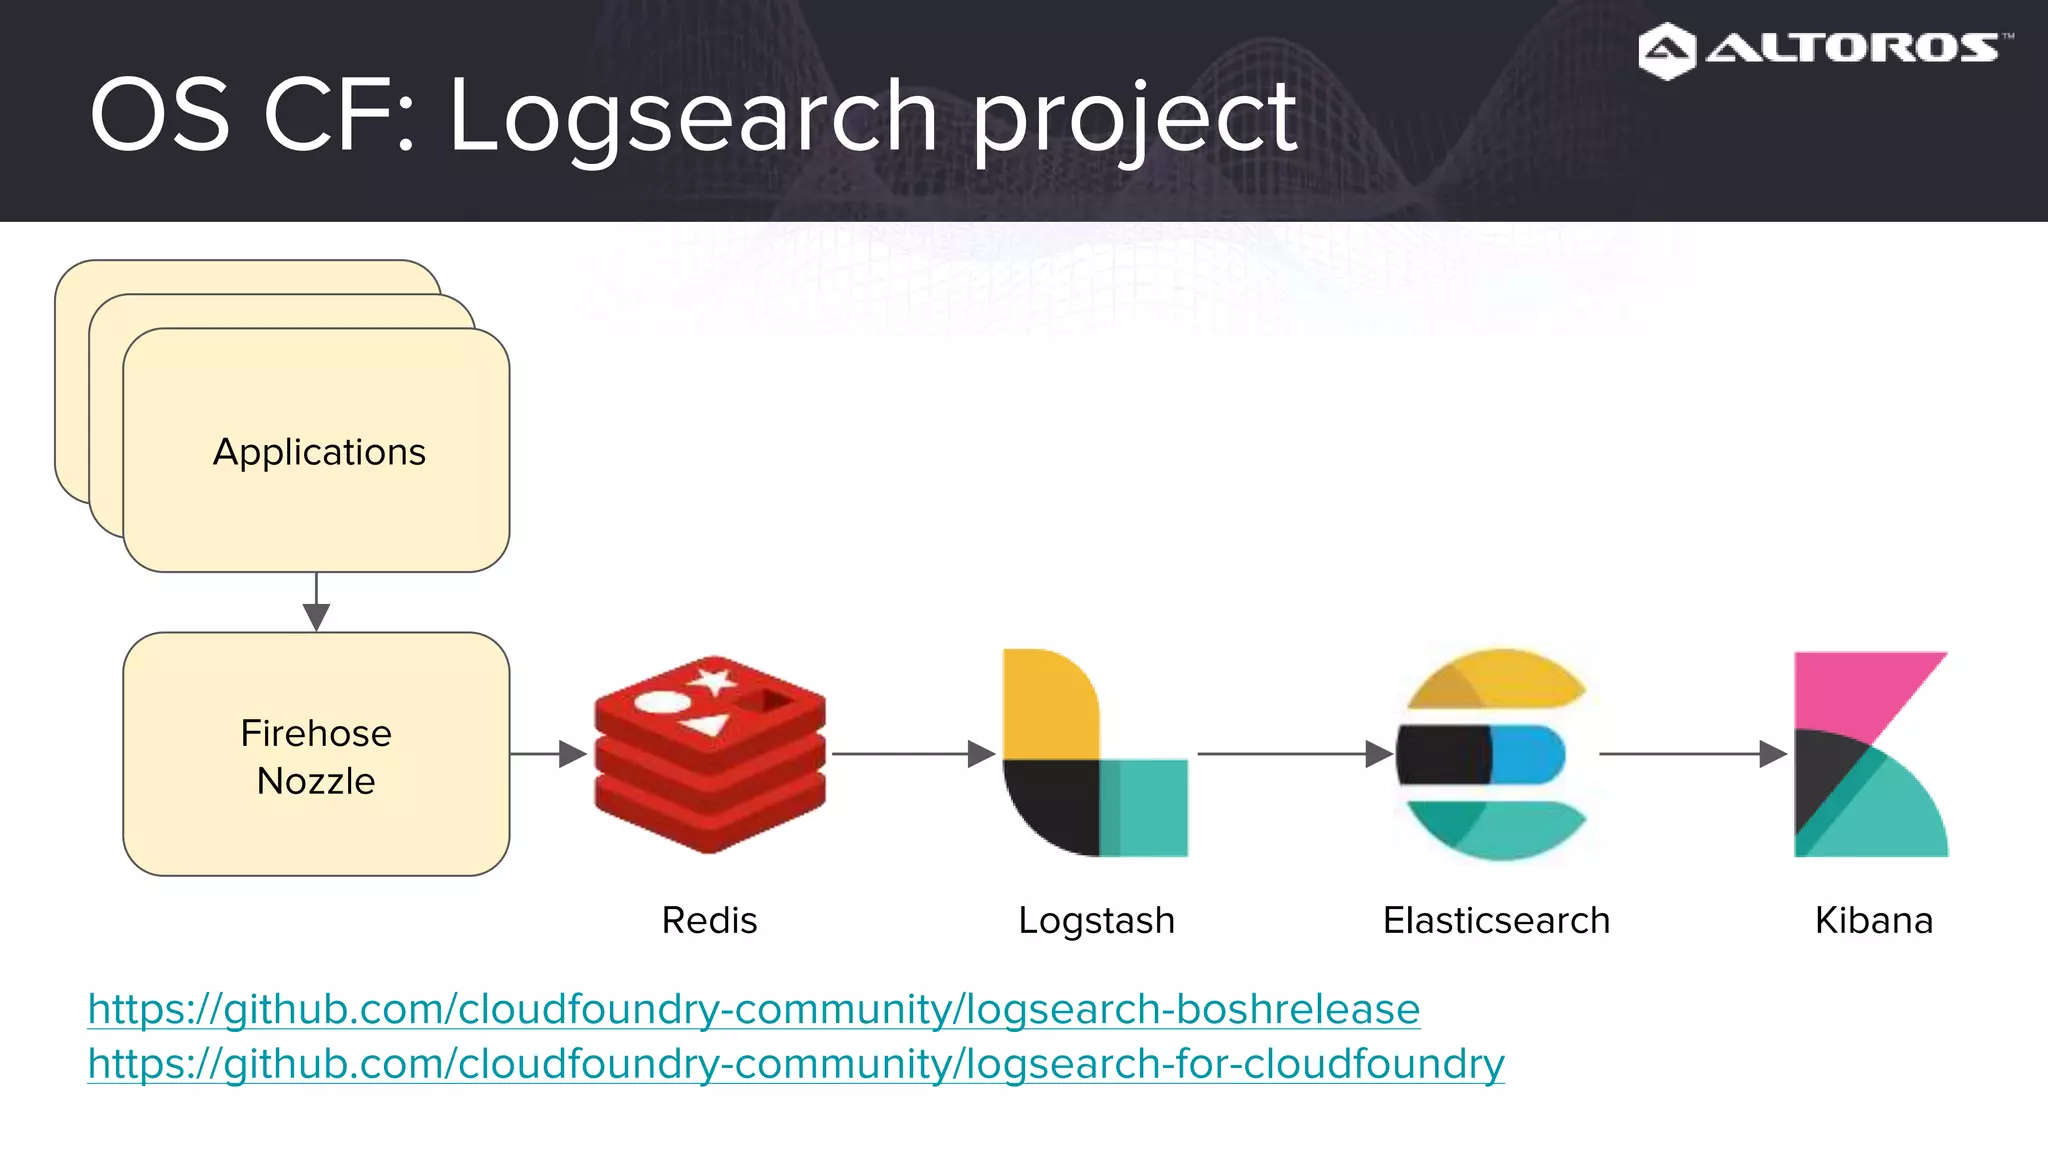
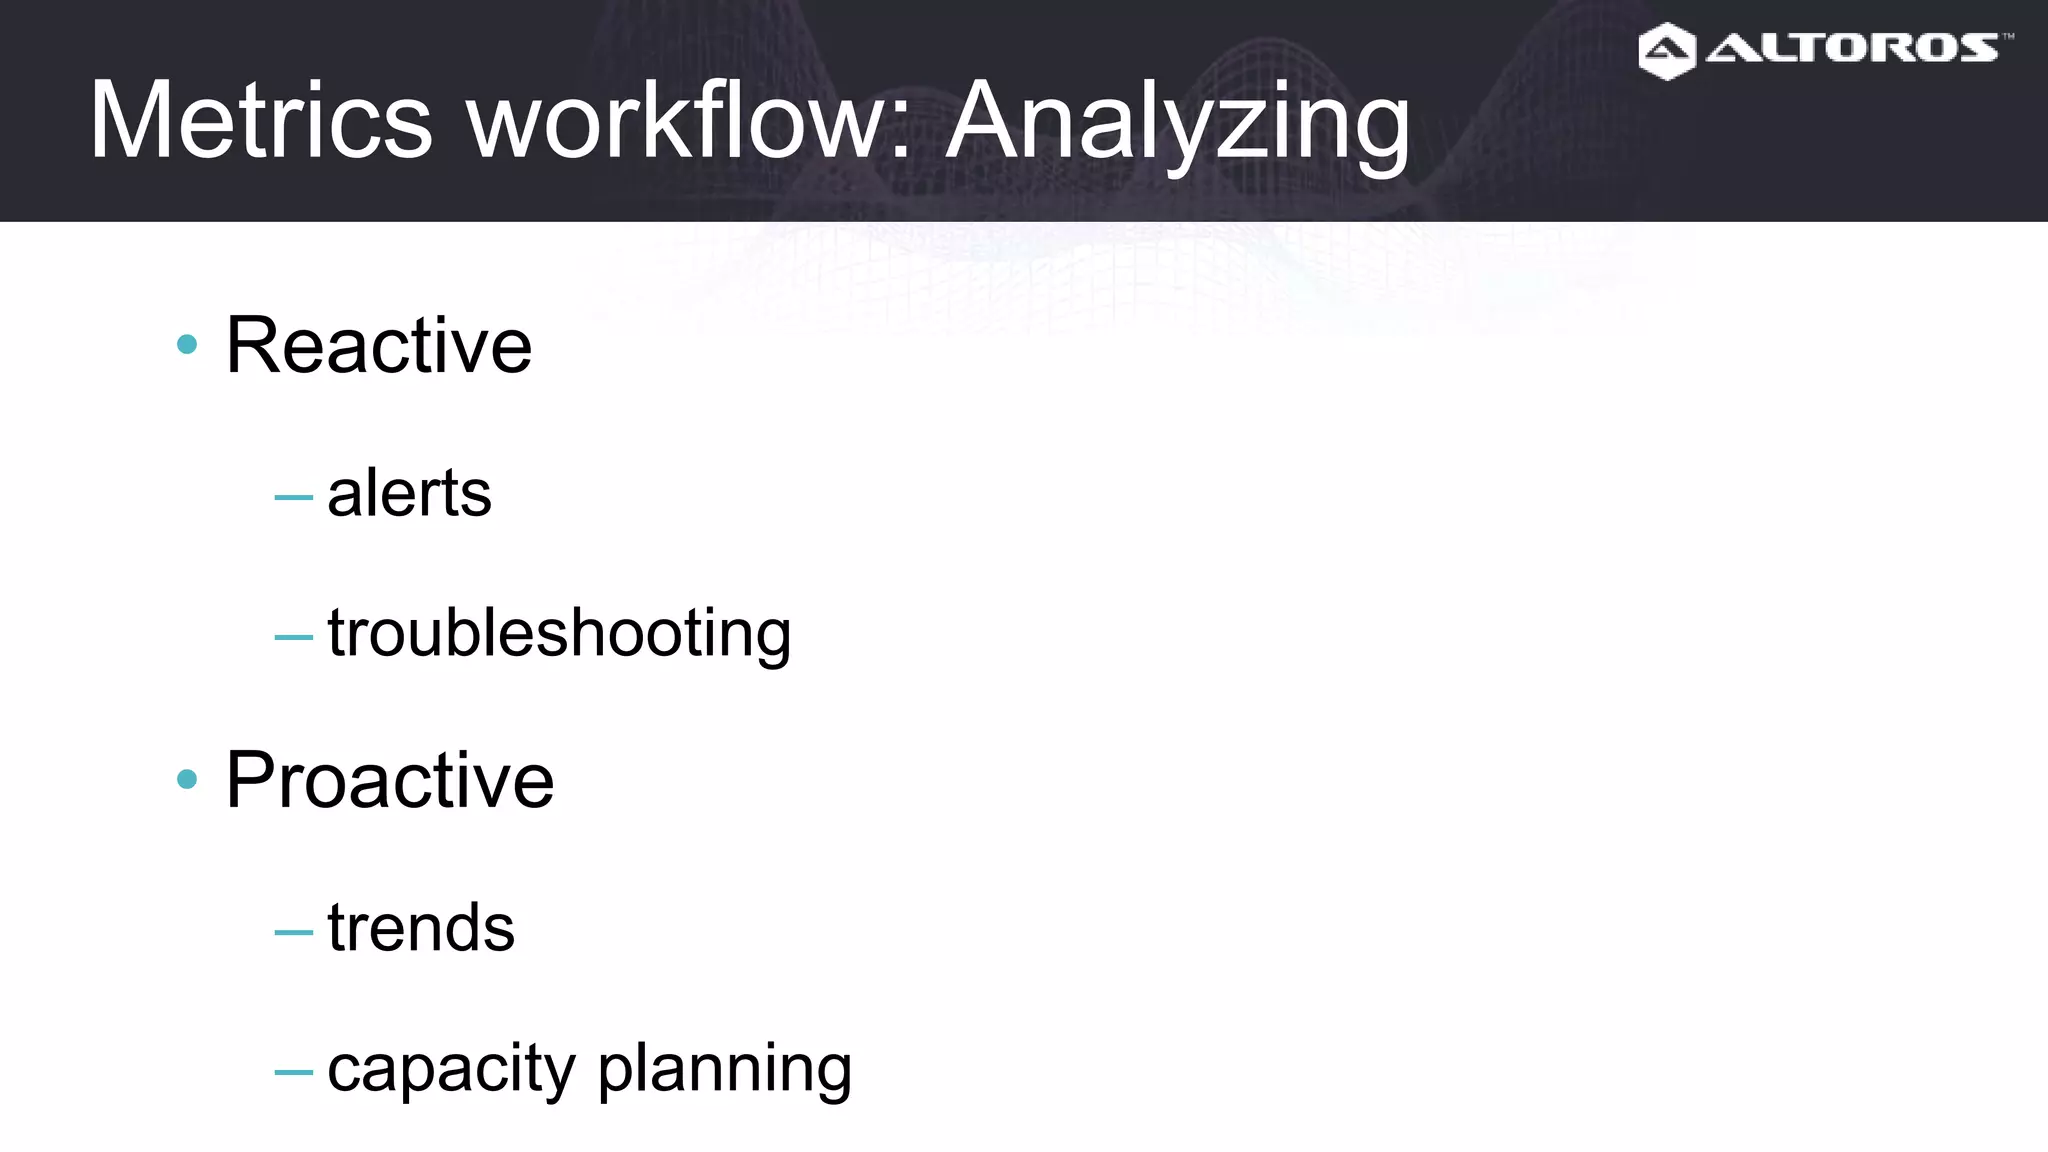
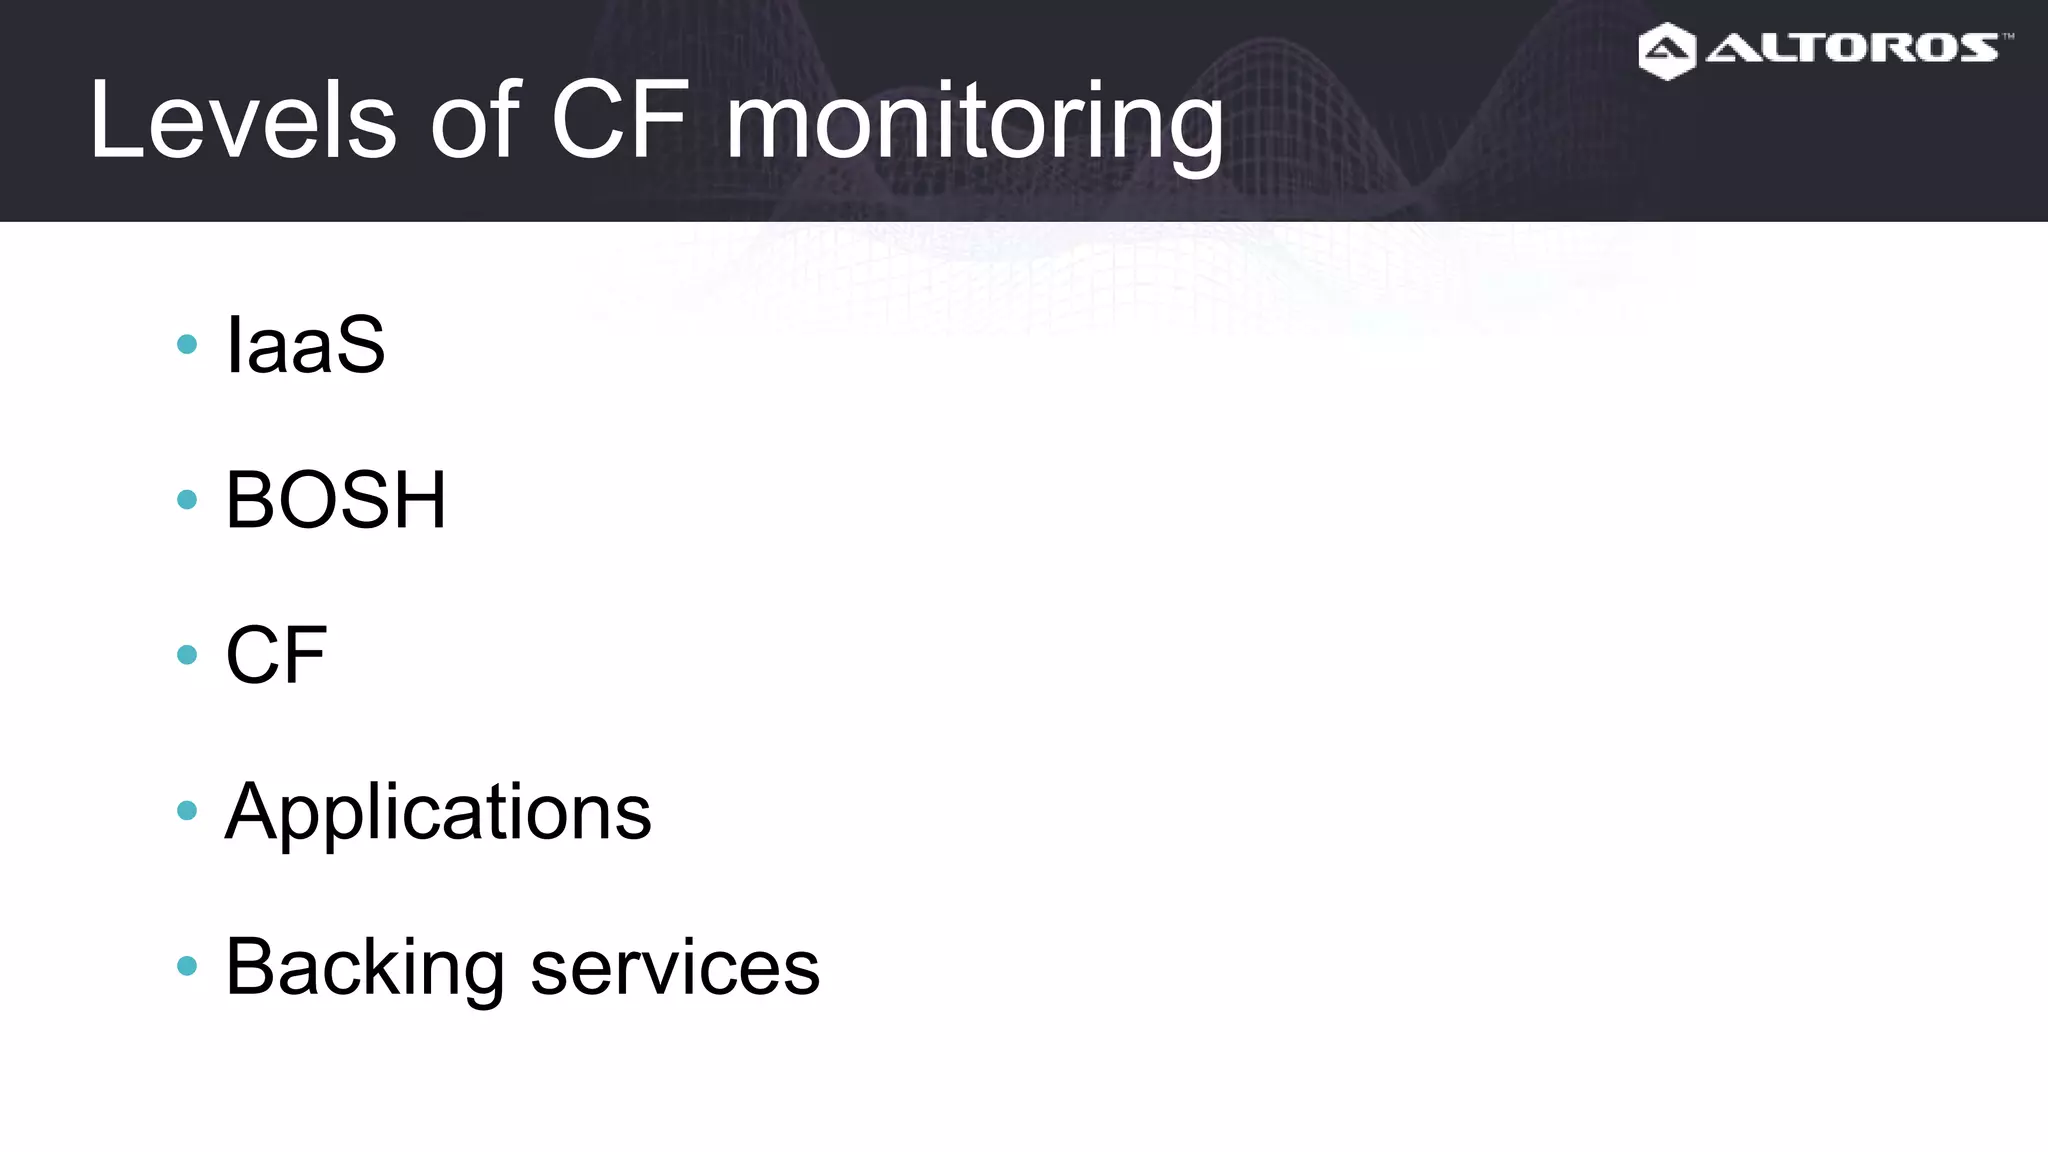
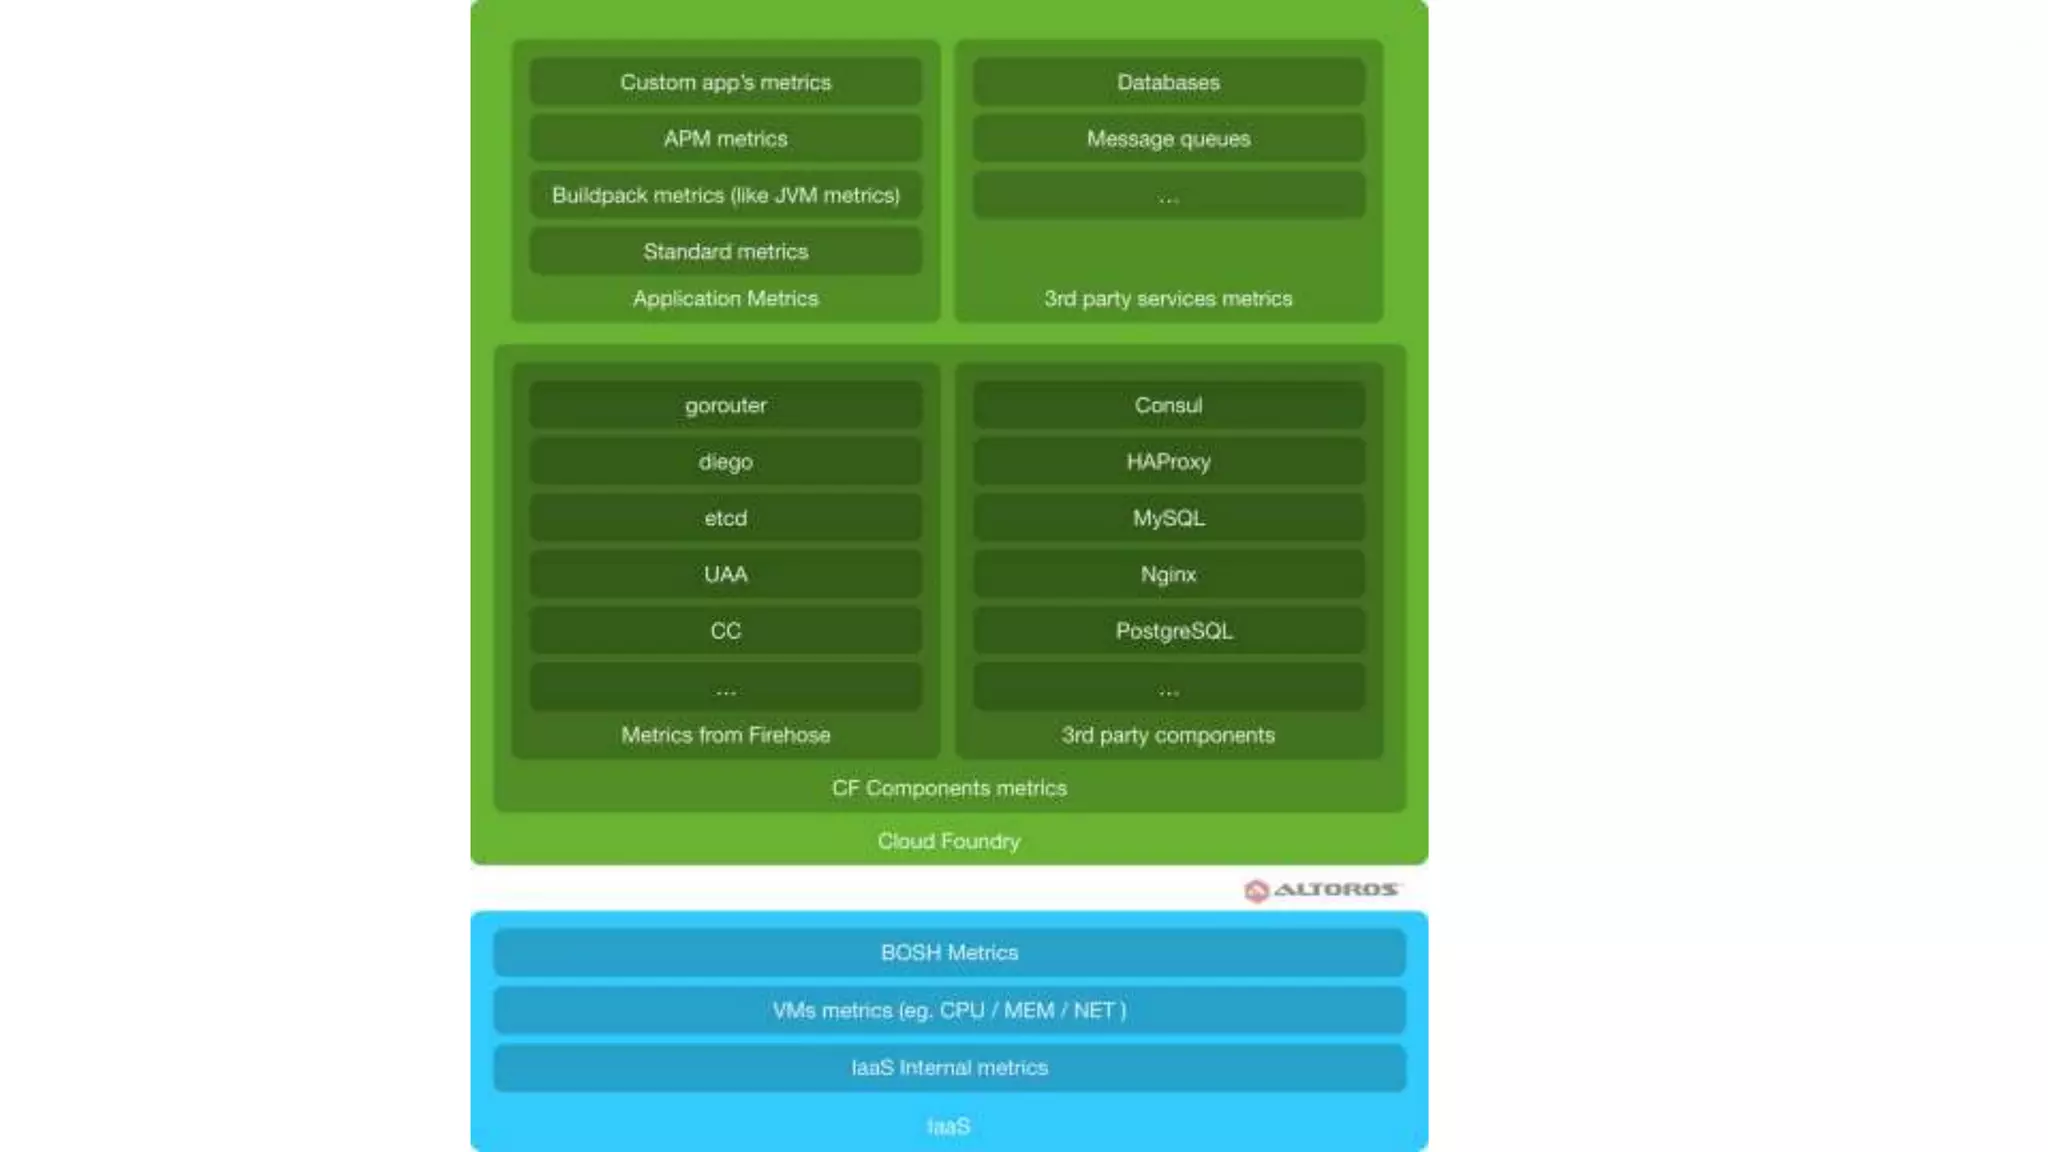
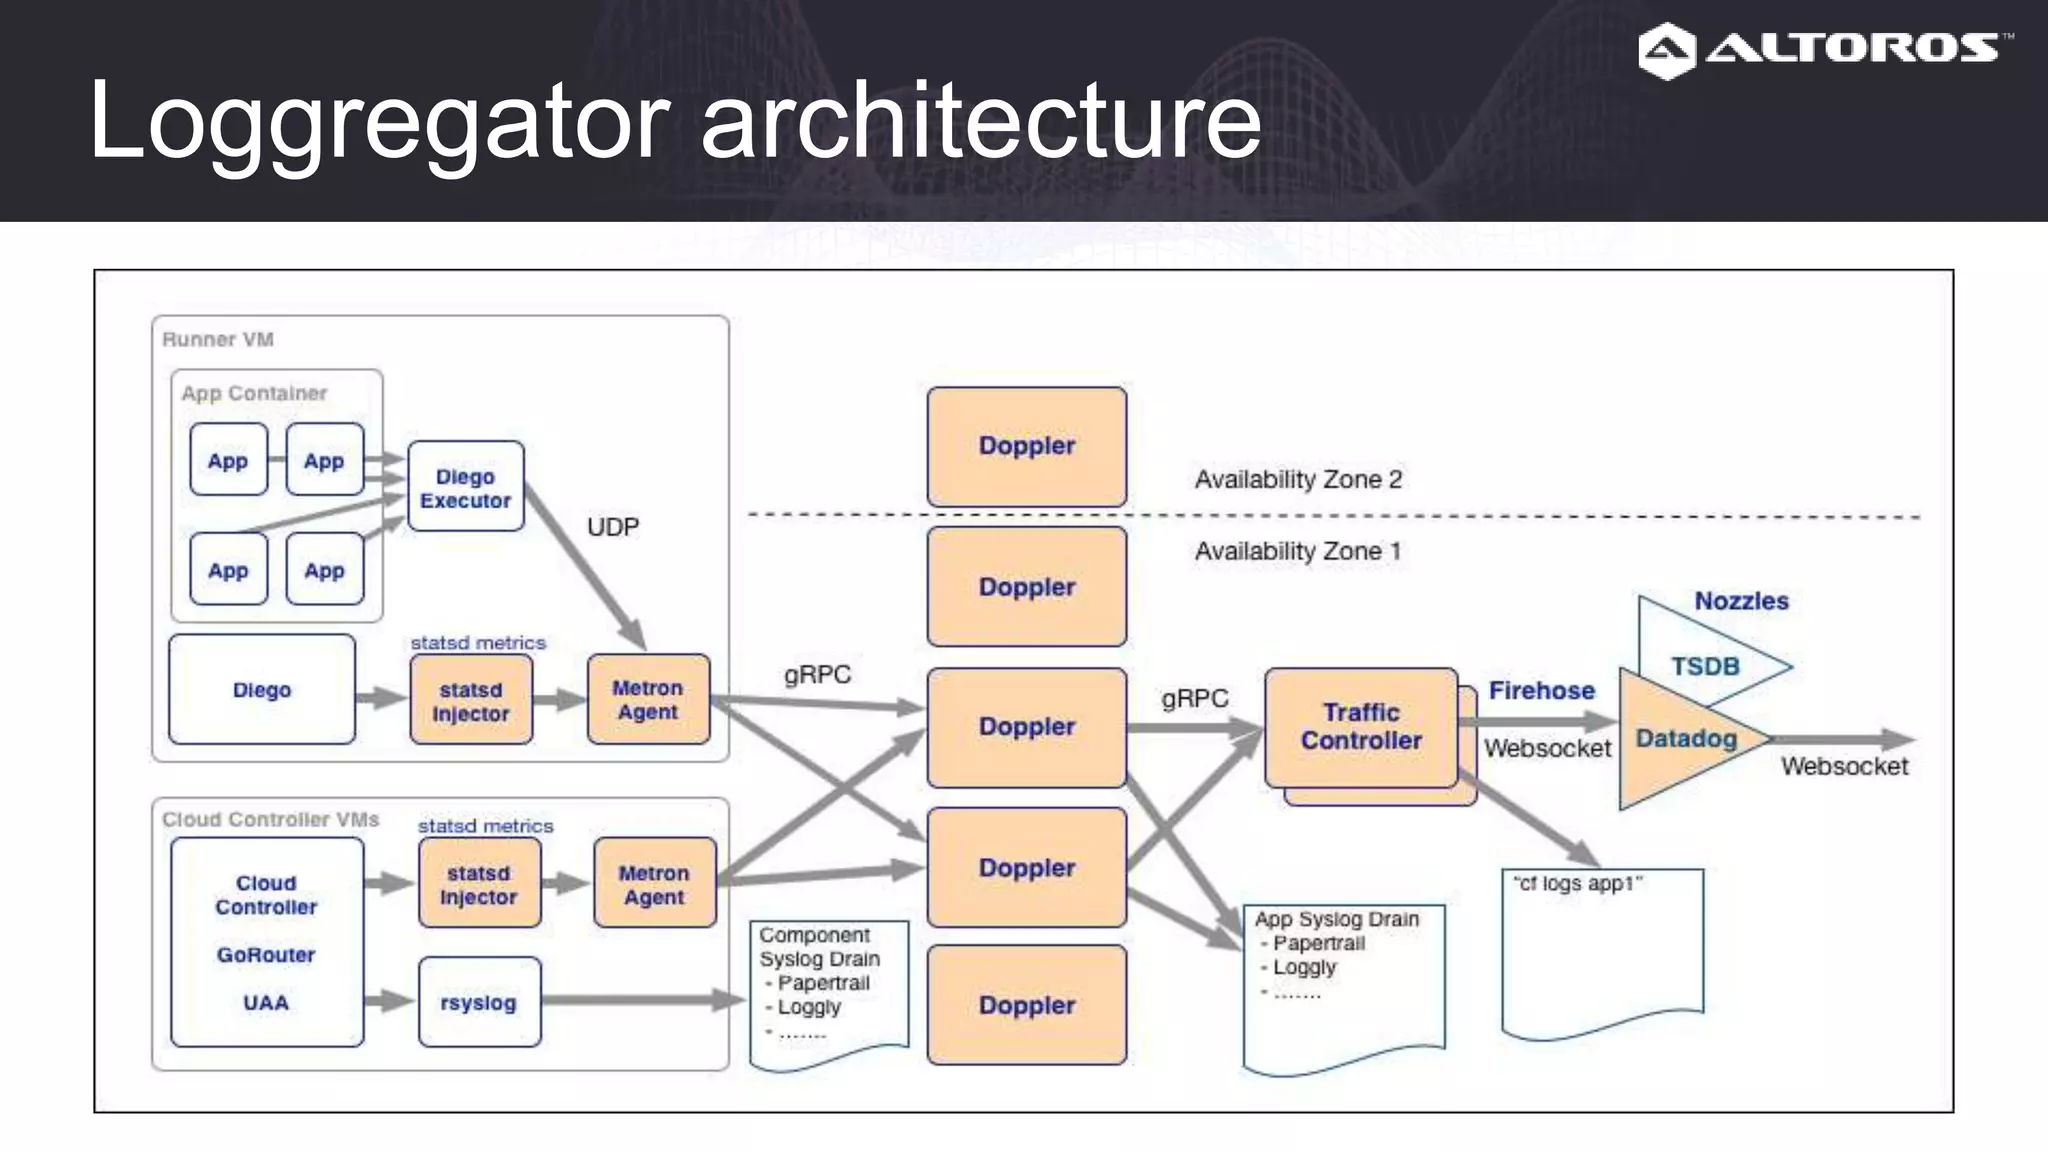
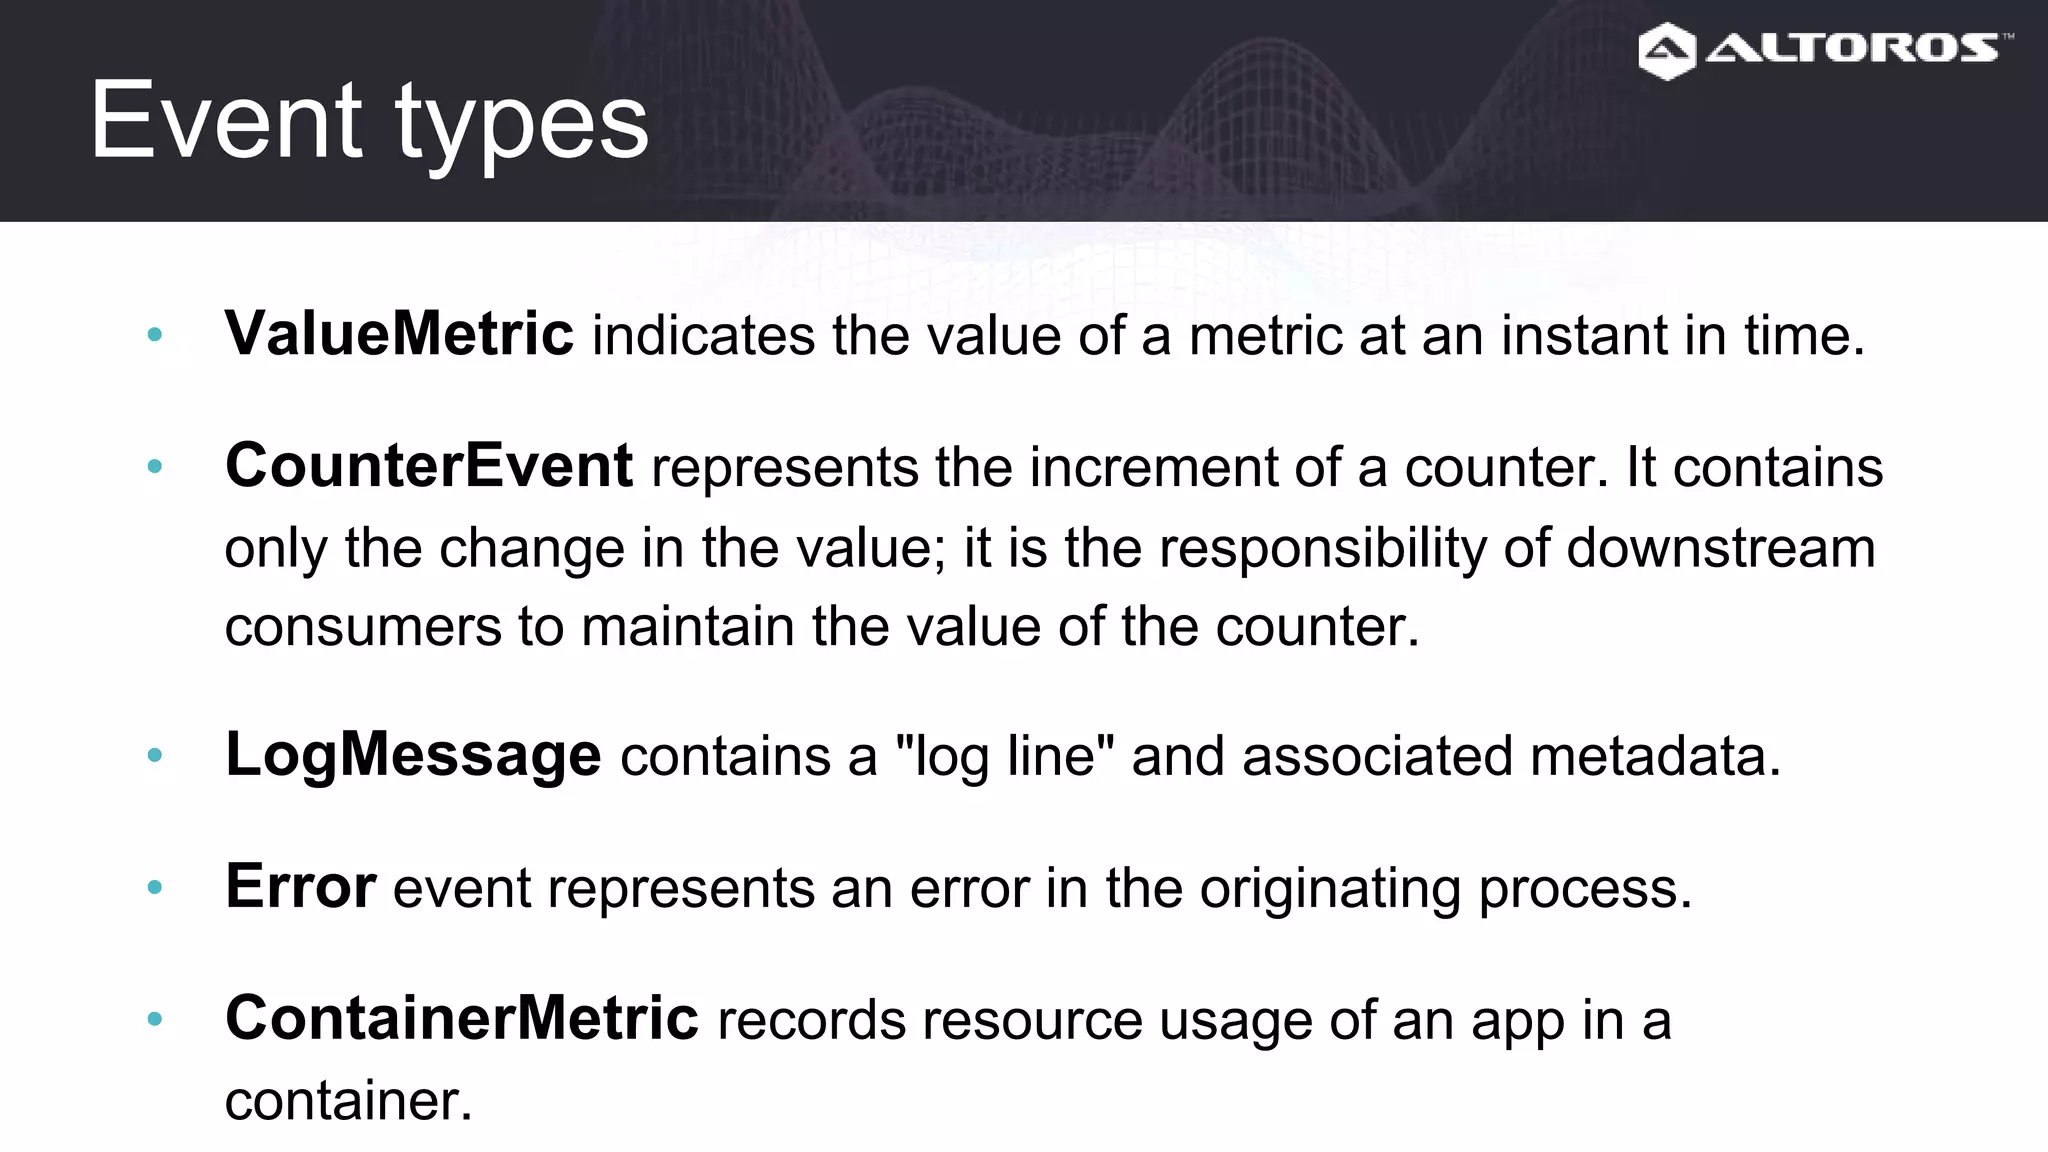
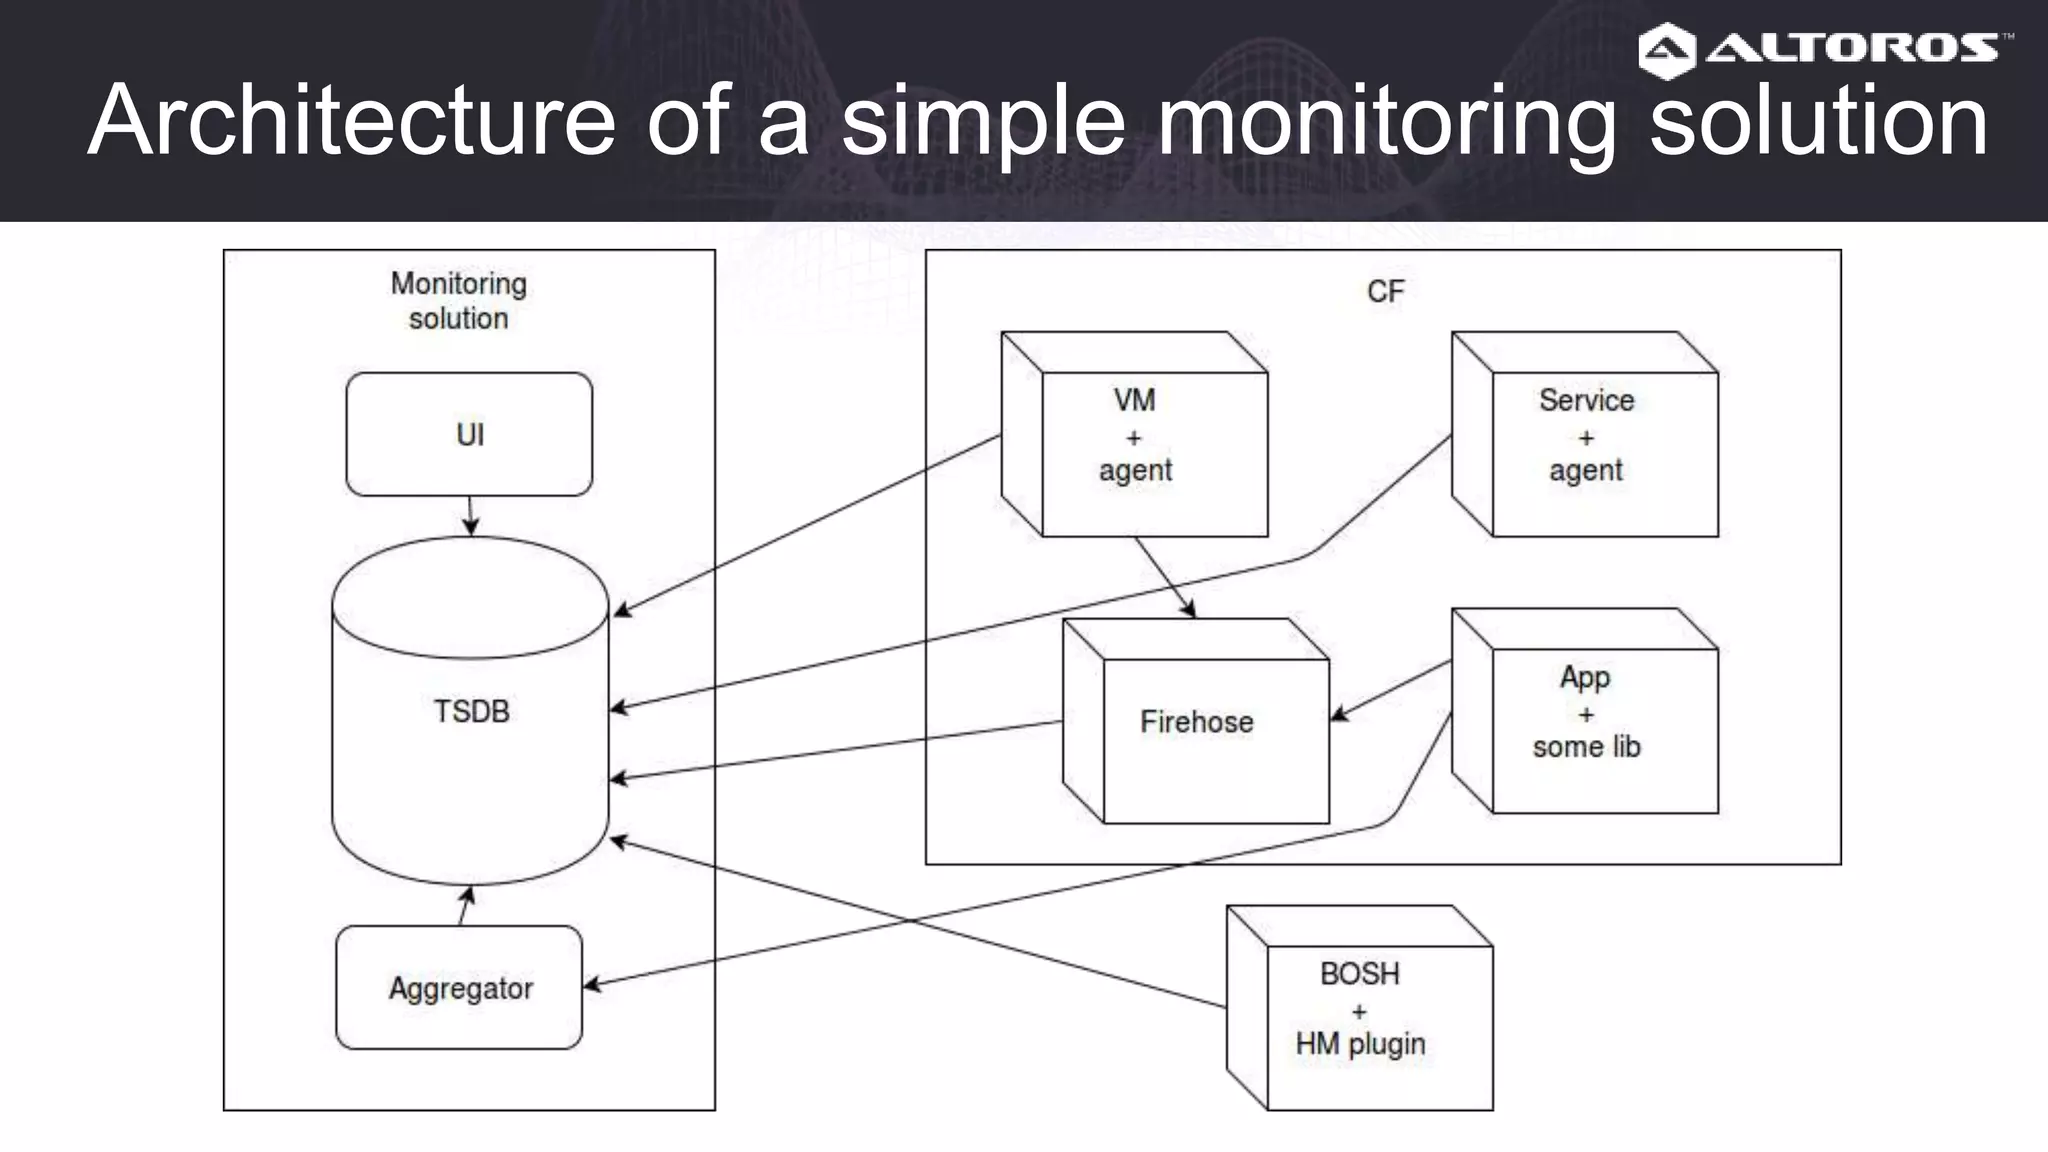

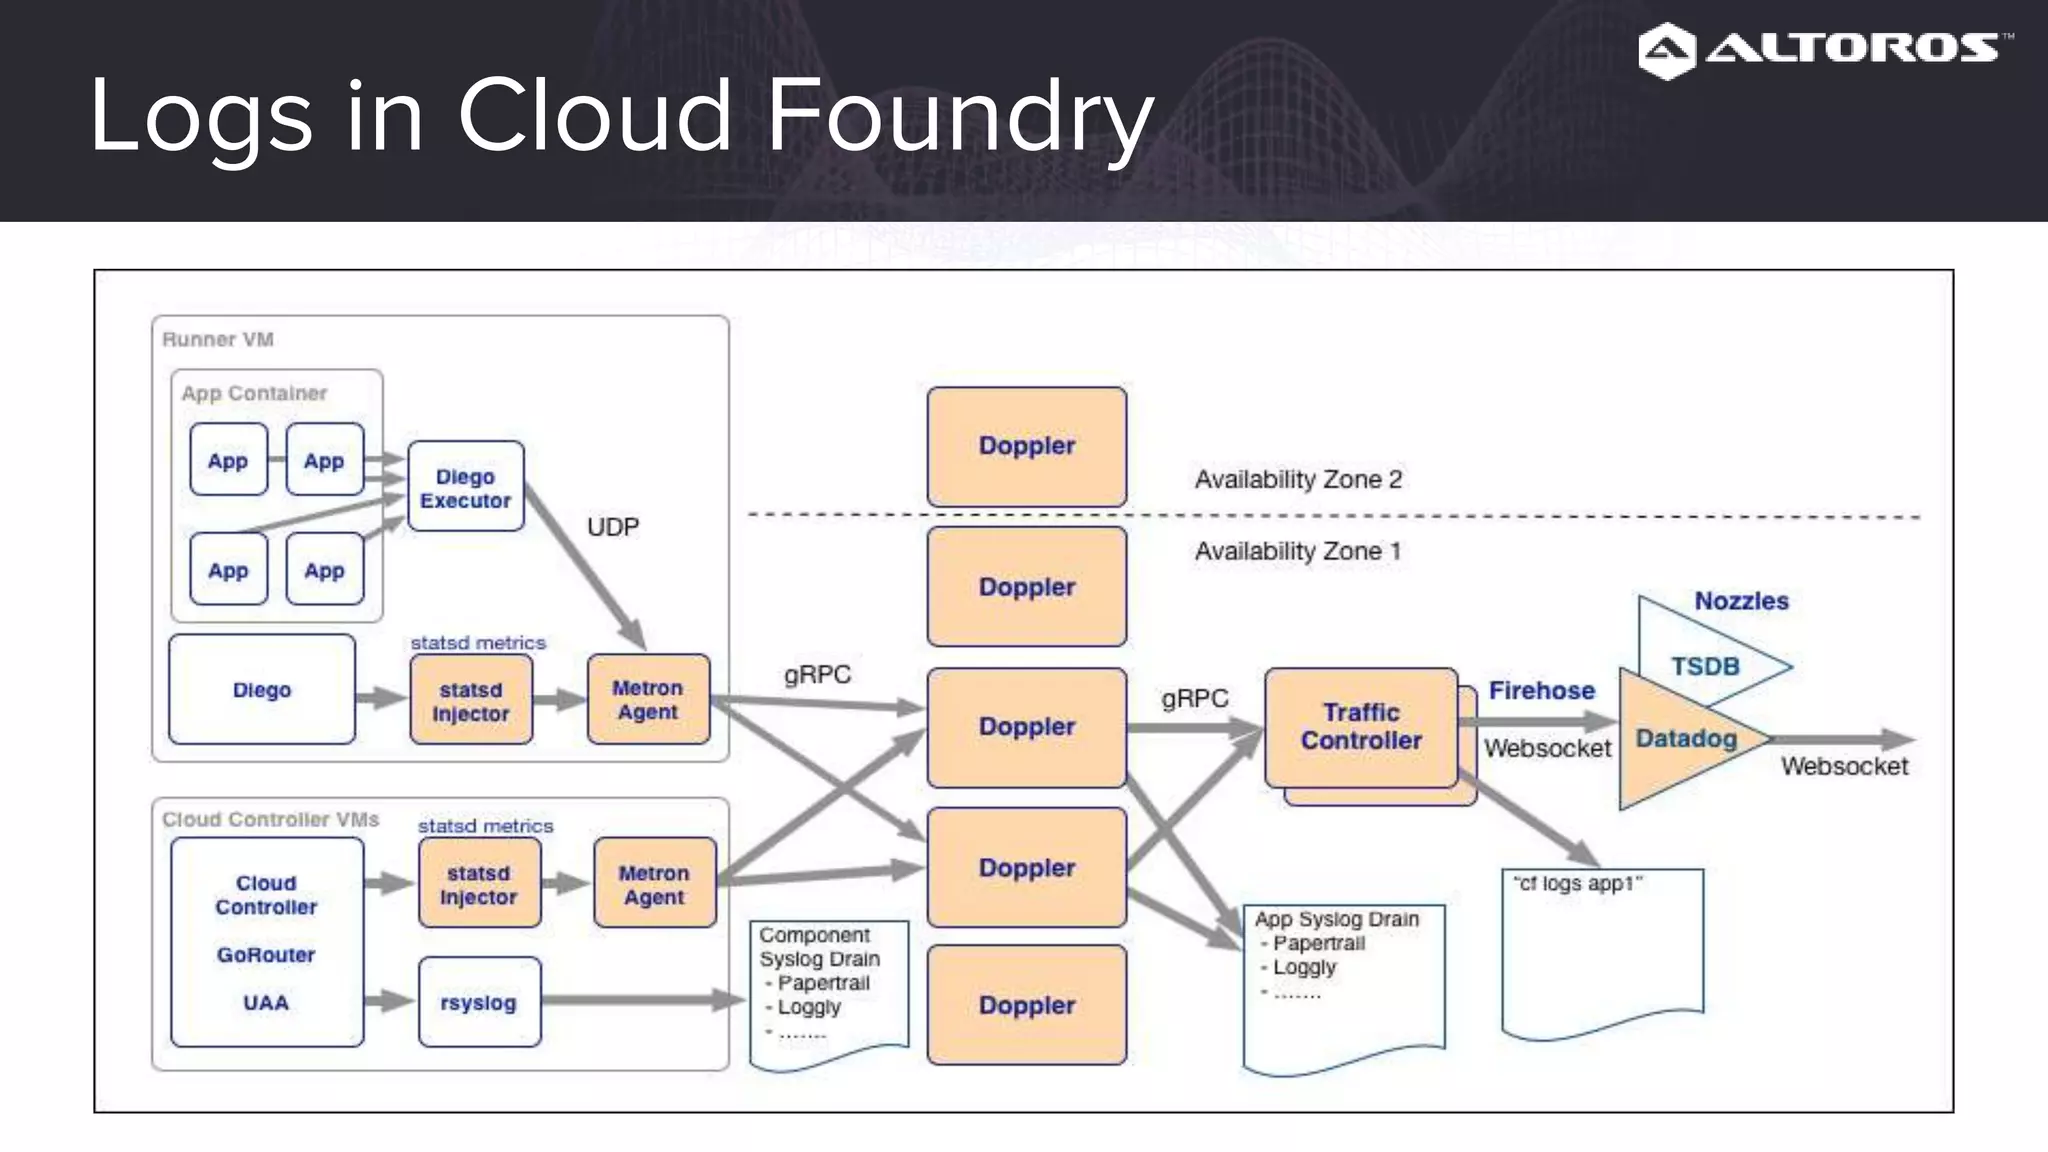
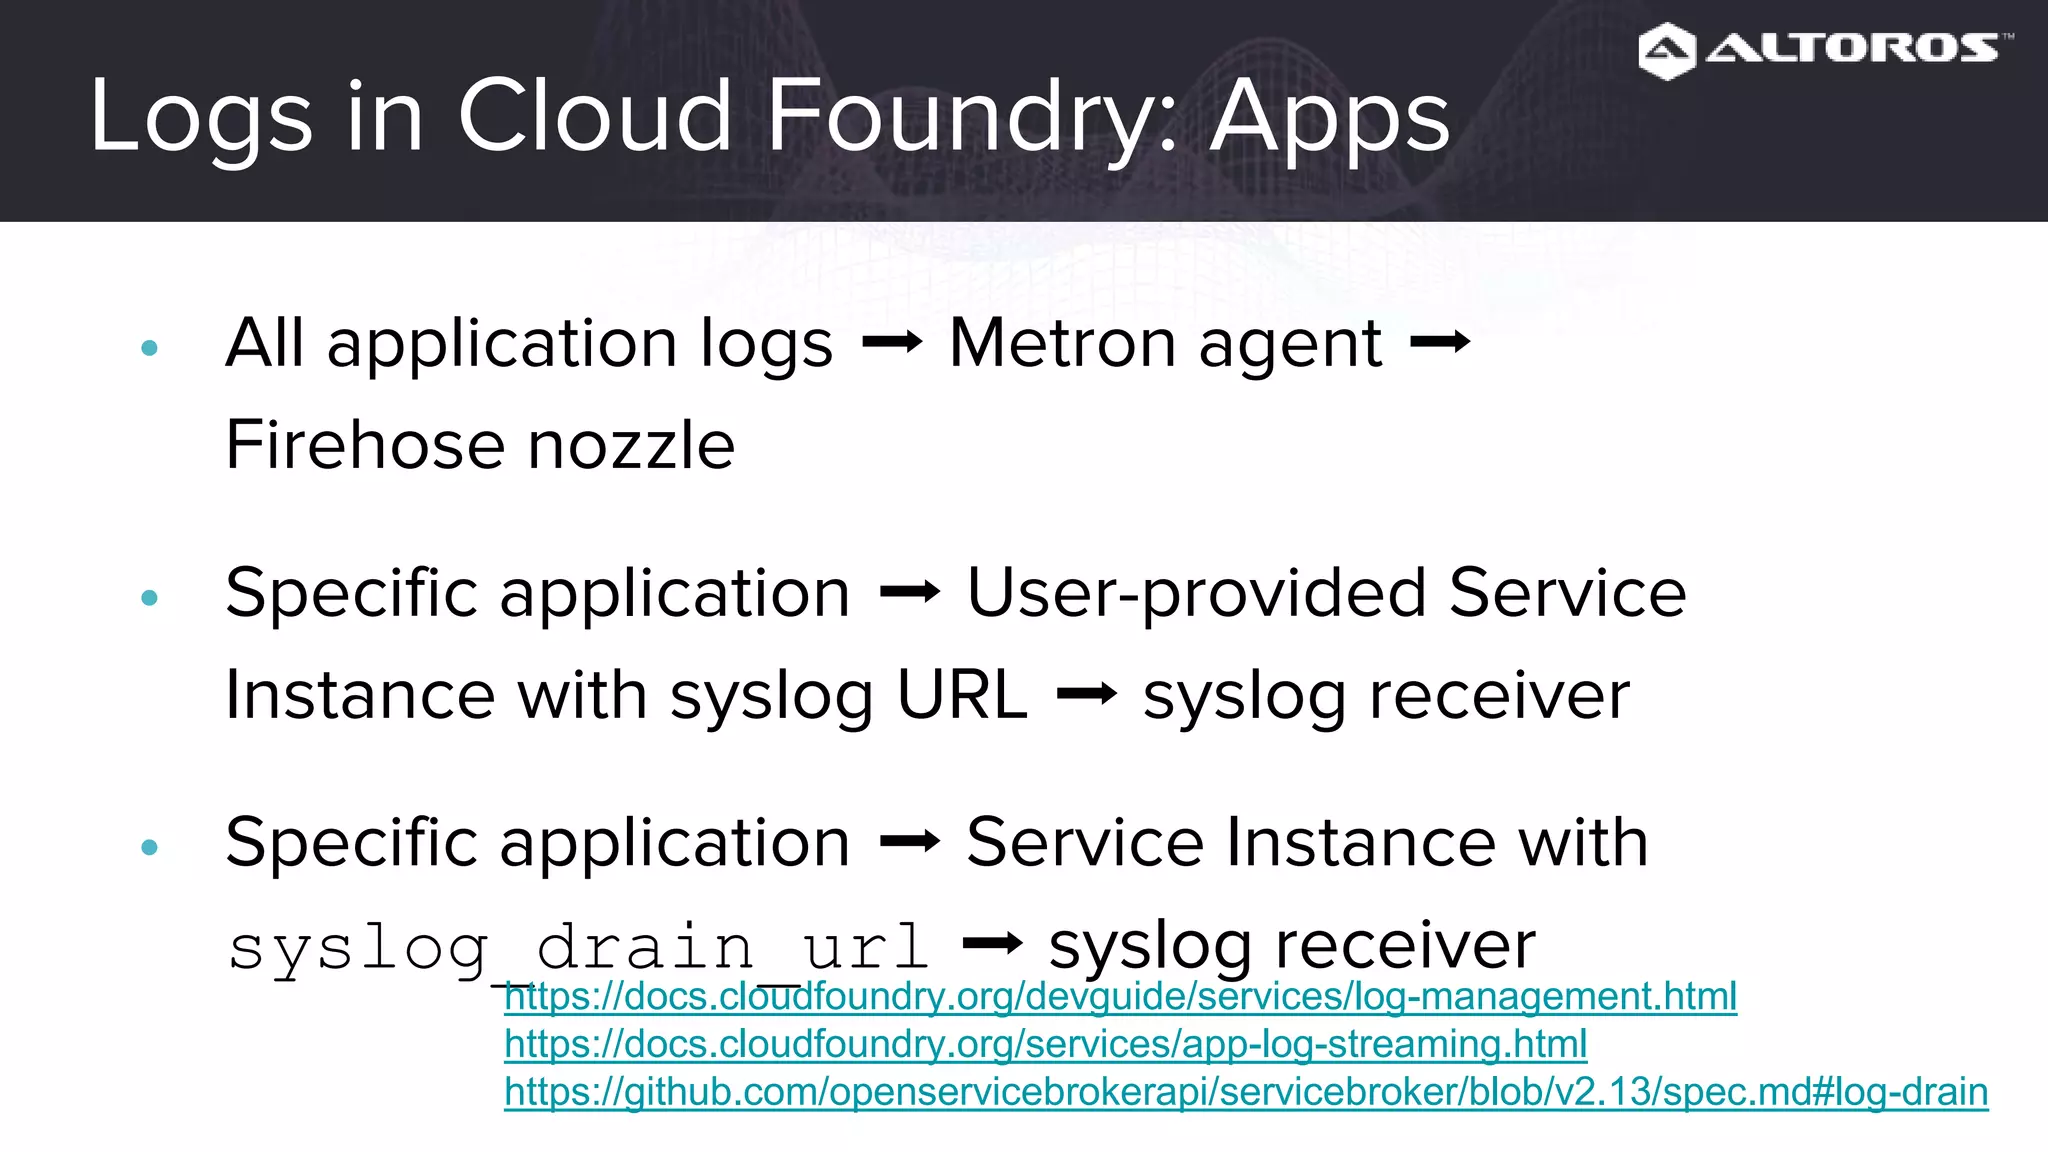
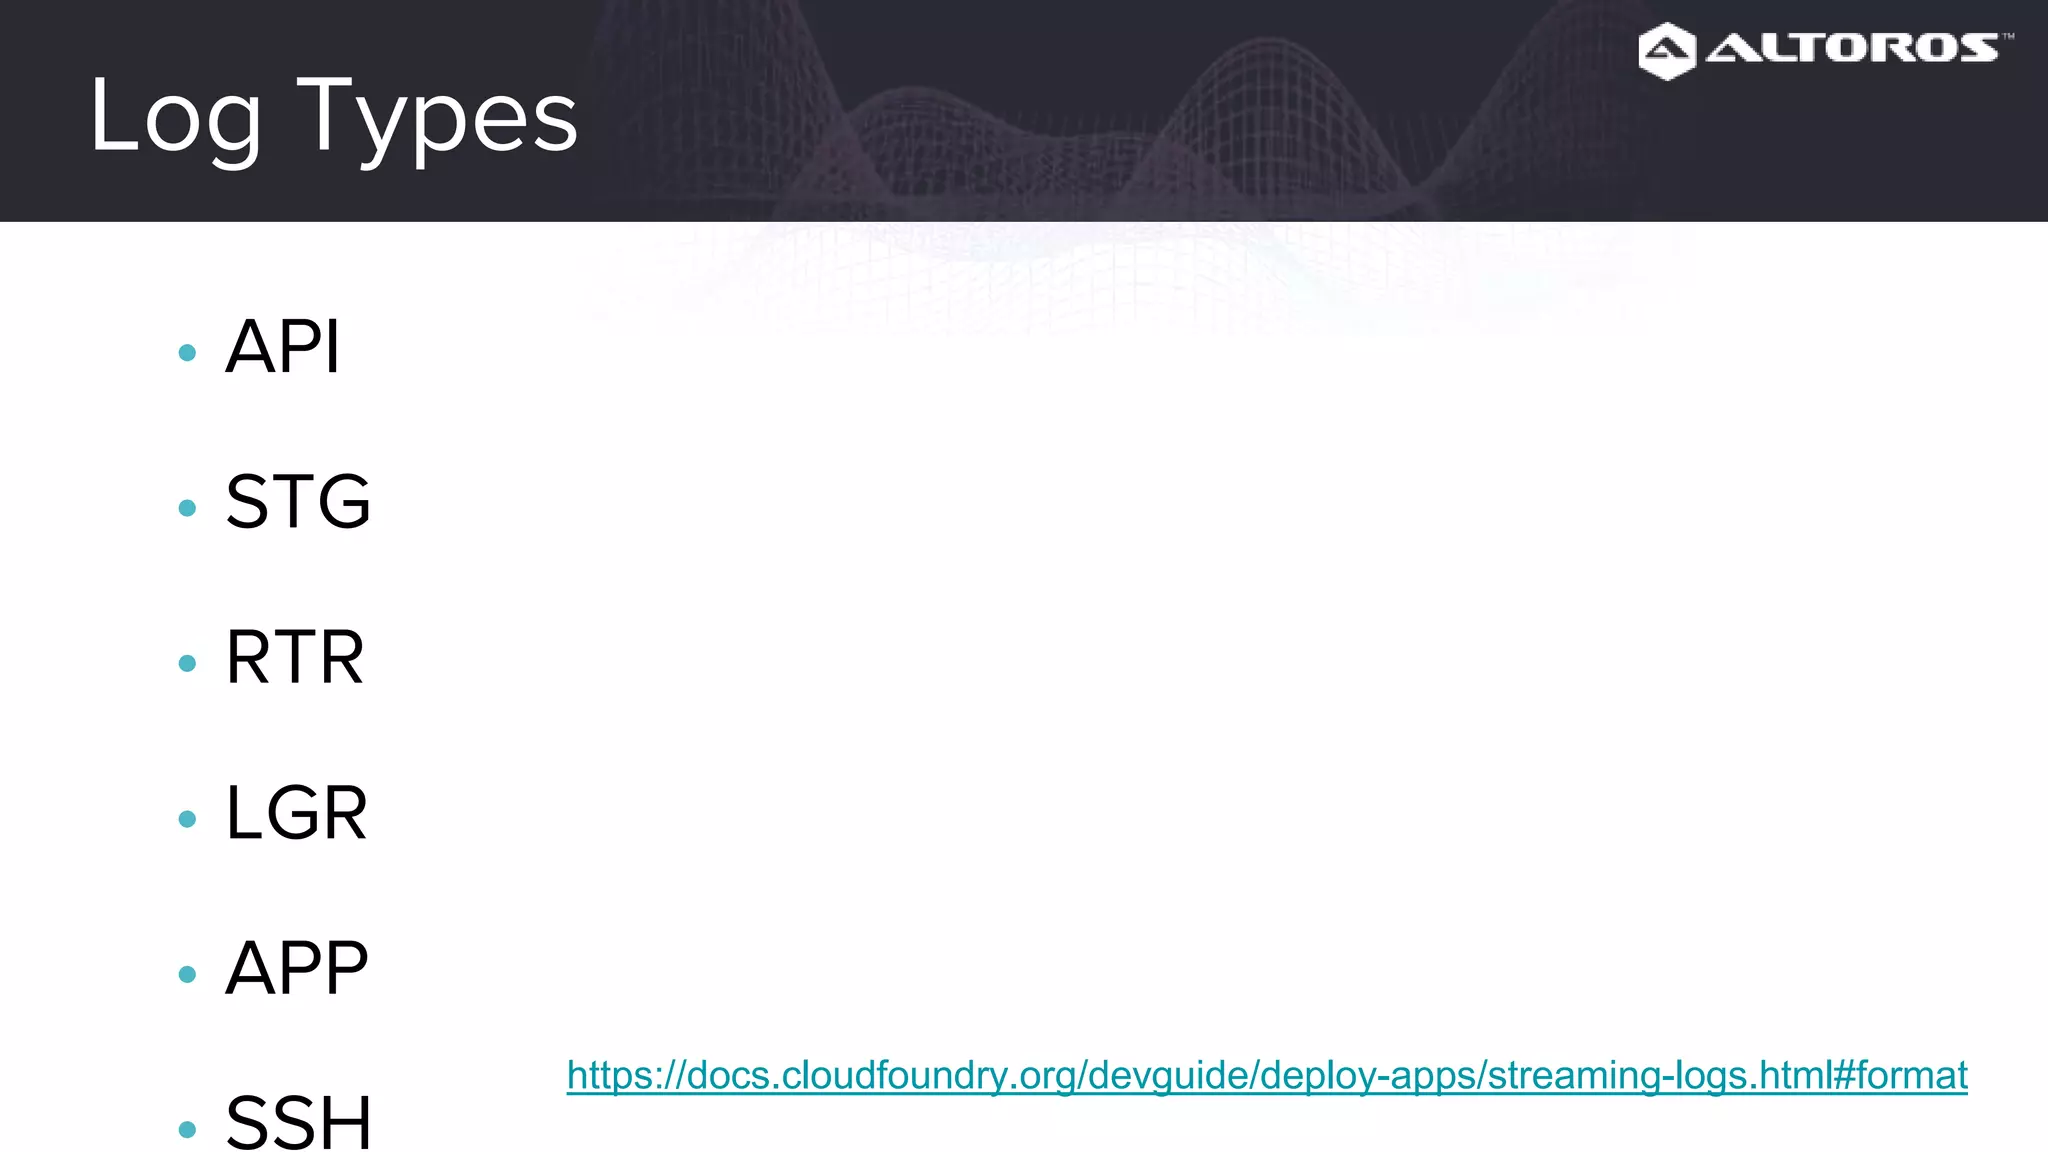
This webinar covered logging and metrics in Cloud Foundry. It discussed collecting logs from applications and platforms using the Firehose and syslog. Logs are typically stored in Elasticsearch and parsed by Logstash. Kibana provides visualization. Metrics are collected at various levels including IaaS, BOSH, CF, and applications. Common tools discussed were Graphite, InfluxDB, and Grafana. Upcoming webinars would dive deeper into Logsearch, examples, and advanced metrics uses like capacity planning.


![Coded Agents – with UiPath SDK + LangGraph [Virtual Hands-on Workshop]](https://cdn.slidesharecdn.com/ss_thumbnails/codedagentsdeck-251215155422-5497c599-thumbnail.jpg?width=640&height=640&fit=bounds)


