Download to read offline
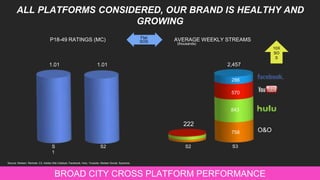

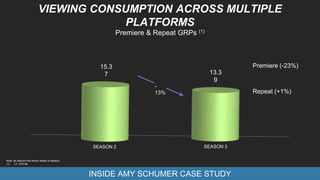


Our brand is growing across multiple platforms. Streams of Inside Amy Schumer increased significantly from Season 2 to Season 3 on our platforms and third party sites like Hulu. Viewing of the show has grown substantially through non-linear streams of both current and past seasons on our website and app.


