2020 Edelman Trust Barometer - Japan (Full Version)
Classwork
1. CLASS-WORK
1.
Give specific examples of data that might be gathered from each of the
following business disciplines and the industry.
Functional Areas :- Accounting, Finance, Production, Marketing,
Industry :- Manufacturing, Agriculture, Insurance, Banking, Travel, Healthcare
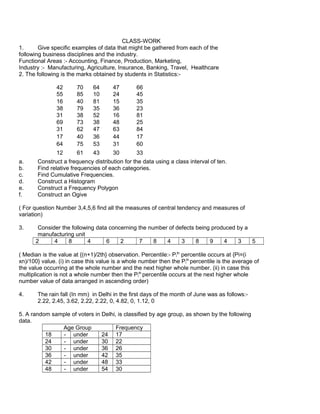
2. The following is the marks obtained by students in Statistics:42
55
16
38
31
69
31
17
64
64
10
81
35
52
38
47
36
53
47
24
15
36
16
48
63
44
31
66
45
35
23
81
25
84
17
60
12
a.
b.
c.
d.
e.
f.
70
85
40
79
38
73
62
40
75
61
43
30
33
Construct a frequency distribution for the data using a class interval of ten.
Find relative frequencies of each categories.
Find Cumulative Frequencies.
Construct a Histogram
Construct a Frequency Polygon
Construct an Ogive
( For question Number 3,4,5,6 find all the measures of central tendency and measures of
variation)
3.
Consider the following data concerning the number of defects being produced by a
manufacturing unit
2
4
8
4
6
2
7
8
4
3
8
9
4
3
5
( Median is the value at {(n+1)/2th} observation. Percentile:- Pith percentile occurs at {Pi=(i
xn)/100} value. (i) in case this value is a whole number then the Pith percentile is the average of
the value occurring at the whole number and the next higher whole number. (ii) in case this
multiplication is not a whole number then the Pith percentile occurs at the next higher whole
number value of data arranged in ascending order)
4.
The rain fall (In mm) in Delhi in the first days of the month of June was as follows:2.22, 2.45, 3.62, 2.22, 2.22, 0, 4.82, 0, 1.12, 0
5. A random sample of voters in Delhi, is classified by age group, as shown by the following
data.
Age Group
Frequency
18
- under
24 17
24
- under
30 22
30
- under
36 26
36
- under
42 35
42
- under
48 33
48
- under
54 30
2. 54
60
66
-
under
under
under
60
66
72
32
21
15
6. The students were asked to rate “ how important is price in choosing a laptop/mobile”.
The rating was to be given on a scale measuring 1 to 5 with the following annotations
1
2
3
4
5
Highly Unimportant Unimportant
Neither Important nor Unimportant
Important
Highly Important
The scores obtained from the survey of 50 students is as follows :
PRICE RATING
1
2
3
4
5
TOTAL
FREQUENCY
2
3
10
15
20
= 50