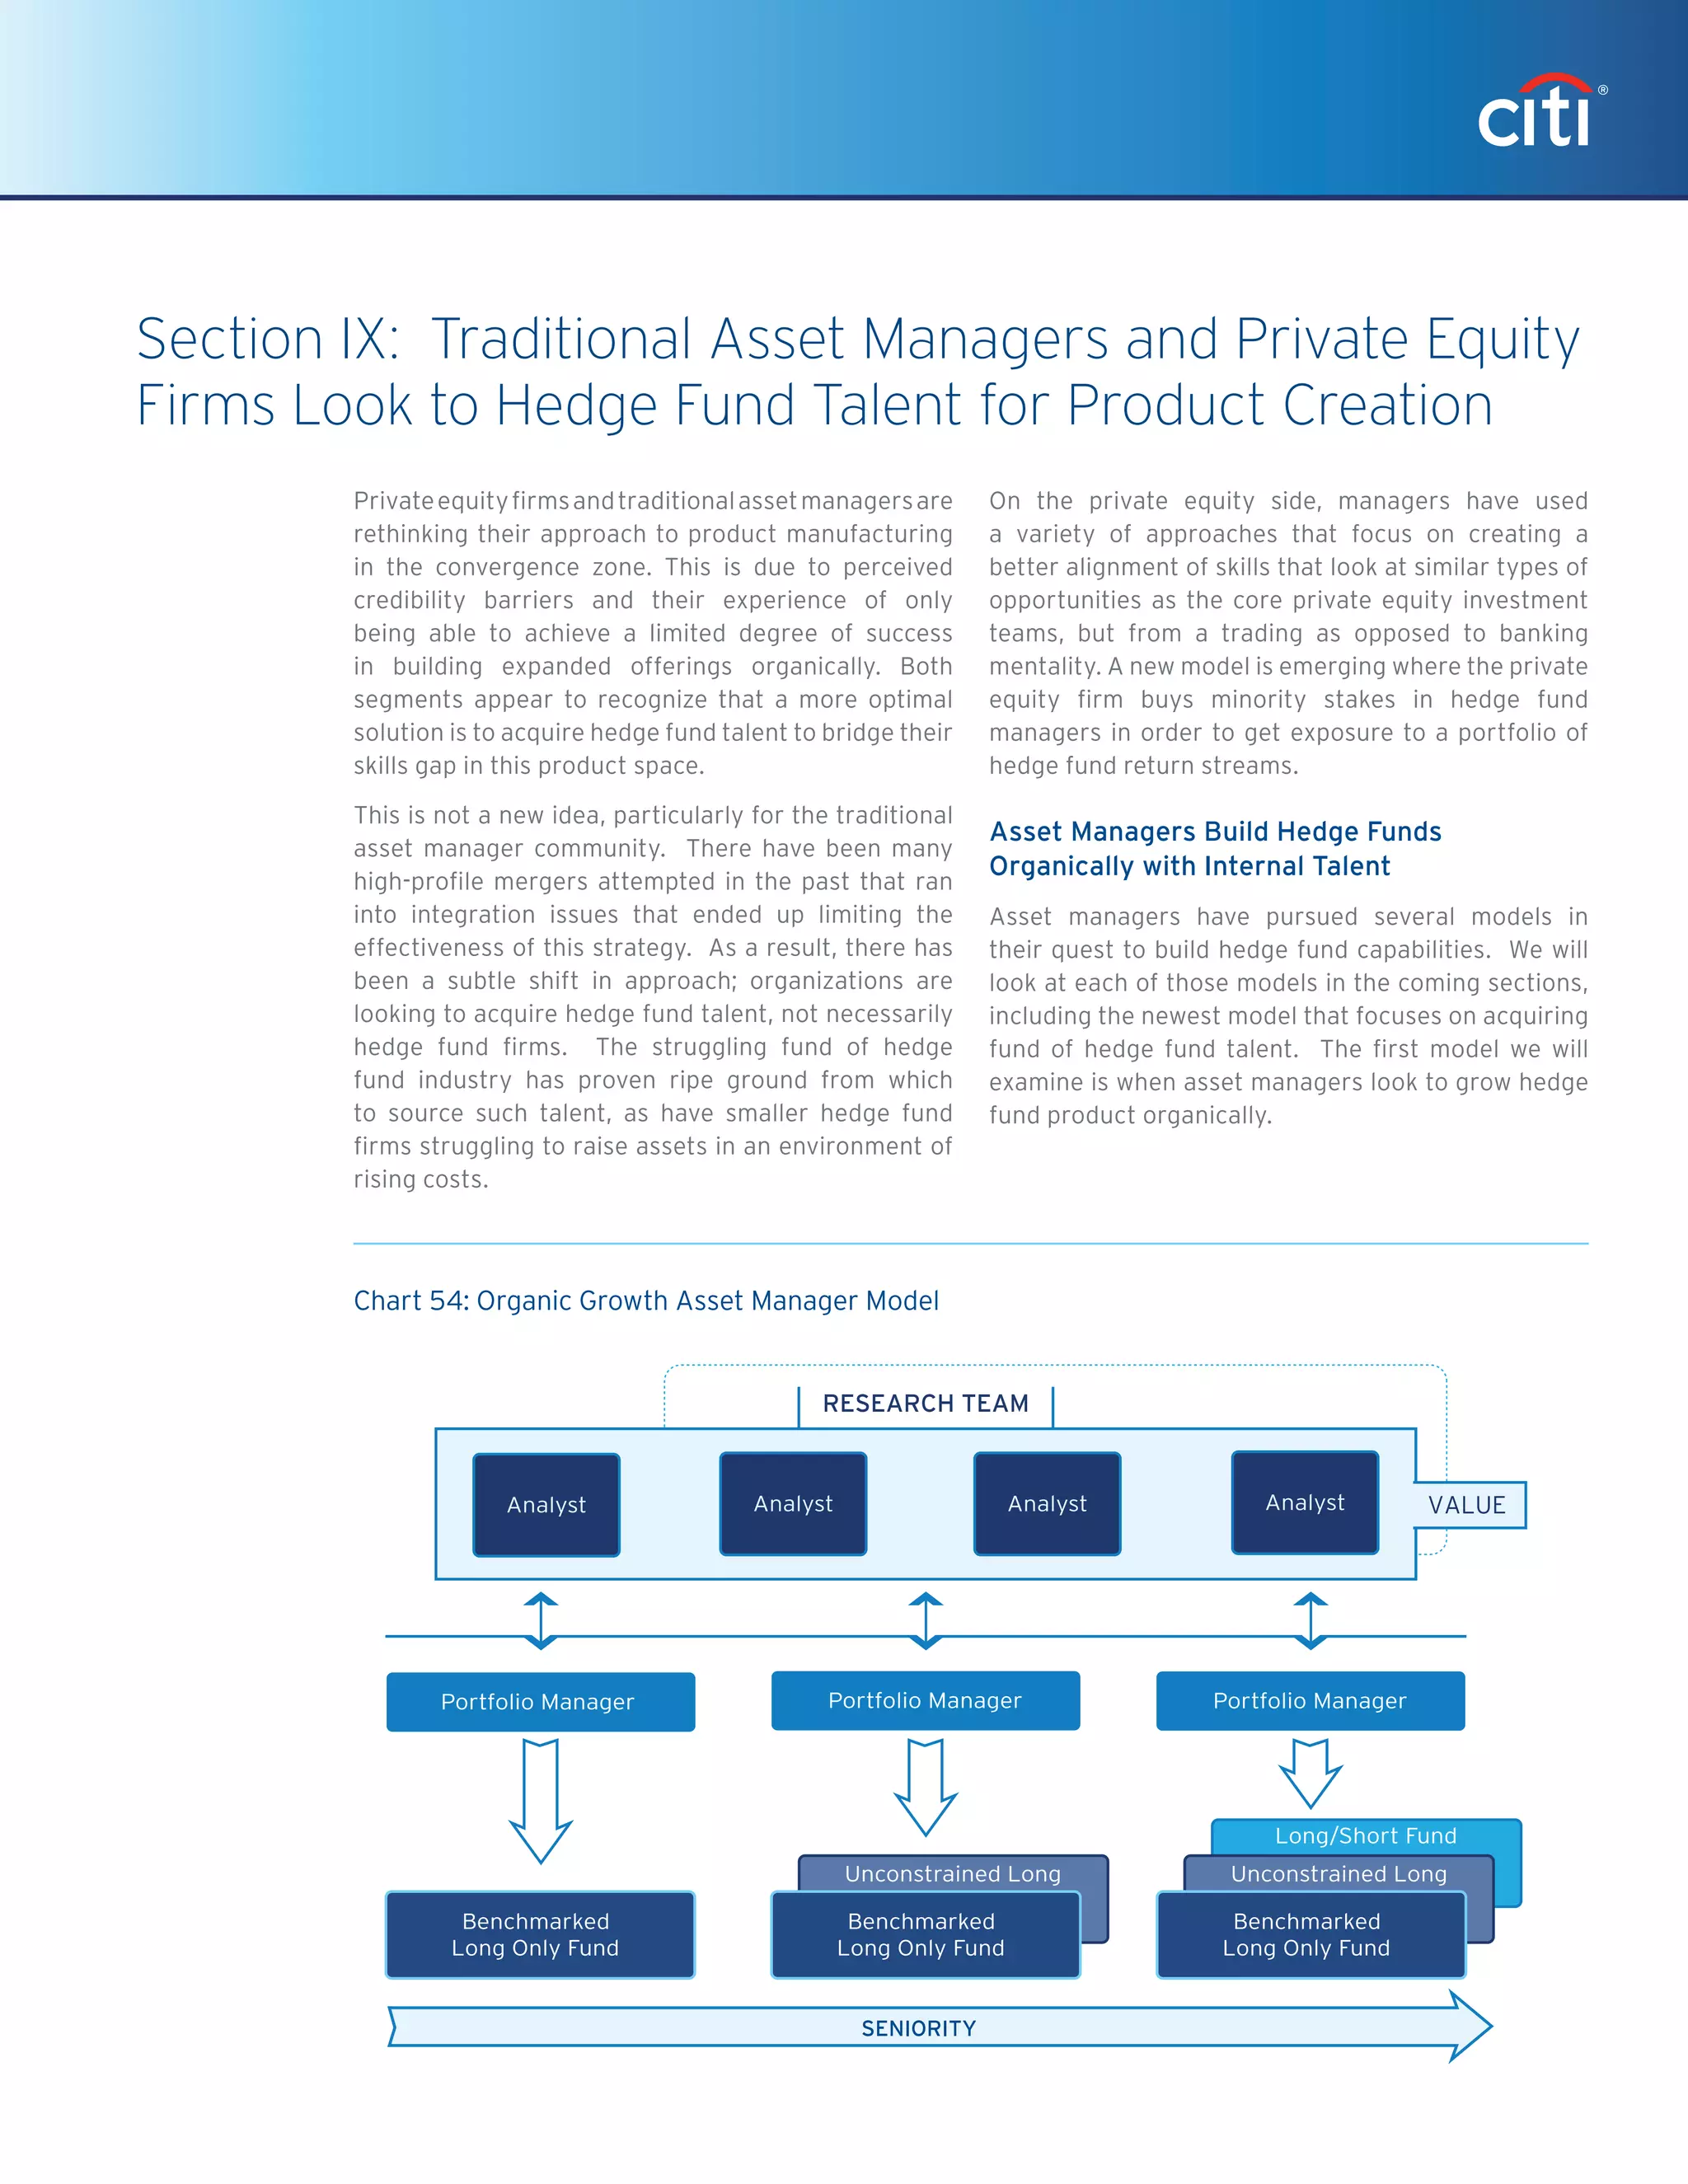
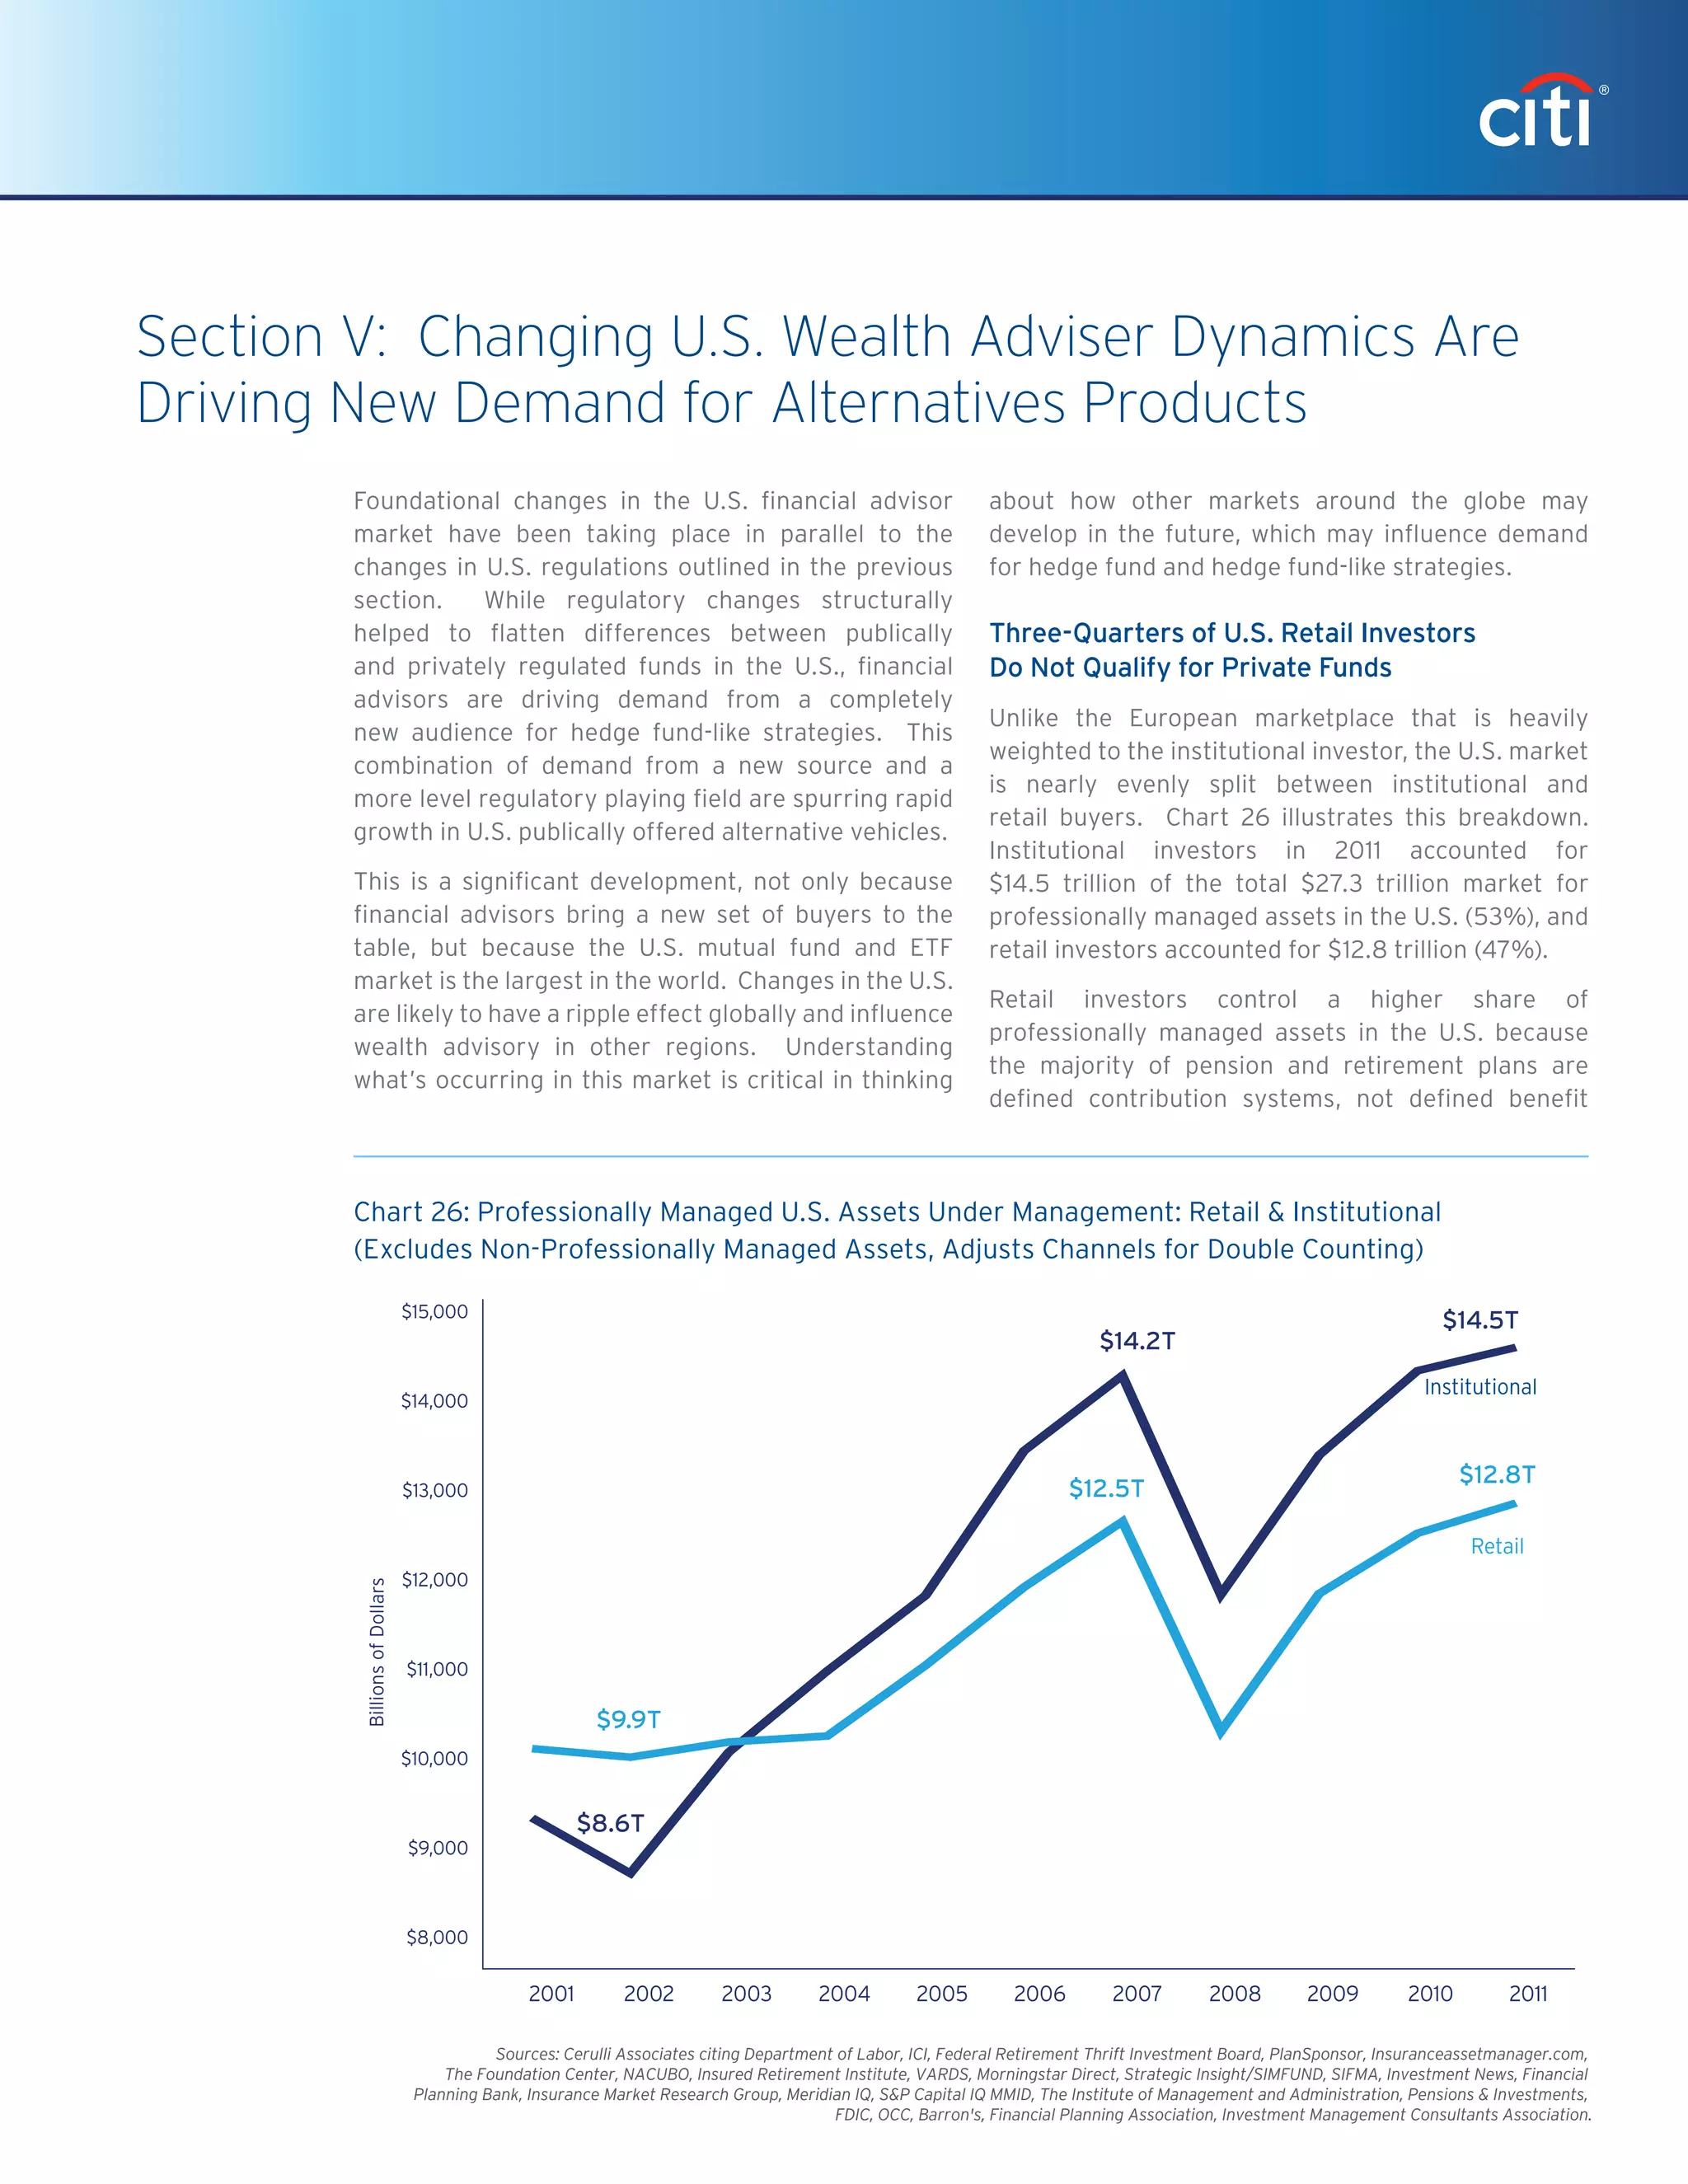
Institutional investors' views of hedge funds have evolved from seeing them as satellite holdings to core portfolio components used to dampen volatility and provide "insurance." More investors now allocate to hedge funds to manage risks in their equity and bond holdings. Demand for liquid alternatives is growing significantly from both retail and some institutional investors, driven by regulations and changing wealth manager dynamics. Products are expected to trade in parallel with private funds, allowing managers to offer more liquid strategies while still utilizing their full investment talent. This is expanding the concept of active management across traditional and alternative managers.


![Rise of Liquid Alternatives Survey | 14
Chart 7 shows that in the post-GFC years, the share
of market controlled by funds of hedge funds fell
precipitously from their peak of 45% in 2006 to
34% in 2010, when we first forecast a continuation
of this trend. As predicted, their market share has
continued to decline, falling to only 28% in 2012.
Volatility-Dampening Aspect of Hedge Funds
Gained Prominence
Since the GFC, confidence that hedge funds can
outperform the underlying markets has been
strained, and more emphasis has been placed on their
role in controlling volatility.
The idea that hedge funds are a vehicle from which
to capture excess market return has lapsed for the
time being for many institutional investors; investors
still experienced sharp losses in their hedge fund
portfolios during the GFC, and returns in recent
years have not been differentiated from those of the
traditional equity and bond markets. As shown in
Chart 8, the annualized trailing 3-year HFRI Index was
+3.3% on average between 2007 and 2012—barely
better than 10-Year U.S. Treasuries (+3.04%) and only
slightly above the major equity indices (MSCI World
Equity Index [+2.41%] and SP 500 [+2.45%]).
Indeed, in November and December 2011, hedge
fund returns actually fell more than equity market
returns — a phenomenon that many investors thought
impossible. This lack of performance has been a
major deterrent to the HNW/FO audience that had
originally moved into hedge funds because of their
perceived ability to generate outsized returns. As
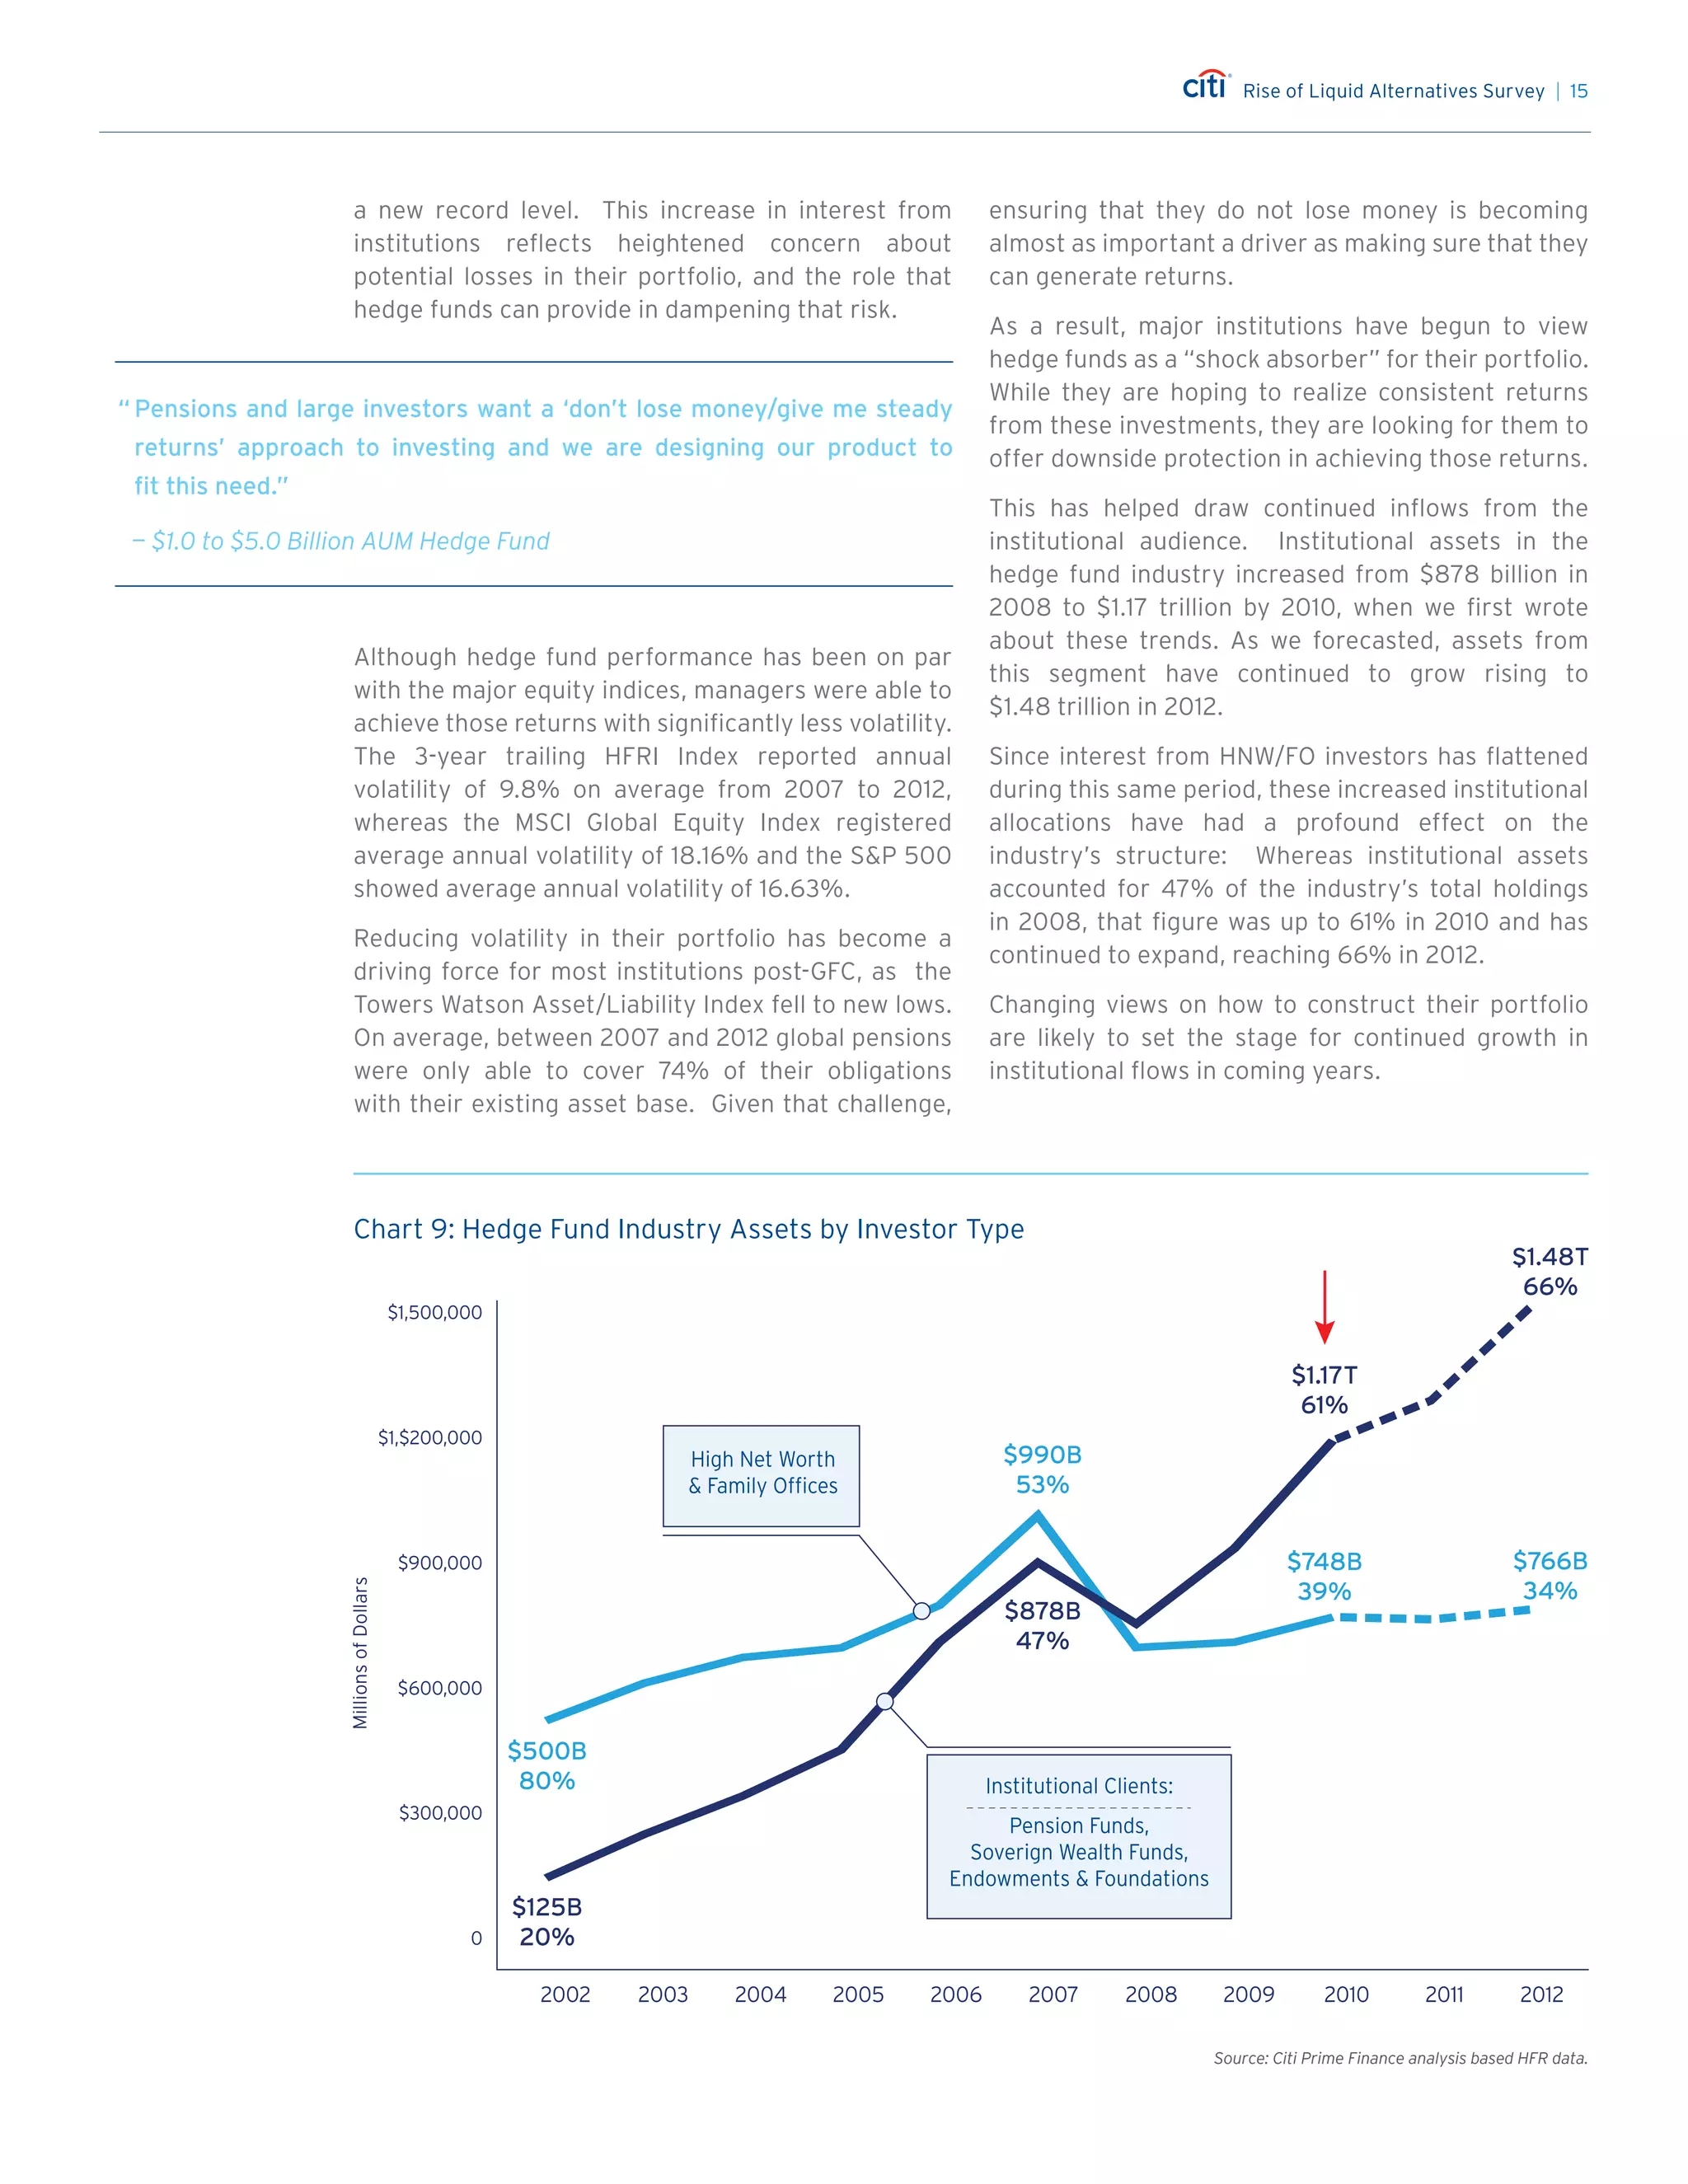
shown in Chart 9, allocations from this audience
fell sharply in 2008 from their peak of $990
billion and have not recovered in subsequent years,
hovering around the mid-$700 billion area for the
past several years.
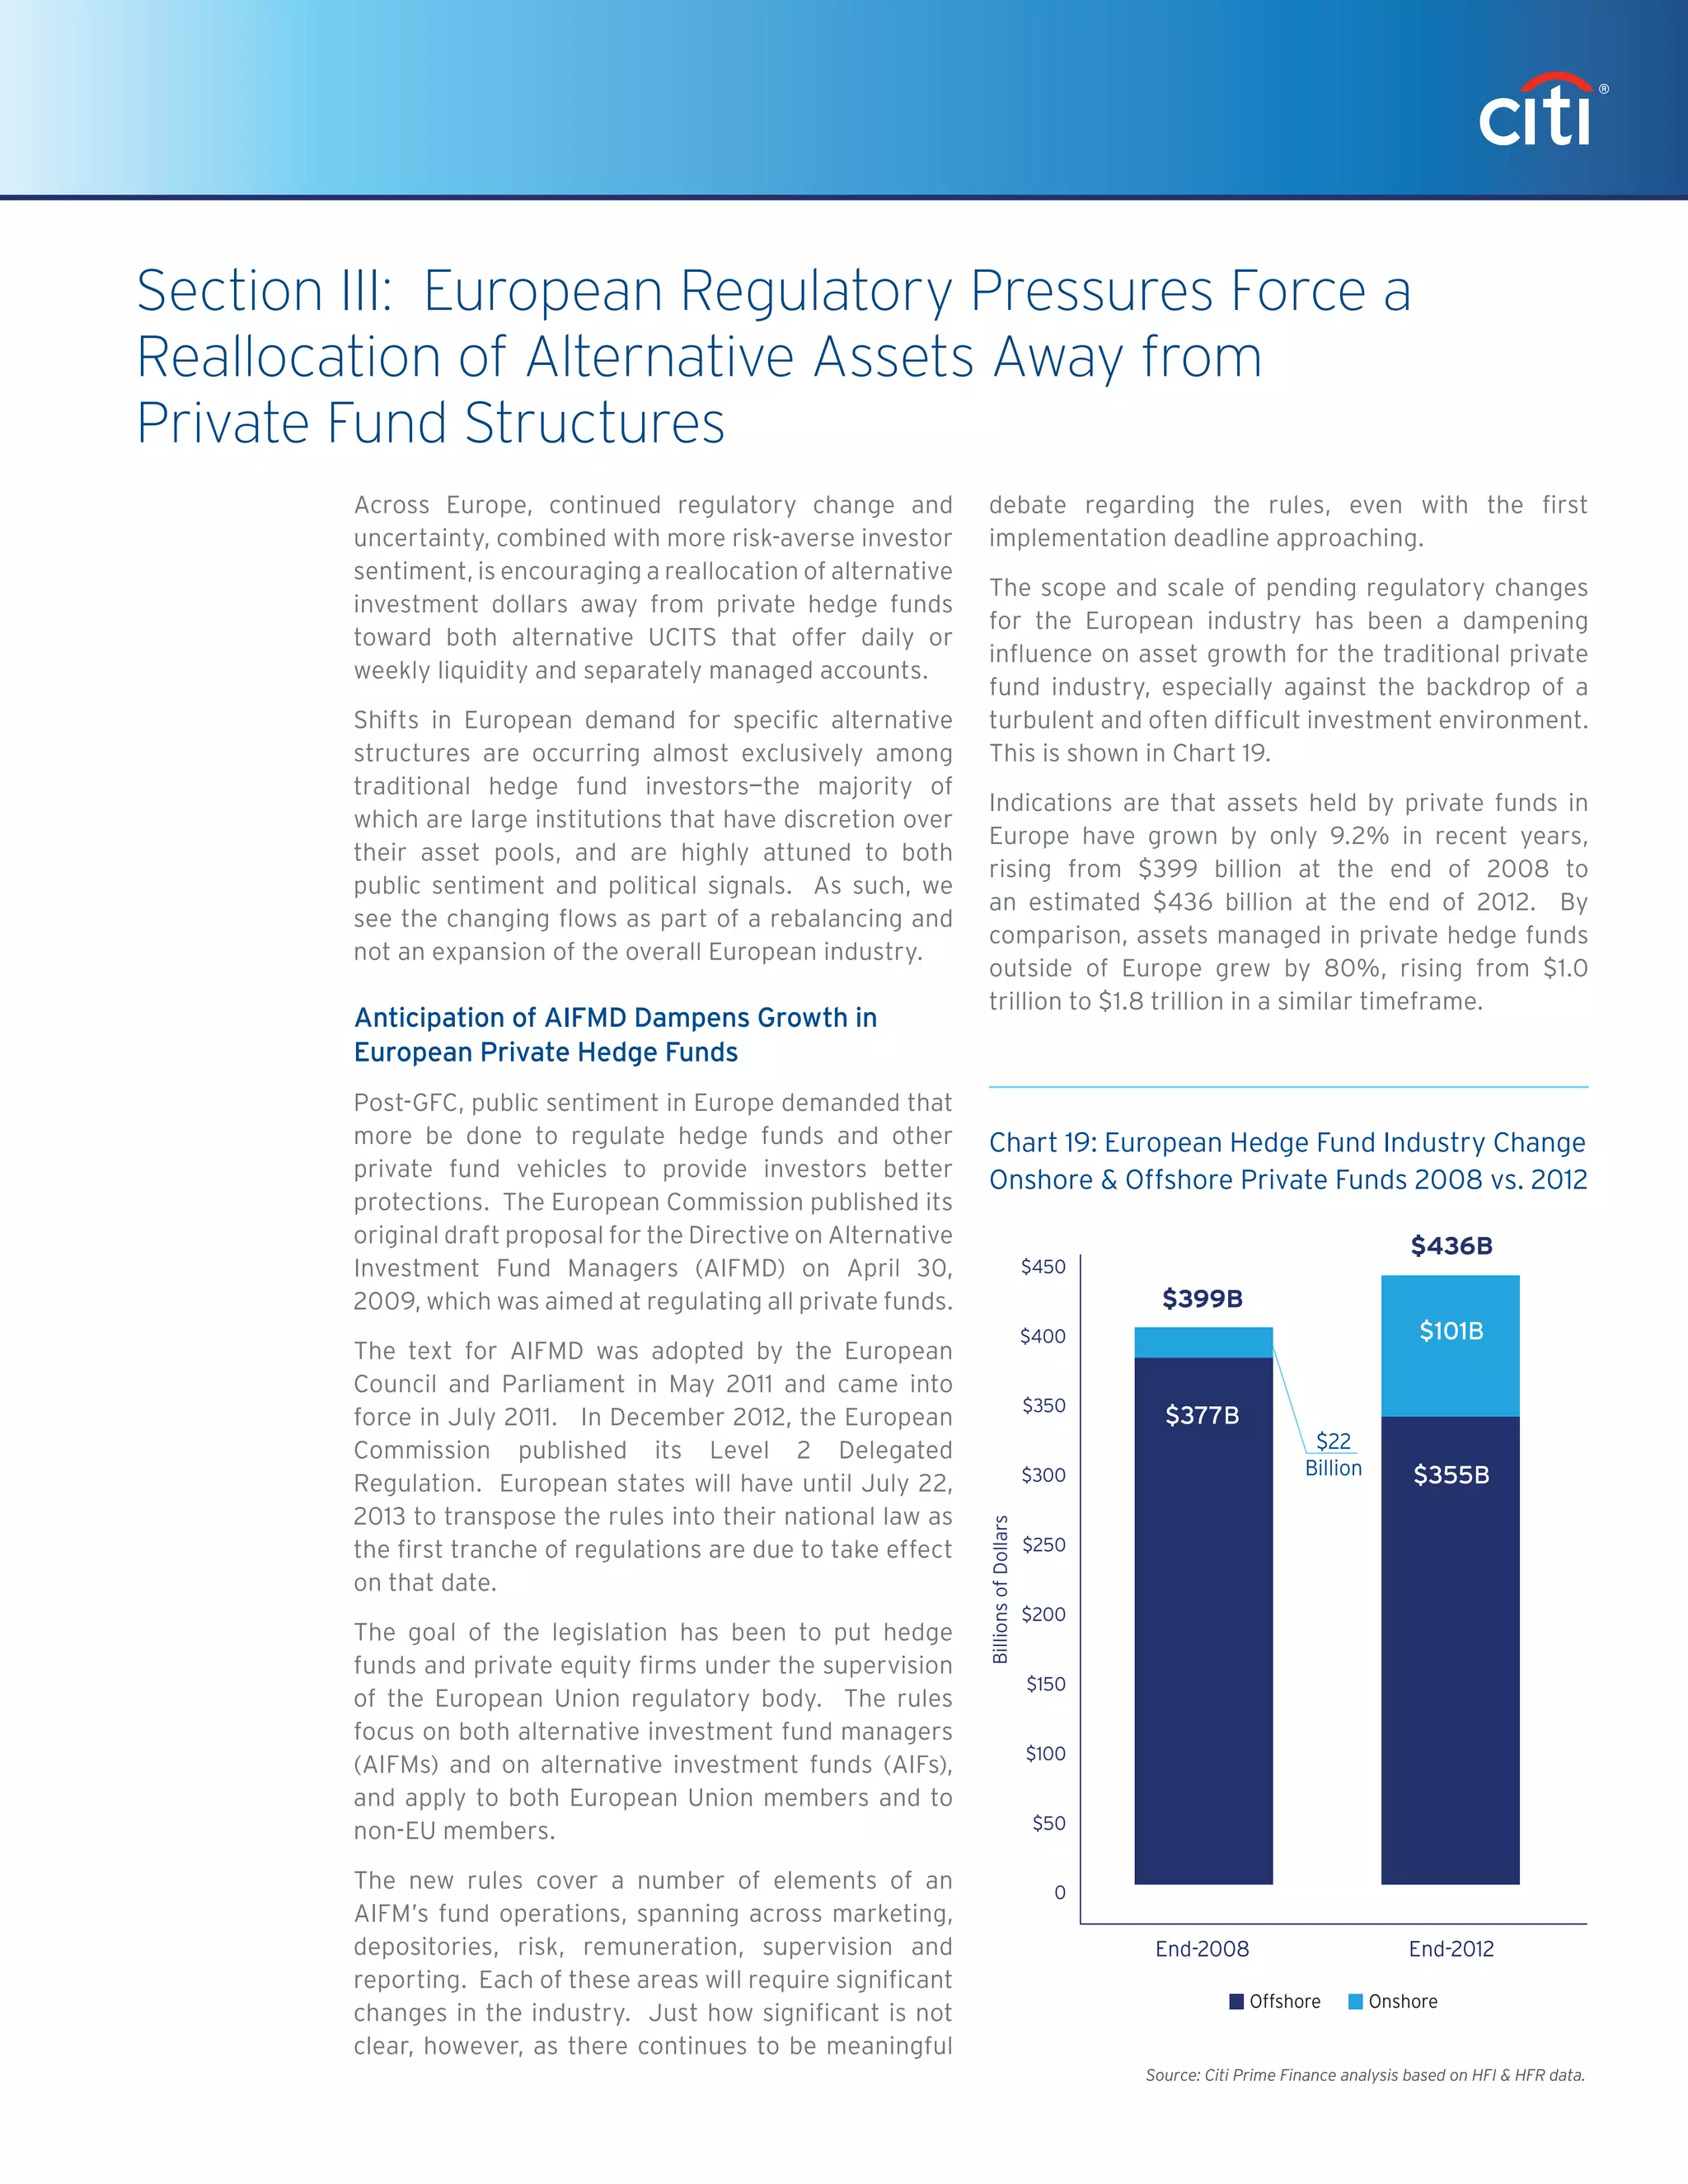
Institutional investor allocations recovered quickly
post-GFC, however, and have subsequently risen
sharply, driving total hedge fund industry AUM to
“ Our expectations for alternative funds is to provide protection on the
downside (maximum 50%) and good upside participation with a 6-9%
annualized return.”
— Insurance Company
“ We treat our hedge fund allocation as market shock absorbers.
Our hedge fund allocation is meant to be a stable value asset.”
— Endowment
Chart 8
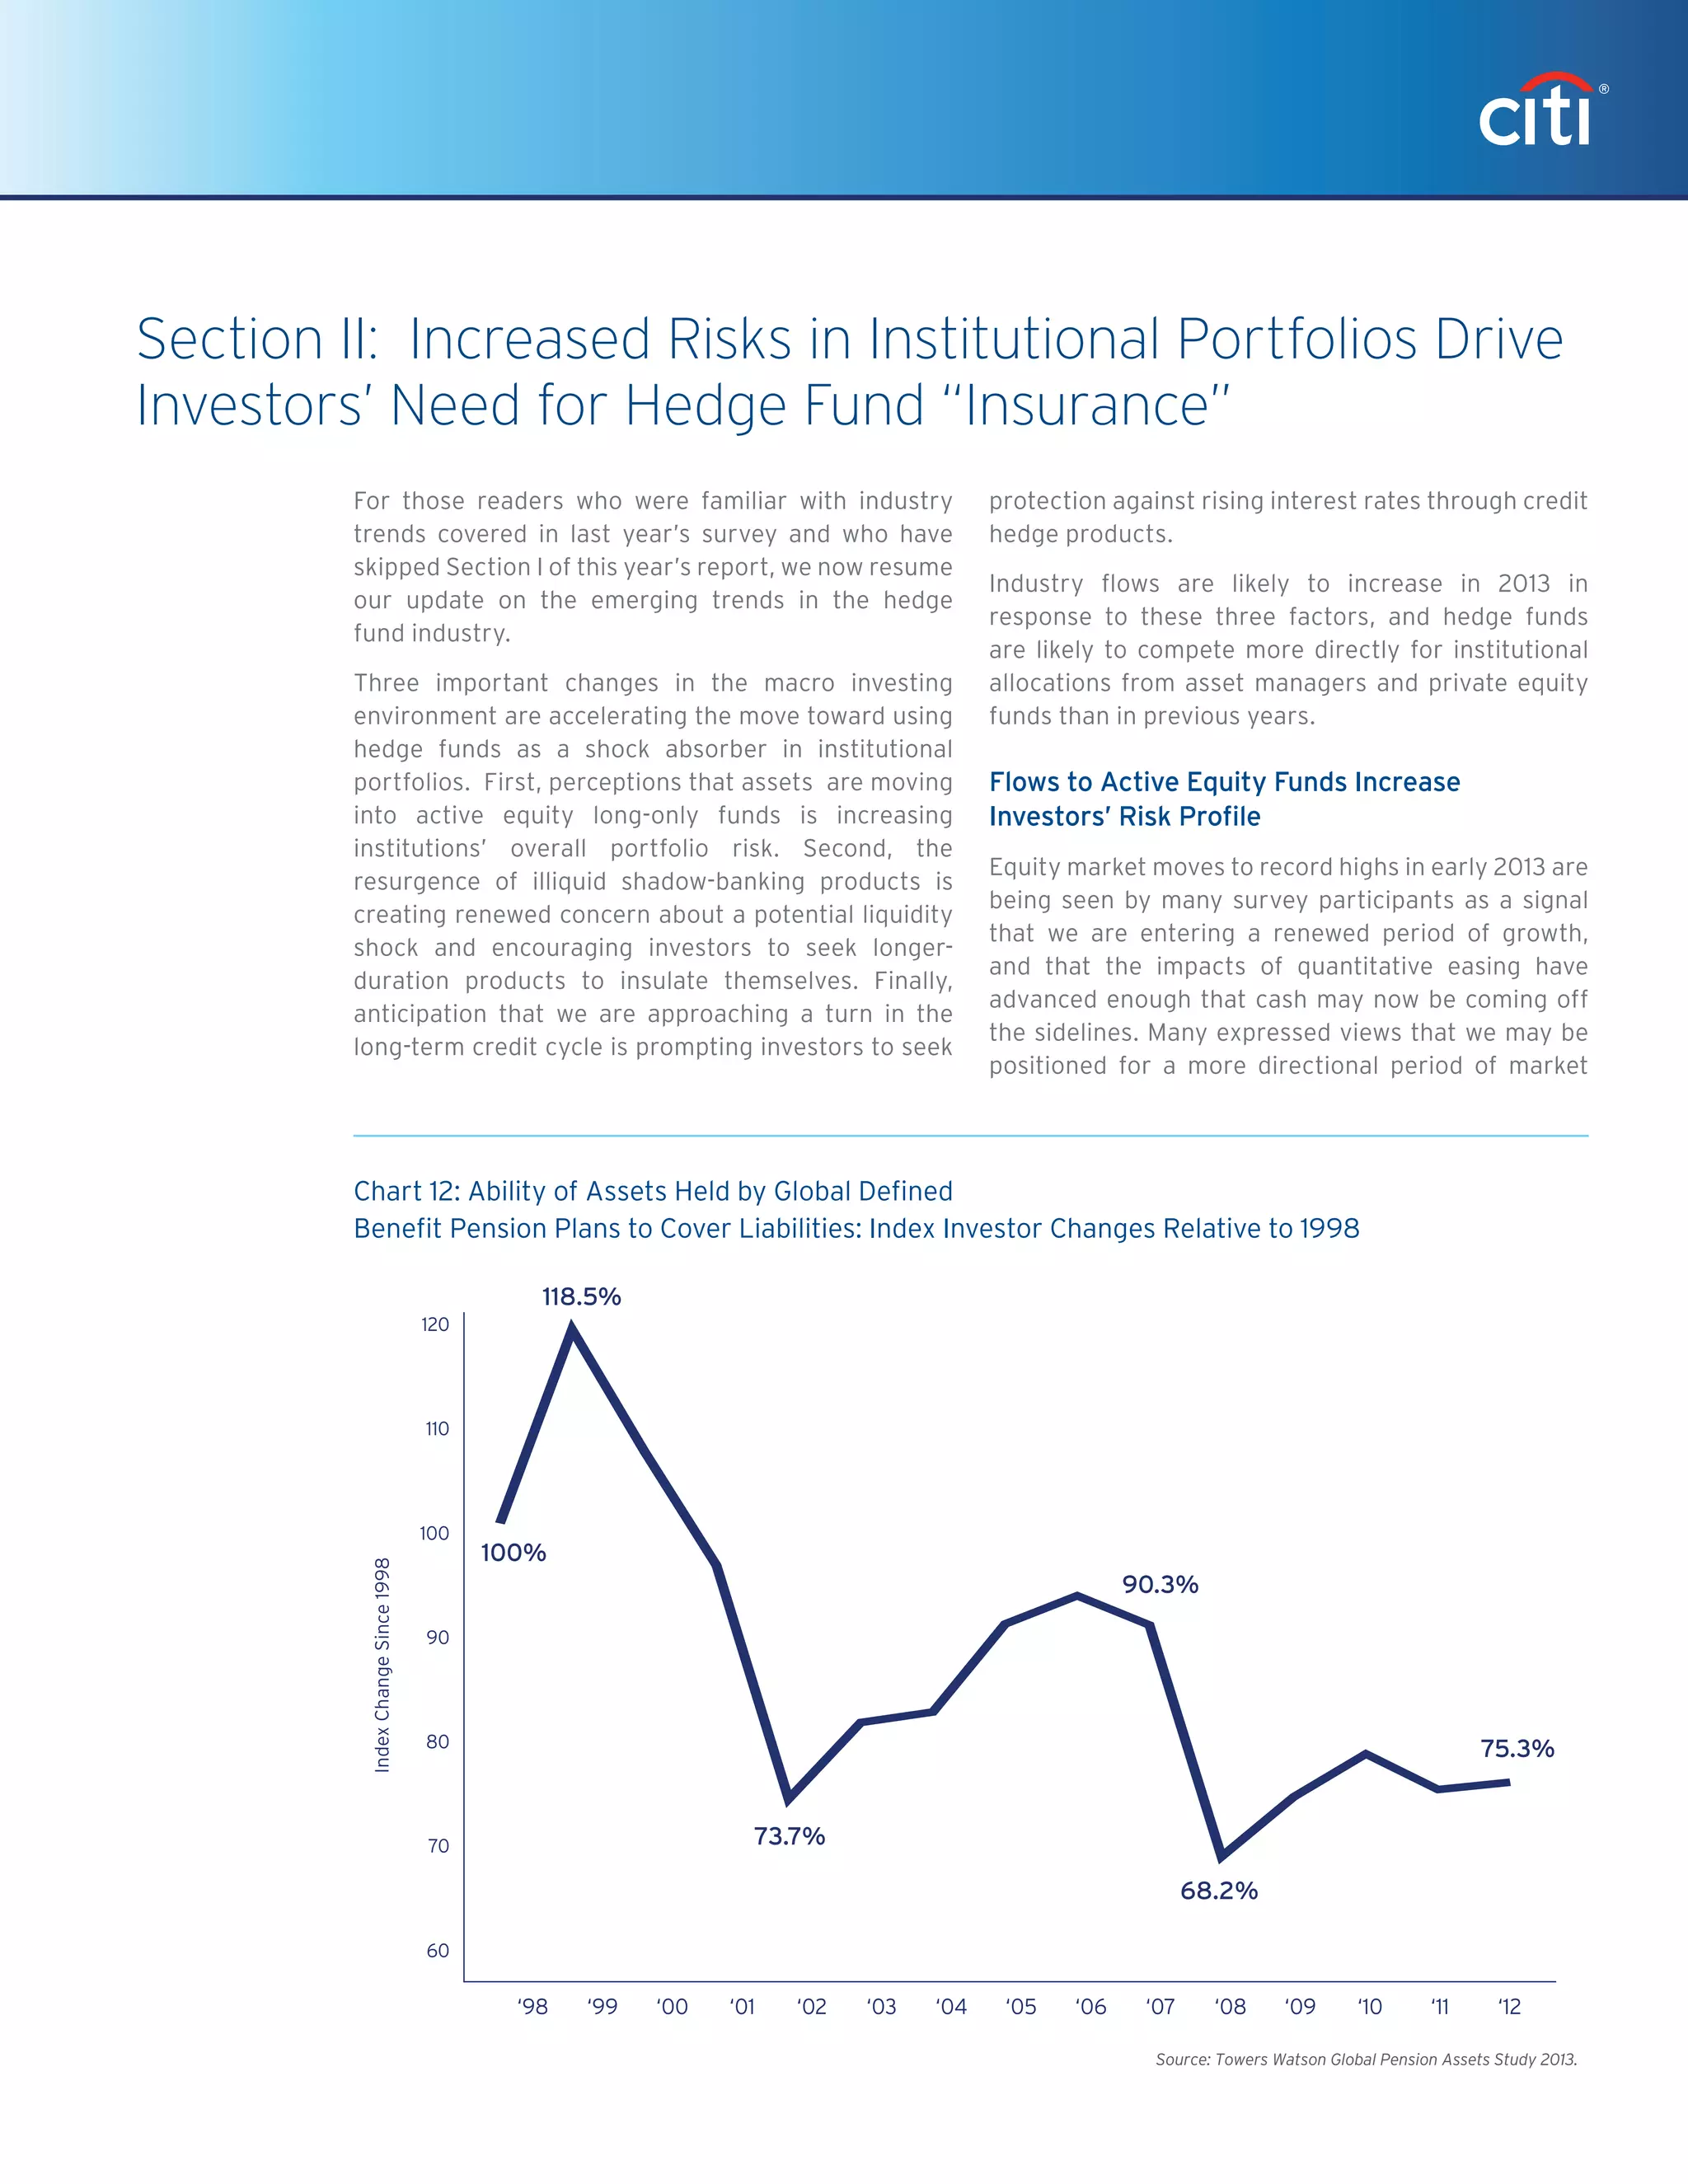
* Global pension liability asset information based on Towers Watson Global Survey with data indexed as percent of 1998 coverage.
Data shows annual average for listed period. Only defined benefit assets are considered.
Sources: Citi Prime Finance analysis based on MSCI, SP, Bloomberg, HFR Towers Watson data.
0
MillionsofDollarsAuM
Hedge Fund Industry AuM Relative Performance in Various Periods
‘95 ‘96 ‘97 ‘98 ‘99 ‘00‘94 ‘02 ‘03 ‘04 ‘05 ‘06 ‘12‘01
$2,500,000
$2,000,000
$1,500,000
$1,000,000
$500,000
Diversification Risk Adjusted Returns
$167B
$491B
$2,252B
Capture Excess Performance
‘07 ‘08 ‘09 ‘10 ‘11
Shock Absorption
$1,868B
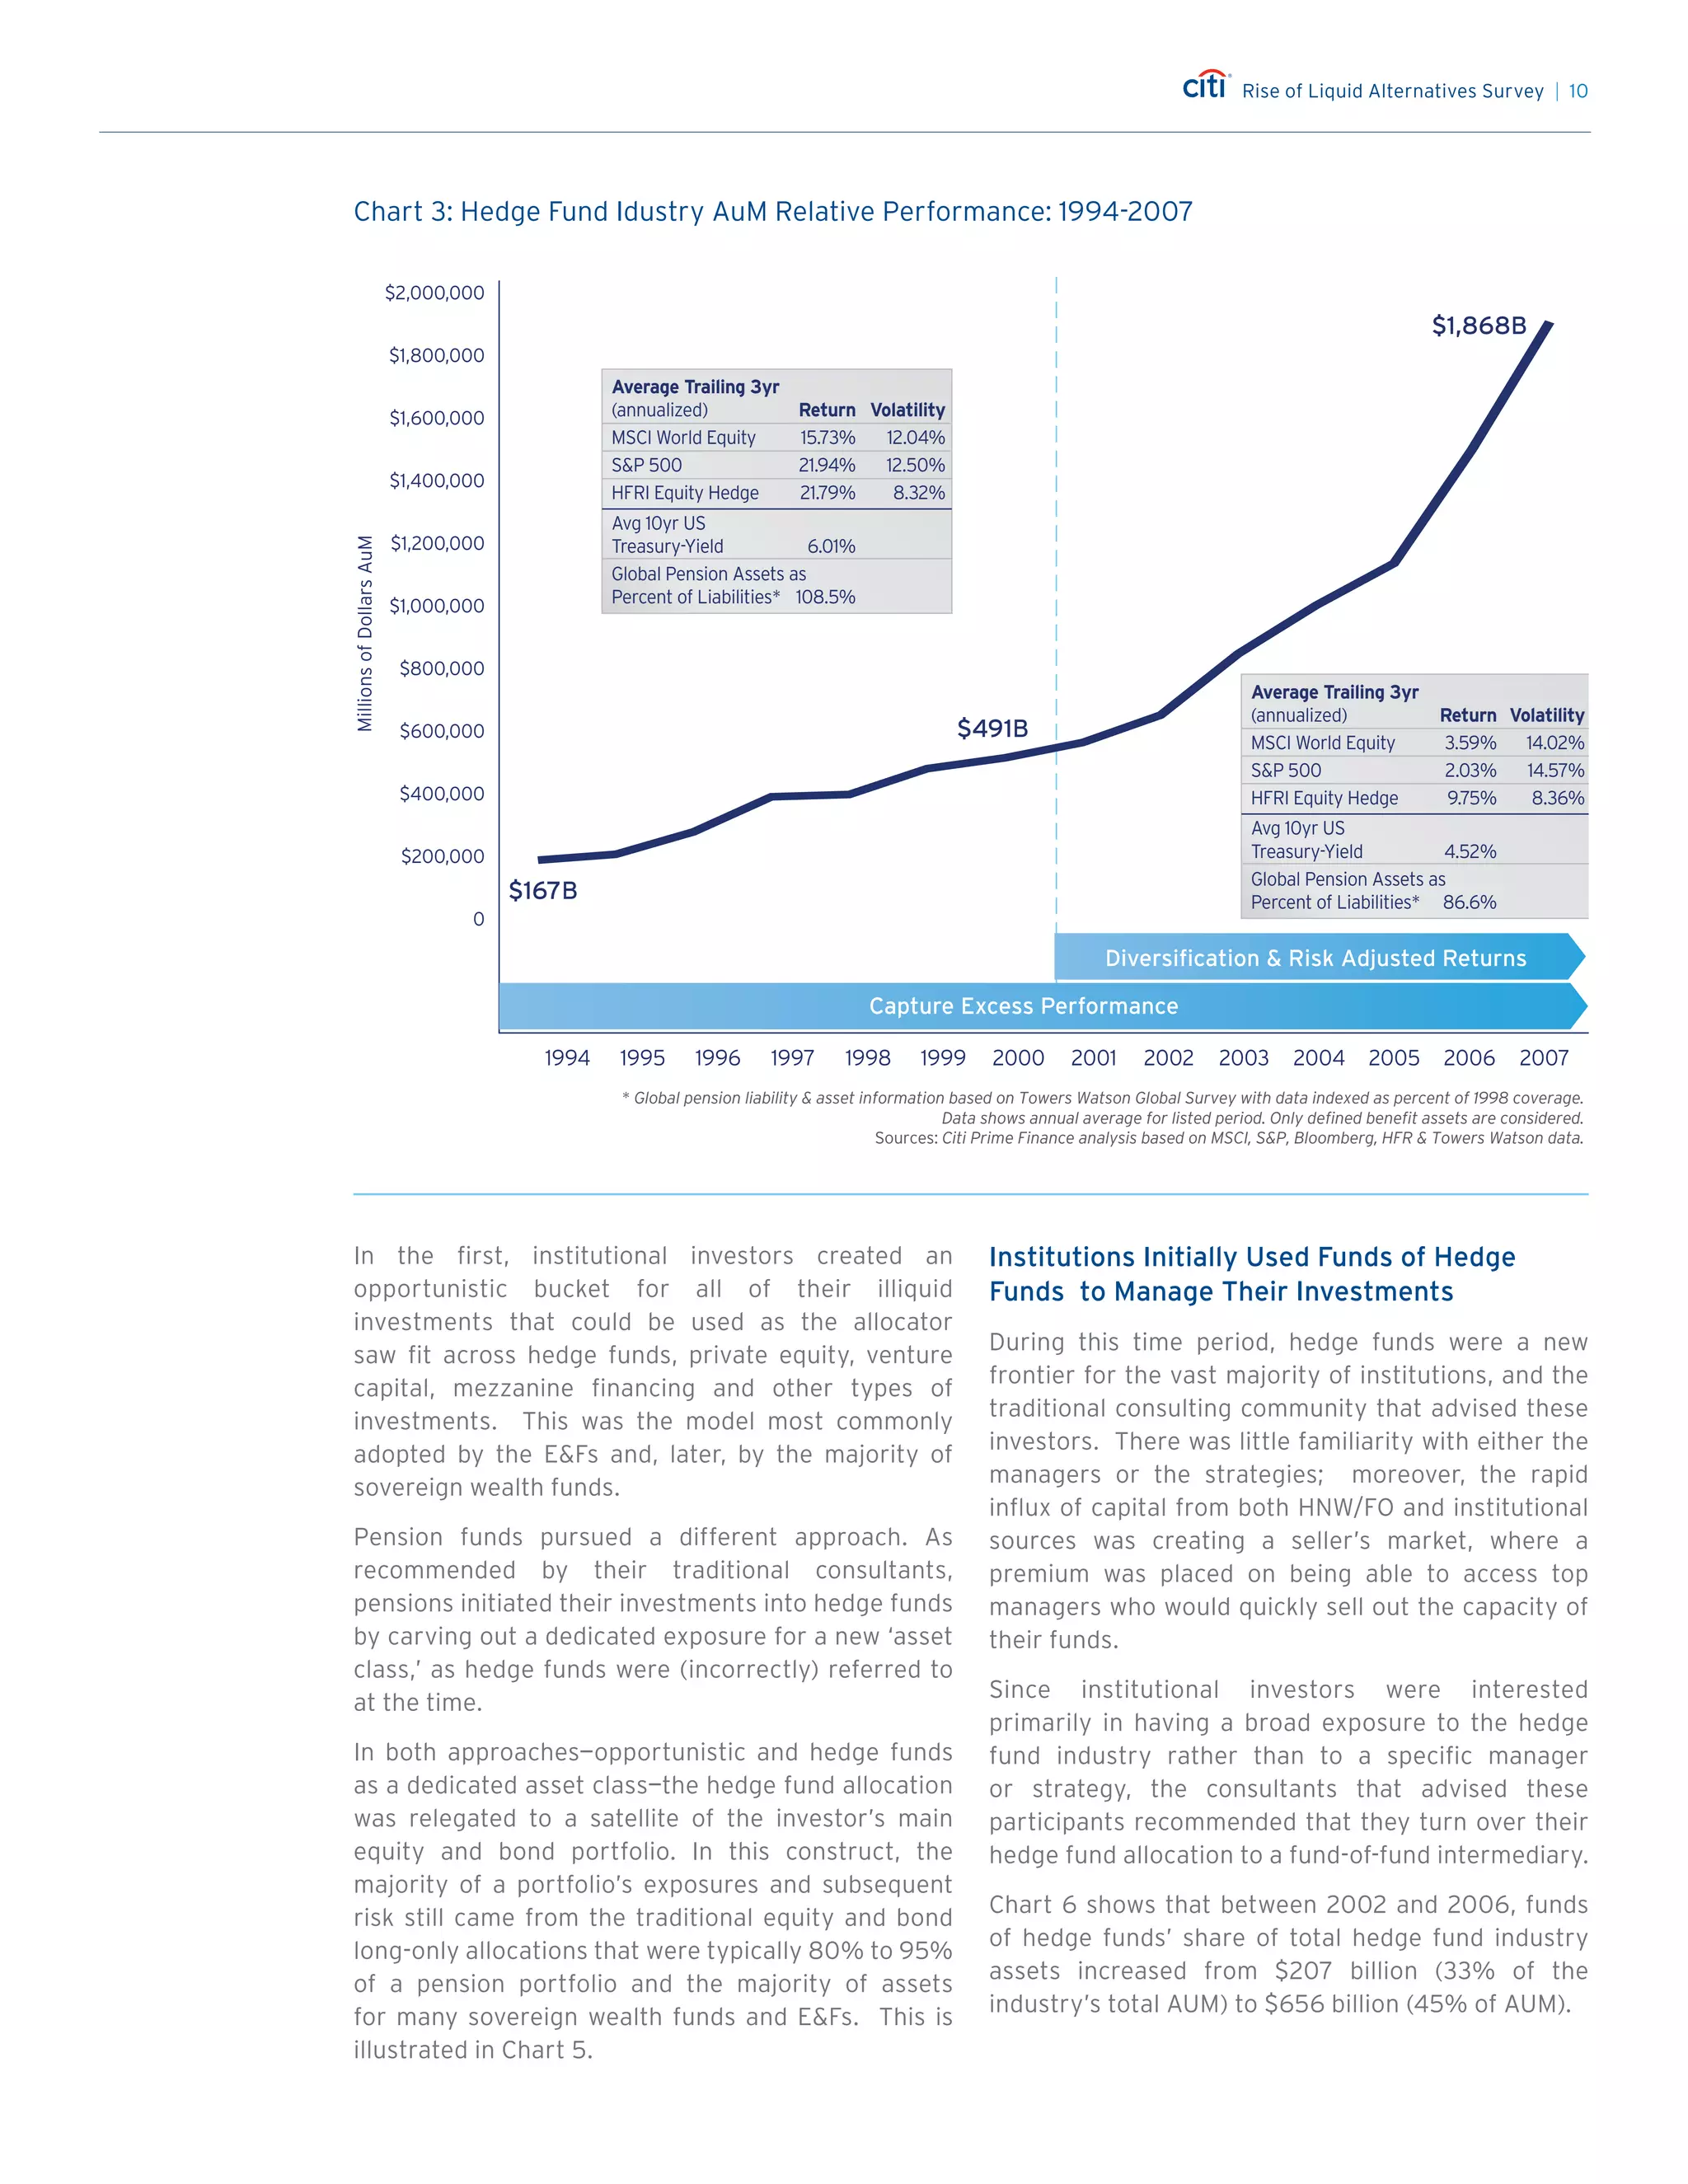
Average Trailing 3yr
(annualized) Return Volatility
MSCI World Equity 3.59% 14.02%
SP 500 2.03% 14.57%
HFRI Equity Hedge 9.75% 8.36%
Avg 10yr US
Treasury-Yield 4.52%
Global Pension Assets as
Percent of Liabilities* 86.6%
Average Trailing 3yr
(annualized) Return Volatility
MSCI World Equity 15.73% 12.04%
SP 500 21.94% 12.50%
HFRI Equity Hedge 21.79% 8.32%
Avg 10yr US
Treasury-Yield 6.01%
Global Pension Assets as
Percent of Liabilities* 108.5%
Average Trailing 3yr
(annualized) Return Volatility
MSCI World Equity 2.48% 18.16%
SP 500 2.45% 16.63%
HFRI Equity Hedge 3.30% 9.80%
Avg 10yr US
Treasury-Yield 3.04%
Global Pension Assets as
Percent of Liabilities* 74.0%
Chart 8
* Global pension liability asset information based on Towers Watson Global Survey with data indexed as percent of 1998 coverage.
Data shows annual average for listed period. Only defined benefit assets are considered.
Sources: Citi Prime Finance analysis based on MSCI, SP, Bloomberg, HFR Towers Watson data.
0
MillionsofDollarsAuM
Hedge Fund Industry AuM Relative Performance in Various Periods
‘95 ‘96 ‘97 ‘98 ‘99 ‘00‘94 ‘02 ‘03 ‘04 ‘05 ‘06 ‘12‘01
$2,500,000
$2,000,000
$1,500,000
$1,000,000
$500,000
Diversification Risk Adjusted Returns
$167B
$491B
$2,252B
Capture Excess Performance
‘07 ‘08 ‘09 ‘10 ‘11
Shock Absorption
$1,868B
Average Trailing 3yr
(annualized) Return Volatility
MSCI World Equity 3.59% 14.02%
SP 500 2.03% 14.57%
HFRI Equity Hedge 9.75% 8.36%
Avg 10yr US
Treasury-Yield 4.52%
Global Pension Assets as
Percent of Liabilities* 86.6%
Average Trailing 3yr
(annualized) Return Volatility
MSCI World Equity 15.73% 12.04%
SP 500 21.94% 12.50%
HFRI Equity Hedge 21.79% 8.32%
Avg 10yr US
Treasury-Yield 6.01%
Global Pension Assets as
Percent of Liabilities* 108.5%
Average Trailing 3yr
(annualized) Return Volatility
MSCI World Equity 2.48% 18.16%
SP 500 2.45% 16.63%
HFRI Equity Hedge 3.30% 9.80%
Avg 10yr US
Treasury-Yield 3.04%
Global Pension Assets as
Percent of Liabilities* 74.0%
Chart 8: Hedge Fund Industry AuM Relative Performance iv Various Periods](https://image.slidesharecdn.com/citiprimeservicesreportonliquidalternatives-130605155829-phpapp01/75/Citi-prime-services-report-on-liquid-alternatives-14-2048.jpg)


![Rise of Liquid Alternatives Survey | 30
Chart 21.
Post-GFC, the entire investor community, and
investors in Europe in particular, had a severe backlash
against liquidity issues that emerged during the crisis.
Institutional investors that had been prevented from
accessing their privately placed capital throughout
the crisis due to lock=ups and fund gates were
attracted to the daily, weekly or monthly liquidity
provisions of alternative UCITS. These institutions
sought approval from—and were encouraged by—
their constituents to reallocate assets to products
that offered greater regulation, public oversight and
disclosure requirements.
In the immediate wake of the GFC, the launch of
several UCITS platforms provided an access point
for institutional investors to make allocations into
a range of alternative UCITS funds. Further, these
platforms helped facilitate this trend by reducing the
costs for hedge fund managers looking to set up and
distribute an alternative UCITS product.
The result was a rapid recovery in alternative
UCITS AUM. As noted in Chart 21, alternative UCITS
products had recouped almost all of their pre-GFC
capital by 2010.
The caliber of firms willing to launch alternative
UCITS products was one factor helping to speed this
recovery. Previously, the products had been emerging
primarily from asset manager organizations; the wave
of launches post-GFC were coming from recognized
names in the hedge fund industry. Indeed, SEI/
Strategic Insight notes that alternative UCITS funds
launched post-2007 garnered 70% of incoming flows
in the 2 years immediately following the GFC.
“ We were approached by an existing investor that had been in our
sovereign debt fund for 6-7 years. They are an insurer and because
of Solvency II, they have to come out of unregulated hedge funds and
into the registered space. They have said that they are willing to seed a
UCITS fund and that they don’t mind setting it up as a sole investor.”
— $1.0 to 5.0 Billion AUM Hedge Fund
“ Our current UCITS fund is on [a bank] platform. We have used it as a
means of gaining access to European investors who can only invest via
UCITS vehicles.”
— $1.0 AUM Billion Hedge Fund
“ We are thinking about UCITS again and would explore going on to a
platform as we see this as cost efficiency. Our Long bias product is easy
to put into the UCITS wrapper.”
— $1.0 Billion AUM Hedge Fun
Chart 21
Source: SEI/Strategic Insight data.
0
$250,000
$200,000
$100,000
$150,000
$50,000
2008 2009 2010 2011 YTD
11/2012
Changes in Alternative UCITS AuM:
2008-November 2012
MillionsofDollars
Chart 21: Changes in Alternative UCITS AuM:
2008-November 2012](https://image.slidesharecdn.com/citiprimeservicesreportonliquidalternatives-130605155829-phpapp01/75/Citi-prime-services-report-on-liquid-alternatives-30-2048.jpg)


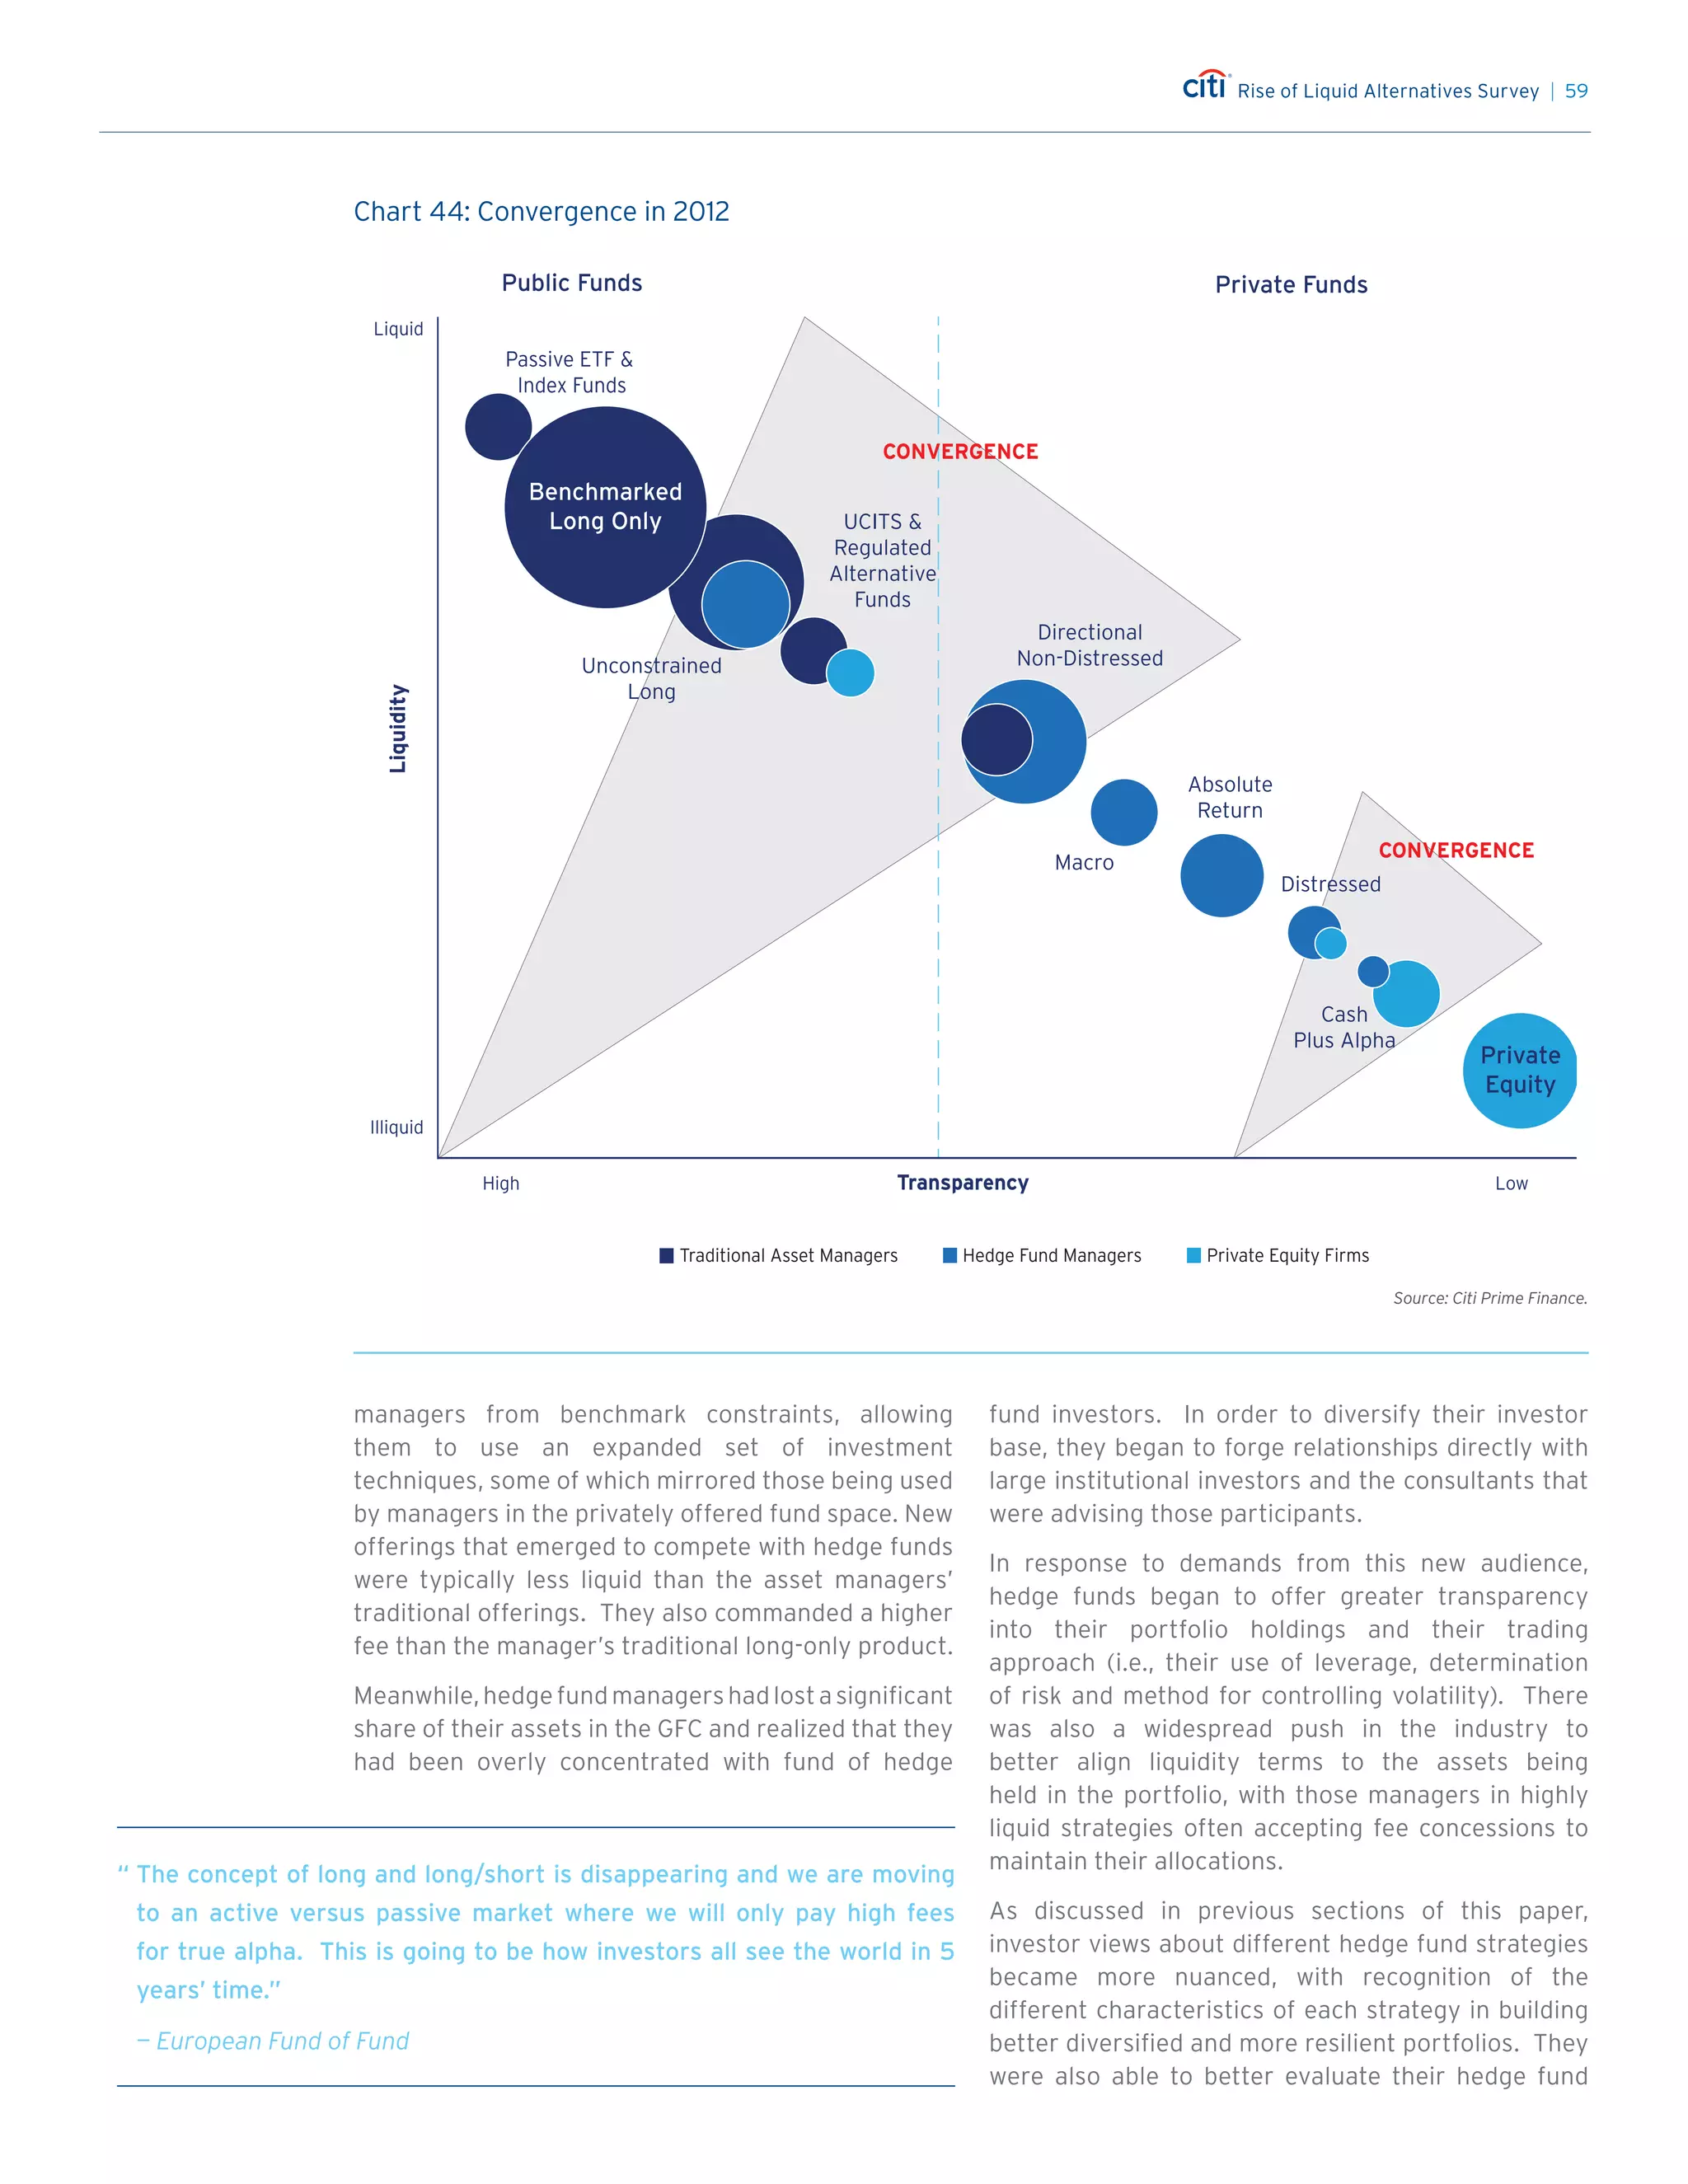
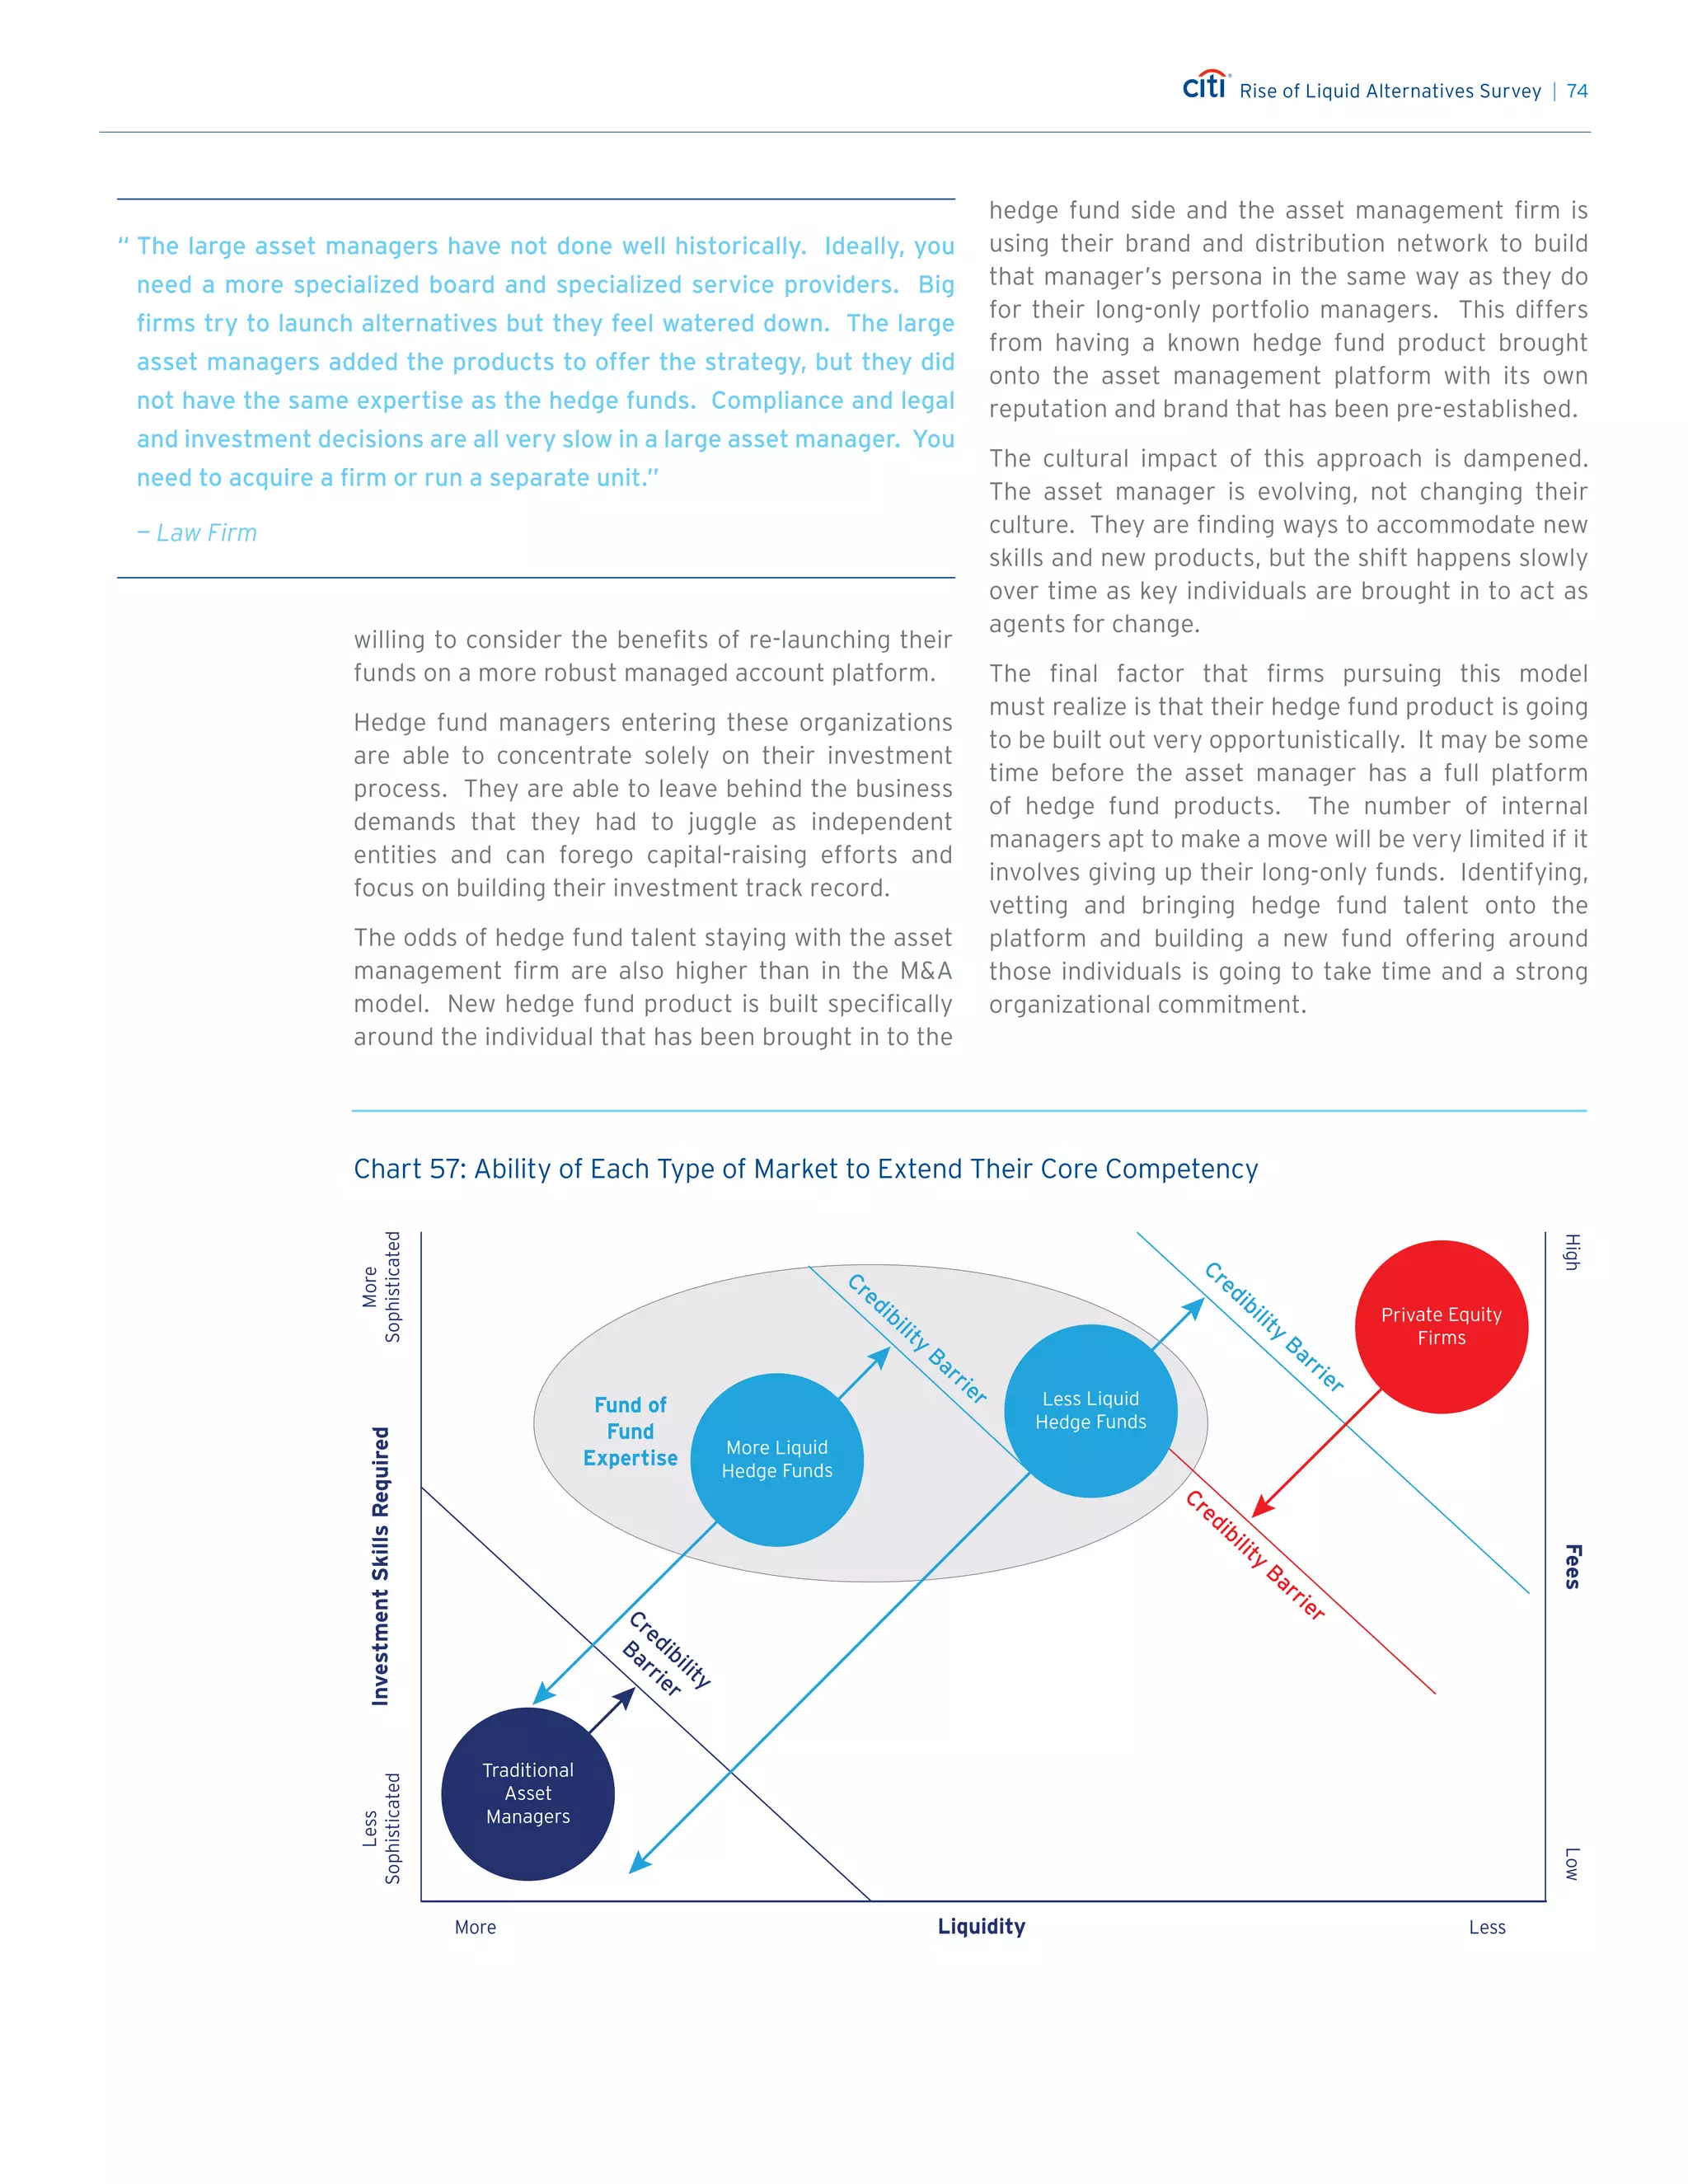
![Rise of Liquid Alternatives Survey | 60
managers’ positions in conjunction with their long-
only manager positions and gain insight into their
consolidated exposures, thus allowing them to focus
more carefully on the risk factors in their portfolio.
The impact of these two trends is illustrated by the
large ‘convergence zone’ highlighted in Chart 44.
Both asset managers and hedge funds began to offer
a similar set of products that spanned both sides
of the publically offered and privately offered fund
dividing line.
A similar pattern was taking place at the less liquid
end of the spectrum. Hedge fund managers were
able to step into funding gaps left in the wake of
the GFC and begin to engineer less liquid products
with associated cash flows that looked much more
like traditional private equity investments. These
“cash + alpha” products proved very attractive to
an institutional audience that was in search of yield,
given record low interest rates.
During the same time, private equity firms were
coming under pressure from their investor base for
being under-invested and sitting on too much cash in
their portfolios. They began to look for more liquid
investment opportunities and to expand their set
of product offerings. The result was a smaller, but
equally important, convergence zone that is also
highlighted in Chart 44.
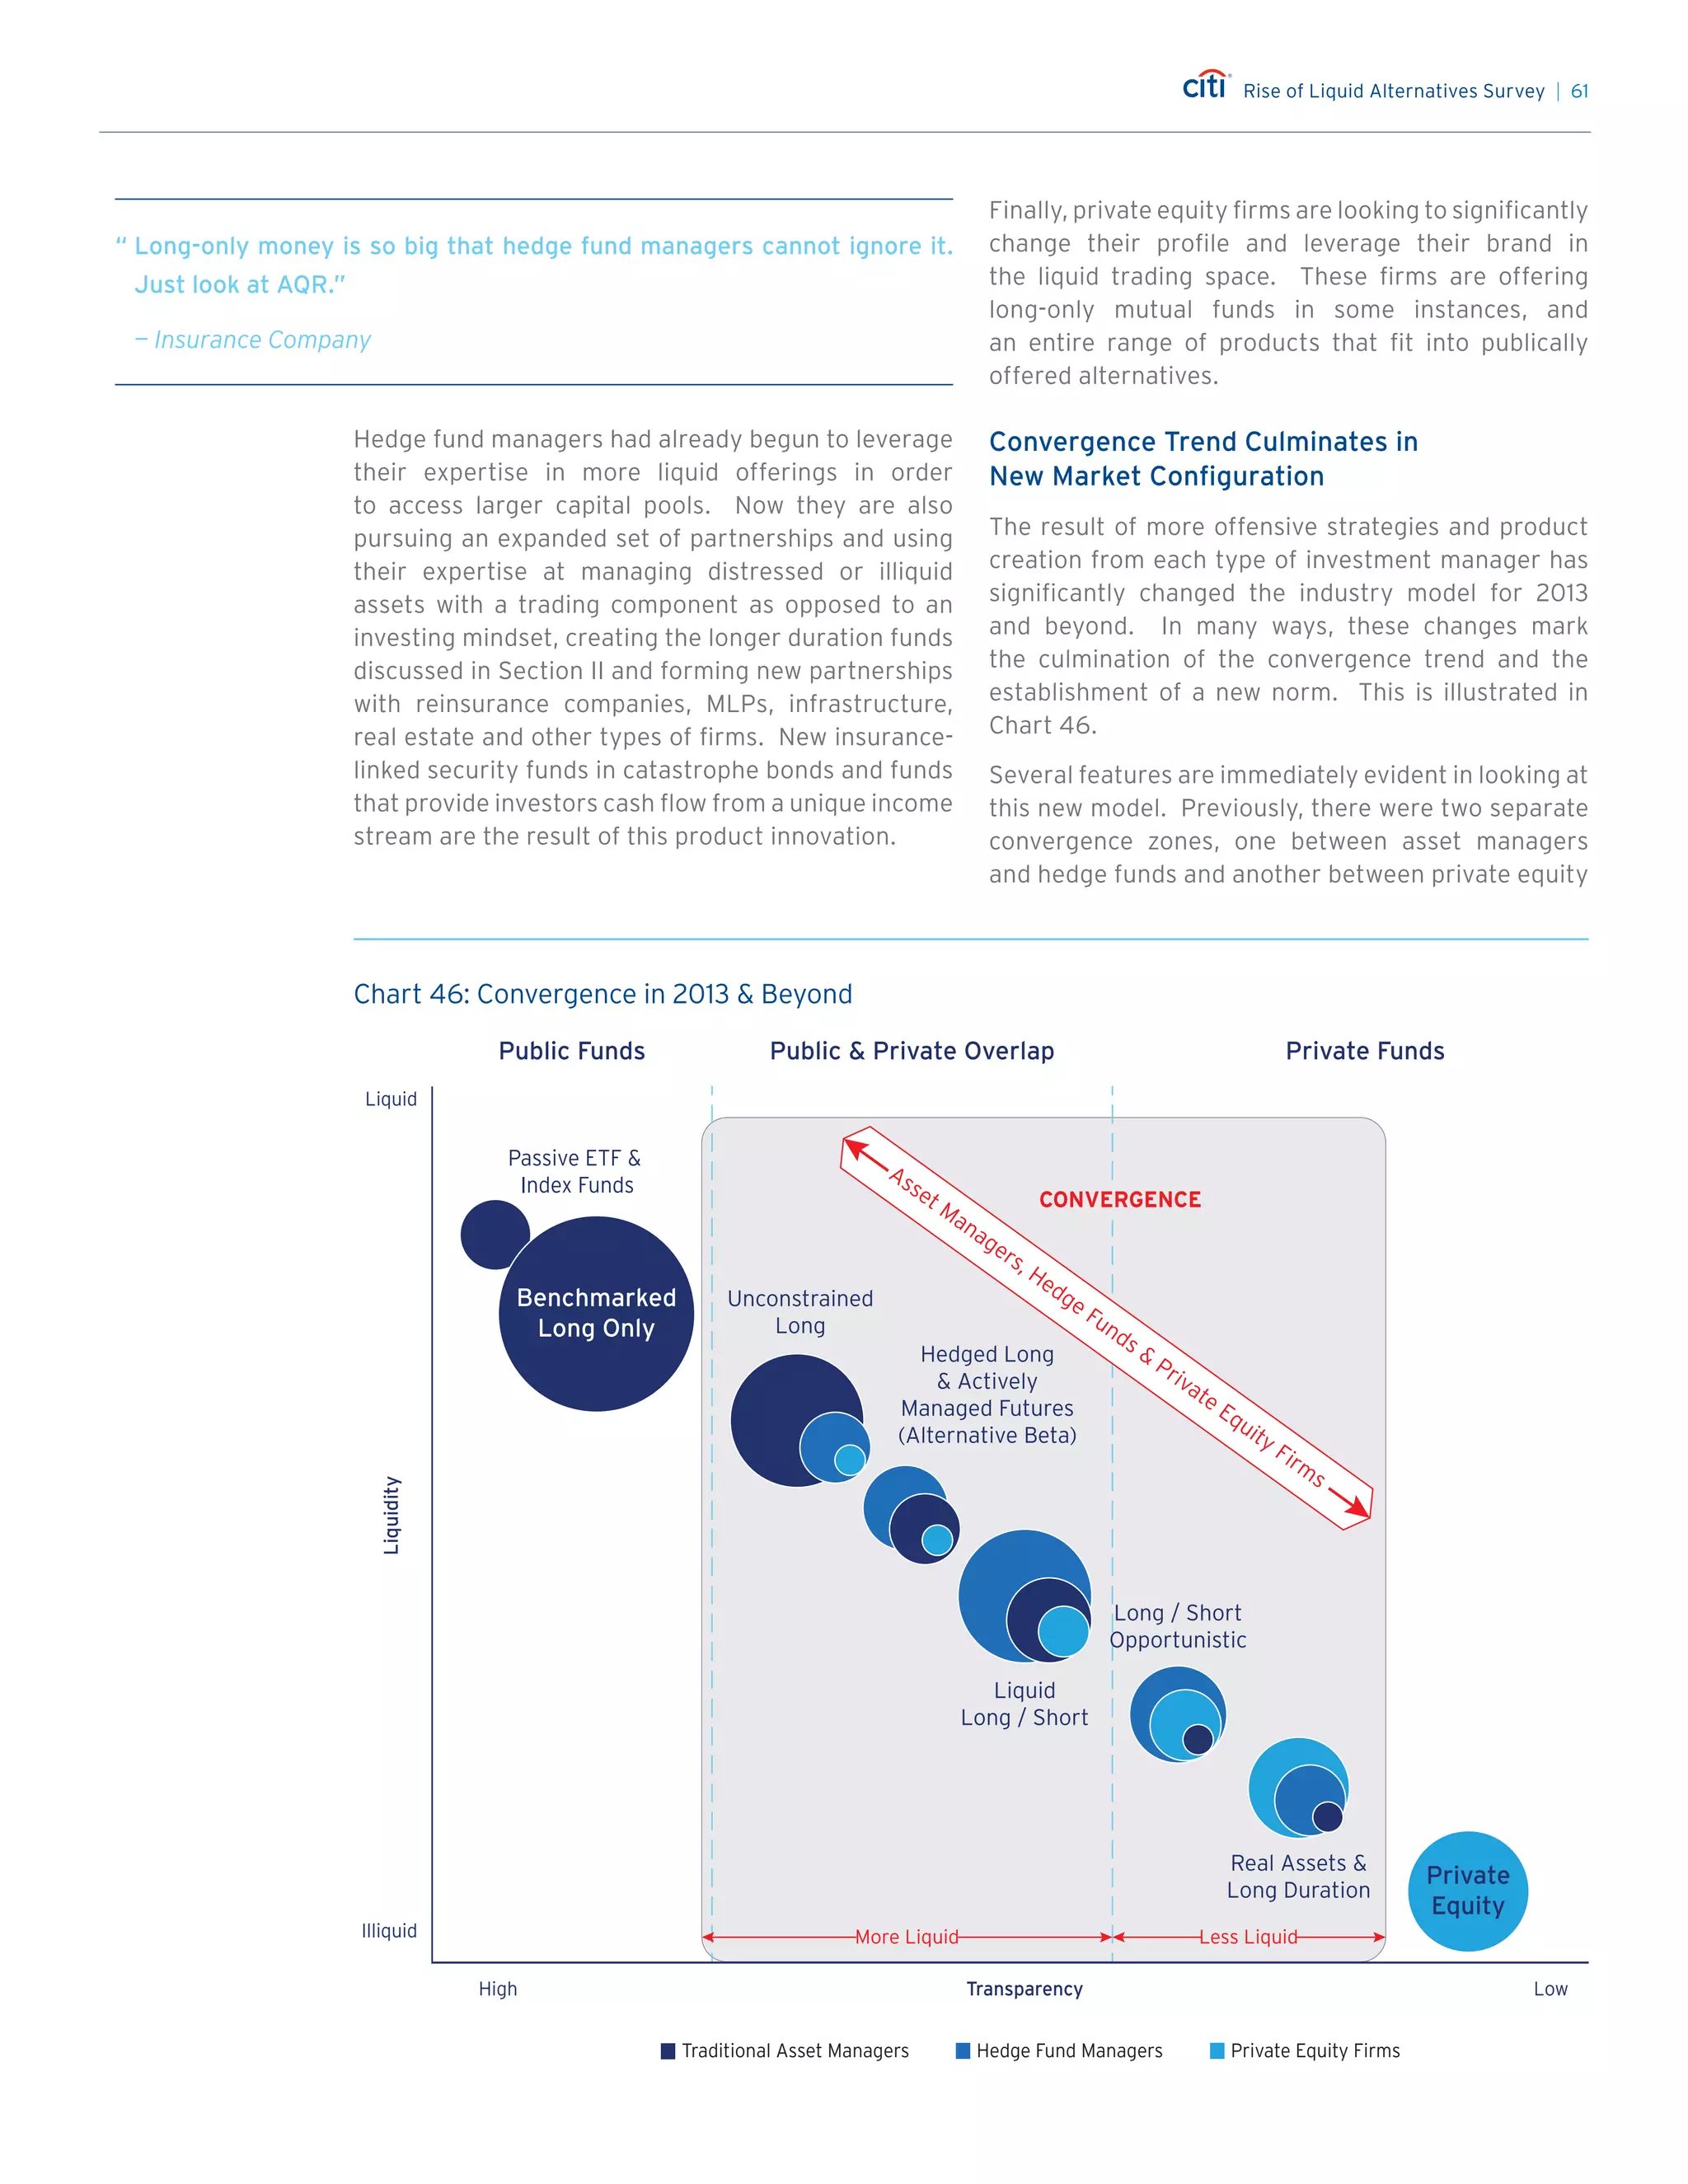
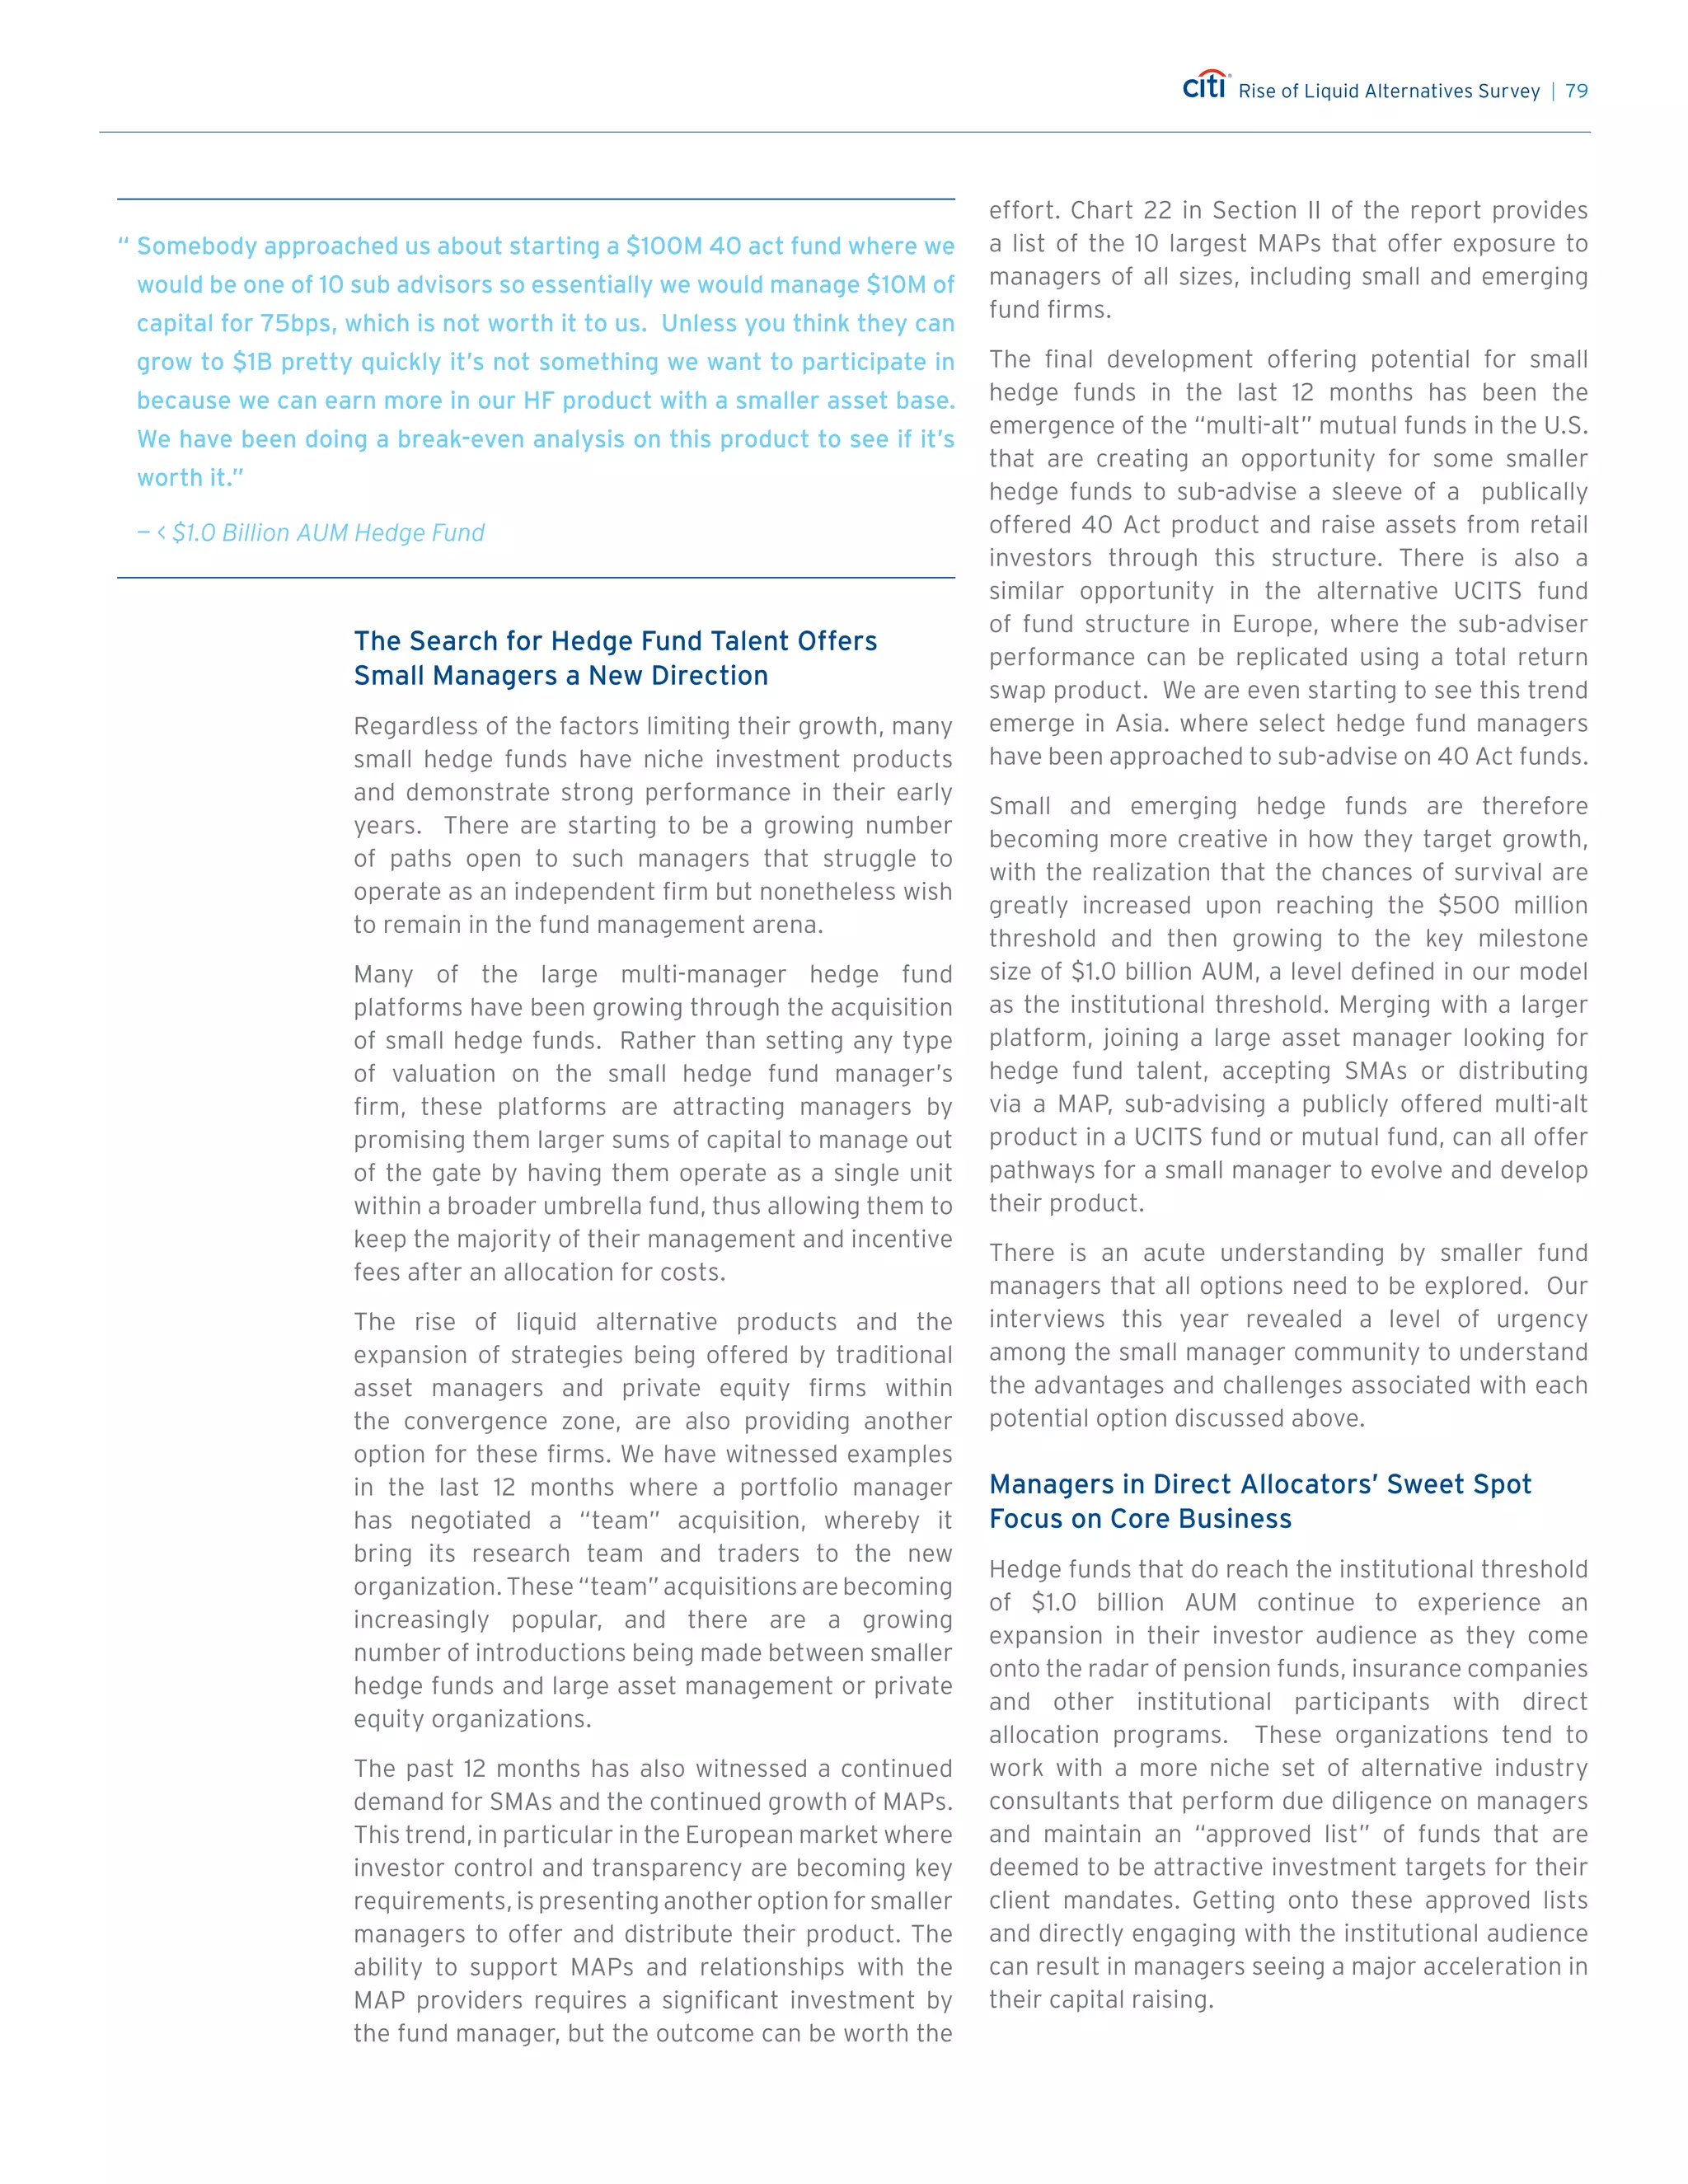
Factors Driving Convergence Shift from
Defensive to Offensive
Up until 2012, much of what was driving product
convergence were defensive reactions to ongoing
market developments. Asset managers had to
protect their franchise[s?], hedge fund managers had
to regain assets lost in the GFC and diversify their
investor base and private equity firms had to prove
they could effectively deploy their capital. A more
positive set of drivers has emerged in the past 12
months, and firms in each investment management
segment are taking a more offensive posture in
pursuing new opportunities.
Chart 45 highlights these new drivers. Asset
managers are beginning to think more holistically
abouttheirinstitutionalinvestmentaudience.Toretain
investor allocations, managers need to offer holistic
solutions that can span a broad liquidity spectrum
including products with an inherent illiquidity
premium. This move demonstrates recognition on
the part of asset managers that the time horizon and
return requirements of large institutional investors
are more complex than in previous years, and that
they need to be able to offer a range of investment
options in order to be a long-term strategic partner.
“ We use active management allocations for more concentrated funds
that have higher volatility but not necessarily higher risk. We view
hedge funds as a compensation scheme and they are the epitome of
active management.”
— Full Service Consultant
“ When we think about traditional active management, that’s a business
that’s going to be challenged.”
— Asset Manager
“ The private equity companies have been under drawn and this is causing
LPs to move away from the larger asset gathering firms who cannot
deploy their capital.”
— Third Party Marketing Intermediary
Chart 45
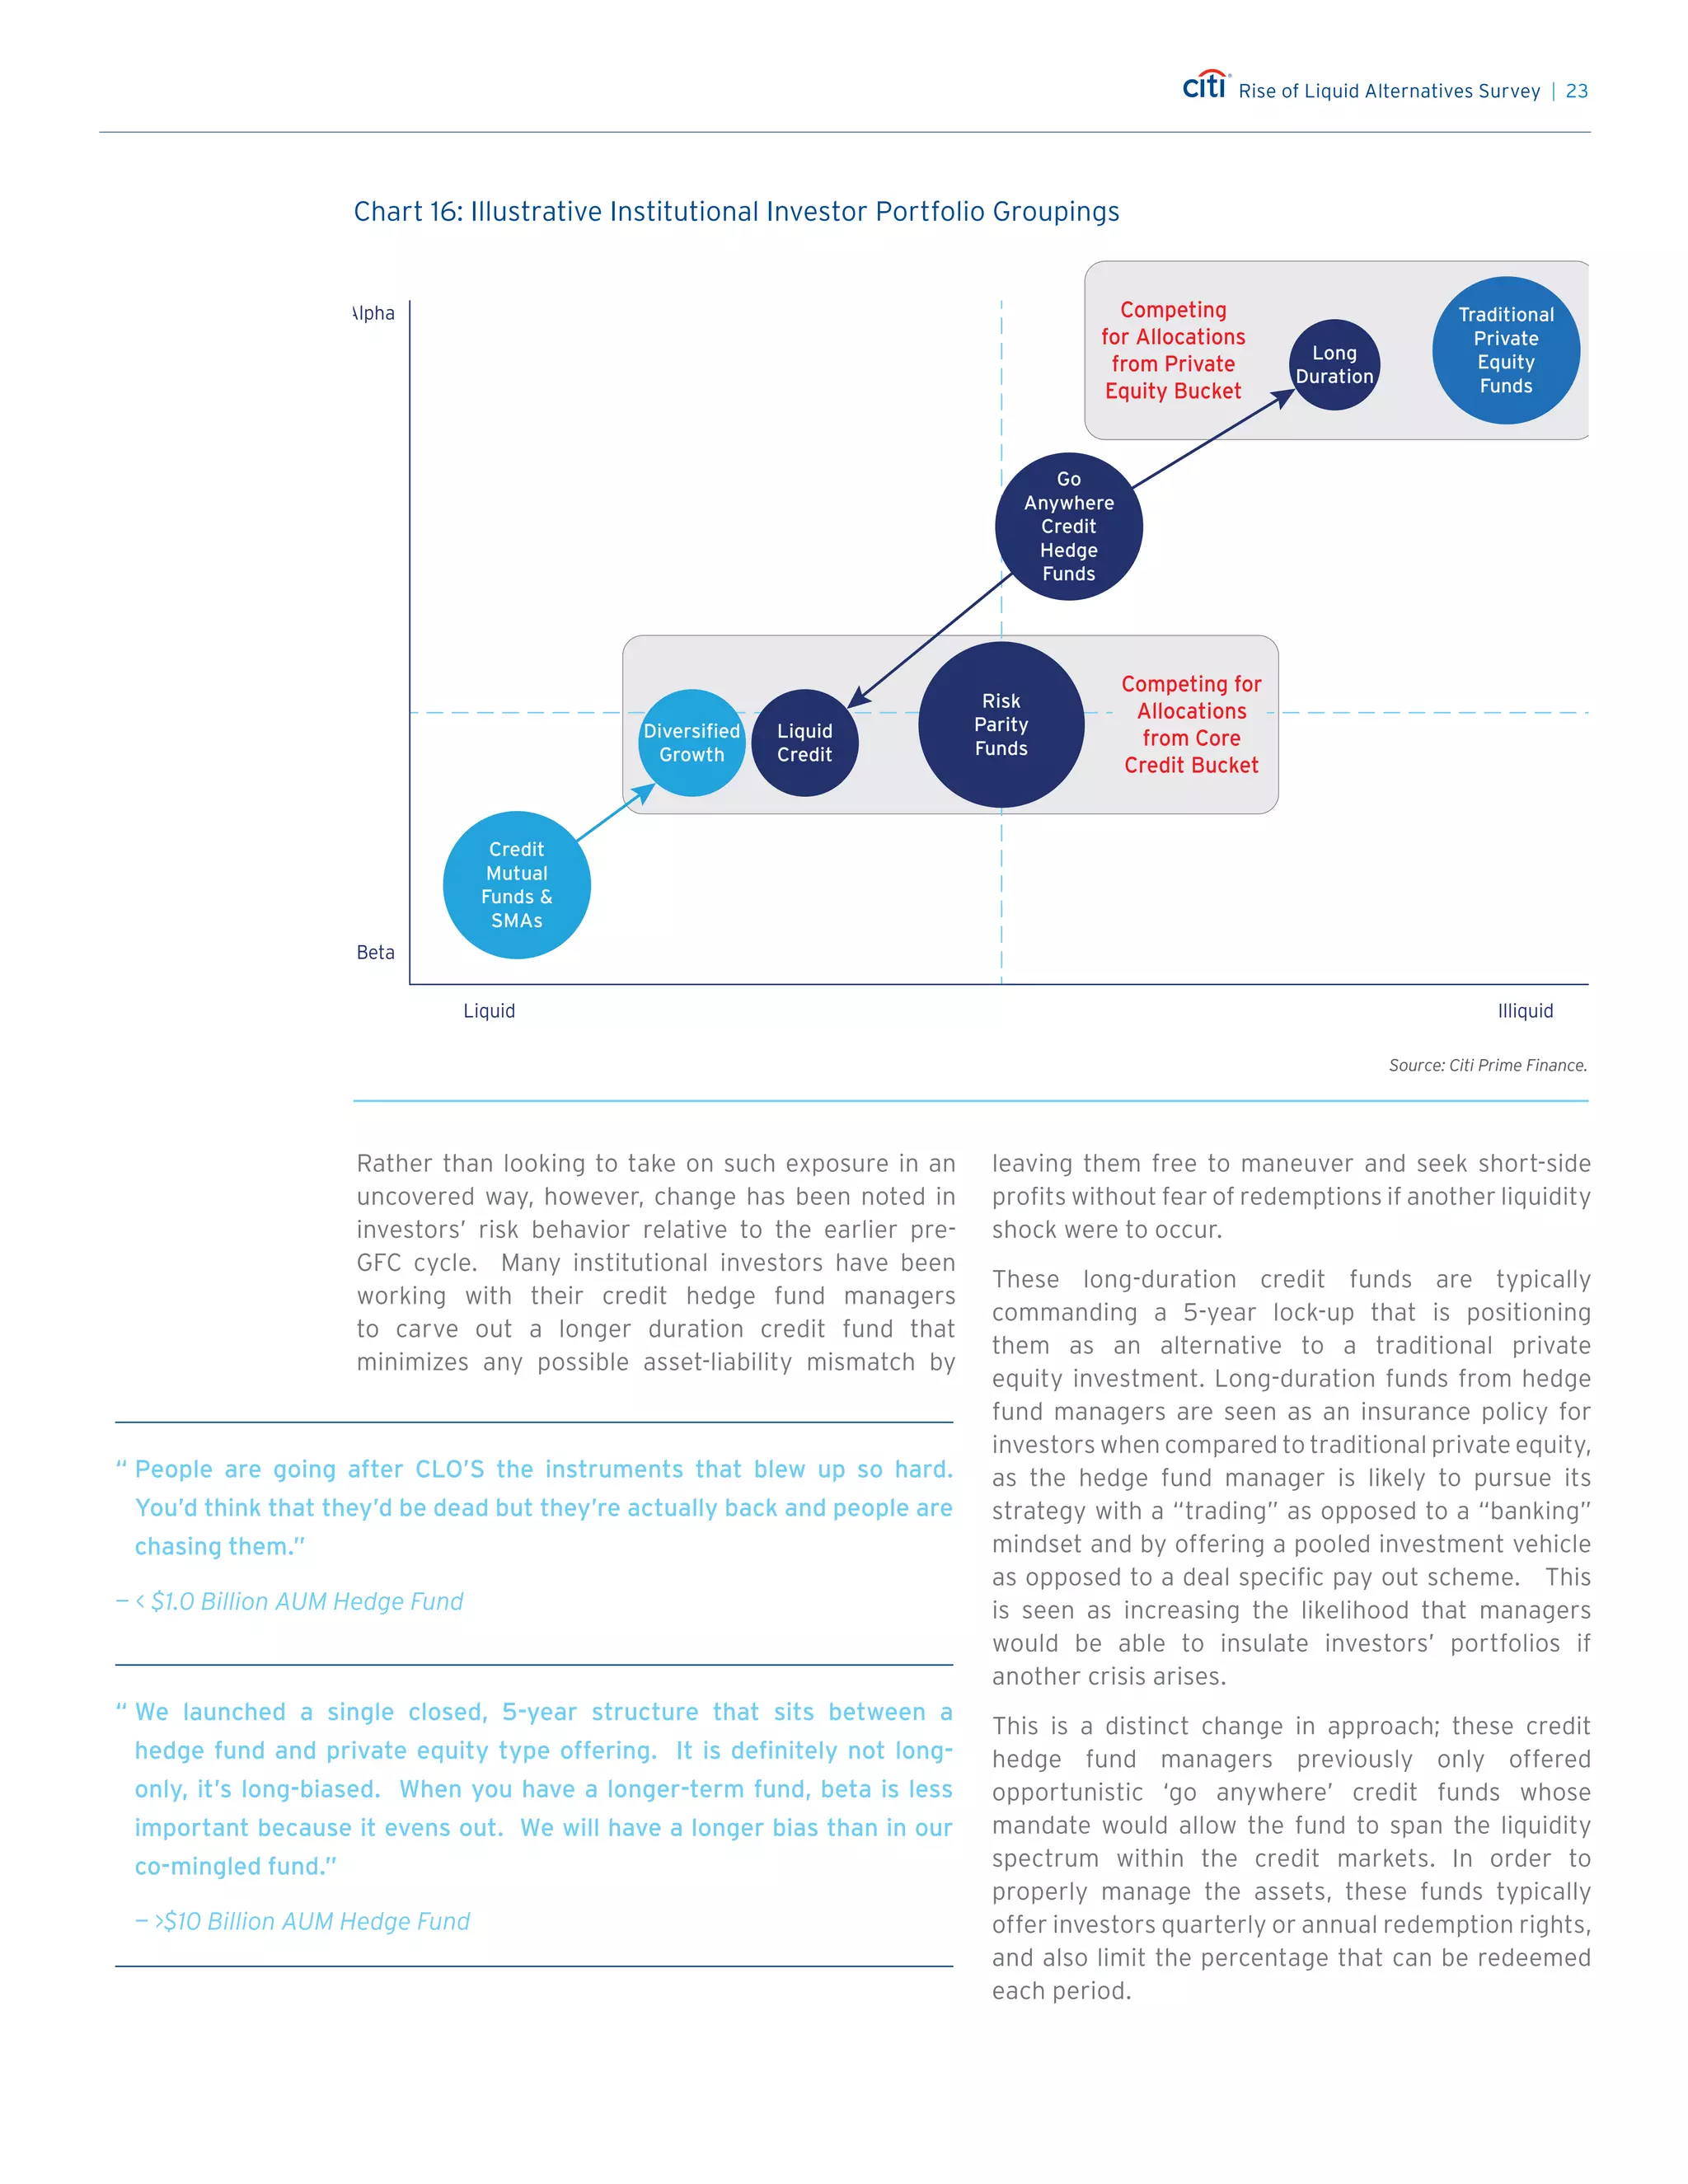
Source: Citi Prime Finance.
Factors Driving Convergence in 2013 Beyond
High Transparency Low
LiquidityIlliquidLiquid
Public Funds Private Funds
Private Equity Firms
Leverage Investment Expertise
Brand to Build Broad Capital Base Create Liquidity
Diversify Investor Base
Traditional Asset Managers
Hedge Fund Managers
Create More Stable Capital
Recapture Illiquidity Premiums
Create Institutional Solutions
Preserve Client Base
Protect Active
Management Franchise
Access Larger Capital Pool
Diversify Investor Base
Chart 45
Source: Citi Prime Finance.
Factors Driving Convergence in 2013 Beyond
High Transparency Low
LiquidityIlliquidLiquid
Public Funds Private Funds
Private Equity Firms
Leverage Investment Expertise
Brand to Build Broad Capital Base Create Liquidity
Diversify Investor Base
Traditional Asset Managers
Hedge Fund Managers
Create More Stable Capital
Recapture Illiquidity Premiums
Create Institutional Solutions
Preserve Client Base
Protect Active
Management Franchise
Access Larger Capital Pool
Diversify Investor Base
Chart 45: Factors Driving Convergence
in 2013 and Beyond](https://image.slidesharecdn.com/citiprimeservicesreportonliquidalternatives-130605155829-phpapp01/75/Citi-prime-services-report-on-liquid-alternatives-60-2048.jpg)