Download free for 30 days
Sign in
Upload
Language (EN)
Support
Business
Mobile
Social Media
Marketing
Technology
Art & Photos
Career
Design
Education
Presentations & Public Speaking
Government & Nonprofit
Healthcare
Internet
Law
Leadership & Management
Automotive
Engineering
Software
Recruiting & HR
Retail
Sales
Services
Science
Small Business & Entrepreneurship
Food
Environment
Economy & Finance
Data & Analytics
Investor Relations
Sports
Spiritual
News & Politics
Travel
Self Improvement
Real Estate
Entertainment & Humor
Health & Medicine
Devices & Hardware
Lifestyle
Change Language
Language
English
Español
Português
Français
Deutsche
Cancel
Save
Submit search
EN
Uploaded by
monster2010
32 views
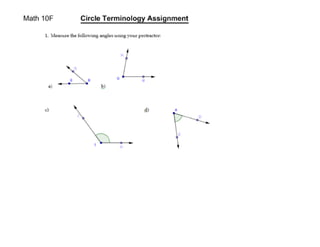
Circles terminology asmt
Education
◦
Read more
0
Save
Share
Embed
Embed presentation
Download
Download to read offline
1
/ 2
2
/ 2
More Related Content
PDF
Gabian
by
EVAJUNIOR
PDF
Thanksgiving
by
Barbara Kachenko
PPTX
Redes sociales
by
alexachmorales
PDF
Fotos mis hijos tecnologia iii
by
estebanbernardo
PPTX
Passive voice
by
Elena (IES Cervantes)
PDF
6.5 parallel and perpendicular equations
by
monster2010
PDF
Rate of change
by
monster2010
DOCX
Test 1
by
monster2010
Gabian
by
EVAJUNIOR
Thanksgiving
by
Barbara Kachenko
Redes sociales
by
alexachmorales
Fotos mis hijos tecnologia iii
by
estebanbernardo
Passive voice
by
Elena (IES Cervantes)
6.5 parallel and perpendicular equations
by
monster2010
Rate of change
by
monster2010
Test 1
by
monster2010
More from monster2010
PDF
Suare roots and cube roots
by
monster2010
PDF
3.1 gcf and lcm
by
monster2010
PDF
Estimating from graphs
by
monster2010
PDF
3.1a 3.c answers
by
monster2010
PDF
3.1a 3.c answers
by
monster2010
PDF
3.1a 3.c answers
by
monster2010
PDF
Matching examples
by
monster2010
PDF
Master 3 1
by
monster2010
PDF
Page 174 investigate
by
monster2010
PDF
Divisibility rules
by
monster2010
PDF
Divisiblilty asmt
by
monster2010
PDF
Applications of sinusoidal functions assignment answers
by
monster2010
DOC
Applications of sinusoidal functions assignment
by
monster2010
DOC
Applications of sinusoidal functions
by
monster2010
DOC
Sinusoidal graphs example
by
monster2010
PDF
Radians notes
by
monster2010
DOC
Sketching a sinusoidal graph
by
monster2010
DOC
Equations
by
monster2010
PDF
Graphing from equations asmt
by
monster2010
PDF
Graphing from equations notes
by
monster2010
Suare roots and cube roots
by
monster2010
3.1 gcf and lcm
by
monster2010
Estimating from graphs
by
monster2010
3.1a 3.c answers
by
monster2010
3.1a 3.c answers
by
monster2010
3.1a 3.c answers
by
monster2010
Matching examples
by
monster2010
Master 3 1
by
monster2010
Page 174 investigate
by
monster2010
Divisibility rules
by
monster2010
Divisiblilty asmt
by
monster2010
Applications of sinusoidal functions assignment answers
by
monster2010
Applications of sinusoidal functions assignment
by
monster2010
Applications of sinusoidal functions
by
monster2010
Sinusoidal graphs example
by
monster2010
Radians notes
by
monster2010
Sketching a sinusoidal graph
by
monster2010
Equations
by
monster2010
Graphing from equations asmt
by
monster2010
Graphing from equations notes
by
monster2010
Recently uploaded
PDF
19 January 2026 Andreas Schleicher Digital Education Outlook 2026.pdf
by
EduSkills OECD
PPTX
Віртуальна виставка «Гра в життя» – «The Game of Life»
by
Vinnytsia Regional Universal Scientific Library named after Valentin Otamanovsky
PDF
Exp.No.2 To study glassware used in Medicinal Chemistry.
by
Pradeep Swarnkar
PPTX
Blood, Blood Composition, Blood Groups, Disorders of Blood.pptx
by
Ashish Umale
PPTX
MELA QUIZ 2026 | Silchar Medical College & Hospital | 11-01-2026
by
Ultimatewinner0342
PPTX
When UDL is no longer enough: Examining post-UDL reflections on inclusive des...
by
Frederic Fovet
PPTX
GW4 BioMed Interview Support Webinar 2026
by
GW4BioMedMRCDTP
PPTX
Standard Development Principles in Assessing the Quality of Opinion Editorial...
by
astairelyxx
PPTX
DISCHARGE FROM HOSPITAL (JHASKETAN )(1).pptx
by
JK NURSING VIBES ONLY JHASKETAN KUANAR
PDF
Myth_History_Climate__Reading_Gun_Island.pdf
by
Bhargav Makwana
PDF
eSAT-for-Teachers-2025-2028-ver.2-Nov2025 idp.pdf
by
JunmelValientes
PDF
3.Empires-and-Kingdoms-6th-to-10th-Centuries ppt.pdf/Social science Grade 7 p...
by
Sandeep Swamy
PDF
Fidelity to Energy: A Critical Analysis of Baz Luhrmann’s Intersemiotic Trans...
by
Kruti Vyas
PDF
2.India-and-Her-Neighbours ppt.pdf/Social science Grade 7 part -2 By:K SANDE...
by
Sandeep Swamy
PPTX
Palta Utsav Open Quiz Prelims Answer.pptx
by
Sourav Kr Podder
PPTX
THEORIES OF LEARNING Shilpa Hotakar.pptx
by
SHILPA HOTAKAR
PDF
Halogen-Derivatives.pdf/BY K SANDEEP SWAMY/FOR ONLINE CLASSES CONTACT 9491878325
by
Sandeep Swamy
PPTX
Prepositions of Place : English Grammar Presentation
by
Pintoo Dhillon
PPTX
History in your Hands Class 5 January 2026 online slides.pptx
by
EilsONeill
PPTX
OCCULTISM IN JEHOVAH'S WITNESSES' ARTWORK
by
Daniel Barnea
19 January 2026 Andreas Schleicher Digital Education Outlook 2026.pdf
by
EduSkills OECD
Віртуальна виставка «Гра в життя» – «The Game of Life»
by
Vinnytsia Regional Universal Scientific Library named after Valentin Otamanovsky
Exp.No.2 To study glassware used in Medicinal Chemistry.
by
Pradeep Swarnkar
Blood, Blood Composition, Blood Groups, Disorders of Blood.pptx
by
Ashish Umale
MELA QUIZ 2026 | Silchar Medical College & Hospital | 11-01-2026
by
Ultimatewinner0342
When UDL is no longer enough: Examining post-UDL reflections on inclusive des...
by
Frederic Fovet
GW4 BioMed Interview Support Webinar 2026
by
GW4BioMedMRCDTP
Standard Development Principles in Assessing the Quality of Opinion Editorial...
by
astairelyxx
DISCHARGE FROM HOSPITAL (JHASKETAN )(1).pptx
by
JK NURSING VIBES ONLY JHASKETAN KUANAR
Myth_History_Climate__Reading_Gun_Island.pdf
by
Bhargav Makwana
eSAT-for-Teachers-2025-2028-ver.2-Nov2025 idp.pdf
by
JunmelValientes
3.Empires-and-Kingdoms-6th-to-10th-Centuries ppt.pdf/Social science Grade 7 p...
by
Sandeep Swamy
Fidelity to Energy: A Critical Analysis of Baz Luhrmann’s Intersemiotic Trans...
by
Kruti Vyas
2.India-and-Her-Neighbours ppt.pdf/Social science Grade 7 part -2 By:K SANDE...
by
Sandeep Swamy
Palta Utsav Open Quiz Prelims Answer.pptx
by
Sourav Kr Podder
THEORIES OF LEARNING Shilpa Hotakar.pptx
by
SHILPA HOTAKAR
Halogen-Derivatives.pdf/BY K SANDEEP SWAMY/FOR ONLINE CLASSES CONTACT 9491878325
by
Sandeep Swamy
Prepositions of Place : English Grammar Presentation
by
Pintoo Dhillon
History in your Hands Class 5 January 2026 online slides.pptx
by
EilsONeill
OCCULTISM IN JEHOVAH'S WITNESSES' ARTWORK
by
Daniel Barnea
Download