Downloaded 100 times


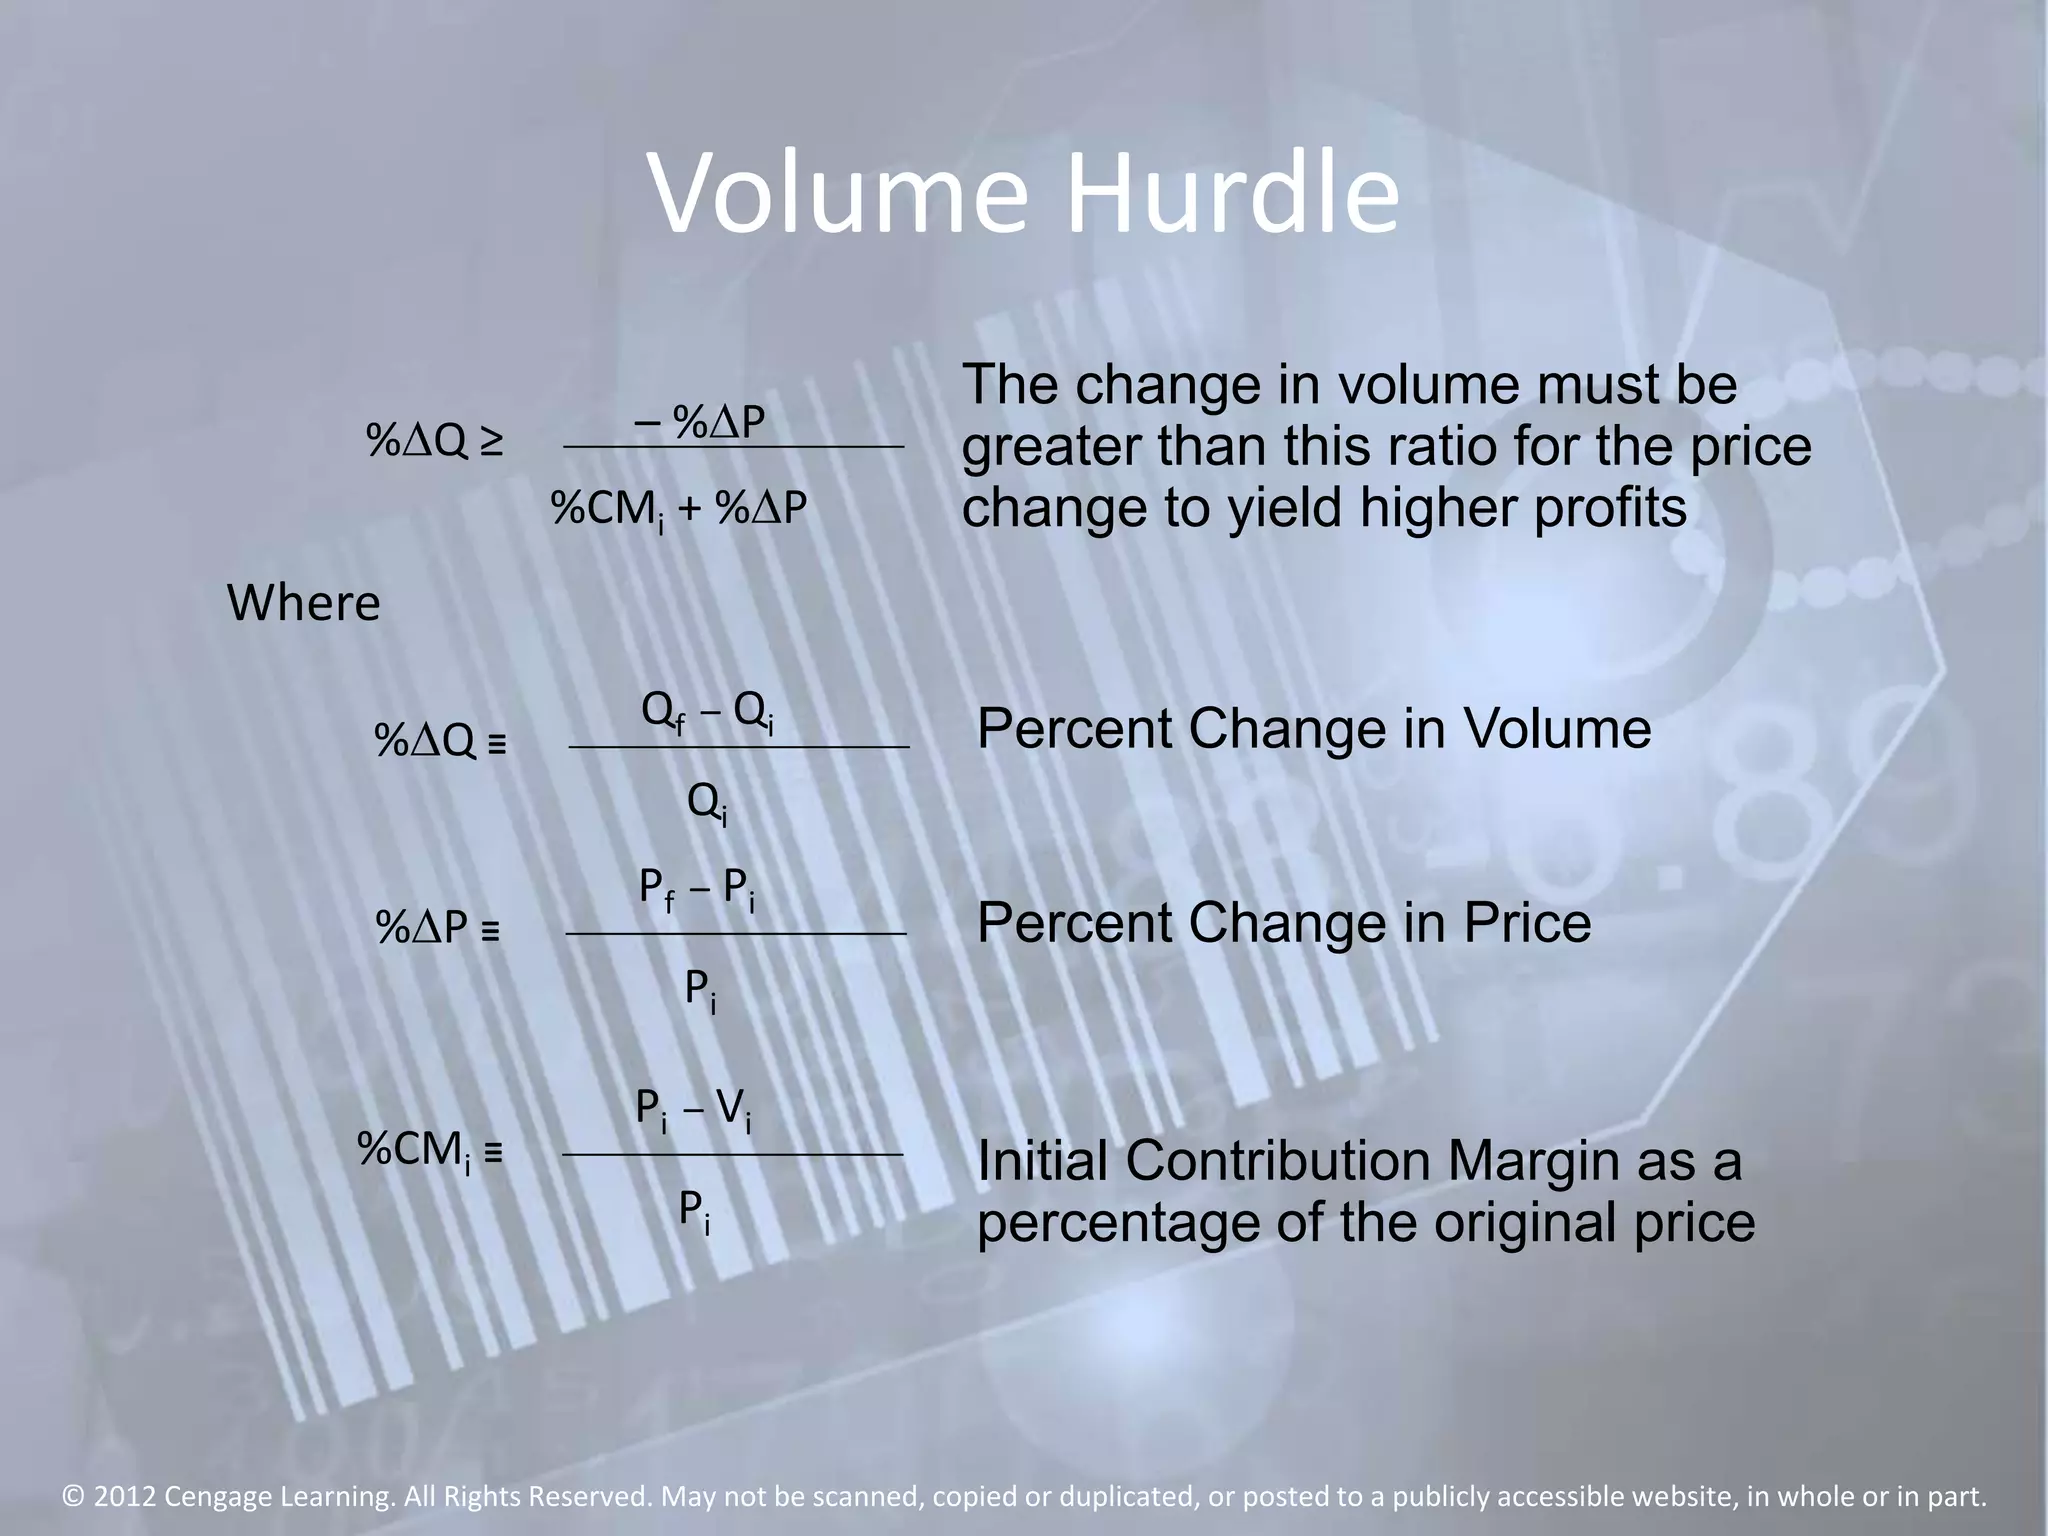


This document discusses using profit sensitivity analysis to determine the volume hurdles required for price changes to be profitable. It explains how to calculate volume hurdles and how they differ for price increases versus decreases. Elasticity of demand is also discussed, with inelastic markets favoring price hikes and elastic markets favoring price cuts. Optimal pricing points can be estimated using elasticity, though the analysis notes challenges in accurately measuring elasticity.


