Characterization of NPs(Optical, Microscopy, XRD, DLS,NTA).pdf
The current document summarizes some methods of characterization of nanoparticles such as UV-VIS Spectrophotometer, Electron microscopy, X-ray diffraction, dynamic light scattering and Nanoparticle tracking analysis.
Characterization of NPs(Optical, Microscopy, XRD, DLS,NTA).pdf
1.
Characterization of Nanomaterials
•Optical: UV-VIS spectrophotometer
• Electron Microscopy- SEM and TEM
• X Ray diffraction
• Dynamic light scattering
• Nanoparticle tracking analysis
Characterization is an important step in the synthesis of nanoparticles. It is a pivotal step to
determine the morphology, surface chemistry, surface area, and disparity, composition,
structure
2.
Characterization by UV-VISSpectrophotometer
• The Principle of UV-Visible Spectroscopy is based on the absorption of ultraviolet light or visible light by
chemical compounds, which results in the production of distinct spectra.
• When matter absorbs radiation, the electrons present in it undergo excitation. This causes them to jump from a
ground state (an energy state with a relatively small amount of energy associated with it) to an excited state (an
energy state with a relatively large amount of energy associated with it).They again return back to ground state by
releasing energy. This excitation and de-excitation, results in the production of a spectrum.
• surface plasmon resonance (SPR) is a mutual vibration of electrons of metal nanoparticles in resonance with
light waves which yield a absorption band.
3.
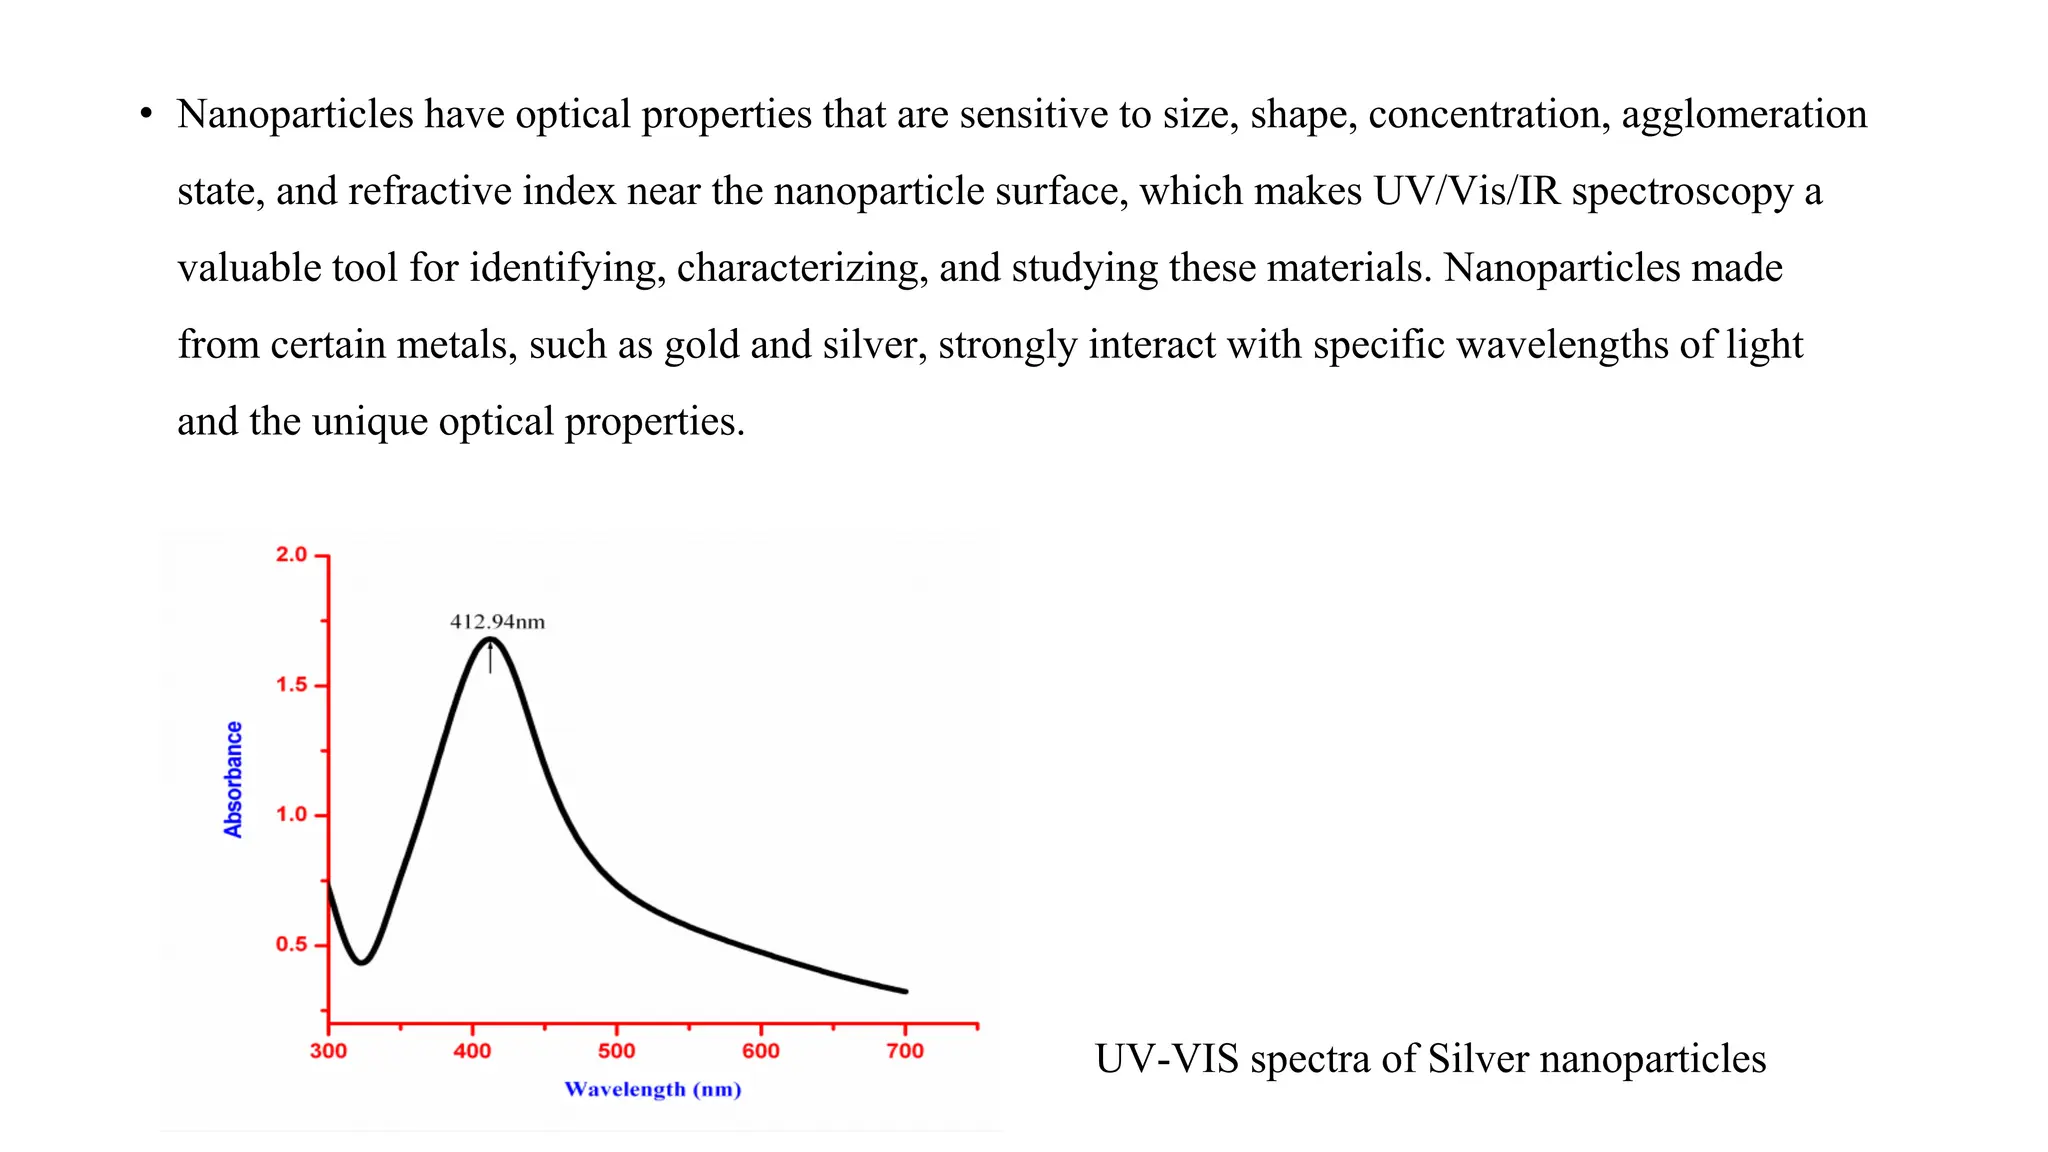
• Nanoparticles haveoptical properties that are sensitive to size, shape, concentration, agglomeration
state, and refractive index near the nanoparticle surface, which makes UV/Vis/IR spectroscopy a
valuable tool for identifying, characterizing, and studying these materials. Nanoparticles made
from certain metals, such as gold and silver, strongly interact with specific wavelengths of light
and the unique optical properties.
UV-VIS spectra of Silver nanoparticles
4.
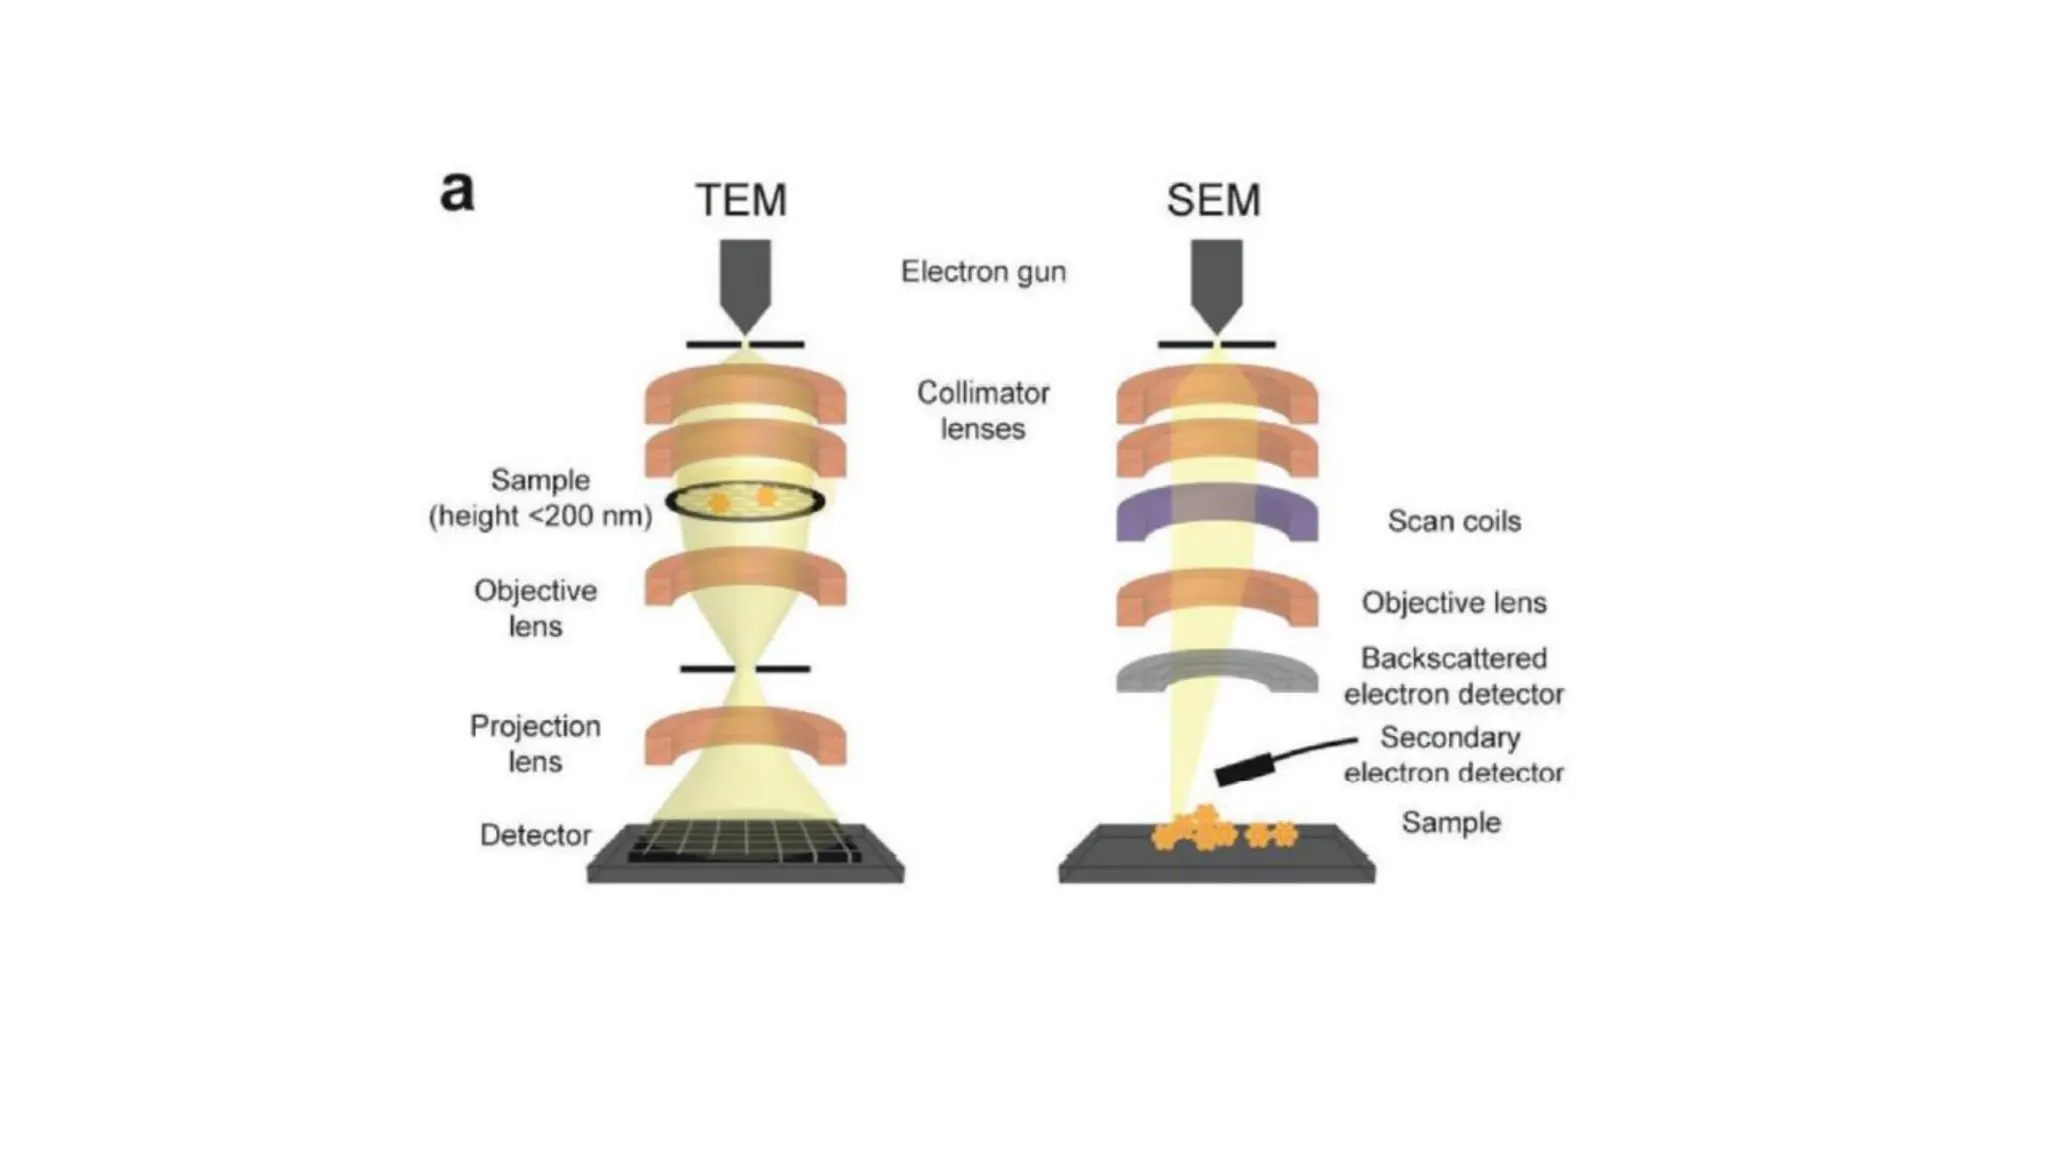
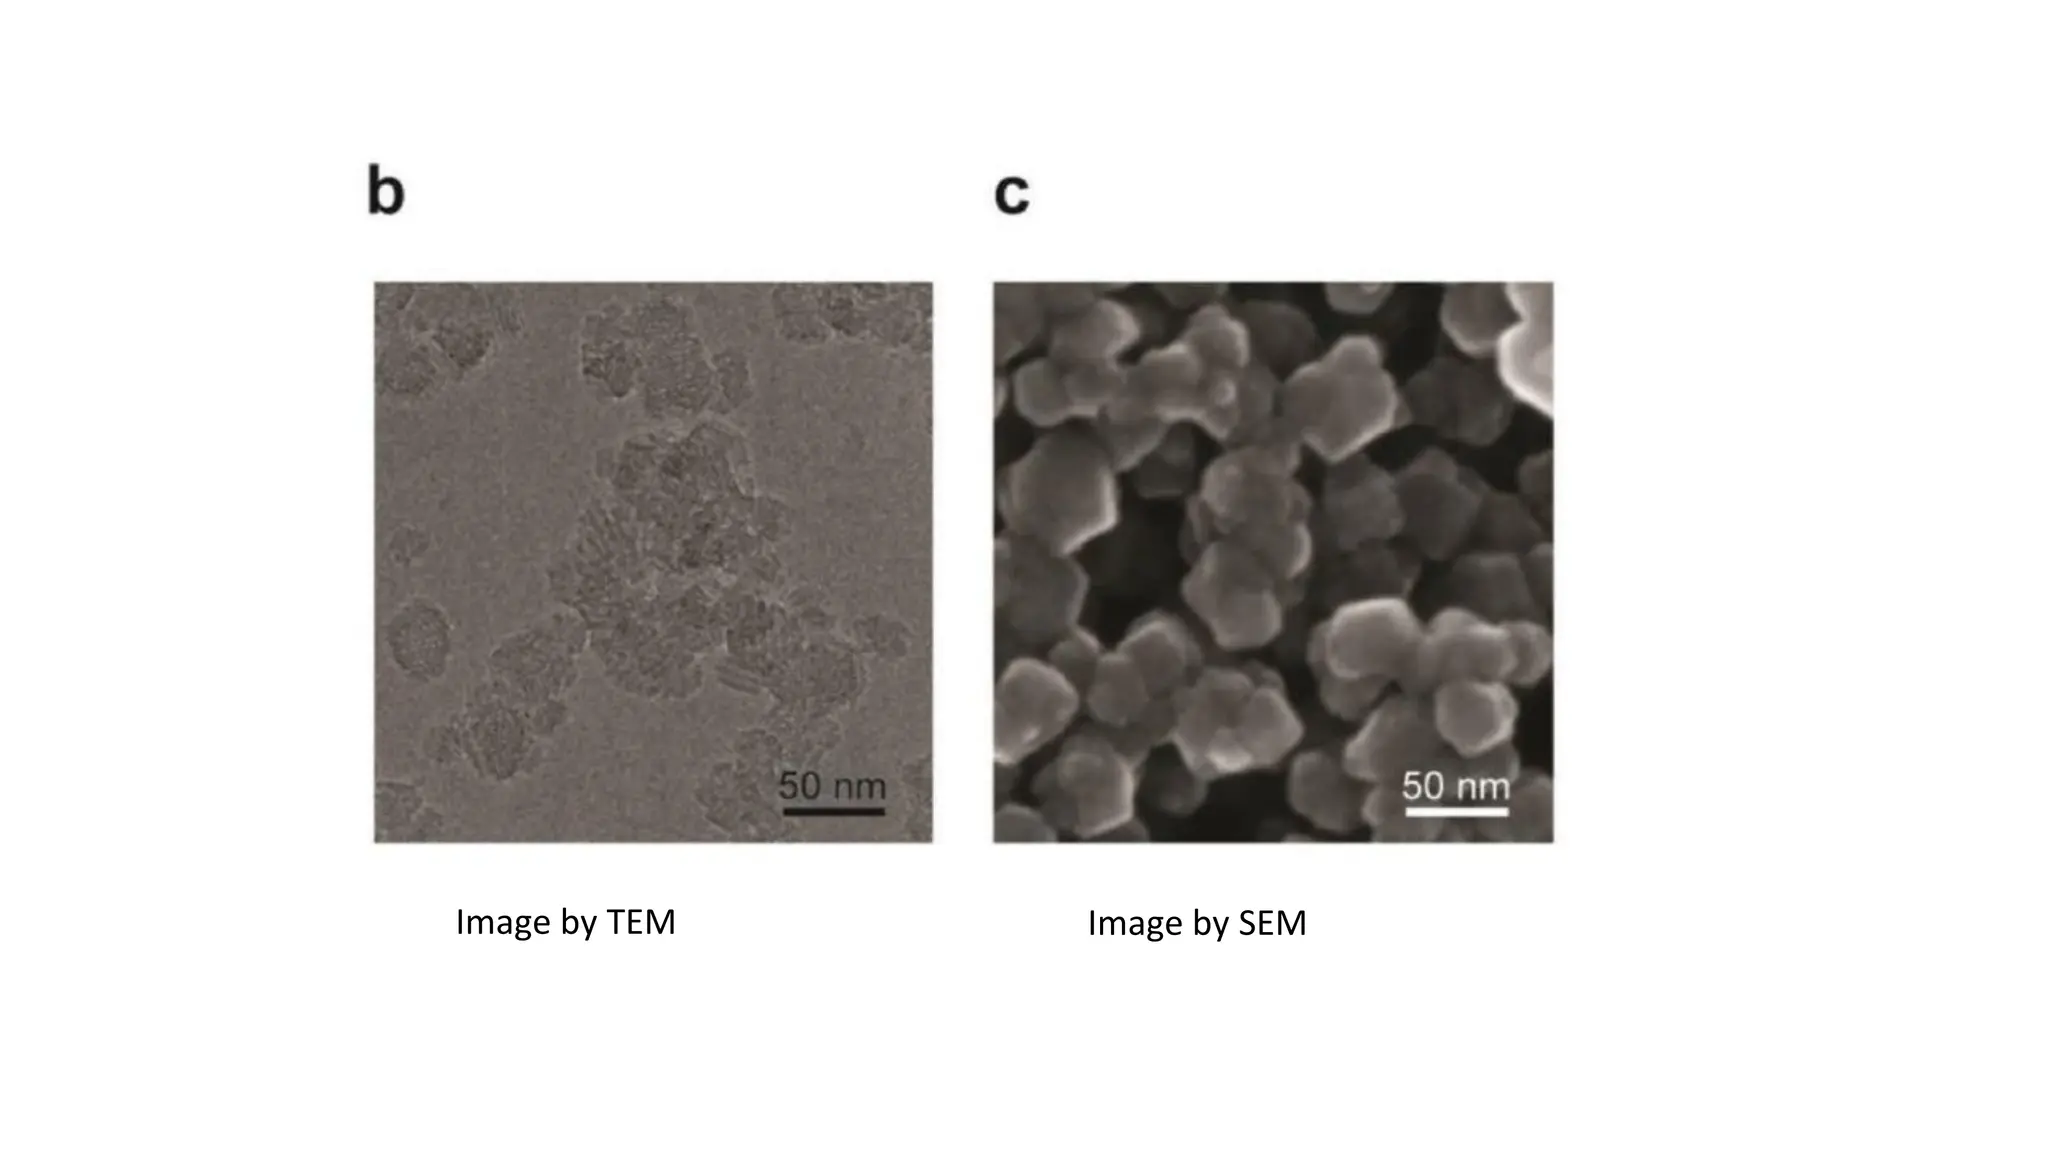
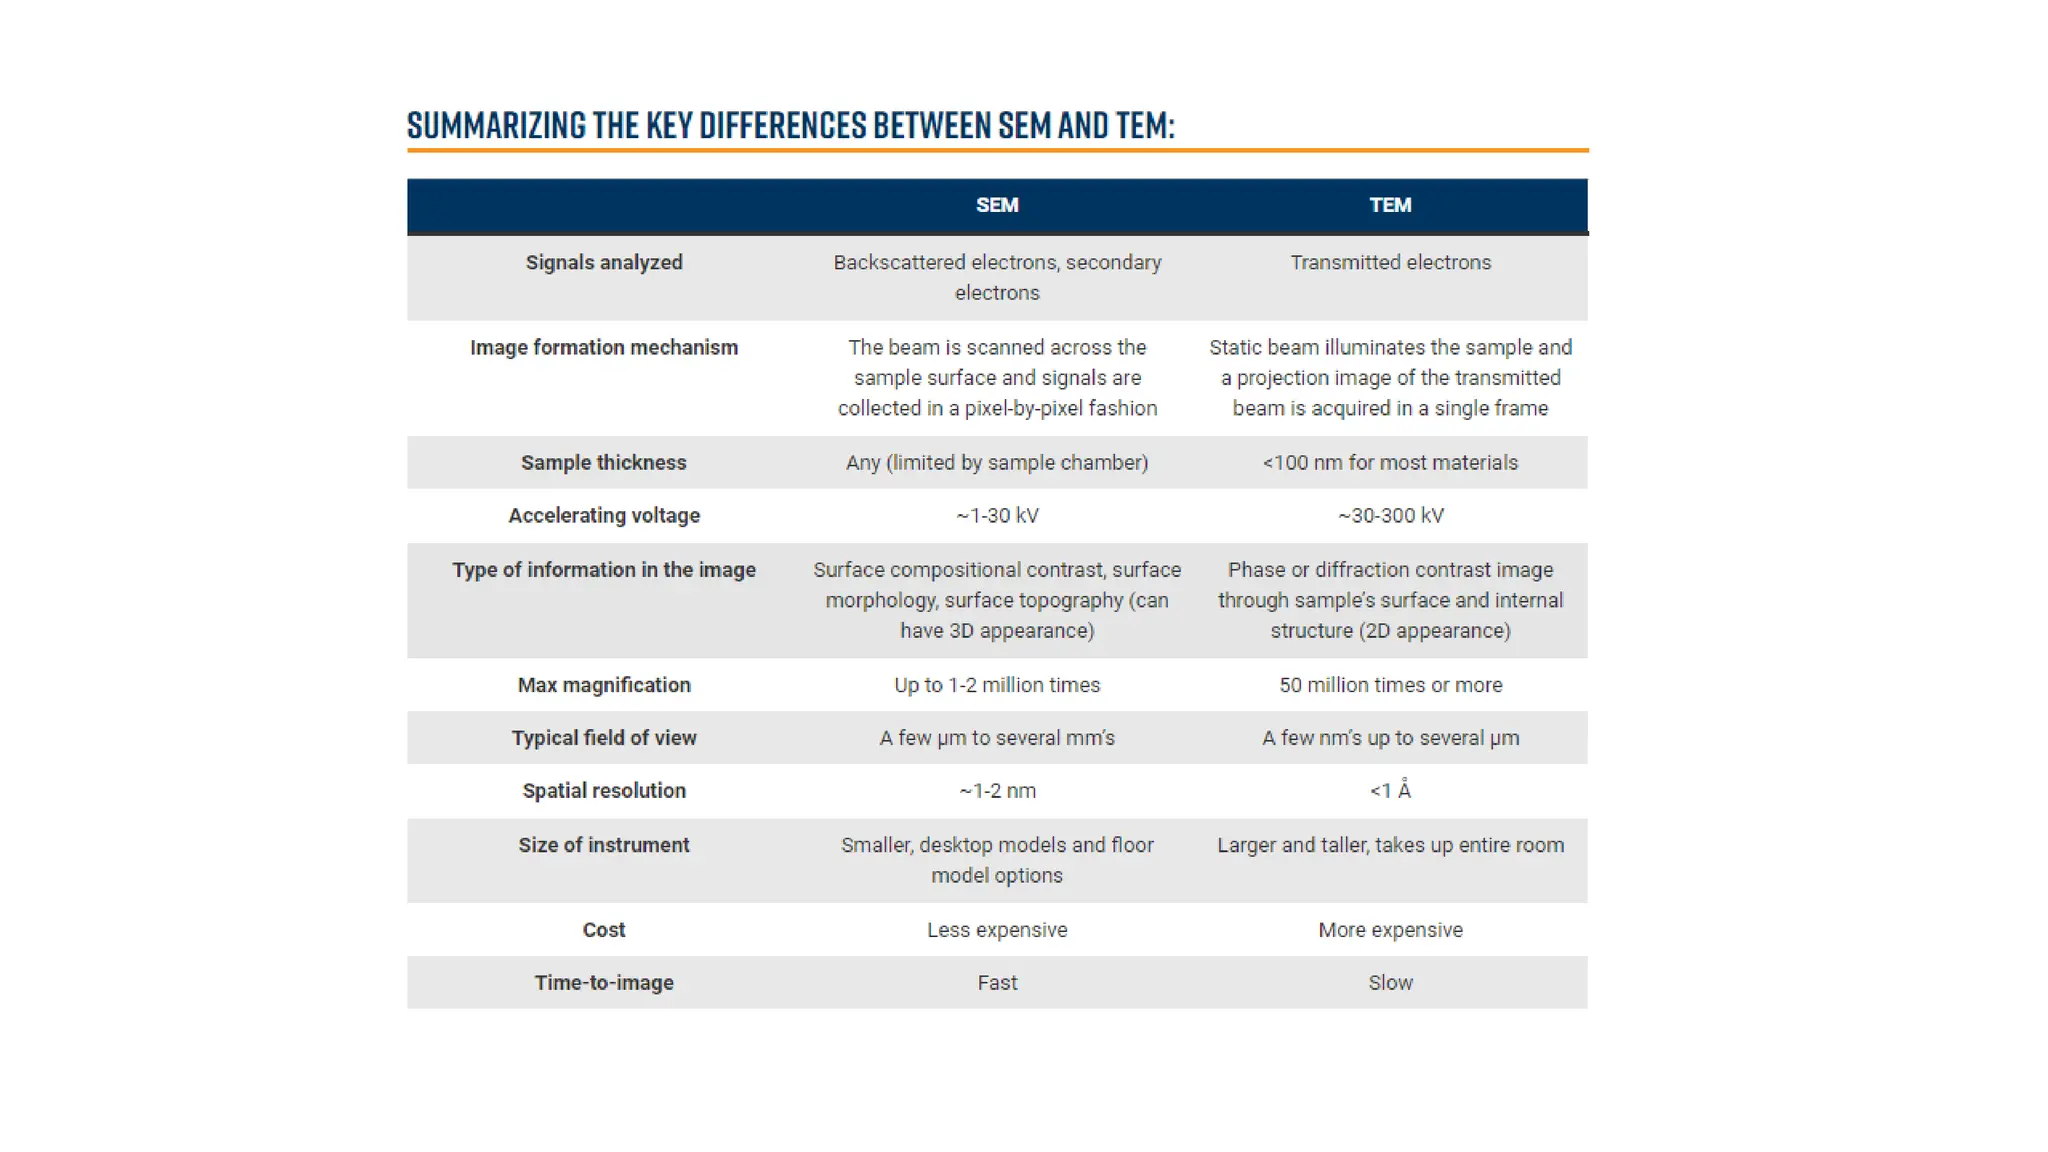
• SEM isexcellent technique for size and shape characterization of NPs.
• Scanning electron microscope enables imaging the sample surface by detecting secondary electrons
emitted from the sample upon interaction with the impinging electron beam.
• In SEM, lower beam energies are utilized for sample imaging as compared to TEM characterization,
which results in a limited penetration depth of the beam and, hence, in being sensitive solely to the
specimen surface.
• However, this superficial interaction also implies that SEM characterization can be used for the analysis
of the morphology of “thick” (>100 nm) dry state Suspension state samples, which is not possible with
TEM.
• SEM is by far more user-friendly and enables faster measurements, and features lower acquisition and
maintenance costs than TEM.
Characterization by Scanning Electron Microscope (SEM)
5.
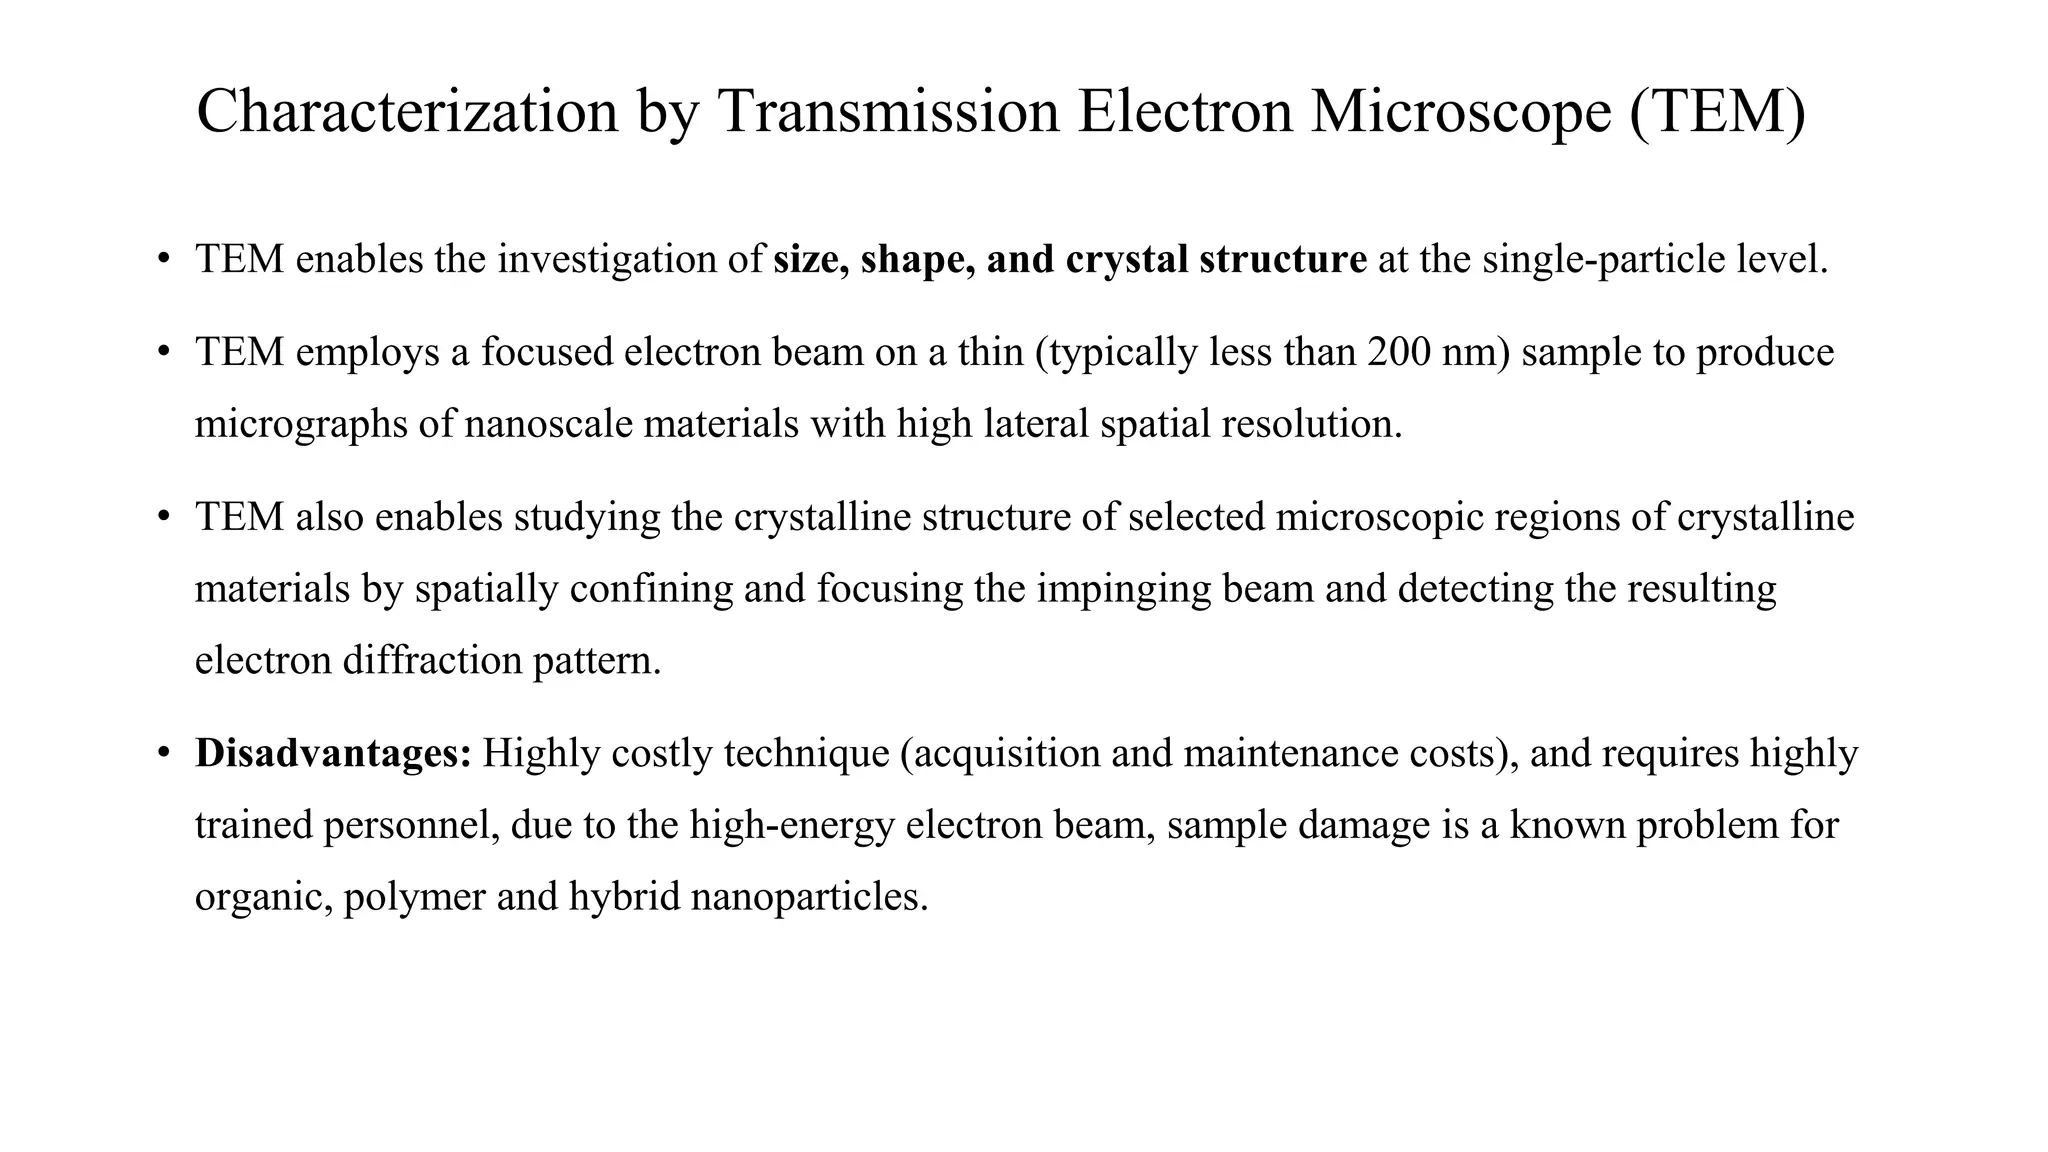
• TEM enablesthe investigation of size, shape, and crystal structure at the single-particle level.
• TEM employs a focused electron beam on a thin (typically less than 200 nm) sample to produce
micrographs of nanoscale materials with high lateral spatial resolution.
• TEM also enables studying the crystalline structure of selected microscopic regions of crystalline
materials by spatially confining and focusing the impinging beam and detecting the resulting
electron diffraction pattern.
• Disadvantages: Highly costly technique (acquisition and maintenance costs), and requires highly
trained personnel, due to the high-energy electron beam, sample damage is a known problem for
organic, polymer and hybrid nanoparticles.
Characterization by Transmission Electron Microscope (TEM)
Field-emission Scanning ElectronMicroscopy (FESEM)
• Field-emission scanning electron microscopy (FESEM) is a type of SEM that provides higher resolution
imaging than conventional SEM.
• FESEM works by focusing an electron beam onto a small area of the sample surface, and detecting the
secondary electrons emitted from the sample.
• The secondary electrons are detected by a detector, which converts the signal into an image.
• FESEM operates under high vacuum conditions, and the samples need to be conductive or coated with a
conductive material, such as gold or carbon.
• FESEM uses a field-emission electron source, which produces a high-intensity electron beam with a very small
electron spot size. This allows for higher resolution imaging than conventional SEM.
• The typical resolution of FESEM is in the range of a few nanometers to tens of nanometers.
• The images produced by FESEM can provide information about the surface morphology, topography, and
composition of the sample. In addition to imaging, FESEM can also be used for elemental analysis, using
energy-dispersive X-ray spectroscopy (EDS) or wavelength-dispersive X-ray spectroscopy (WDS), similar to
SEM.
10.
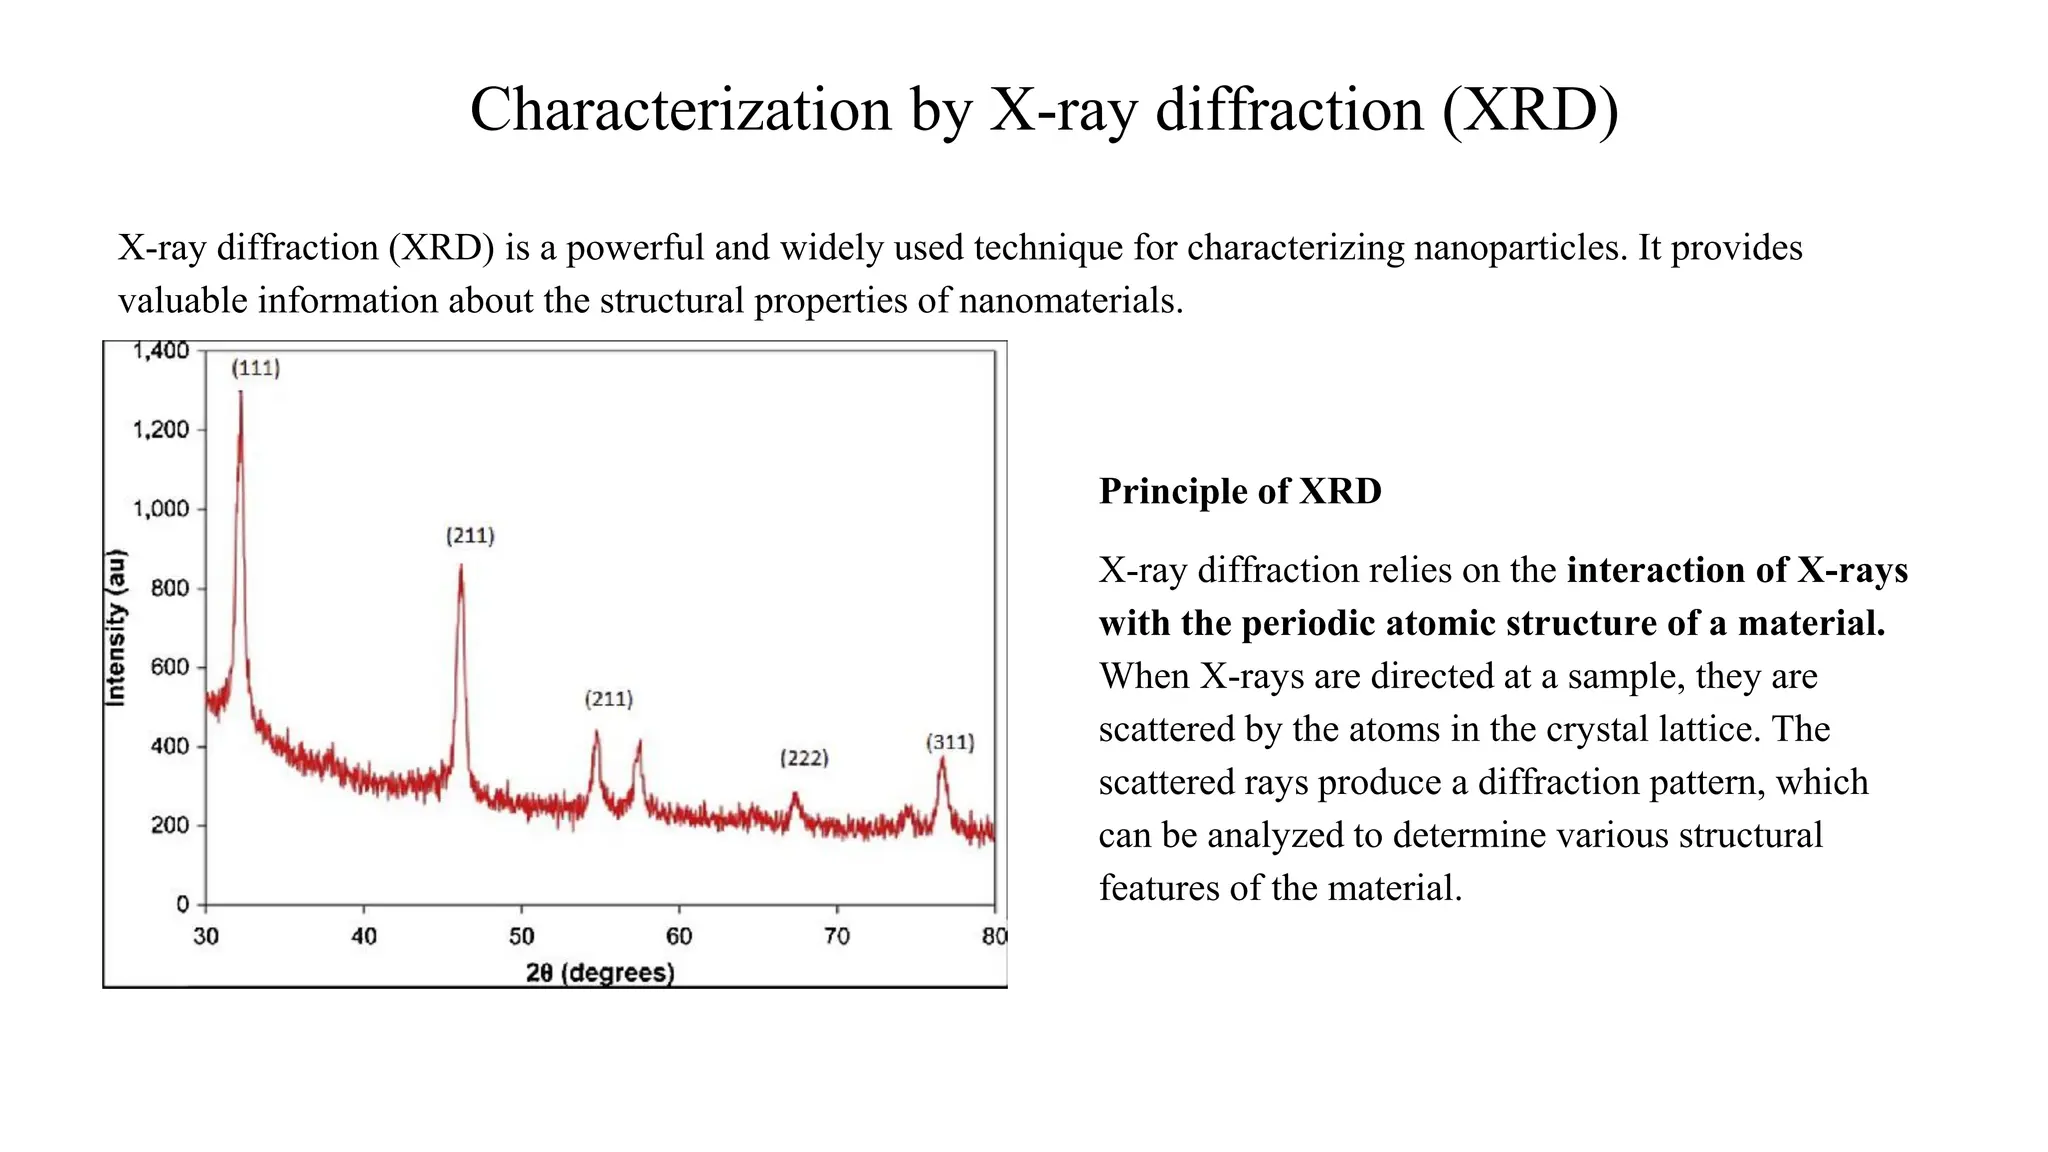
X-ray diffraction (XRD)is a powerful and widely used technique for characterizing nanoparticles. It provides
valuable information about the structural properties of nanomaterials.
Characterization by X-ray diffraction (XRD)
Principle of XRD
X-ray diffraction relies on the interaction of X-rays
with the periodic atomic structure of a material.
When X-rays are directed at a sample, they are
scattered by the atoms in the crystal lattice. The
scattered rays produce a diffraction pattern, which
can be analyzed to determine various structural
features of the material.
11.
2. Key InformationObtained from XRD
● Crystal Structure: XRD helps determine the crystal system (e.g., cubic, tetragonal) and the symmetry of the
nanoparticle material.
● Lattice Parameters: It provides information on the dimensions of the unit cell of the crystal lattice.
● Phase Identification: XRD can identify the phases present in the sample by comparing the diffraction pattern
with standard reference patterns.
● Particle Size: The Scherrer equation can be used to estimate the average size of nanoparticles by analyzing the
broadening of diffraction peaks.
● Strain and Defects: The broadening of XRD peaks can also provide information on strain and defects in the
crystal structure.
12.
● Intensity ofPeaks: The height or intensity of a peak reflects the number of X-rays scattered by the
crystal planes corresponding to that peak. Strong peaks indicate a high density of atoms in those
planes, which means that those planes contribute significantly to the diffraction pattern.
● Peak Width: The width of the peaks can give information about the size of the crystallites (the
domains of coherent scattering) and the degree of microstrain in the material. Broad peaks can
indicate small crystallite sizes or high strain, while sharp peaks suggest larger, more ordered
crystals.
● Peak Shape: The shape of the peaks can also provide insights into the quality of the crystalline
material and any imperfections. For example, peaks that are broader or asymmetrical might
indicate strain or defects in the crystal lattice.
13.
Sample Preparation
● PowderSamples: For bulk materials, samples are typically prepared as powders. Nanoparticles are often analyzed in
powder form as well, but special techniques may be used to handle and prepare very fine particles.
● Thin Films and Coatings: For nanoparticles deposited on substrates, XRD can be adapted to analyze thin films,
which may require specific configurations like grazing incidence X-ray diffraction (GIXRD).
Advanced Techniques
● High-Resolution XRD: Provides detailed information on lattice parameters and strain, often used for high-precision
measurements.
● Small-Angle X-ray Scattering (SAXS): Complements XRD by providing information on the size and shape of
nanoparticles in solution or dispersed systems.
Applications
● Material Science: Understanding the crystallographic properties of nanoparticles used in advanced materials.
● Catalysis: Characterizing the structure of catalytic nanoparticles and their changes during reactions.
● Pharmaceuticals: Analyzing drug nanoparticles for formulation and stability studies.
14.
• Dynamic lightscattering (DLS) is the most common approach to analyze hydrodynamic particle size and
distribution of the particles over a range of sizes.
• DLS is the measurement of light interference based on the Brownian motion (the erratic random movement of
microscopic particles in a fluid, as a result of continuous bombardment from molecules of the surrounding
medium) of nanoparticles in suspension and a correlation of its velocity (diffusion coefficient) with its size using
Stokes–Einstein equation .
• The size distribution range of the particles is depicted as polydispersity index (PDI). PDI values lie between 0
and 1, where 1 is the highly heterogeneous population and 0 is the highly homogeneous nanoparticle population.
• This technique also allows for analyzing nonspherical particles, such as rods, using multiangle DLS.
Characterization by Dynamic light scattering (DLS)
15.
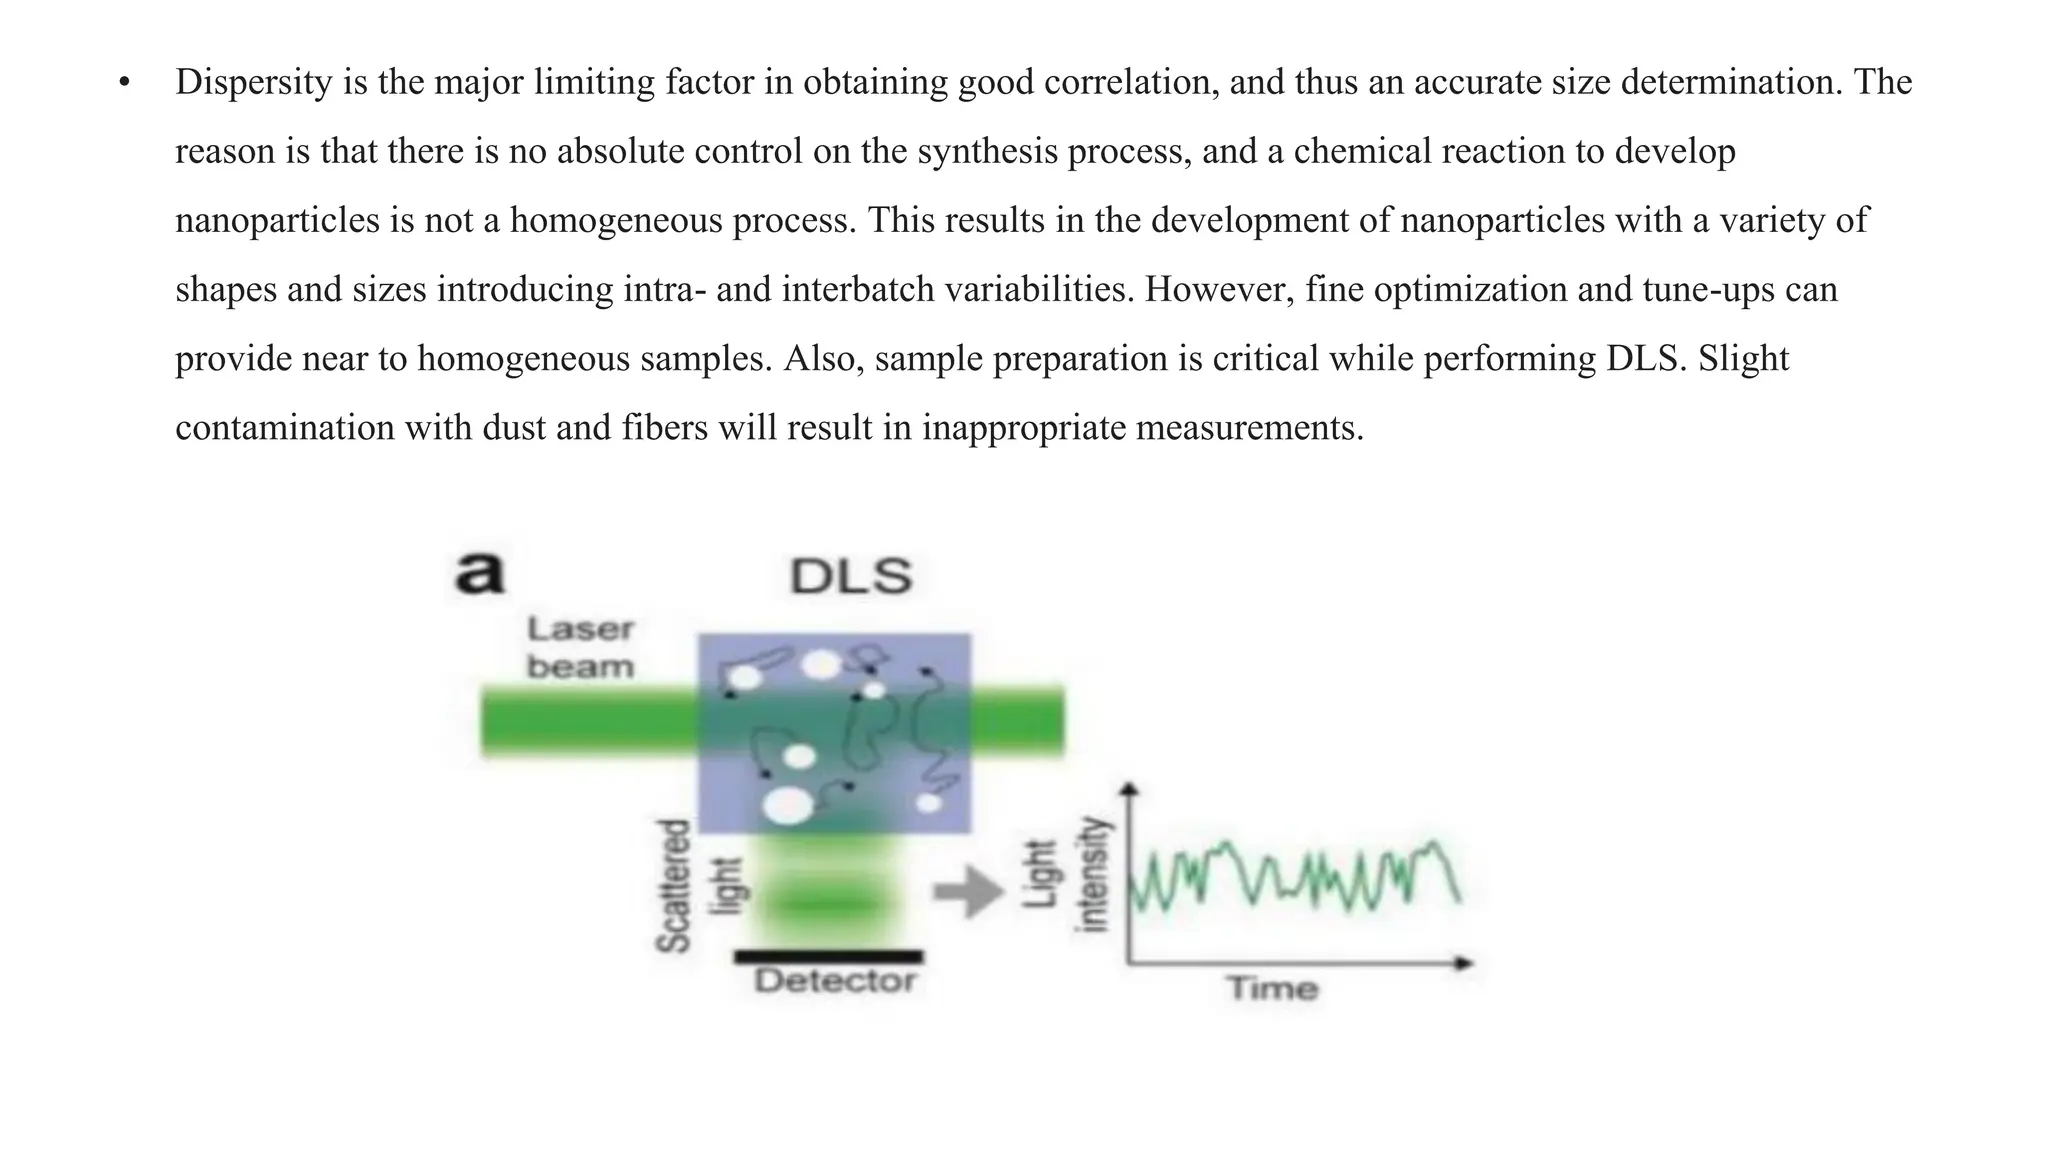
• Dispersity isthe major limiting factor in obtaining good correlation, and thus an accurate size determination. The
reason is that there is no absolute control on the synthesis process, and a chemical reaction to develop
nanoparticles is not a homogeneous process. This results in the development of nanoparticles with a variety of
shapes and sizes introducing intra- and interbatch variabilities. However, fine optimization and tune-ups can
provide near to homogeneous samples. Also, sample preparation is critical while performing DLS. Slight
contamination with dust and fibers will result in inappropriate measurements.
16.
Nanoparticle Tracking Analysis(NTA)
• Nanoparticle Tracking Analysis (NTA) is one of the few methods to visualize and measure nanoparticles in
suspension in the range from 10 – 1000 nm based on the analysis of Brownian motion.
• Objects with two dimensions smaller than 100 nm are termed nanoparticles or ultrafine particles.
• Fine particles are sized between 100 and 2500 nm.
• Comprising analysis including size, concentration, surface charge (zeta potential) and fluorescence is
needed by researchers to gain deep insights in processes of synthesis, reaction kinetics or specificity studies.
• NTA is a versatile technique capable of multiparameter measurement for all kinds of particles, saving time and
sample amount.
17.
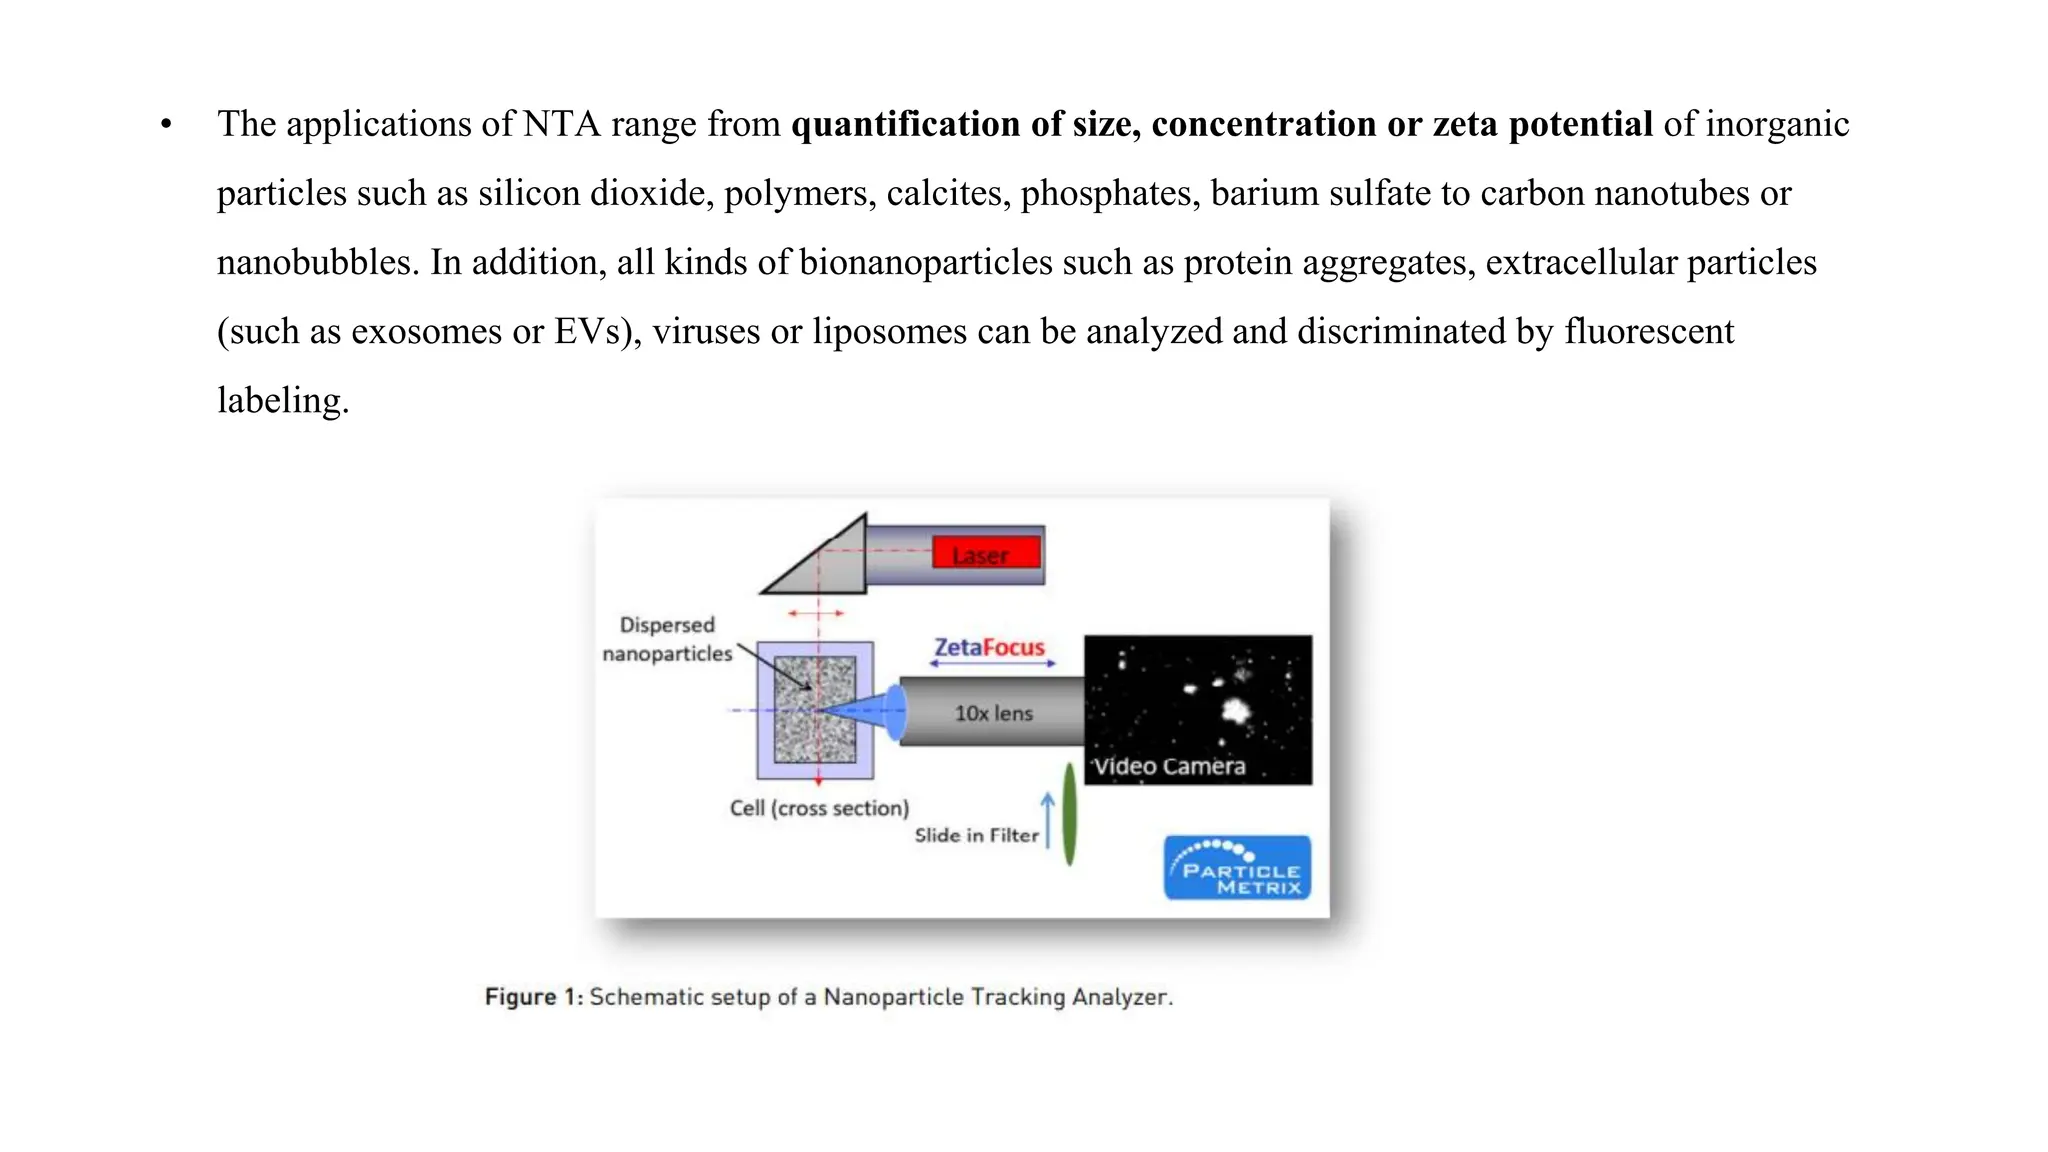
• The applicationsof NTA range from quantification of size, concentration or zeta potential of inorganic
particles such as silicon dioxide, polymers, calcites, phosphates, barium sulfate to carbon nanotubes or
nanobubbles. In addition, all kinds of bionanoparticles such as protein aggregates, extracellular particles
(such as exosomes or EVs), viruses or liposomes can be analyzed and discriminated by fluorescent
labeling.
18.
Measurement Principle:
• NTAdetermines the Brownian motion by analysis of a video sequence.
• Particles in the sample are visualized by the illumination with a laser beam.
• The scattered light of the particles is recorded with a light sensitive CCD or CMOS camera, which is
arranged at a 90° angle to the irradiation plane.
• The 90° arrangement, also known as Ultra microscopy allows detection and tracking of the Brownian
motion of 10 to 1000 nm sized vesicles.
• Using a special algorithm, particles are detected and their path registered.
• The size of each individually tracked particle is calculated, thus simultaneously allowing determination
of their size distribution and concentration.