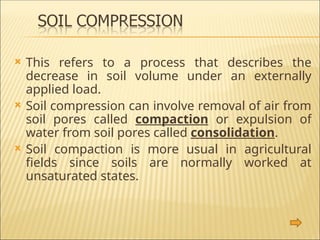
This refersto a process that describes the
decrease in soil volume under an externally
applied load.
Soil compression can involve removal of air from
soil pores called compaction or expulsion of
water from soil pores called consolidation.
Soil compaction is more usual in agricultural
fields since soils are normally worked at
unsaturated states.
3.
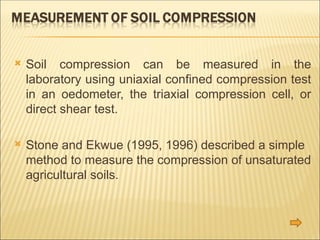
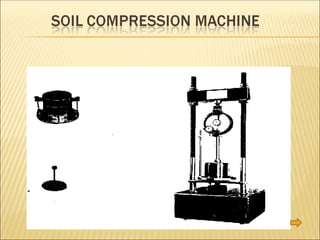
Soil compressioncan be measured in the
laboratory using uniaxial confined compression test
in an oedometer, the triaxial compression cell, or
direct shear test.
Stone and Ekwue (1995, 1996) described a simple
method to measure the compression of unsaturated
agricultural soils.
4.
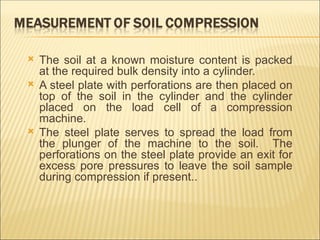
The soilat a known moisture content is packed
at the required bulk density into a cylinder.
A steel plate with perforations are then placed on
top of the soil in the cylinder and the cylinder
placed on the load cell of a compression
machine.
The steel plate serves to spread the load from
the plunger of the machine to the soil. The
perforations on the steel plate provide an exit for
excess pore pressures to leave the soil sample
during compression if present..
5.
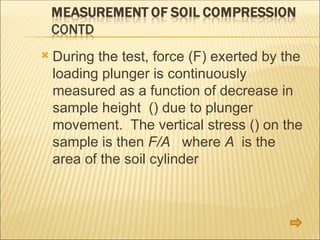
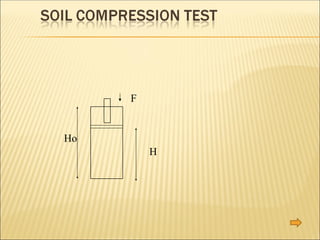
During thetest, force (F) exerted by the
loading plunger is continuously
measured as a function of decrease in
sample height () due to plunger
movement. The vertical stress () on the
sample is then F/A where A is the
area of the soil cylinder
7.
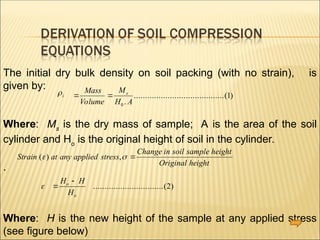
The initial drybulk density on soil packing (with no strain), is
given by:
Where: Ms
is the dry mass of sample; A is the area of the soil
cylinder and Ho
is the original height of soil in the cylinder.
.
Where: H is the new height of the sample at any applied stress
(see figure below)
i
Mass
Volume
M
H A
s
0
1
.
........................................( )
Strain at any applied stress
Change in soil sample height
Original height
( ) ,
H H
H
o
o
...............................( )
2
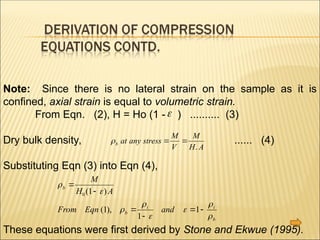
Note: Since thereis no lateral strain on the sample as it is
confined, axial strain is equal to volumetric strain.
From Eqn. (2), H = Ho (1 - ) .......... (3)
Dry bulk density, ...... (4)
Substituting Eqn (3) into Eqn (4),
These equations were first derived by Stone and Ekwue (1995).
b at any stress
M
V
M
H A
.
b
b
i i
b
M
H A
From Eqn and
0 1
1
1
1
( )
( ),
10.
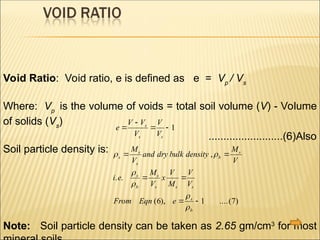
Void Ratio: Voidratio, e is defined as e = Vp
/ Vs
Where: Vp
is the volume of voids = total soil volume (V) - Volume
of solids (Vs
)
.........................(6)Also
Soil particle density is:
Note: Soil particle density can be taken as 2.65 gm/cm3
for most
e
V V
V
V
V
s
s s
1
s
s
s
b
s
s
b
s
s s s
s
b
M
V
and dry bulk density
M
V
i e
M
V
x
V
M
V
V
From Eqn e
,
. .
( ), ....( )
6 1 7
11.
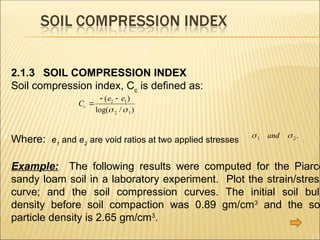
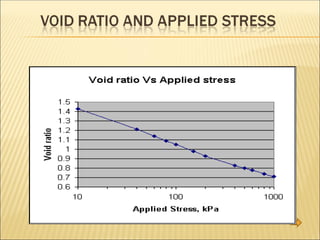
2.1.3 SOIL COMPRESSIONINDEX
Soil compression index, Cc
is defined as:
Where: e1
and e2
are void ratios at two applied stresses
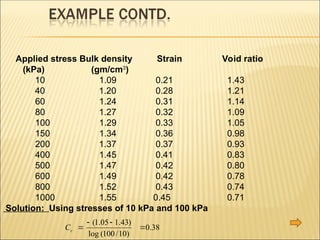
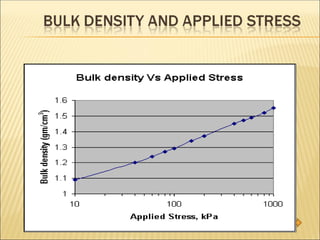
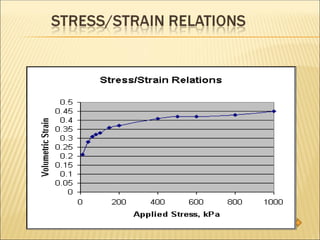
Example: The following results were computed for the Piarco
sandy loam soil in a laboratory experiment. Plot the strain/stress
curve; and the soil compression curves. The initial soil bulk
density before soil compaction was 0.89 gm/cm3
and the so
particle density is 2.65 gm/cm3
.
C
e e
c
( )
log( / )
2 1
2 1
1 2
and .
Soil Compactionis defined as the volume
change produced by momentary load
application caused by rolling, tamping or
vibration.
It involves the expulsion of air without
significant change in the amount of water in
the soil mass.
The most common causes of agricultural soil
compaction are trampling by livestock and
pressures imposed by vehicles or tillage
equipment.
17.
While Soilcompaction is desirable in most
engineering situations, it is undesirable in agricultural
fields. Improvements of engineering properties of
soils through compaction lead to advantages such
as:
i) Reduction or prevention of detrimental settlement
of soil.
ii) Soil strength increases and improvements of
slope stability.
iii) Improvement of bearing capacity of pavements
and
iv) The control of undesirable volume changes
caused by frost action, swelling and shrinkage.
18.
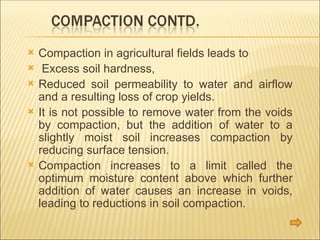
Compaction inagricultural fields leads to
Excess soil hardness,
Reduced soil permeability to water and airflow
and a resulting loss of crop yields.
It is not possible to remove water from the voids
by compaction, but the addition of water to a
slightly moist soil increases compaction by
reducing surface tension.
Compaction increases to a limit called the
optimum moisture content above which further
addition of water causes an increase in voids,
leading to reductions in soil compaction.
19.
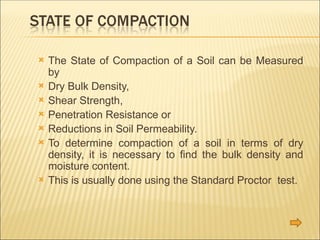
The Stateof Compaction of a Soil can be Measured
by
Dry Bulk Density,
Shear Strength,
Penetration Resistance or
Reductions in Soil Permeability.
To determine compaction of a soil in terms of dry
density, it is necessary to find the bulk density and
moisture content.
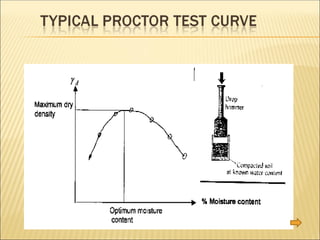
This is usually done using the Standard Proctor test.
20.
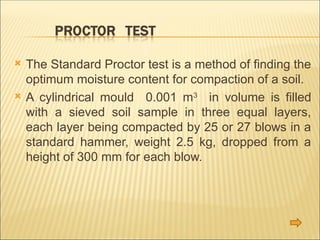
The StandardProctor test is a method of finding the
optimum moisture content for compaction of a soil.
A cylindrical mould 0.001 m3
in volume is filled
with a sieved soil sample in three equal layers,
each layer being compacted by 25 or 27 blows in a
standard hammer, weight 2.5 kg, dropped from a
height of 300 mm for each blow.
21.
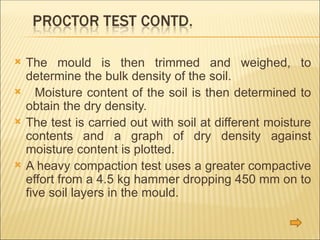
The mouldis then trimmed and weighed, to
determine the bulk density of the soil.
Moisture content of the soil is then determined to
obtain the dry density.
The test is carried out with soil at different moisture
contents and a graph of dry density against
moisture content is plotted.
A heavy compaction test uses a greater compactive
effort from a 4.5 kg hammer dropping 450 mm on to
five soil layers in the mould.
24.
Proctor CompactionSoil mechanics Test can
be used to index and predict with reasonable
accuracy, the compaction behaviour of agricultural
soils over a wide range of soil moisture contents
and single or multiple passes of tyres of mechanical
equipment with varying contact pressures.
The knowledge of the moisture content and
pressure changes on dry density of a soil could be
provided in order to make recommendations to the
farmer or machine designer.
25.
The Proctorcompaction test has hitherto
been reserved for earthwork engineering.
In agricultural practice, it is advisable to limit
soil working below the optimum moisture
content in order not to cause maximum soil
compaction.
26.
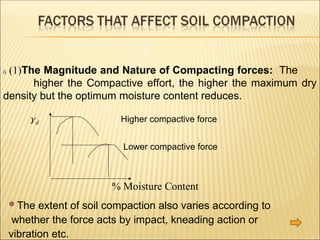
i) (1)The Magnitudeand Nature of Compacting forces: The
higher the Compactive effort, the higher the maximum dry
density but the optimum moisture content reduces.
Higher compactive force
d
Lower compactive force
% Moisture Content
The extent of soil compaction also varies according to
whether the force acts by impact, kneading action or
vibration etc.
27.
ii) MoistureContent of the Soil (see diagram above).
iii) The Degree of Compaction of the Soil at the time of
compaction.
iv) Soil properties eg. texture, density, and organic
matter content:
Sandy soils are more compactible than clays but clays have
higher optimum moisture contents.
Organic matter reduces the maximum dry density and
increases the optimum or critical moisture content.
This increases soil workability since it can be worked over a
wider range of moisture content without achieving
maximum compaction.
28.
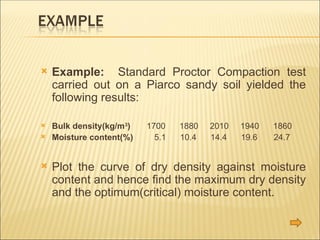
Example: StandardProctor Compaction test
carried out on a Piarco sandy soil yielded the
following results:
Bulk density(kg/m3
) 1700 1880 2010 1940 1860
Moisture content(%) 5.1 10.4 14.4 19.6 24.7
Plot the curve of dry density against moisture
content and hence find the maximum dry density
and the optimum(critical) moisture content.
29.
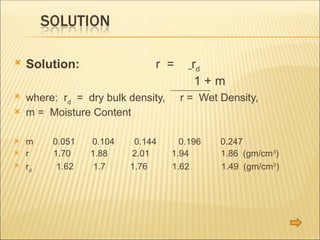
Solution: r= rd
1 + m
where: rd
= dry bulk density, r = Wet Density,
m = Moisture Content
m 0.051 0.104 0.144 0.196 0.247
r 1.70 1.88 2.01 1.94 1.86 (gm/cm3
)
rd
1.62 1.7 1.76 1.62 1.49 (gm/cm3
)
30.
Compaction Curve ForPiarco Sand
1
1.1
1.2
1.3
1.4
1.5
1.6
1.7
1.8
0 10 20 30
Moisture Content (%)
D
r
y
b
u
l
k
d
e
n
s
i
ty
(g
m
/
c
m
3
)
From graph, Maximum Dry Density = 1.76 gm/cm3
and
Optimum(critical) Moisture Content = 14.5%.


![Geotechnical Engineering-I [Lec #13: Soil Compaction]](https://cdn.slidesharecdn.com/ss_thumbnails/13-180923184035-thumbnail.jpg?width=640&height=640&fit=bounds)


