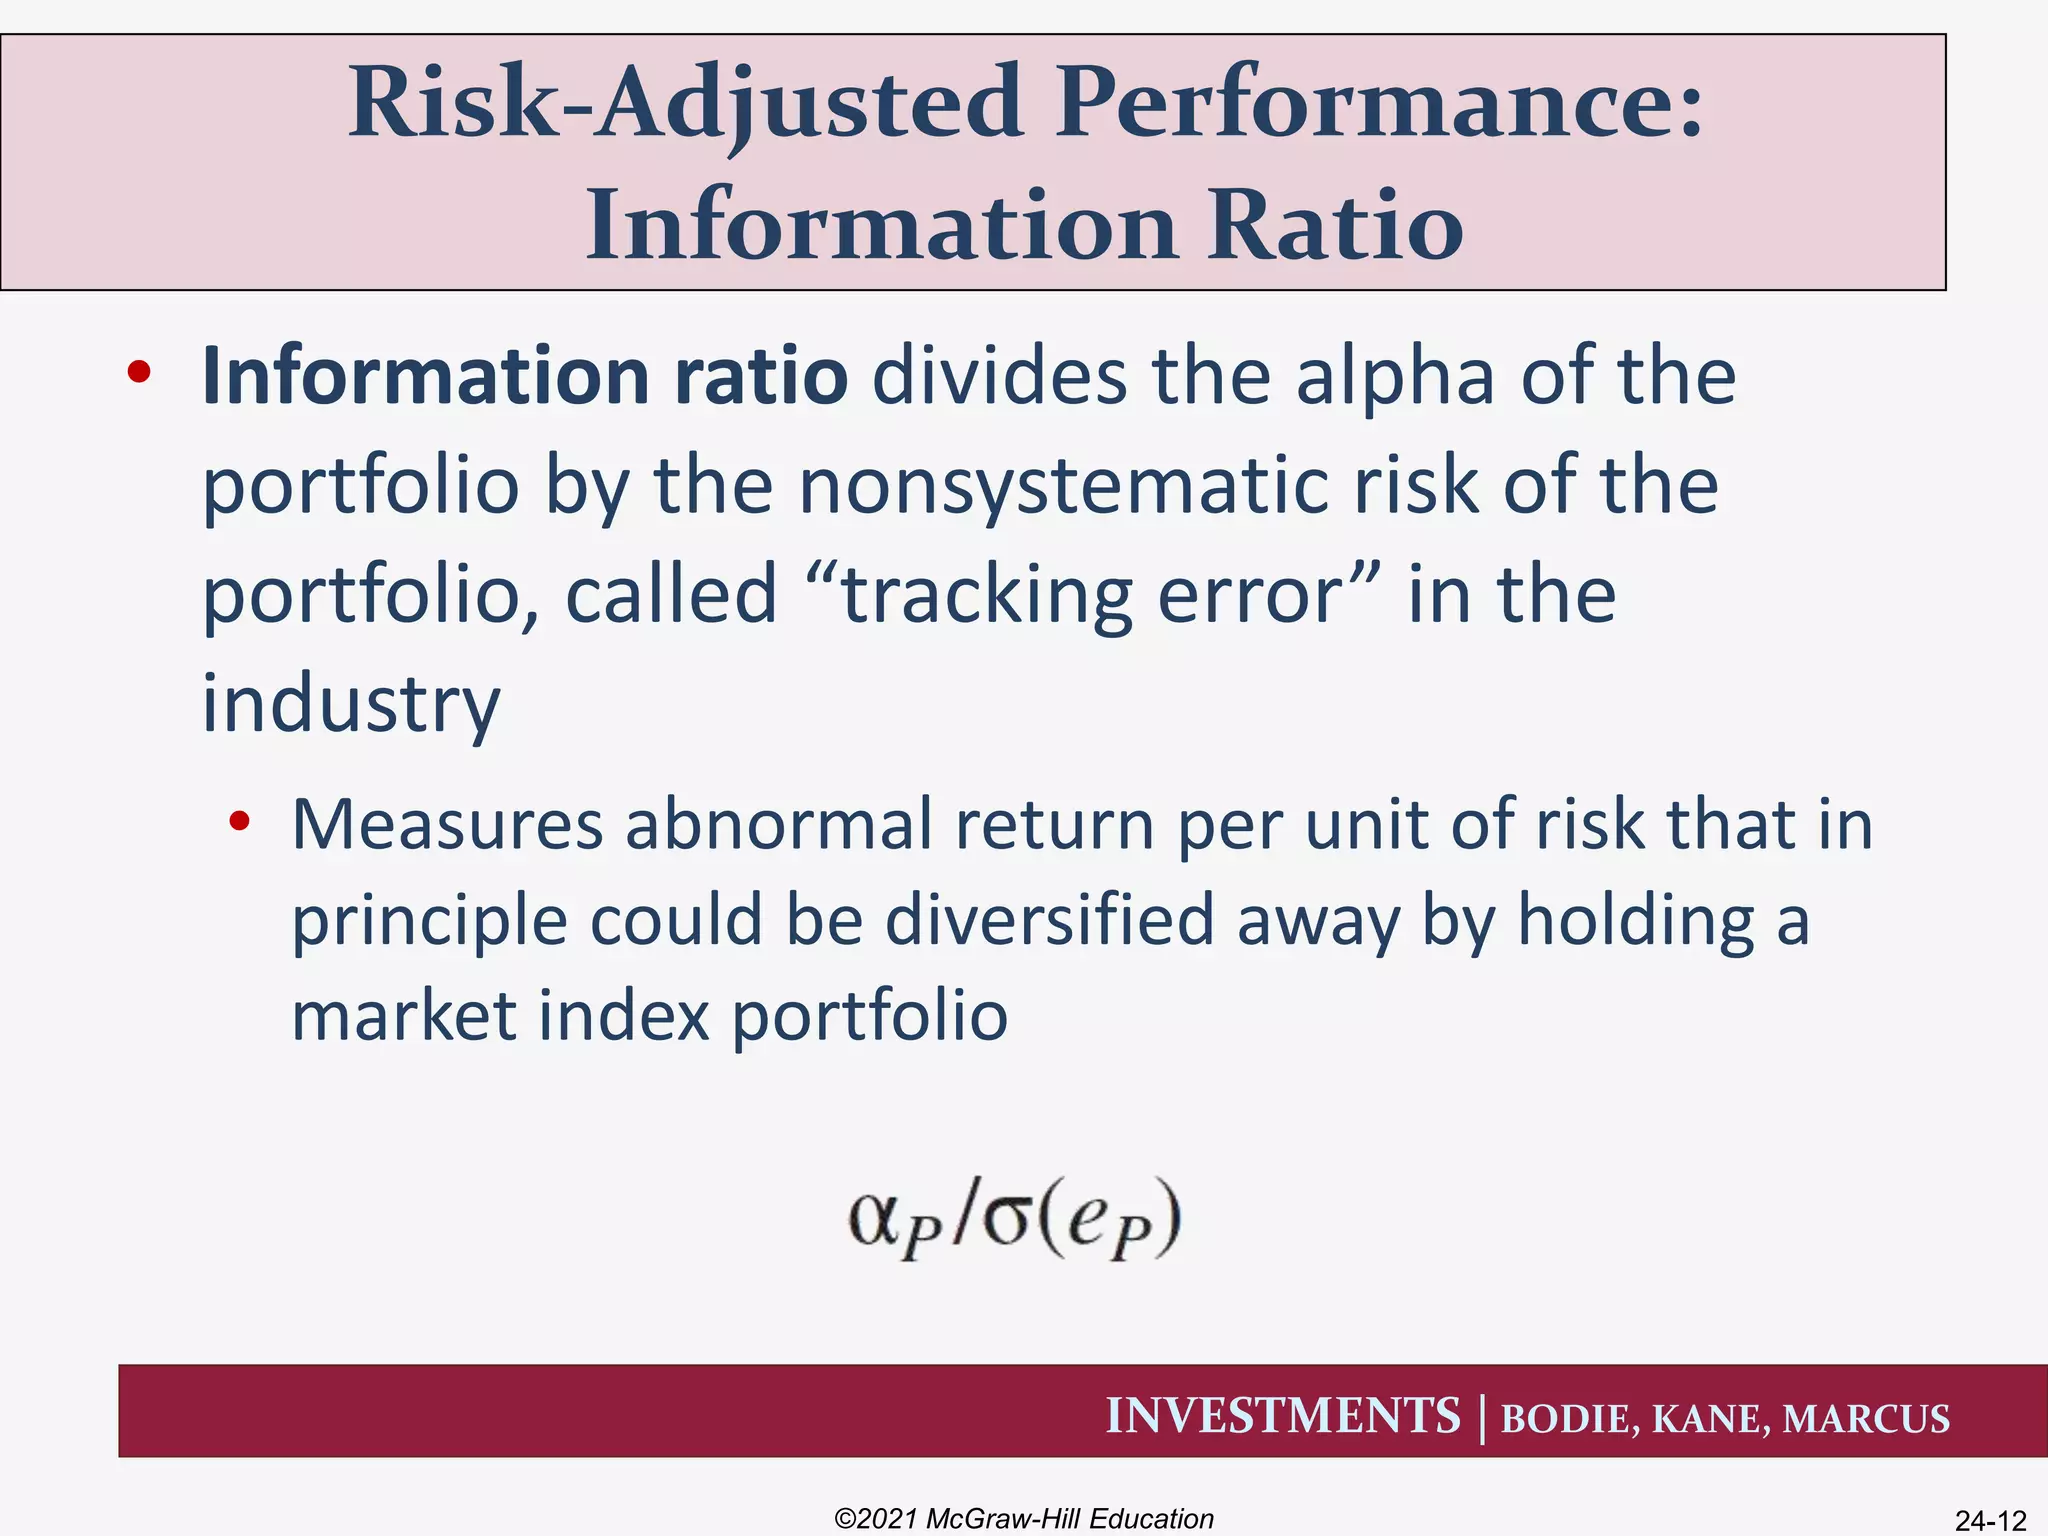
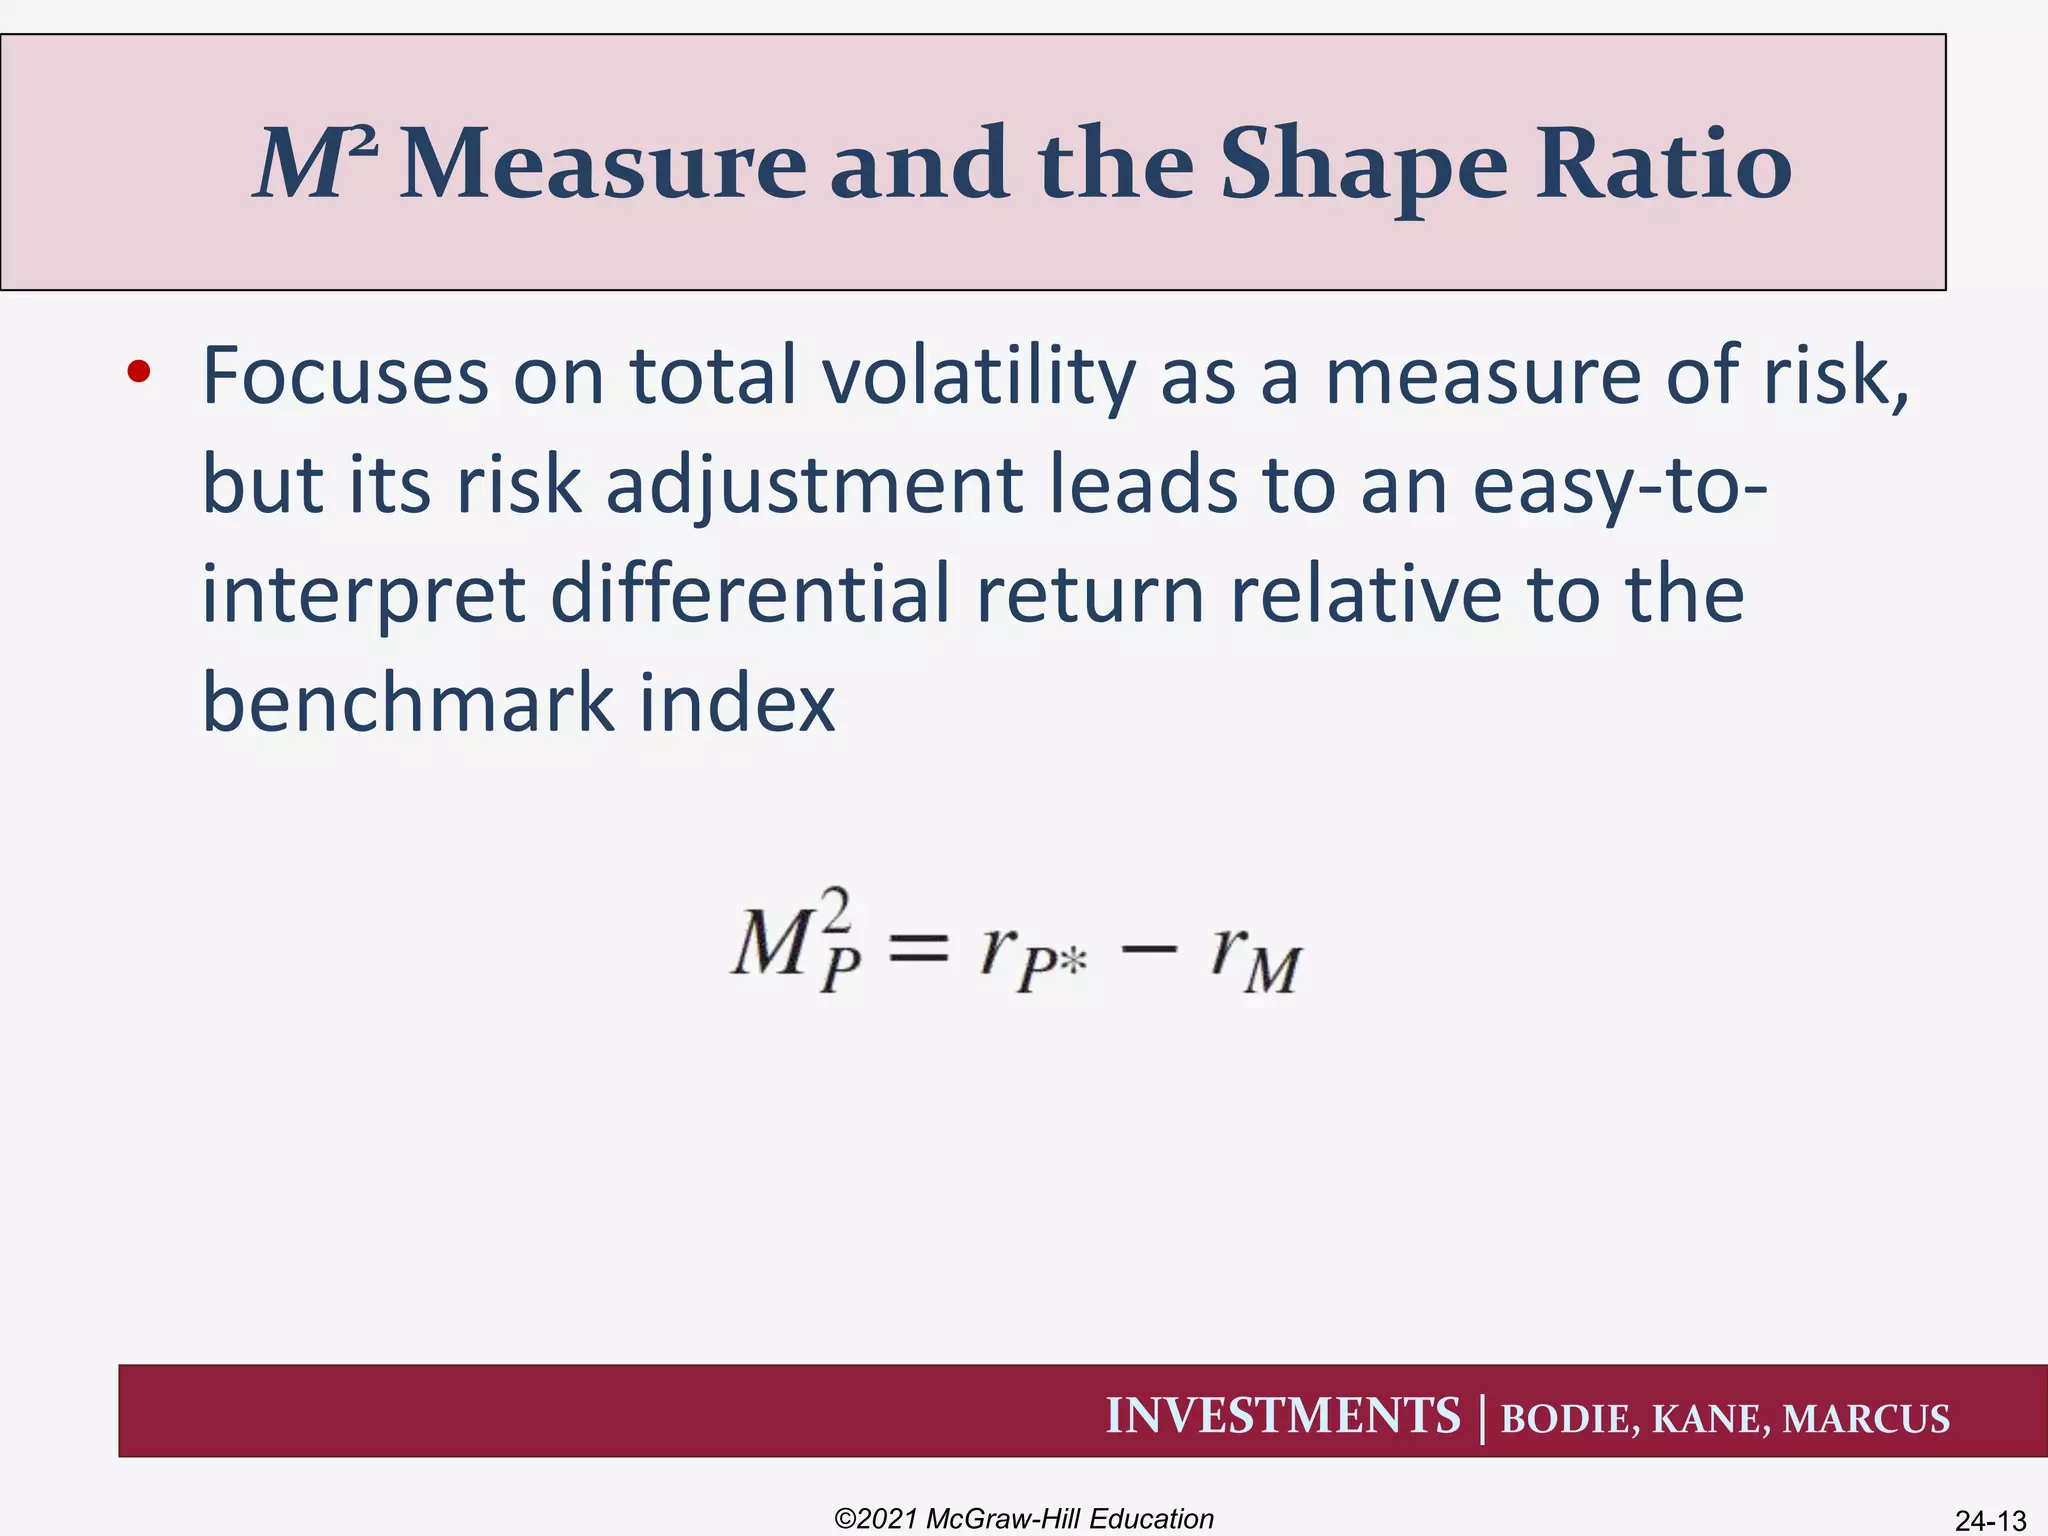
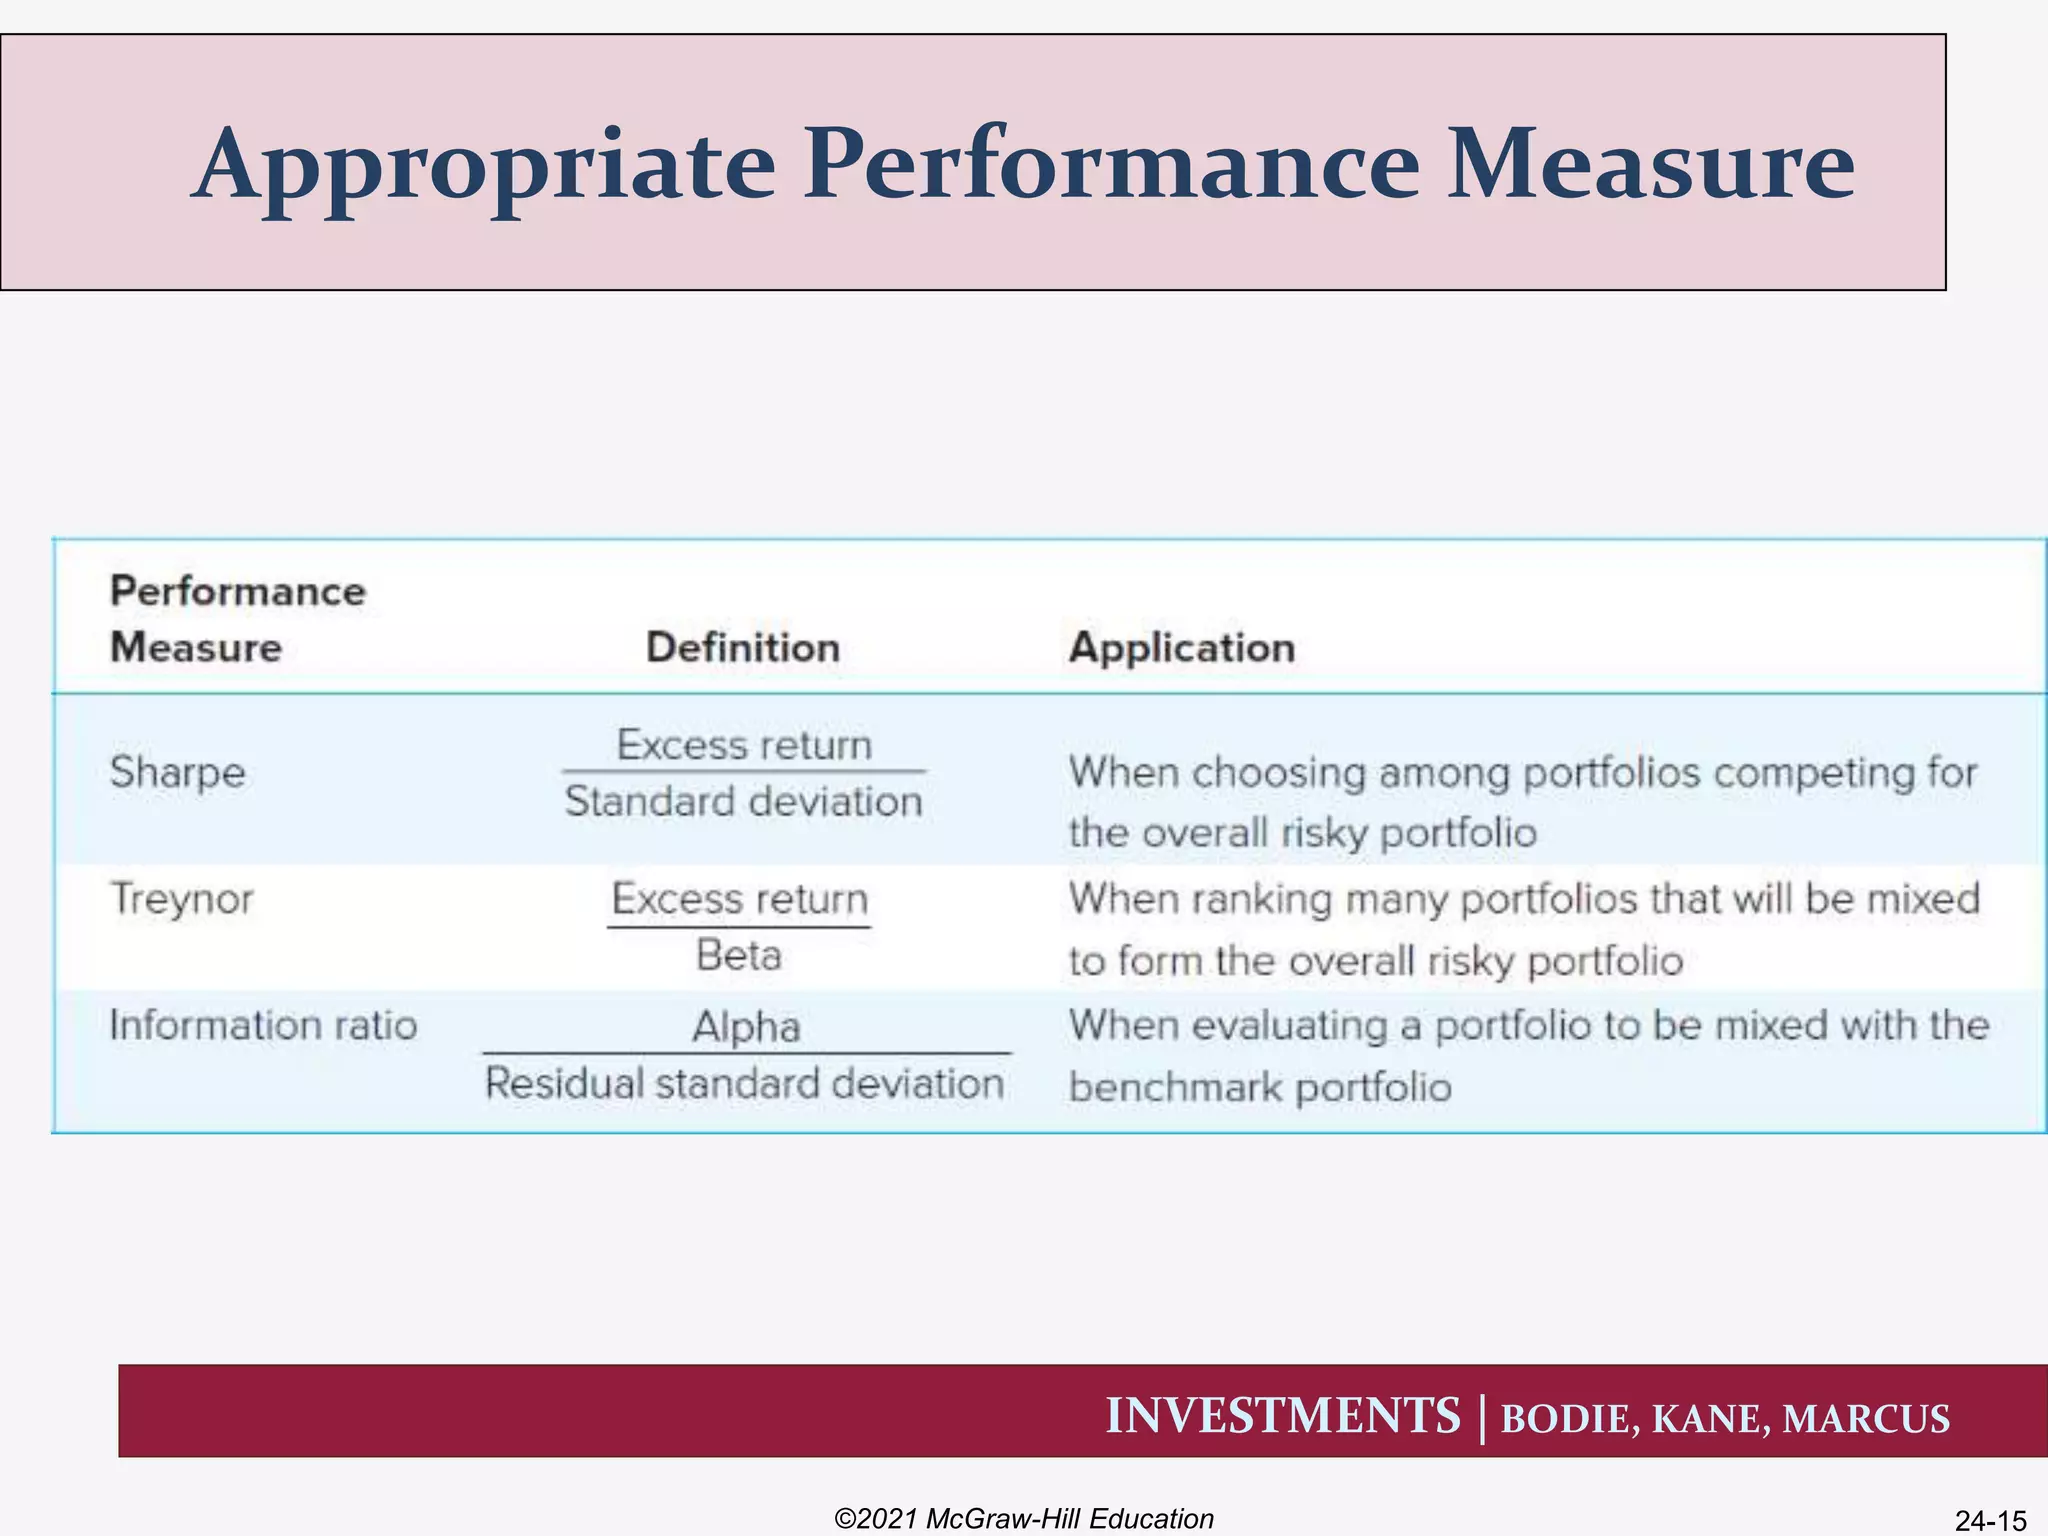
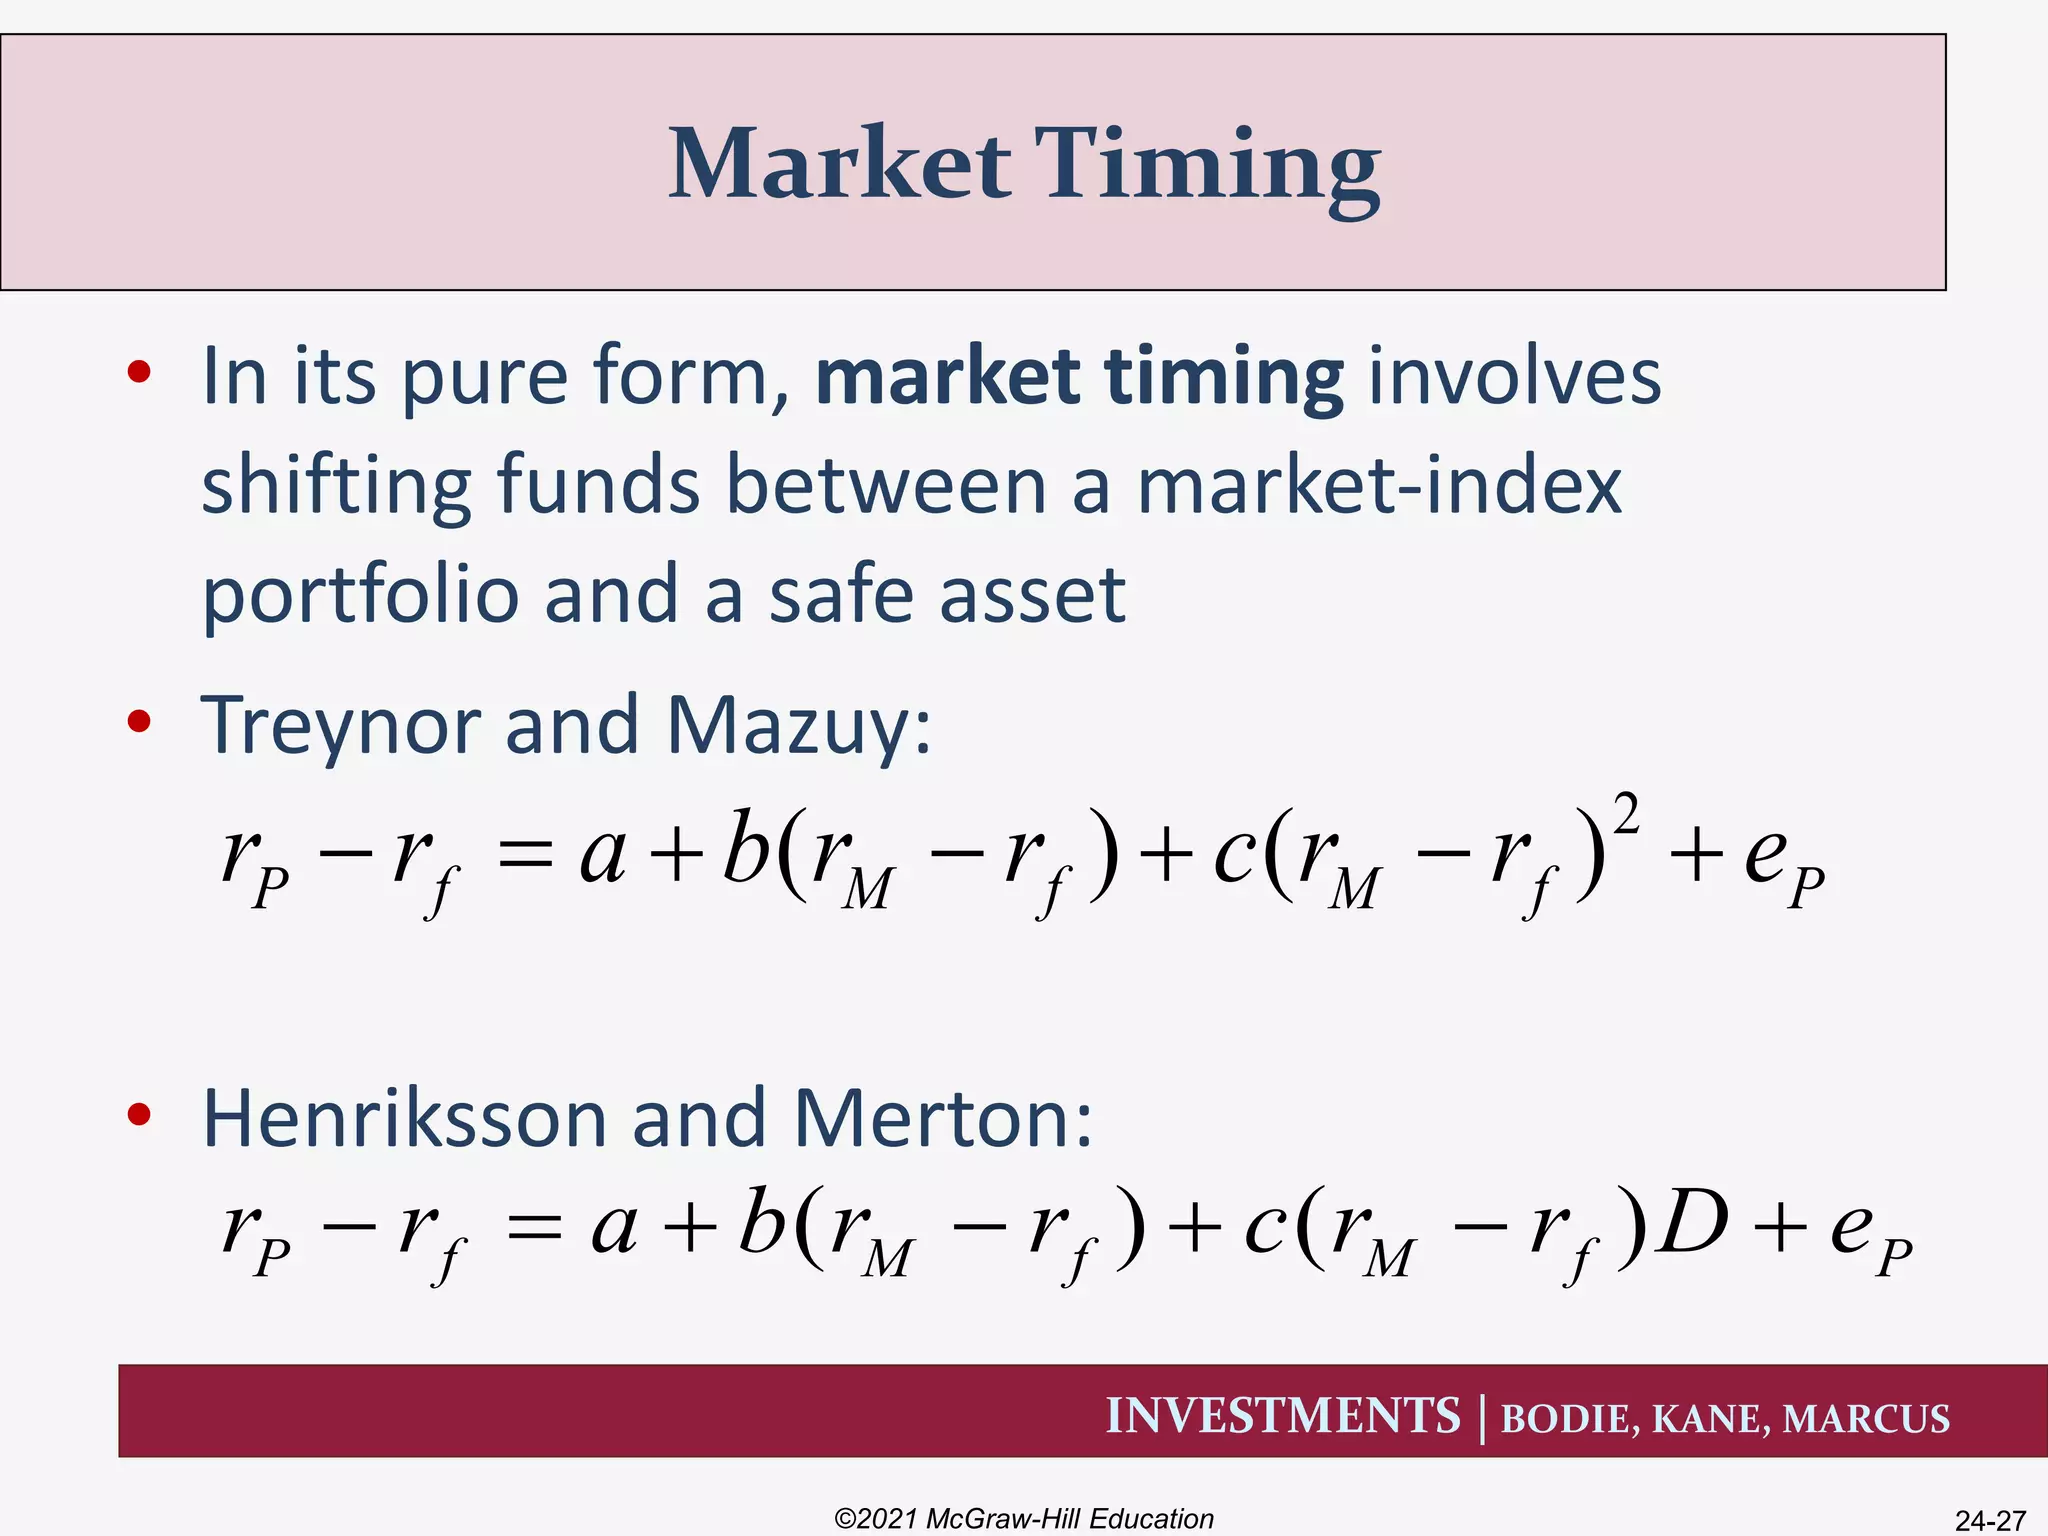
Dr. Muath Asmar
Investment & Portfolio
Management
AN-NAJAH
NATIONAL UNIVERSITY
Faculty of Graduate Studies
INVESTMENTS | BODIE, KANE, MARCUS
©2021 McGraw-Hill Education. All rights reserved. Authorized only for instructor use in the classroom.
No reproduction or further distribution permitted without the prior written consent of McGraw-Hill Education.
Chapter Twenty-Four
Portfolio Performance
Evaluation
INVESTMENTS | BODIE, KANE, MARCUS
• If markets are efficient, investors must be able
to measure performance of their asset
managers
• Discuss methods to evaluate investment
performance
• Conventional approaches to risk adjustment
Overview
©2021 McGraw-Hill Education 24-3
INVESTMENTS | BODIE, KANE, MARCUS
• Time-weighted average
• Geometric average is a time-weighted average
• Each period’s return has equal weight
Time-Weighted Returns
©2021 McGraw-Hill Education 24-4
       
     
1 2
1/
1 2
1 1 1 ... 1
1 1 ... 1 1
n
G n
n
G n
r r r r
r r r r
       
         
INVESTMENTS | BODIE, KANE, MARCUS
• Dollar-weighted rate of return is the internal
rate of return on an investment
• Returns are weighted by the amount invested in
each period
Dollar-Weighted Returns
(1 of 2)
©2021 McGraw-Hill Education 24-5
     n
n
r
C
r
C
r
C
PV






1
...
11
2
2
1
1
INVESTMENTS | BODIE, KANE, MARCUS
• Consider a stock paying a dividend of $2 annually that
currently sells for $50. You purchase the stock today, collect
the $2 dividend, and sell it for $53 at year-end.
• Using DCF approach, the IRR is equal to:
• The time-weighted (geometric average) return is 7.81%
Dollar-Weighted Return
(2 of 2)
©2021 McGraw-Hill Education 24-6
INVESTMENTS | BODIE, KANE, MARCUS
• Simplest and most popular way to adjust for
risk is to compare rates of return with those of
other investment funds with similar risk
characteristics
• Comparison universe is the set of money
managers employing similar investment styles,
used for assessing the relative performance of a
portfolio manager
Adjusting Returns for Risk
©2021 McGraw-Hill Education 24-7
INVESTMENTS | BODIE, KANE, MARCUS
Universe Comparison
©2021 McGraw-Hill Education 24-8
INVESTMENTS | BODIE, KANE, MARCUS
• Sharpe’s ratio divides average portfolio excess
return over the sample period by the standard
deviation of returns over that period
• Measures reward to (total) volatility trade-off
Risk-Adjusted Performance: Sharpe
©2021 McGraw-Hill Education 24-9
INVESTMENTS | BODIE, KANE, MARCUS
• Treynor’s measure is a ratio of excess return
to beta, like the Sharpe ratio, but it uses
systematic risk instead of total risk
Risk-Adjusted Performance: Treynor
©2021 McGraw-Hill Education 24-10
INVESTMENTS | BODIE, KANE, MARCUS
• Jensen’s alpha is the average return on the
portfolio over and above that predicted by the
CAPM, given the portfolio’s beta and the
average market return
Risk-Adjusted Performance: Jensen
©2021 McGraw-Hill Education 24-11
INVESTMENTS | BODIE, KANE, MARCUS
• Information ratio divides the alpha of the
portfolio by the nonsystematic risk of the
portfolio, called “tracking error” in the
industry
• Measures abnormal return per unit of risk that in
principle could be diversified away by holding a
market index portfolio
Risk-Adjusted Performance:
Information Ratio
©2021 McGraw-Hill Education 24-12
INVESTMENTS | BODIE, KANE, MARCUS
• Focuses on total volatility as a measure of risk,
but its risk adjustment leads to an easy-to-
interpret differential return relative to the
benchmark index
M2
Measure and the Shape Ratio
©2021 McGraw-Hill Education 24-13
INVESTMENTS | BODIE, KANE, MARCUS
M2
of Portfolio P
©2021 McGraw-Hill Education 24-14
INVESTMENTS | BODIE, KANE, MARCUS
Appropriate Performance Measure
©2021 McGraw-Hill Education 24-15
INVESTMENTS | BODIE, KANE, MARCUS
• A positive alpha is necessary to outperform
the passive market index
• Though necessary, it’s not enough to guarantee a
portfolio will outperform the index
• Most widely used performance measure
The Role of Alpha in
Performance Measures
©2021 McGraw-Hill Education 24-16
INVESTMENTS | BODIE, KANE, MARCUS
Performance Statistics
©2021 McGraw-Hill Education 24-17
INVESTMENTS | BODIE, KANE, MARCUS
• If P or Q represents the entire investment, Q is
better because of its higher Sharpe measure
and better M2
• If P and Q are competing for a role as one of a
number of subportfolios, Q also dominates
because its Treynor measure is higher
• If we seek an active portfolio to mix with an
index portfolio, P is better due to its higher
information ratio
Interpretation of
Performance Statistics
©2021 McGraw-Hill Education 24-18
INVESTMENTS | BODIE, KANE, MARCUS
• Must determine “significance level” of a
performance measure to know whether it reliably
indicates ability
• To estimate the portfolio alpha from the SCL, regress
portfolio excess returns on the market index
• Then, to assess whether the alpha estimate reflects
true skill and not just luck, compute the t-statistic of
the alpha estimate
• Even moderate levels of statistical noise make
performance evaluation extremely difficult
Realized Returns versus Expected
Returns
©2021 McGraw-Hill Education 24-19
INVESTMENTS | BODIE, KANE, MARCUS
• Regardless of the performance criterion, some
funds will outperform their benchmarks in any
year, and some will underperform
• Recall, performance in one period is not
predictive of future performance
• Limiting a sample of funds to those for which
returns are available over an entire sample
period introduces survivorship bias
Survivorship Bias and Portfolio
Evaluation
©2021 McGraw-Hill Education 24-20
INVESTMENTS | BODIE, KANE, MARCUS
• Style analysis, a tool to systematically measure the
exposures of managed portfolios, was introduced
by William Sharpe
• Idea is to regress fund returns on indexes representing a
range of asset classes
• Regression coefficient on each index would then measure the
fund’s implicit allocation to that “style”
• R2 of regression would measure percentage of return variability
attributable to style choice rather than security selection
• Intercept measures average return from security selection of
the fund portfolio
Style Analysis
©2021 McGraw-Hill Education 24-21
INVESTMENTS | BODIE, KANE, MARCUS
Style Analysis for Fidelity’s
Magellan Fund
©2021 McGraw-Hill Education 24-22
INVESTMENTS | BODIE, KANE, MARCUS
Fidelity Magellan Fund Cumulative
Return Difference
©2021 McGraw-Hill Education 24-23
INVESTMENTS | BODIE, KANE, MARCUS
Average Tracking Error for 636
Mutual Funds, 1985-1989
©2021 McGraw-Hill Education 24-24
INVESTMENTS | BODIE, KANE, MARCUS
• Risk-adjustment techniques all assume that
portfolio risk is constant over the relevant
time period, which isn’t necessarily true
• Performance Manipulation and the MRAR
• Managers may try to game the system, given their
compensation depends on performance
• Only measure impossible to manipulate is MRAR
Performance Measurement with
Changing Portfolio Composition
©2021 McGraw-Hill Education 24-25
INVESTMENTS | BODIE, KANE, MARCUS
MRAR Scores with and without
Manipulation
©2021 McGraw-Hill Education 24-26
INVESTMENTS | BODIE, KANE, MARCUS
• In its pure form, market timing involves
shifting funds between a market-index
portfolio and a safe asset
• Treynor and Mazuy:
• Henriksson and Merton:
Market Timing
©2021 McGraw-Hill Education 24-27
2
( ) ( )P f M f M f Pr r a b r r c r r e      
( ) ( )P f M f M f Pr r a b r r c r r D e      
INVESTMENTS | BODIE, KANE, MARCUS
Characteristic Lines
©2021 McGraw-Hill Education 24-28
INVESTMENTS | BODIE, KANE, MARCUS
Performance of Bills, Equities, and
Perfect (Annual) Market Timers
©2021 McGraw-Hill Education 24-29
INVESTMENTS | BODIE, KANE, MARCUS
• Key to valuing market
timing ability is to
recognize that perfect
foresight is equivalent
to holding a call option
on the equity portfolio
– but without having to
pay for it!
Valuing Market Timing as a Call
Option
©2021 McGraw-Hill Education 24-30
INVESTMENTS | BODIE, KANE, MARCUS
• Performance attribution studies attempt to
decompose overall performance into discrete
components that may be identified with a
particular level of the portfolio selection process
• A common attribution system decomposes
performance into three components:
1. Broad asset allocation choices across equity, fixed-
income, and money markets
2. Industry (sector) choice within each market
3. Security choice within each sector
Performance Attribution Procedures
(1 of 2)
©2021 McGraw-Hill Education 24-31
INVESTMENTS | BODIE, KANE, MARCUS
• Bogey is designed to measure the returns the
portfolio manager would earn if he or she
were to follow a completely passive strategy
• In this context, “passive” has two attributes
1. It means the allocation of funds across broad asset
classes is set in accord with a notion of “usual”
allocation across sectors
2. It means that within each asset class, the portfolio
manager holds an indexed portfolio
Performance Attribution Procedures
(2 of 2)
©2021 McGraw-Hill Education 24-32
INVESTMENTS | BODIE, KANE, MARCUS
• Superior performance relative to the bogey is
achieved by:
• Overweighting investments in markets that turn
out to perform well
• Underweighting investments in poorly performing
markets
• Contribution of asset allocation to superior
performance equals the sum over all markets
of the excess weight in each market times the
return of the index for each market
Asset Allocation Decisions
©2021 McGraw-Hill Education 24-33
INVESTMENTS | BODIE, KANE, MARCUS
• Good performance (a positive contribution) derives
from overweighting well-performing sectors
• Good performance also derives from underweighting
poorly performing sectors
Sector and Security Selection
Decisions
©2021 McGraw-Hill Education 24-34

Chapter (24).

  • 1.
    Dr. Muath Asmar Investment& Portfolio Management AN-NAJAH NATIONAL UNIVERSITY Faculty of Graduate Studies
  • 2.
    INVESTMENTS | BODIE,KANE, MARCUS ©2021 McGraw-Hill Education. All rights reserved. Authorized only for instructor use in the classroom. No reproduction or further distribution permitted without the prior written consent of McGraw-Hill Education. Chapter Twenty-Four Portfolio Performance Evaluation
  • 3.
    INVESTMENTS | BODIE,KANE, MARCUS • If markets are efficient, investors must be able to measure performance of their asset managers • Discuss methods to evaluate investment performance • Conventional approaches to risk adjustment Overview ©2021 McGraw-Hill Education 24-3
  • 4.
    INVESTMENTS | BODIE,KANE, MARCUS • Time-weighted average • Geometric average is a time-weighted average • Each period’s return has equal weight Time-Weighted Returns ©2021 McGraw-Hill Education 24-4               1 2 1/ 1 2 1 1 1 ... 1 1 1 ... 1 1 n G n n G n r r r r r r r r                  
  • 5.
    INVESTMENTS | BODIE,KANE, MARCUS • Dollar-weighted rate of return is the internal rate of return on an investment • Returns are weighted by the amount invested in each period Dollar-Weighted Returns (1 of 2) ©2021 McGraw-Hill Education 24-5      n n r C r C r C PV       1 ... 11 2 2 1 1
  • 6.
    INVESTMENTS | BODIE,KANE, MARCUS • Consider a stock paying a dividend of $2 annually that currently sells for $50. You purchase the stock today, collect the $2 dividend, and sell it for $53 at year-end. • Using DCF approach, the IRR is equal to: • The time-weighted (geometric average) return is 7.81% Dollar-Weighted Return (2 of 2) ©2021 McGraw-Hill Education 24-6
  • 7.
    INVESTMENTS | BODIE,KANE, MARCUS • Simplest and most popular way to adjust for risk is to compare rates of return with those of other investment funds with similar risk characteristics • Comparison universe is the set of money managers employing similar investment styles, used for assessing the relative performance of a portfolio manager Adjusting Returns for Risk ©2021 McGraw-Hill Education 24-7
  • 8.
    INVESTMENTS | BODIE,KANE, MARCUS Universe Comparison ©2021 McGraw-Hill Education 24-8
  • 9.
    INVESTMENTS | BODIE,KANE, MARCUS • Sharpe’s ratio divides average portfolio excess return over the sample period by the standard deviation of returns over that period • Measures reward to (total) volatility trade-off Risk-Adjusted Performance: Sharpe ©2021 McGraw-Hill Education 24-9
  • 10.
    INVESTMENTS | BODIE,KANE, MARCUS • Treynor’s measure is a ratio of excess return to beta, like the Sharpe ratio, but it uses systematic risk instead of total risk Risk-Adjusted Performance: Treynor ©2021 McGraw-Hill Education 24-10
  • 11.
    INVESTMENTS | BODIE,KANE, MARCUS • Jensen’s alpha is the average return on the portfolio over and above that predicted by the CAPM, given the portfolio’s beta and the average market return Risk-Adjusted Performance: Jensen ©2021 McGraw-Hill Education 24-11
  • 12.
    INVESTMENTS | BODIE,KANE, MARCUS • Information ratio divides the alpha of the portfolio by the nonsystematic risk of the portfolio, called “tracking error” in the industry • Measures abnormal return per unit of risk that in principle could be diversified away by holding a market index portfolio Risk-Adjusted Performance: Information Ratio ©2021 McGraw-Hill Education 24-12
  • 13.
    INVESTMENTS | BODIE,KANE, MARCUS • Focuses on total volatility as a measure of risk, but its risk adjustment leads to an easy-to- interpret differential return relative to the benchmark index M2 Measure and the Shape Ratio ©2021 McGraw-Hill Education 24-13
  • 14.
    INVESTMENTS | BODIE,KANE, MARCUS M2 of Portfolio P ©2021 McGraw-Hill Education 24-14
  • 15.
    INVESTMENTS | BODIE,KANE, MARCUS Appropriate Performance Measure ©2021 McGraw-Hill Education 24-15
  • 16.
    INVESTMENTS | BODIE,KANE, MARCUS • A positive alpha is necessary to outperform the passive market index • Though necessary, it’s not enough to guarantee a portfolio will outperform the index • Most widely used performance measure The Role of Alpha in Performance Measures ©2021 McGraw-Hill Education 24-16
  • 17.
    INVESTMENTS | BODIE,KANE, MARCUS Performance Statistics ©2021 McGraw-Hill Education 24-17
  • 18.
    INVESTMENTS | BODIE,KANE, MARCUS • If P or Q represents the entire investment, Q is better because of its higher Sharpe measure and better M2 • If P and Q are competing for a role as one of a number of subportfolios, Q also dominates because its Treynor measure is higher • If we seek an active portfolio to mix with an index portfolio, P is better due to its higher information ratio Interpretation of Performance Statistics ©2021 McGraw-Hill Education 24-18
  • 19.
    INVESTMENTS | BODIE,KANE, MARCUS • Must determine “significance level” of a performance measure to know whether it reliably indicates ability • To estimate the portfolio alpha from the SCL, regress portfolio excess returns on the market index • Then, to assess whether the alpha estimate reflects true skill and not just luck, compute the t-statistic of the alpha estimate • Even moderate levels of statistical noise make performance evaluation extremely difficult Realized Returns versus Expected Returns ©2021 McGraw-Hill Education 24-19
  • 20.
    INVESTMENTS | BODIE,KANE, MARCUS • Regardless of the performance criterion, some funds will outperform their benchmarks in any year, and some will underperform • Recall, performance in one period is not predictive of future performance • Limiting a sample of funds to those for which returns are available over an entire sample period introduces survivorship bias Survivorship Bias and Portfolio Evaluation ©2021 McGraw-Hill Education 24-20
  • 21.
    INVESTMENTS | BODIE,KANE, MARCUS • Style analysis, a tool to systematically measure the exposures of managed portfolios, was introduced by William Sharpe • Idea is to regress fund returns on indexes representing a range of asset classes • Regression coefficient on each index would then measure the fund’s implicit allocation to that “style” • R2 of regression would measure percentage of return variability attributable to style choice rather than security selection • Intercept measures average return from security selection of the fund portfolio Style Analysis ©2021 McGraw-Hill Education 24-21
  • 22.
    INVESTMENTS | BODIE,KANE, MARCUS Style Analysis for Fidelity’s Magellan Fund ©2021 McGraw-Hill Education 24-22
  • 23.
    INVESTMENTS | BODIE,KANE, MARCUS Fidelity Magellan Fund Cumulative Return Difference ©2021 McGraw-Hill Education 24-23
  • 24.
    INVESTMENTS | BODIE,KANE, MARCUS Average Tracking Error for 636 Mutual Funds, 1985-1989 ©2021 McGraw-Hill Education 24-24
  • 25.
    INVESTMENTS | BODIE,KANE, MARCUS • Risk-adjustment techniques all assume that portfolio risk is constant over the relevant time period, which isn’t necessarily true • Performance Manipulation and the MRAR • Managers may try to game the system, given their compensation depends on performance • Only measure impossible to manipulate is MRAR Performance Measurement with Changing Portfolio Composition ©2021 McGraw-Hill Education 24-25
  • 26.
    INVESTMENTS | BODIE,KANE, MARCUS MRAR Scores with and without Manipulation ©2021 McGraw-Hill Education 24-26
  • 27.
    INVESTMENTS | BODIE,KANE, MARCUS • In its pure form, market timing involves shifting funds between a market-index portfolio and a safe asset • Treynor and Mazuy: • Henriksson and Merton: Market Timing ©2021 McGraw-Hill Education 24-27 2 ( ) ( )P f M f M f Pr r a b r r c r r e       ( ) ( )P f M f M f Pr r a b r r c r r D e      
  • 28.
    INVESTMENTS | BODIE,KANE, MARCUS Characteristic Lines ©2021 McGraw-Hill Education 24-28
  • 29.
    INVESTMENTS | BODIE,KANE, MARCUS Performance of Bills, Equities, and Perfect (Annual) Market Timers ©2021 McGraw-Hill Education 24-29
  • 30.
    INVESTMENTS | BODIE,KANE, MARCUS • Key to valuing market timing ability is to recognize that perfect foresight is equivalent to holding a call option on the equity portfolio – but without having to pay for it! Valuing Market Timing as a Call Option ©2021 McGraw-Hill Education 24-30
  • 31.
    INVESTMENTS | BODIE,KANE, MARCUS • Performance attribution studies attempt to decompose overall performance into discrete components that may be identified with a particular level of the portfolio selection process • A common attribution system decomposes performance into three components: 1. Broad asset allocation choices across equity, fixed- income, and money markets 2. Industry (sector) choice within each market 3. Security choice within each sector Performance Attribution Procedures (1 of 2) ©2021 McGraw-Hill Education 24-31
  • 32.
    INVESTMENTS | BODIE,KANE, MARCUS • Bogey is designed to measure the returns the portfolio manager would earn if he or she were to follow a completely passive strategy • In this context, “passive” has two attributes 1. It means the allocation of funds across broad asset classes is set in accord with a notion of “usual” allocation across sectors 2. It means that within each asset class, the portfolio manager holds an indexed portfolio Performance Attribution Procedures (2 of 2) ©2021 McGraw-Hill Education 24-32
  • 33.
    INVESTMENTS | BODIE,KANE, MARCUS • Superior performance relative to the bogey is achieved by: • Overweighting investments in markets that turn out to perform well • Underweighting investments in poorly performing markets • Contribution of asset allocation to superior performance equals the sum over all markets of the excess weight in each market times the return of the index for each market Asset Allocation Decisions ©2021 McGraw-Hill Education 24-33
  • 34.
    INVESTMENTS | BODIE,KANE, MARCUS • Good performance (a positive contribution) derives from overweighting well-performing sectors • Good performance also derives from underweighting poorly performing sectors Sector and Security Selection Decisions ©2021 McGraw-Hill Education 24-34

Editor's Notes

  • #7 The internal rate of return is called the dollar-weighted rate of return because the stock’s performance in the second year, when two shares of stock are held, has a greater influence on the average overall return than the first-year return, when only one share is held.
  • #15 See Example 24.1.
  • #18 These figures are calculated using the information in Table 24.2.
  • #26 The rating is a sort of harmonic average of excess returns, where t = 1,. . . , T are monthly observations, and γ measures investor risk aversion. For mutual funds, Morningstar uses γ = 2, which is considered a reasonable value for an average retail client.