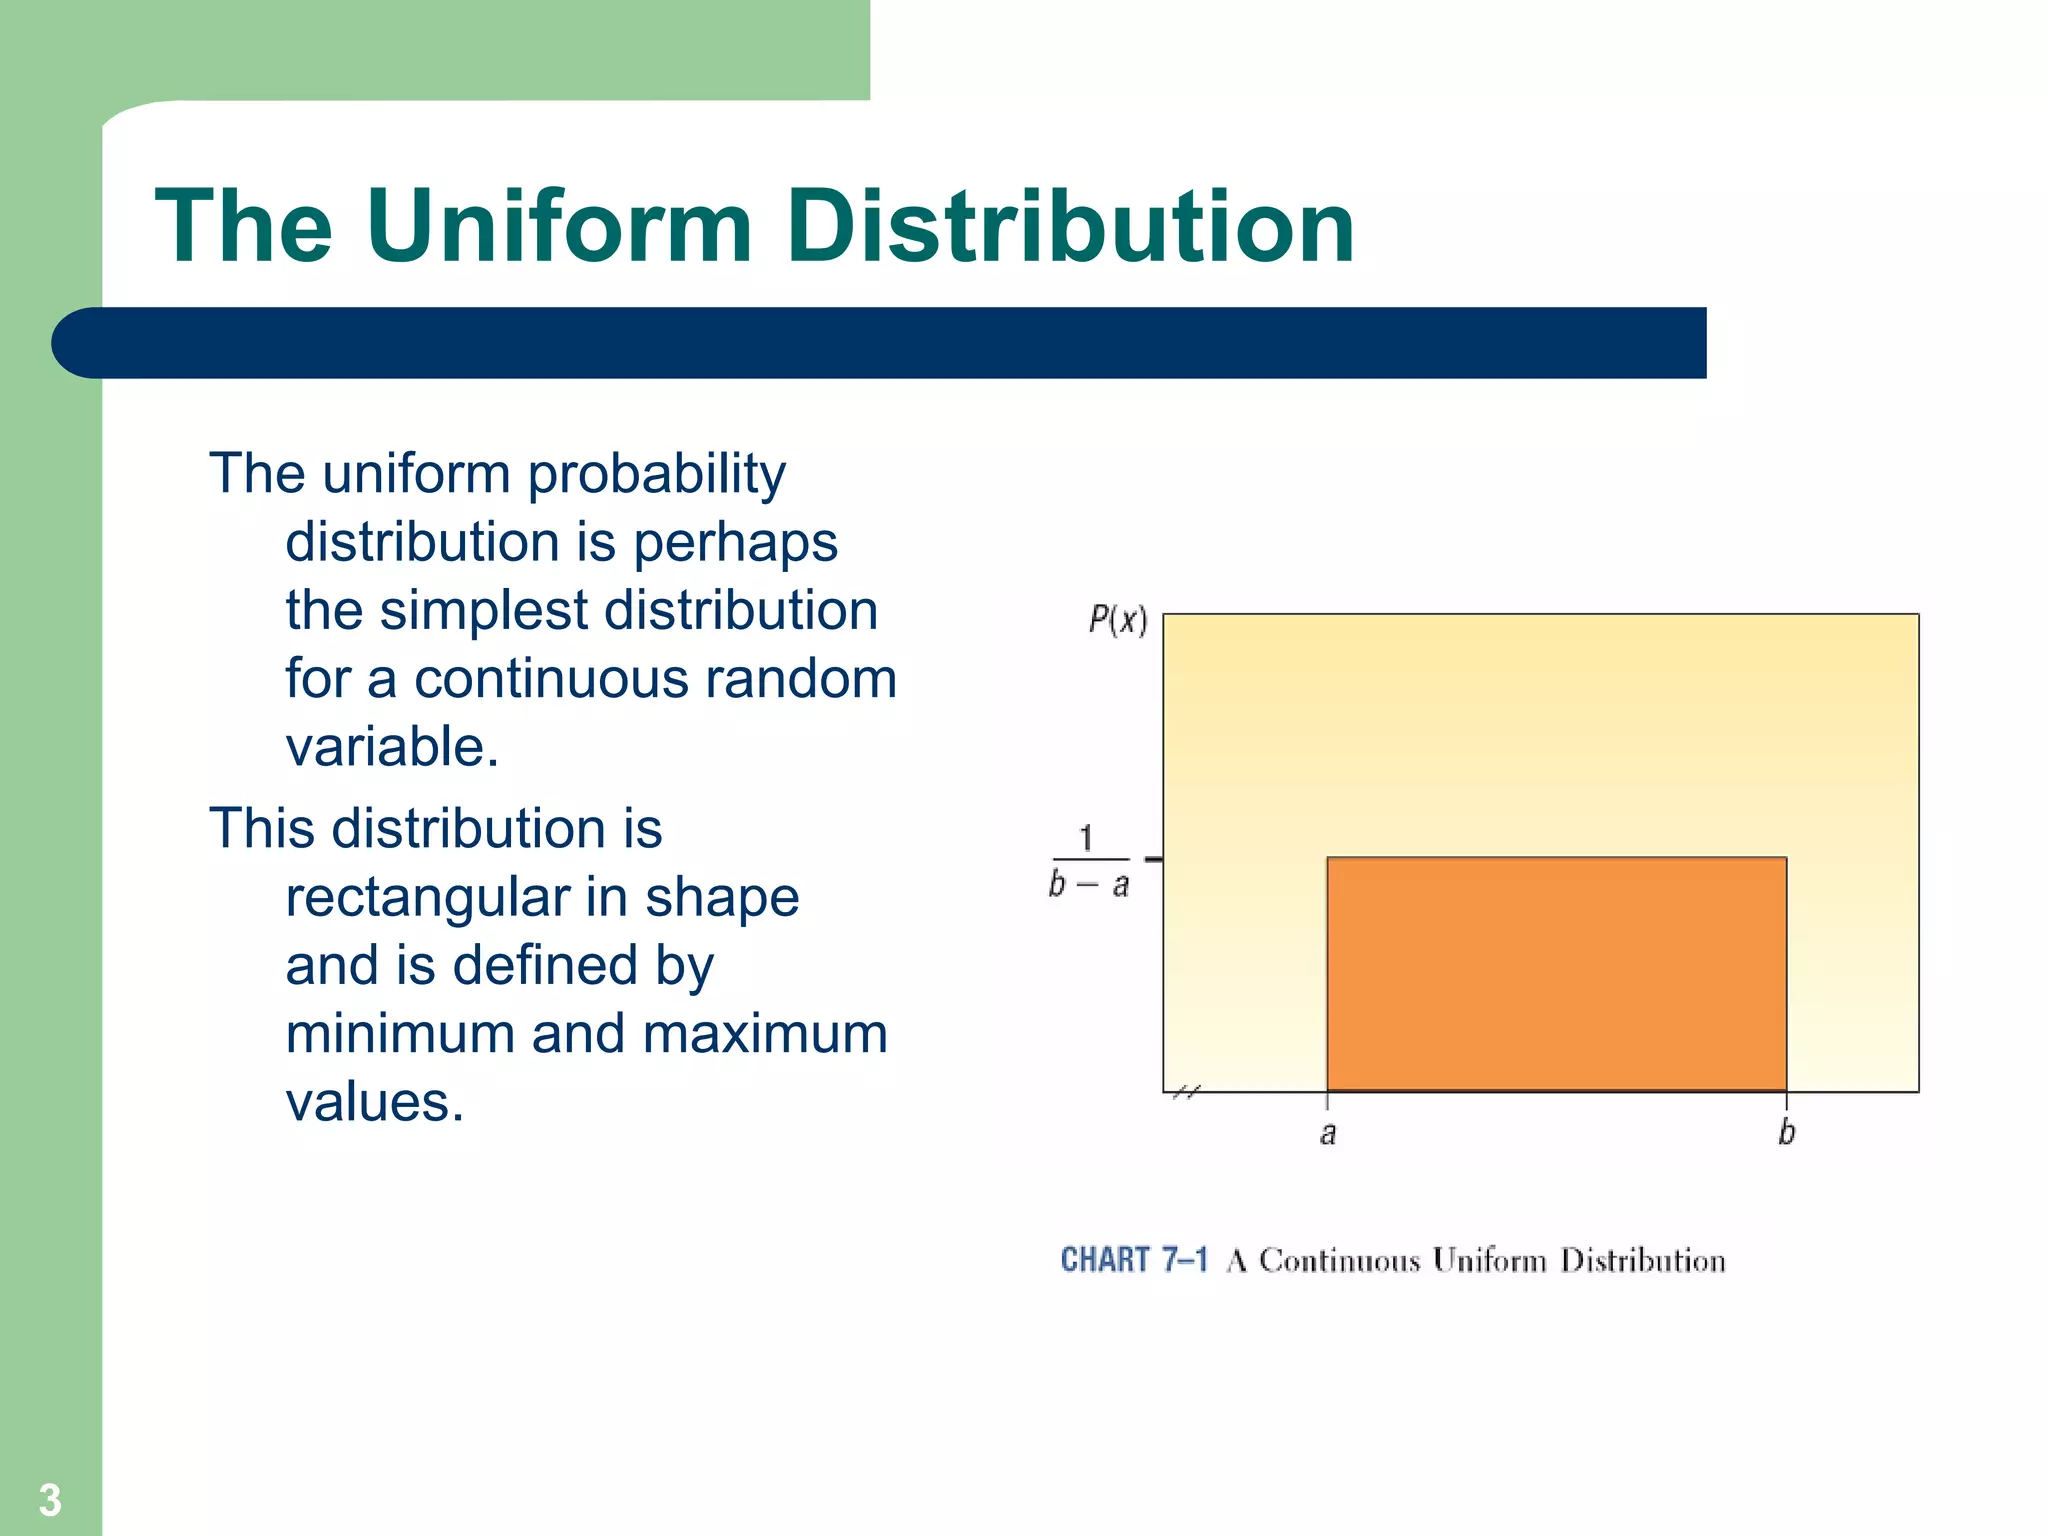
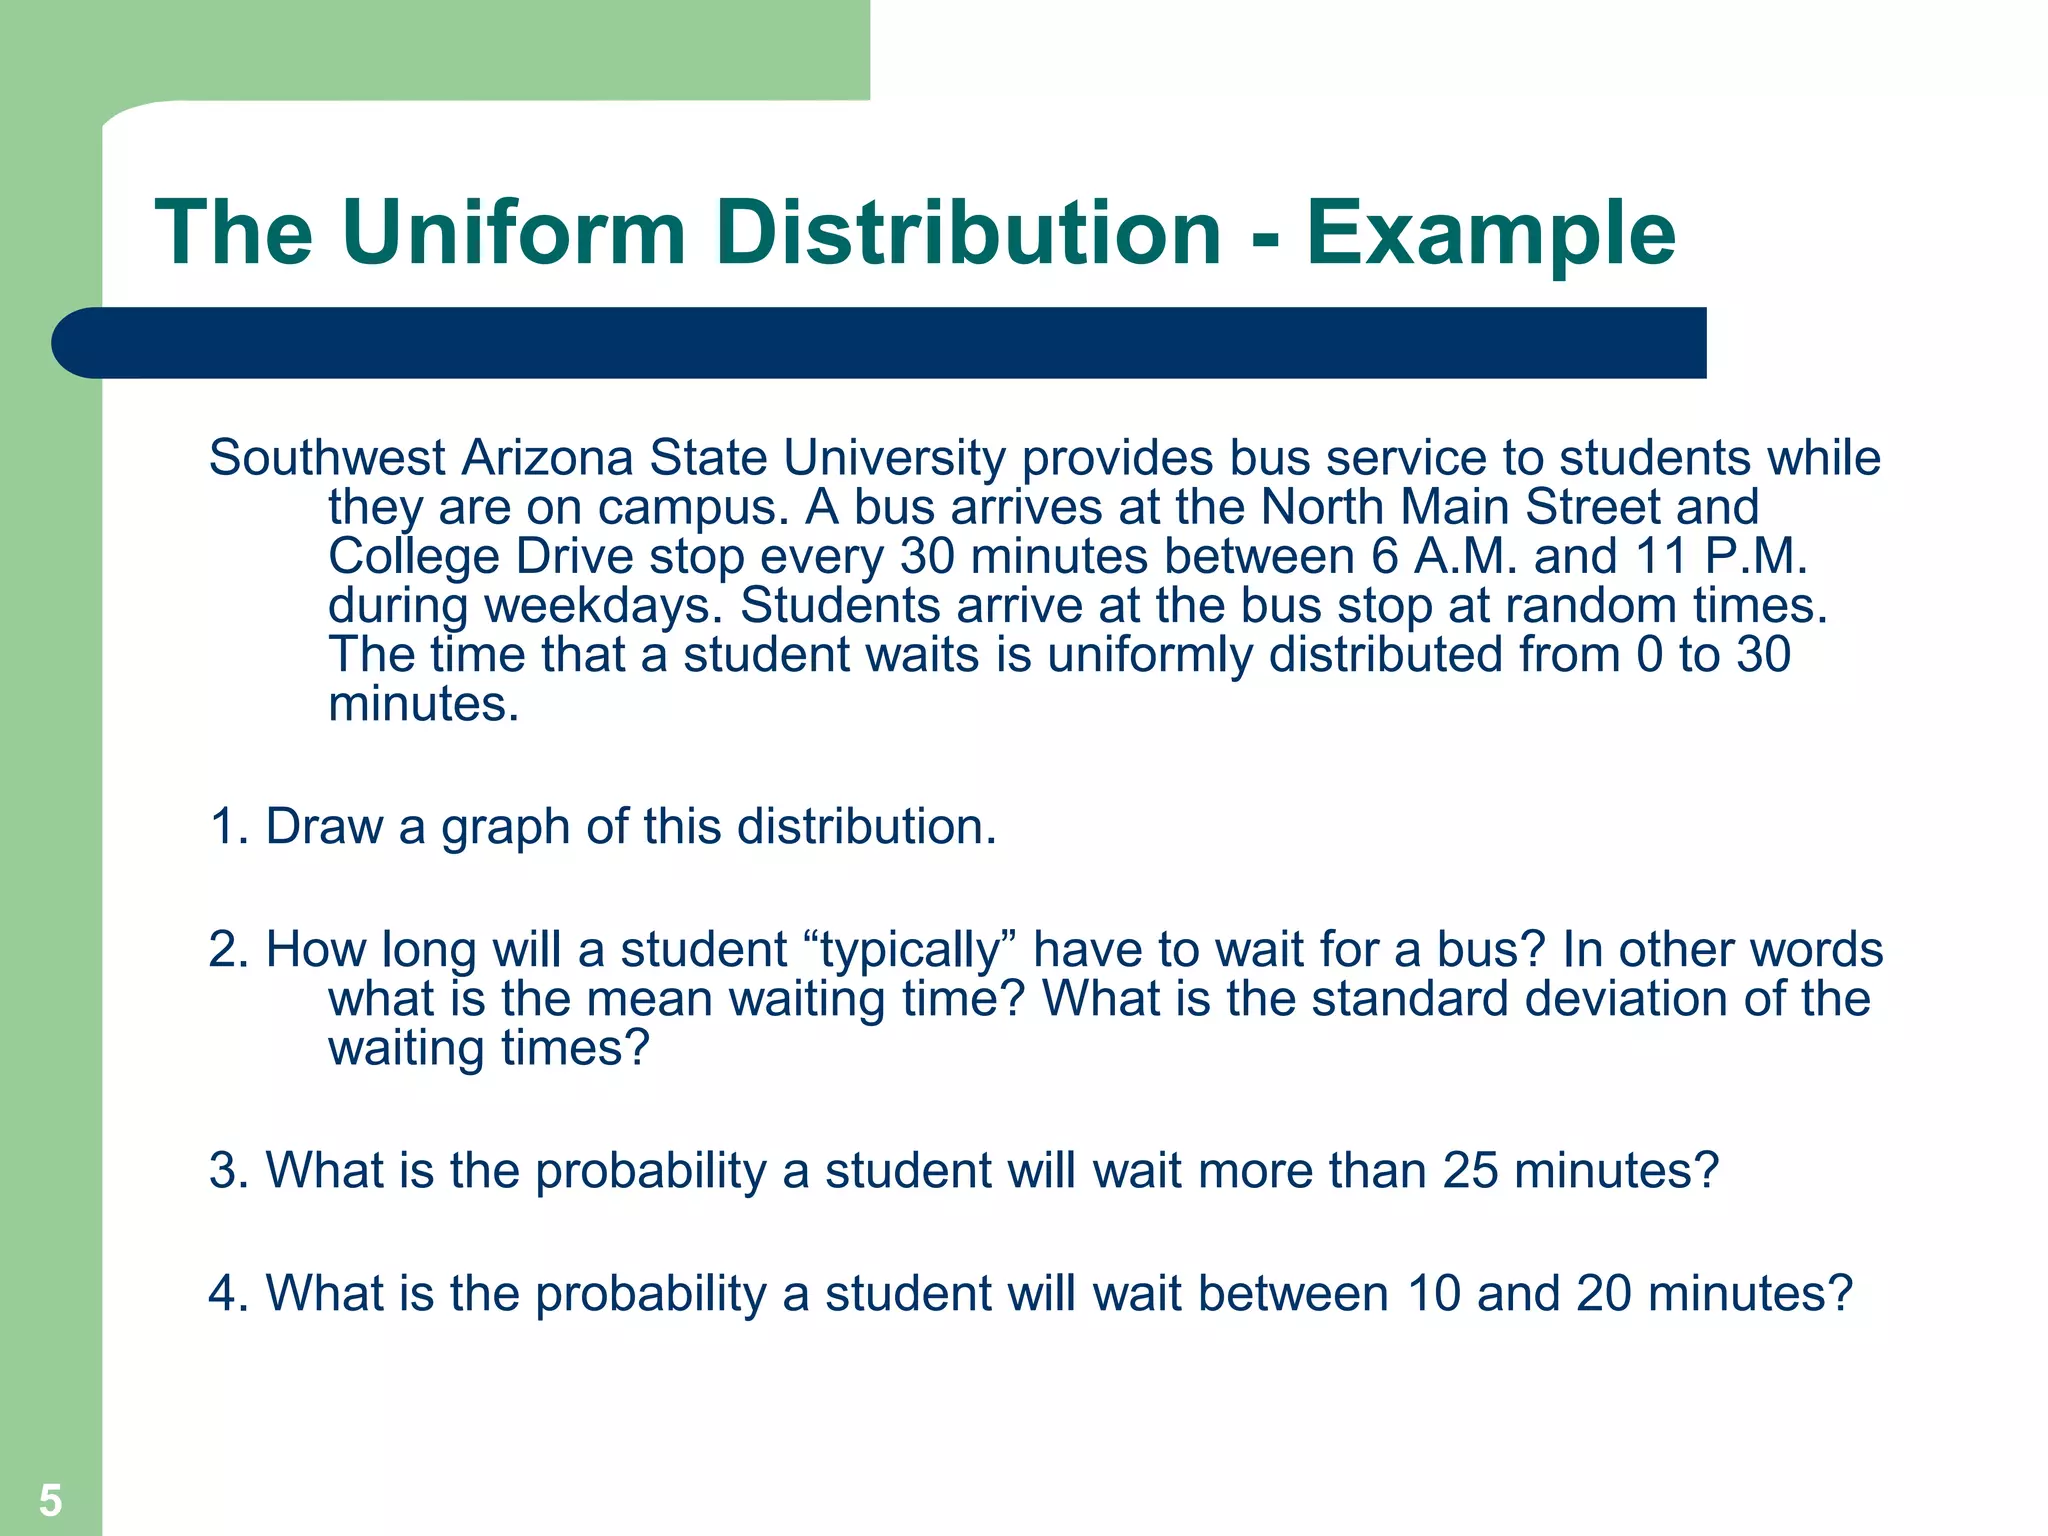
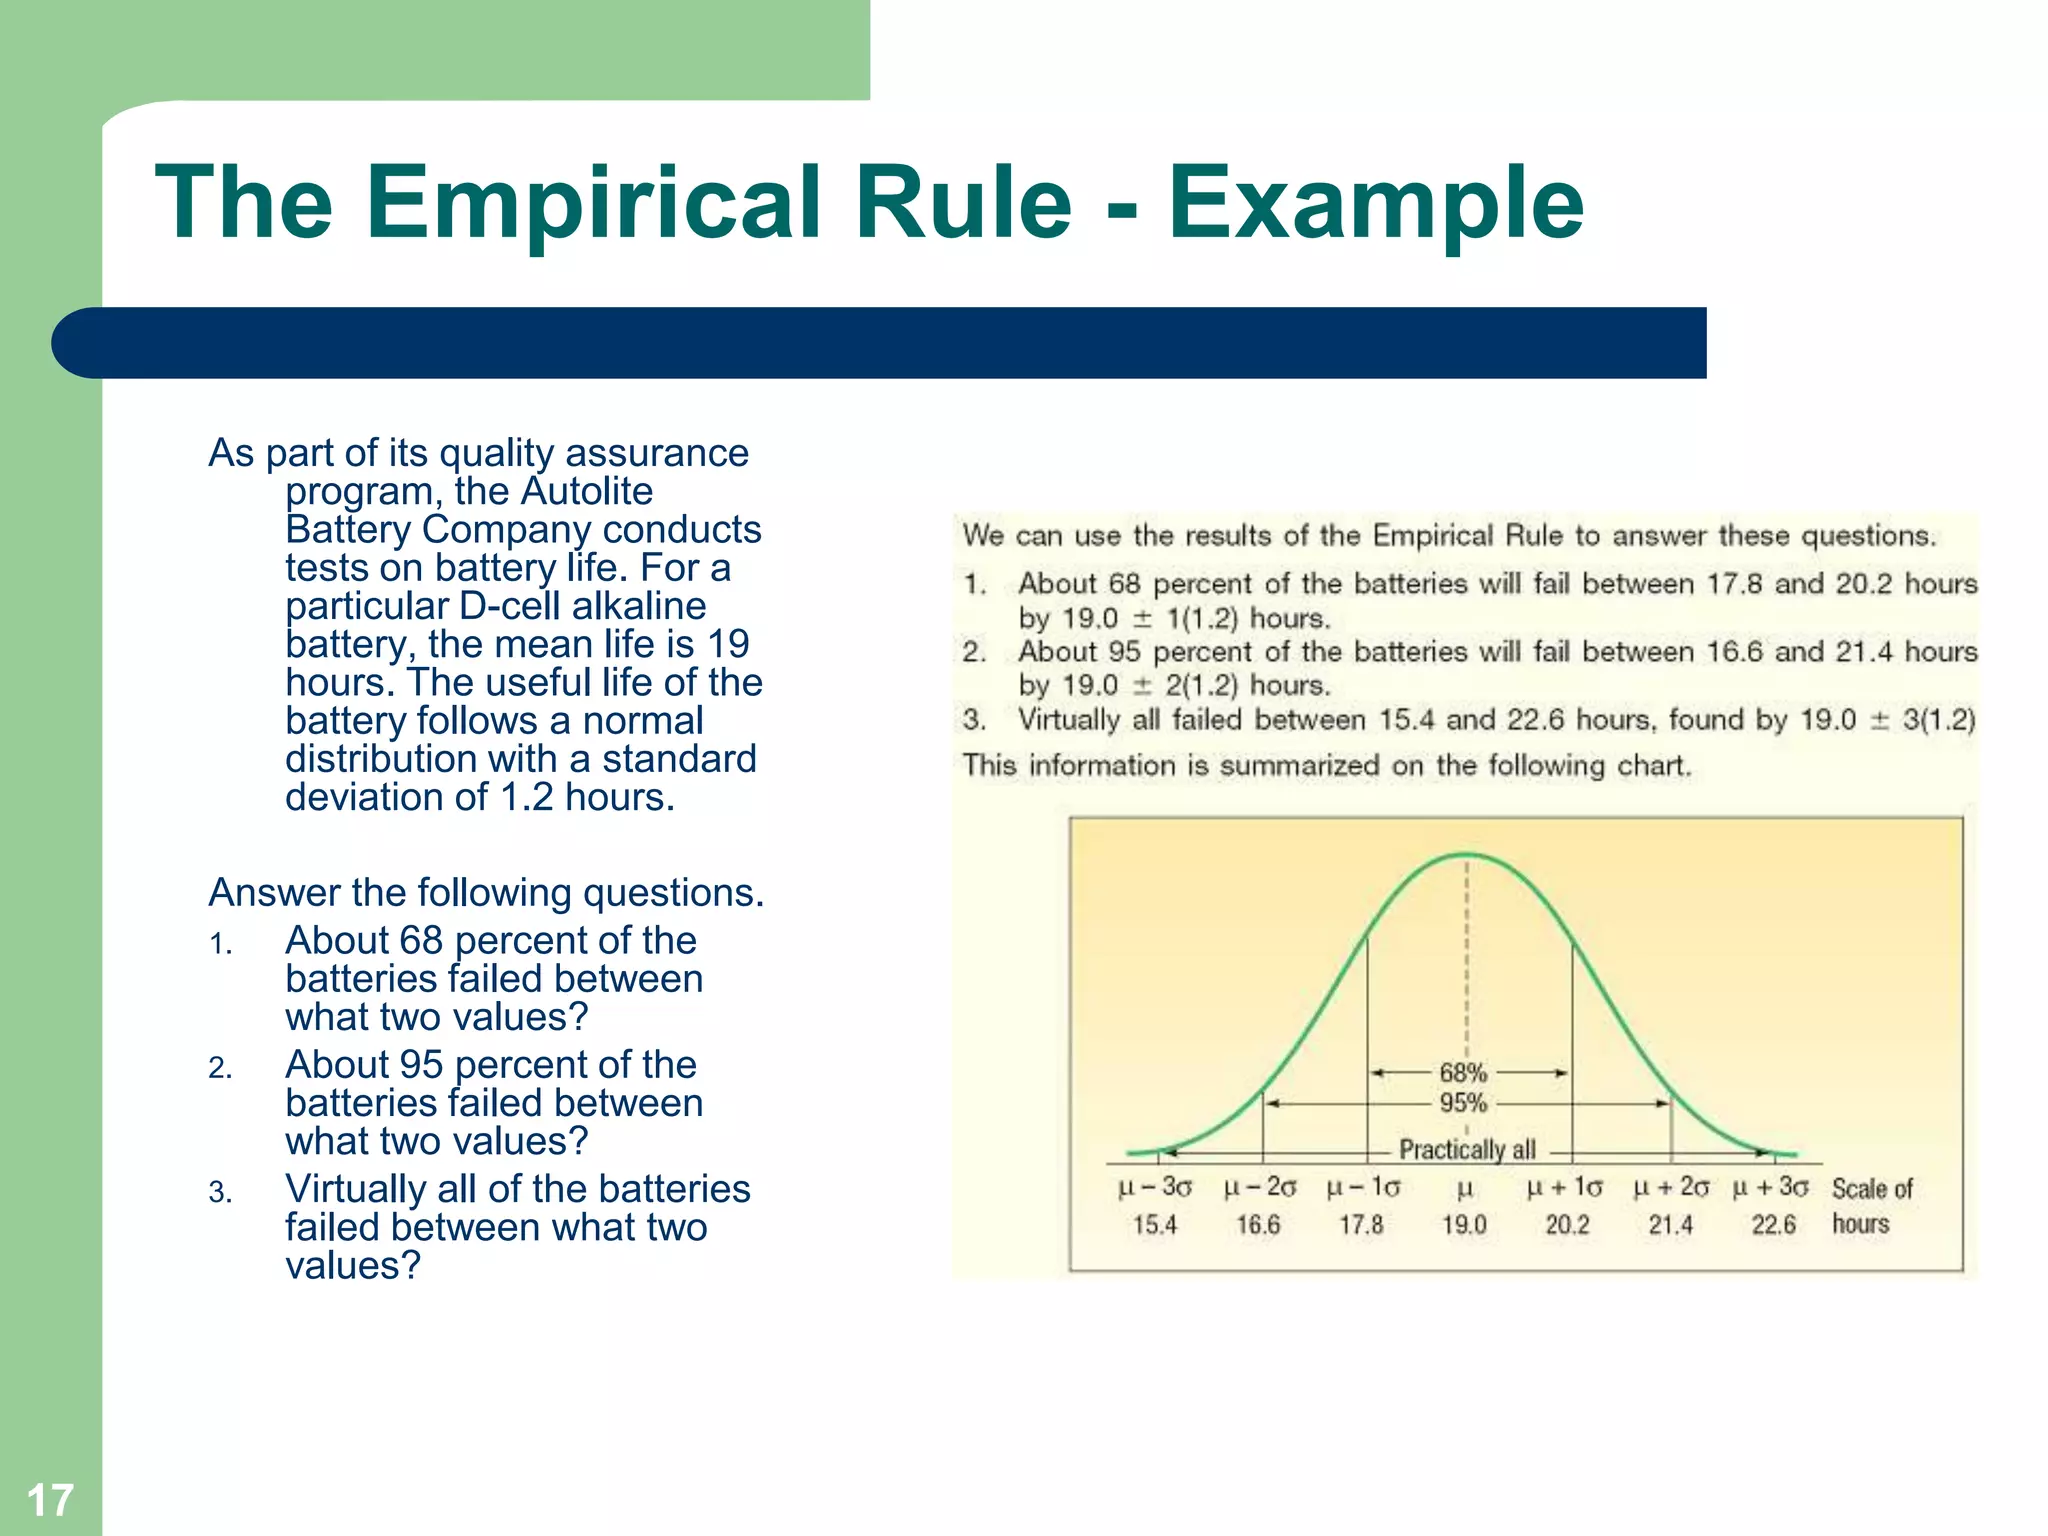
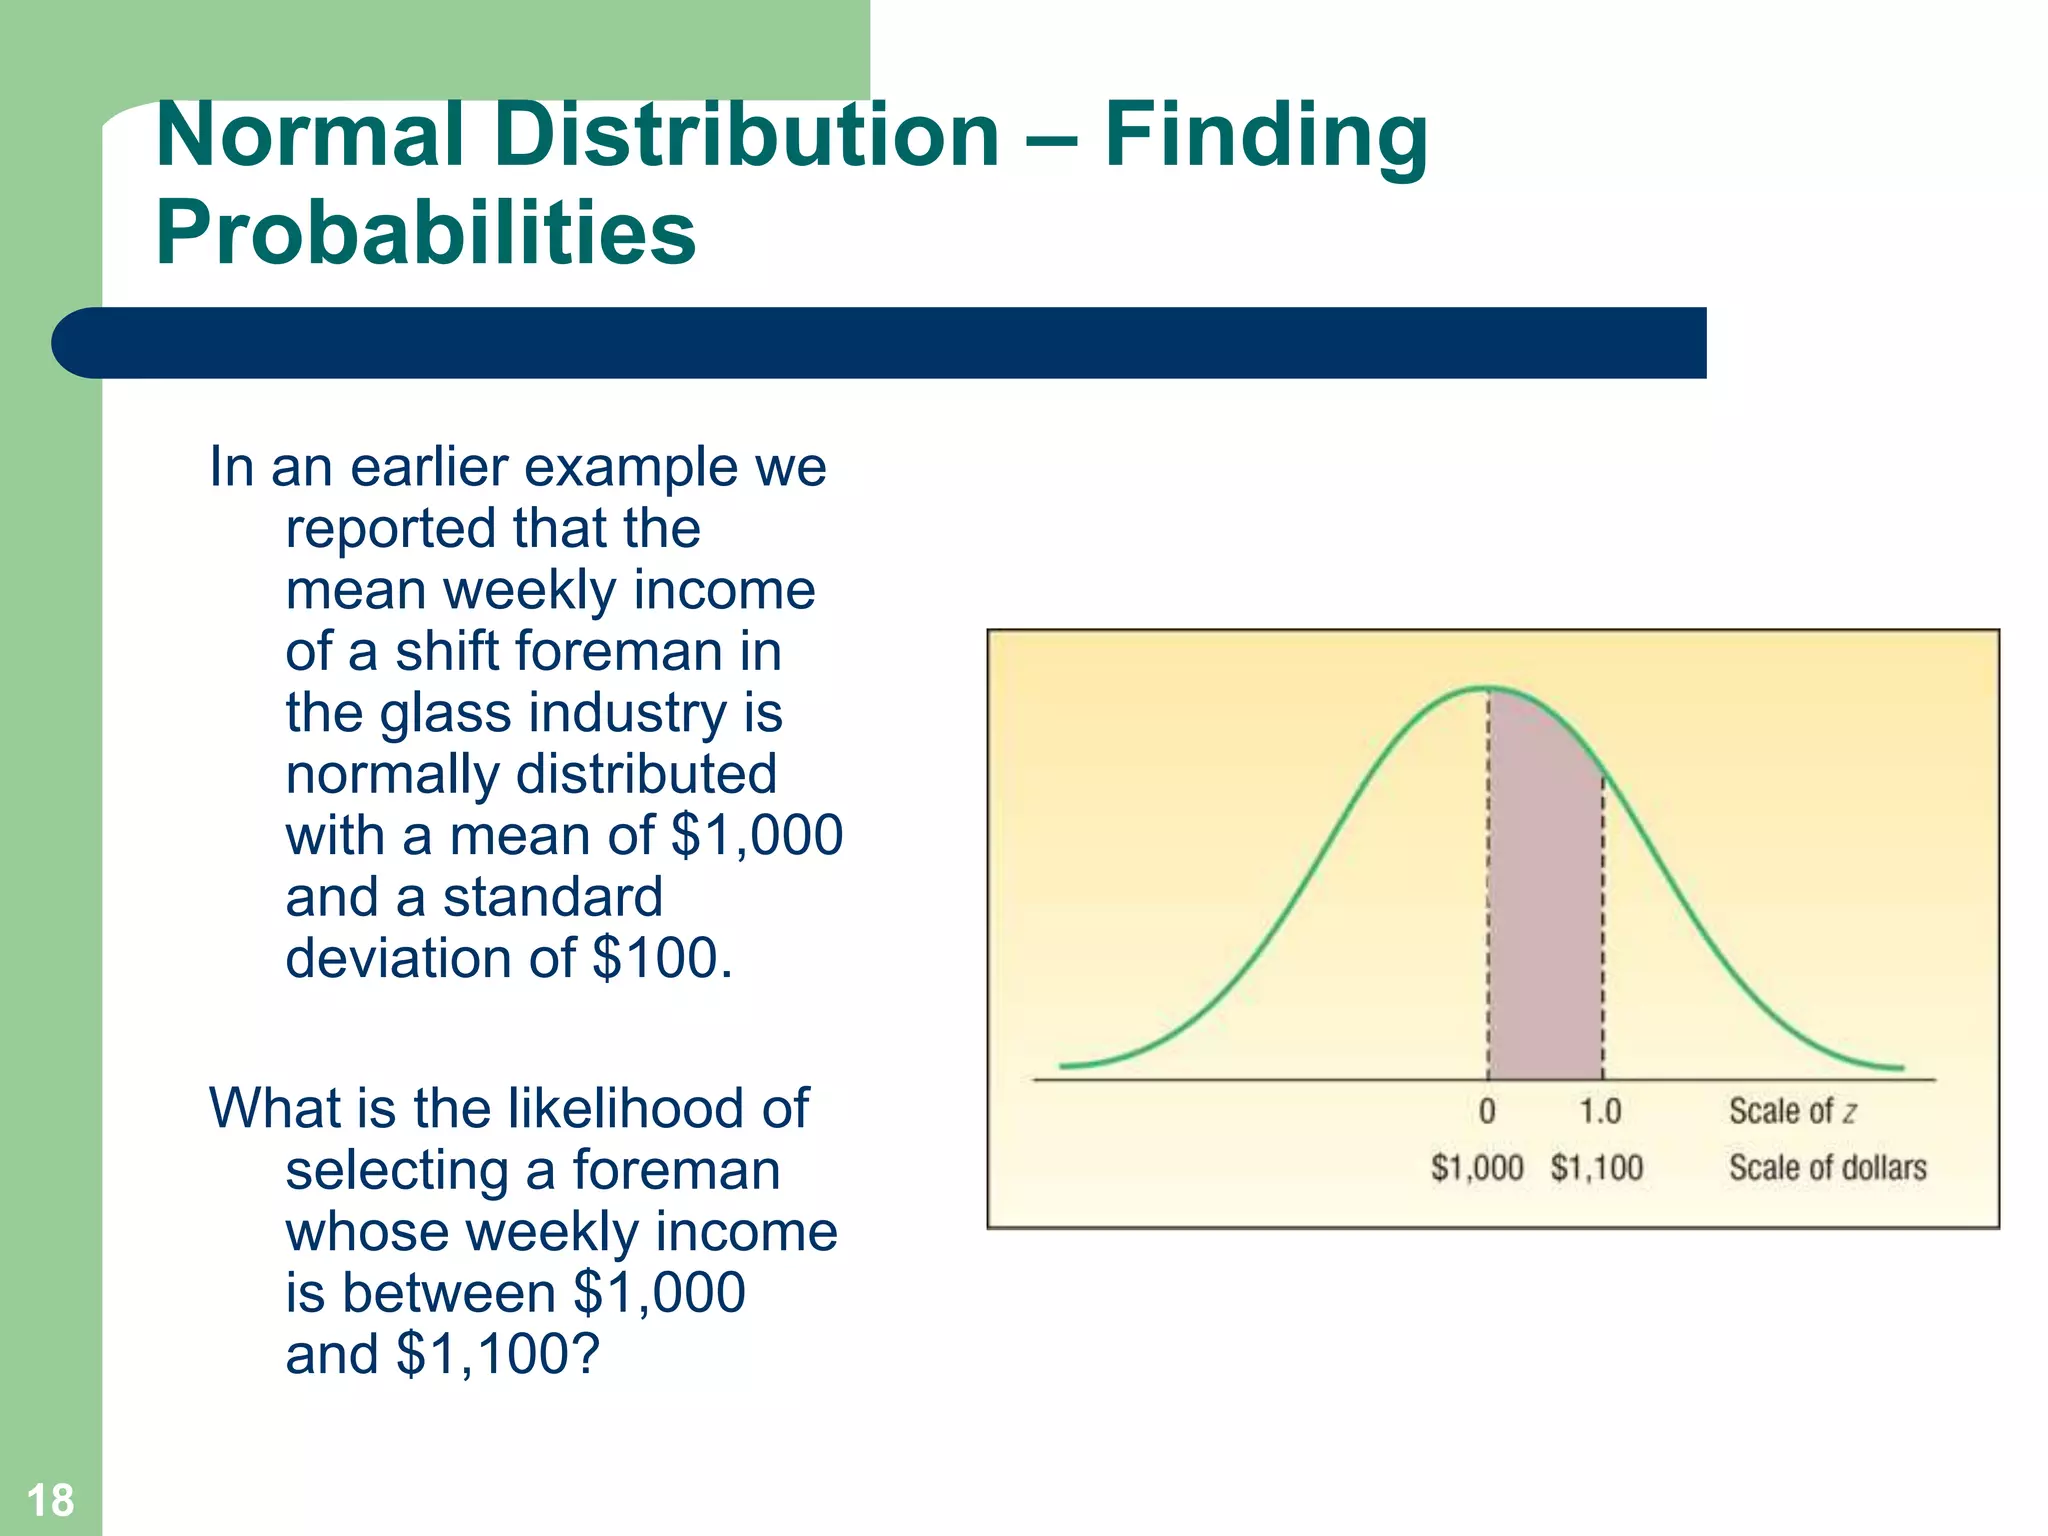
1) The document discusses concepts related to probability distributions including uniform, normal, and binomial distributions.
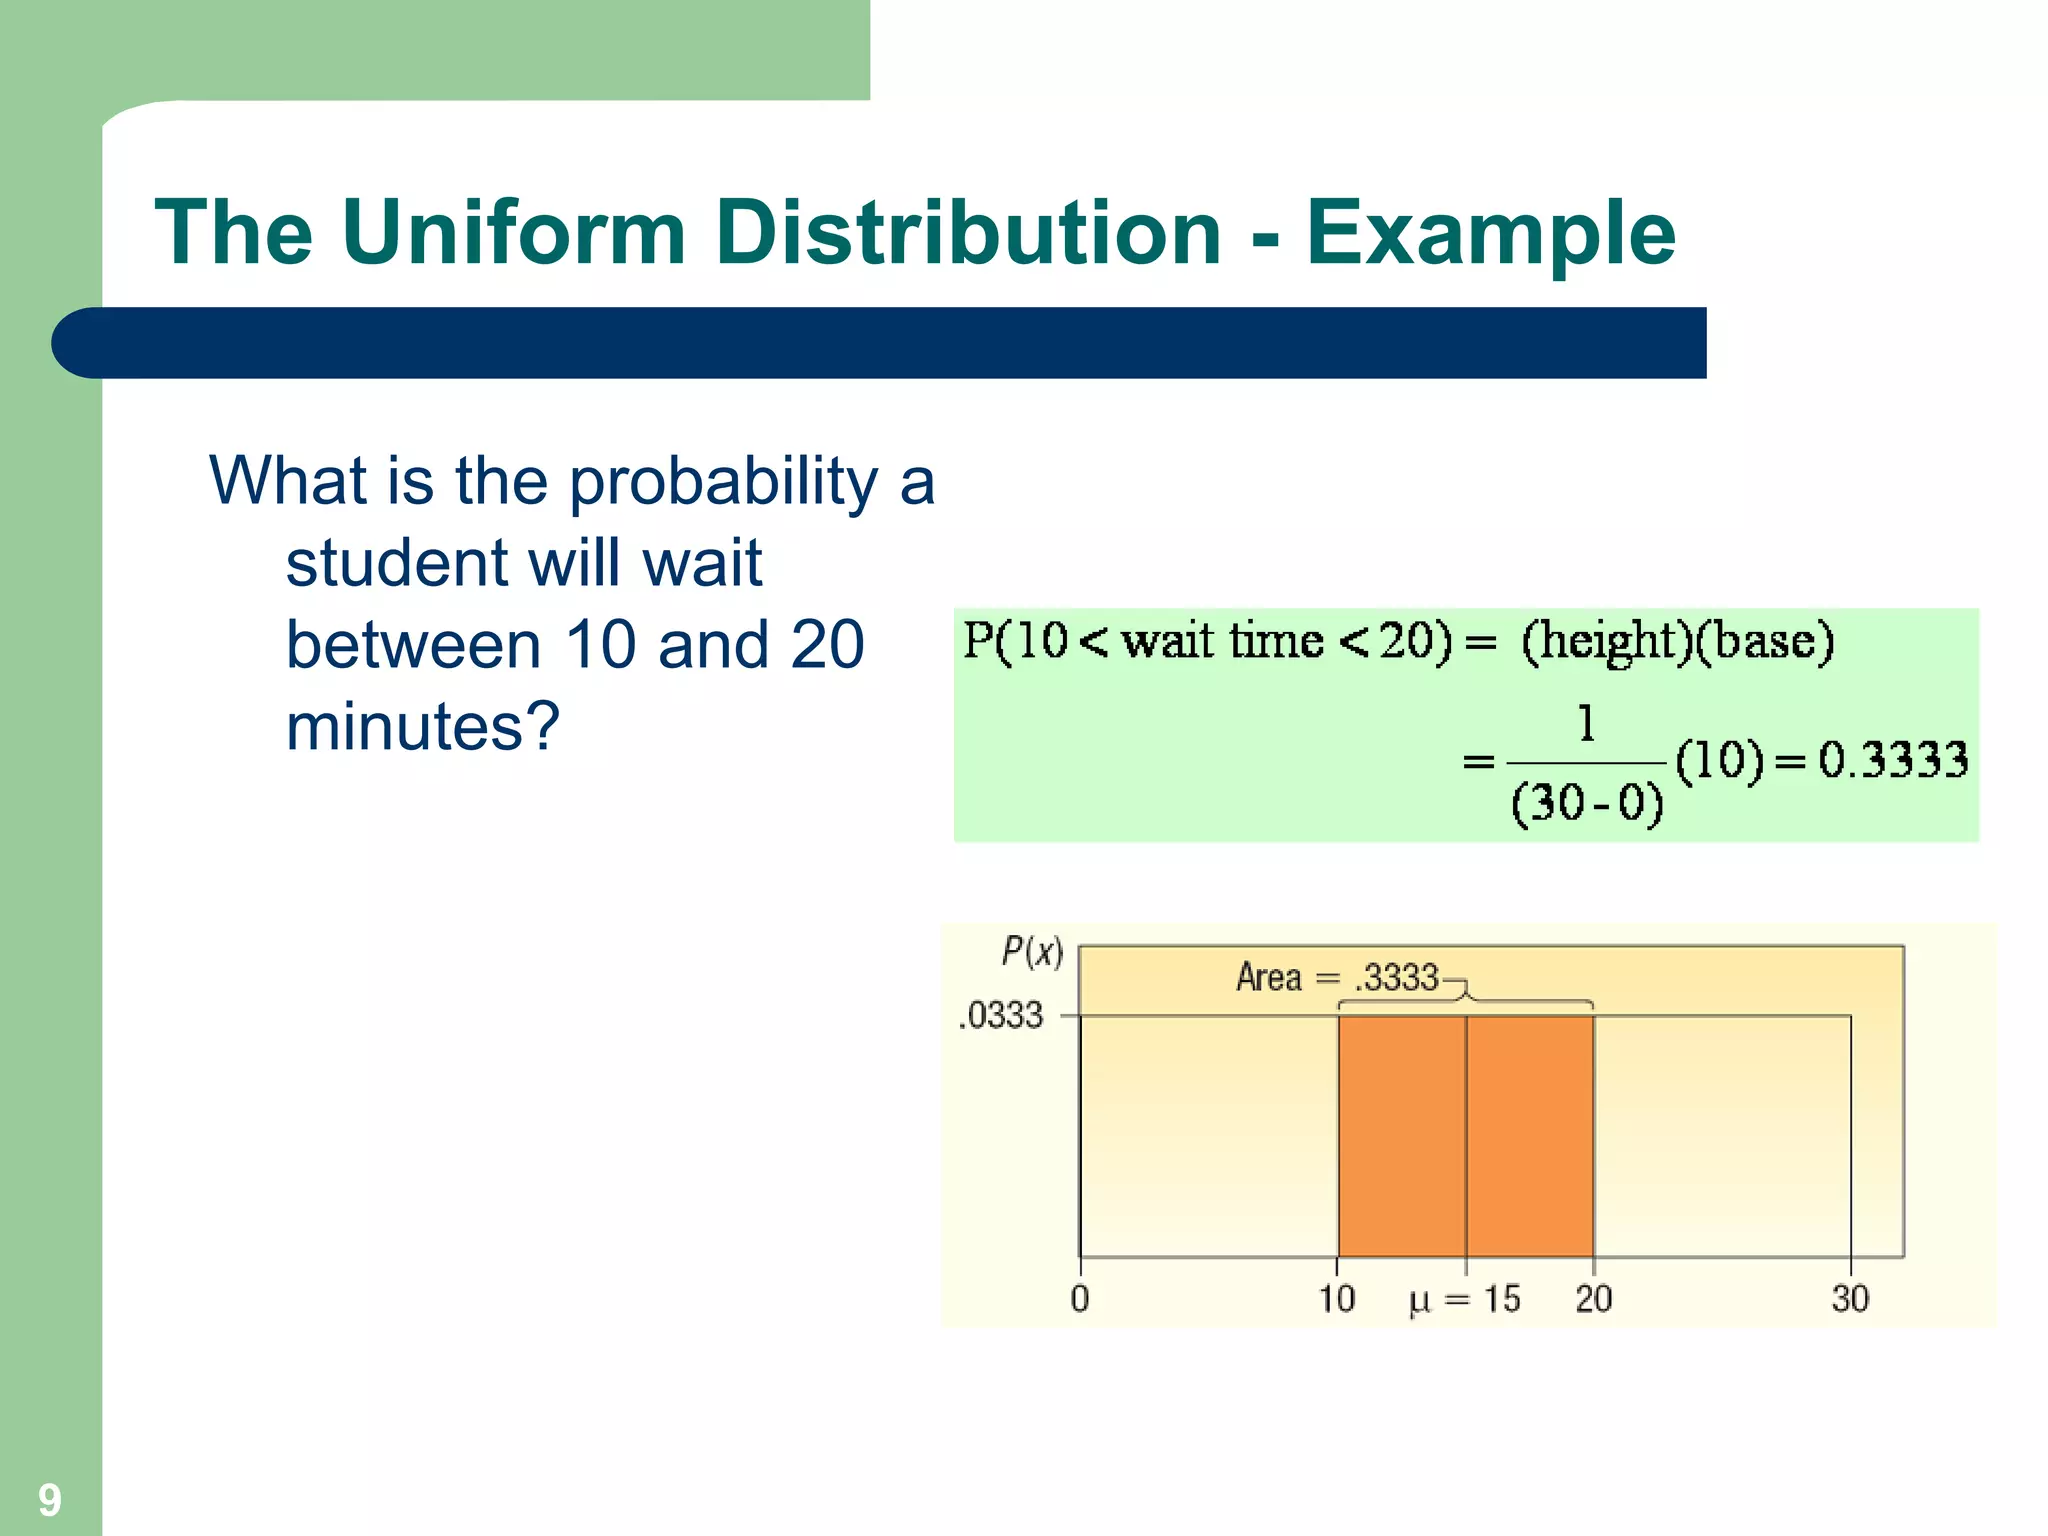
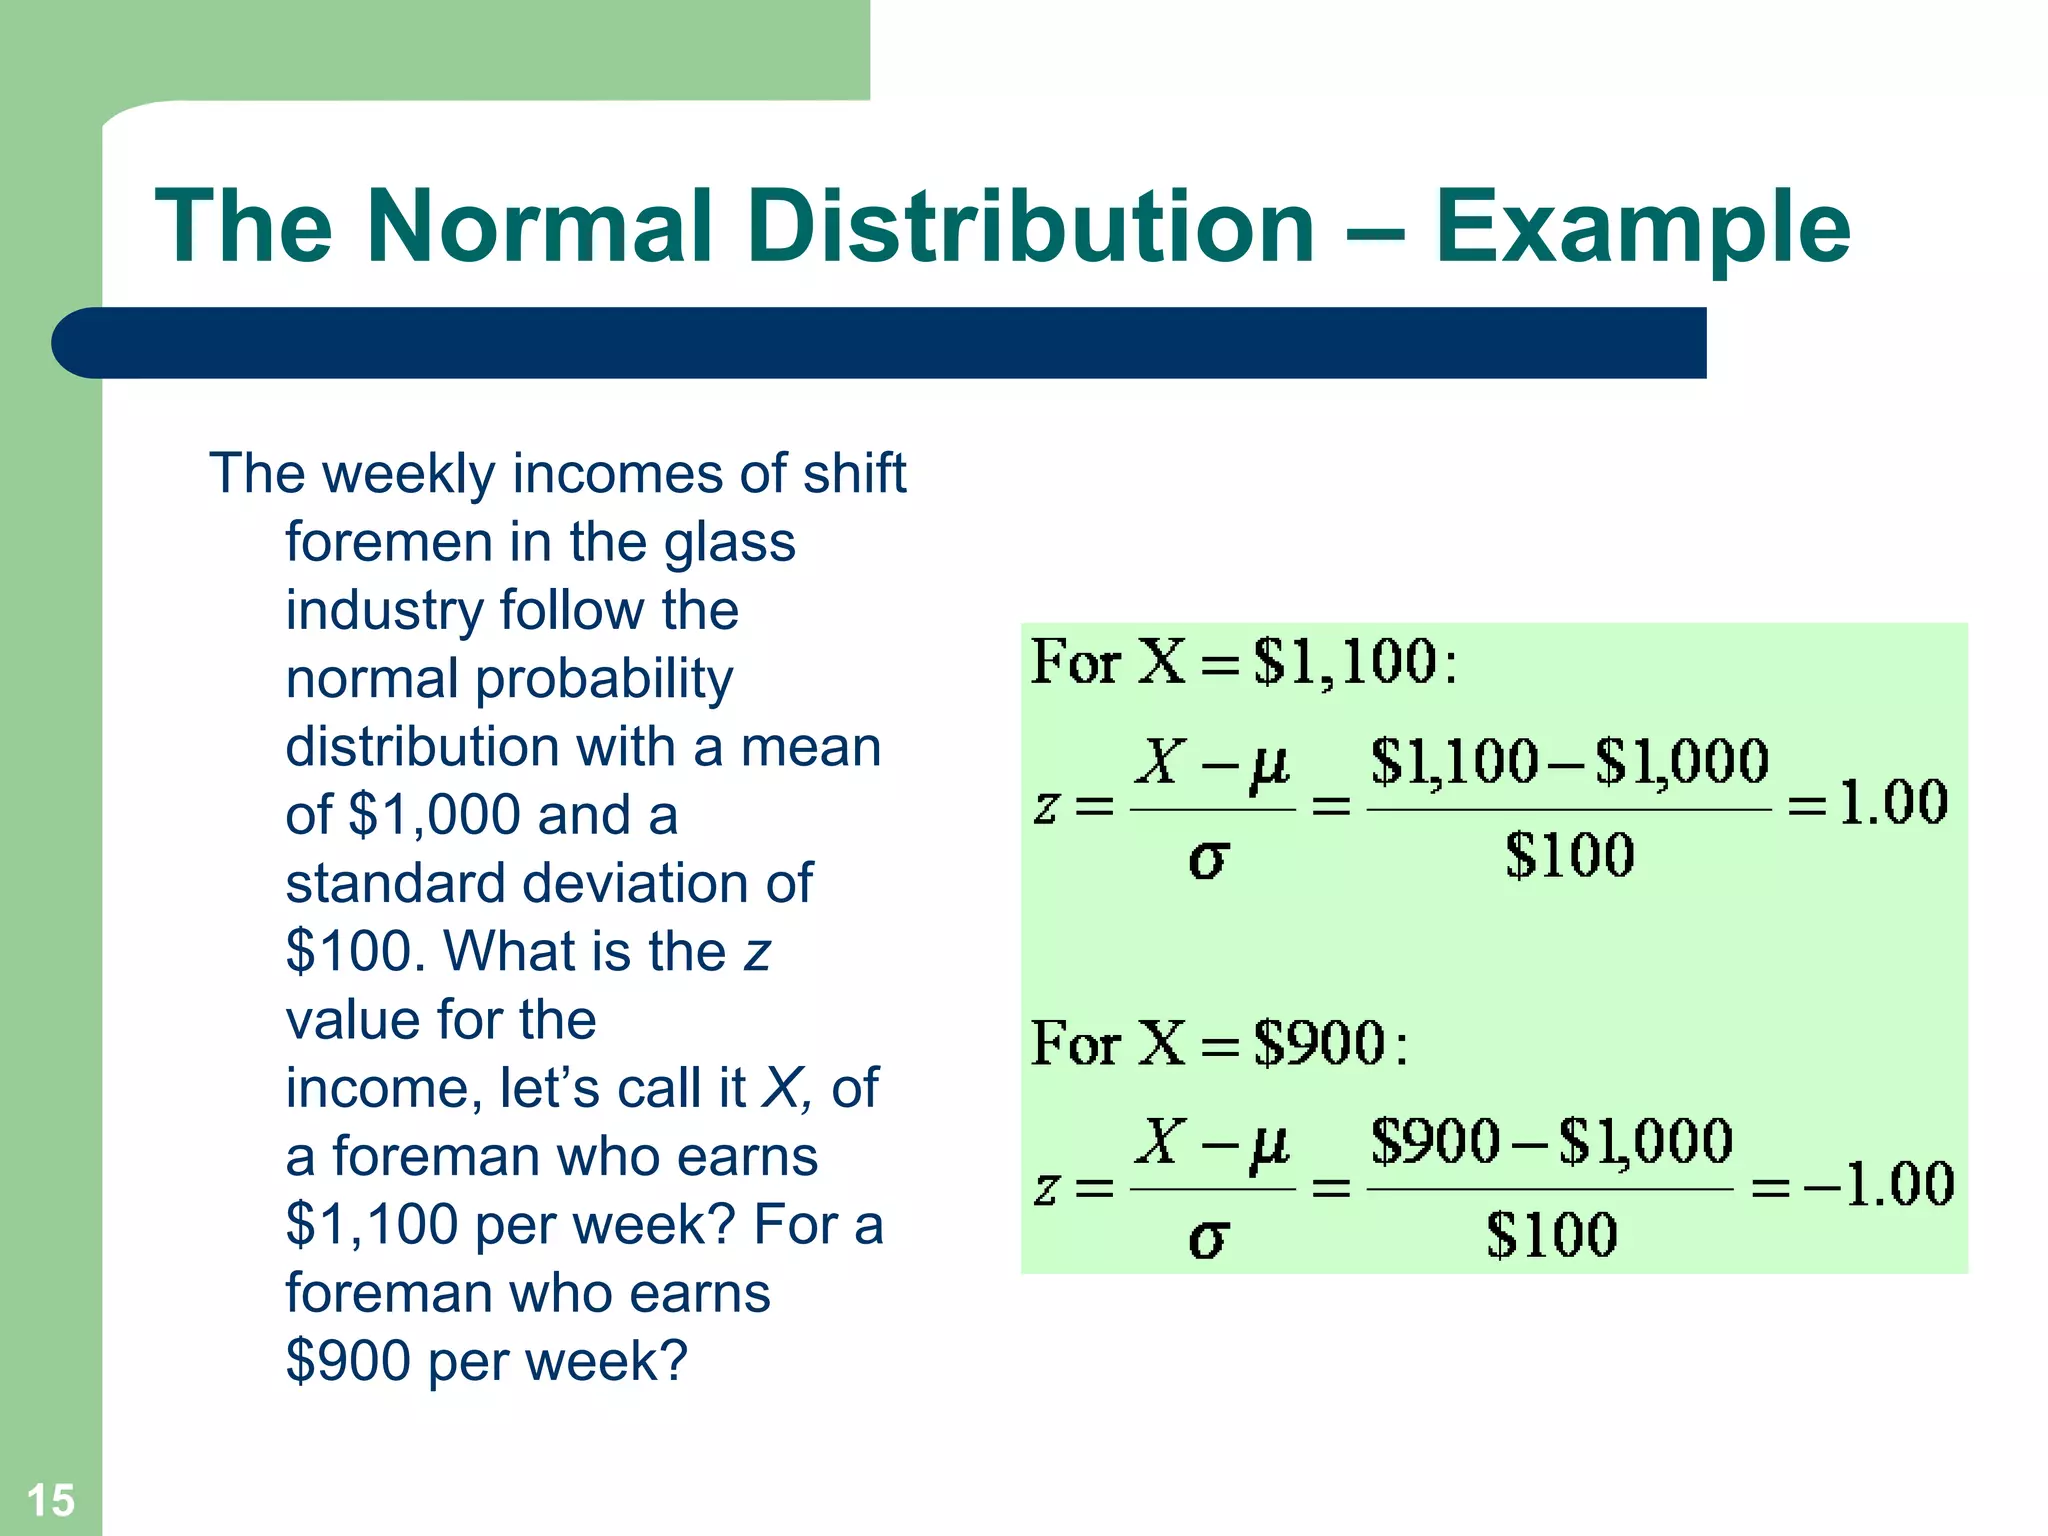
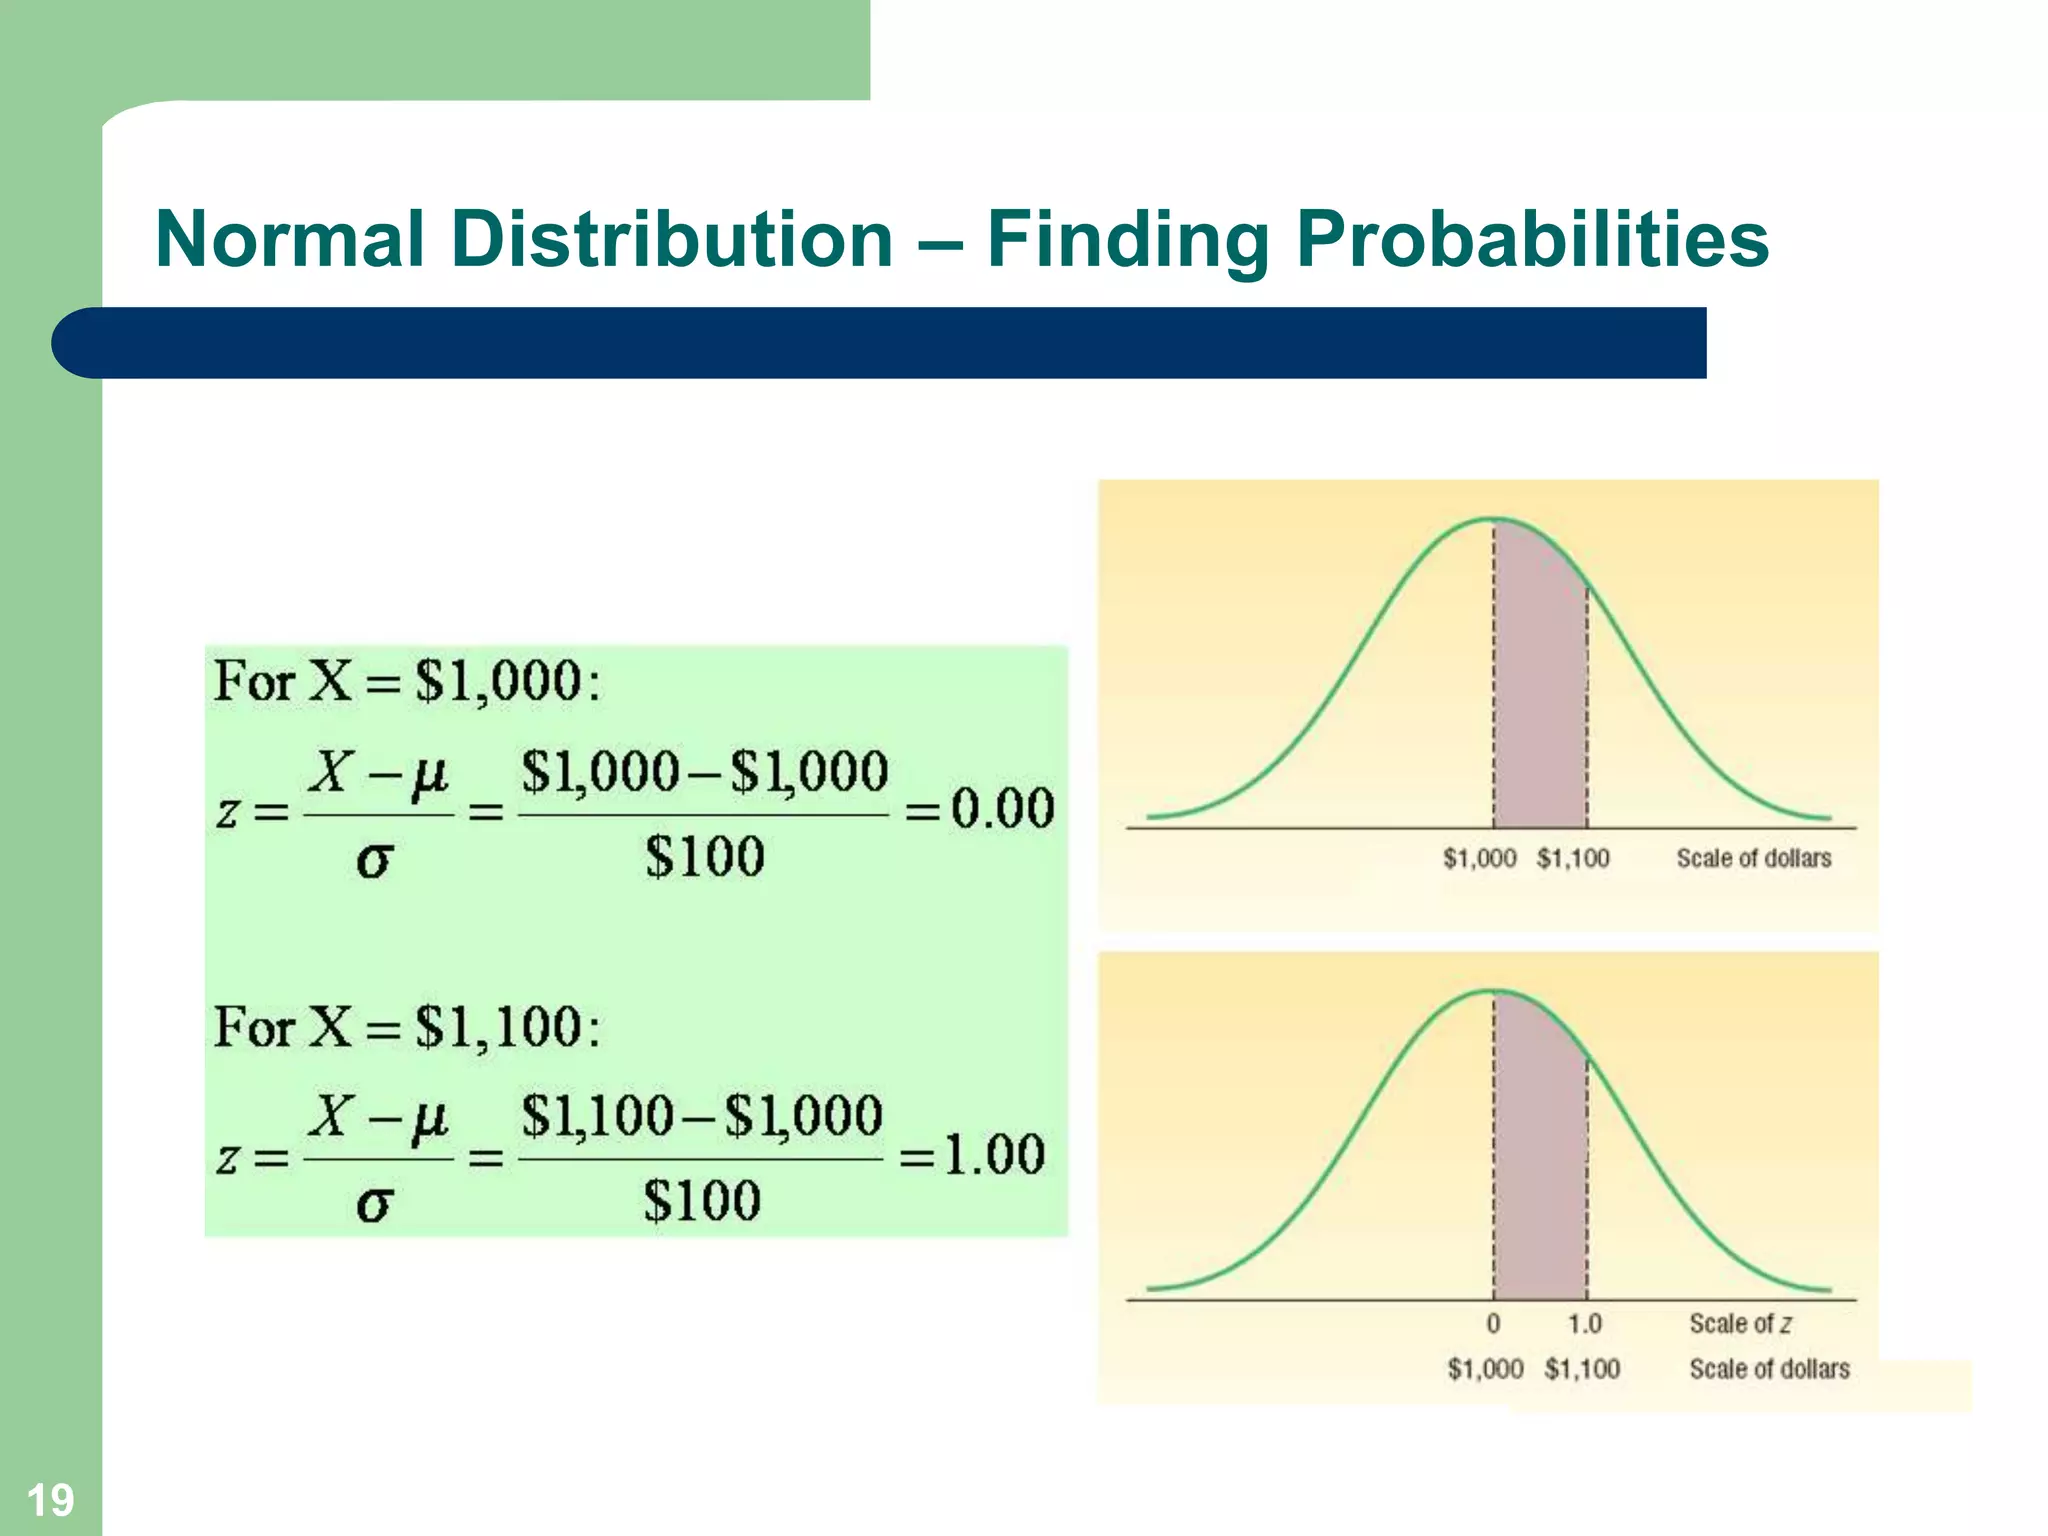
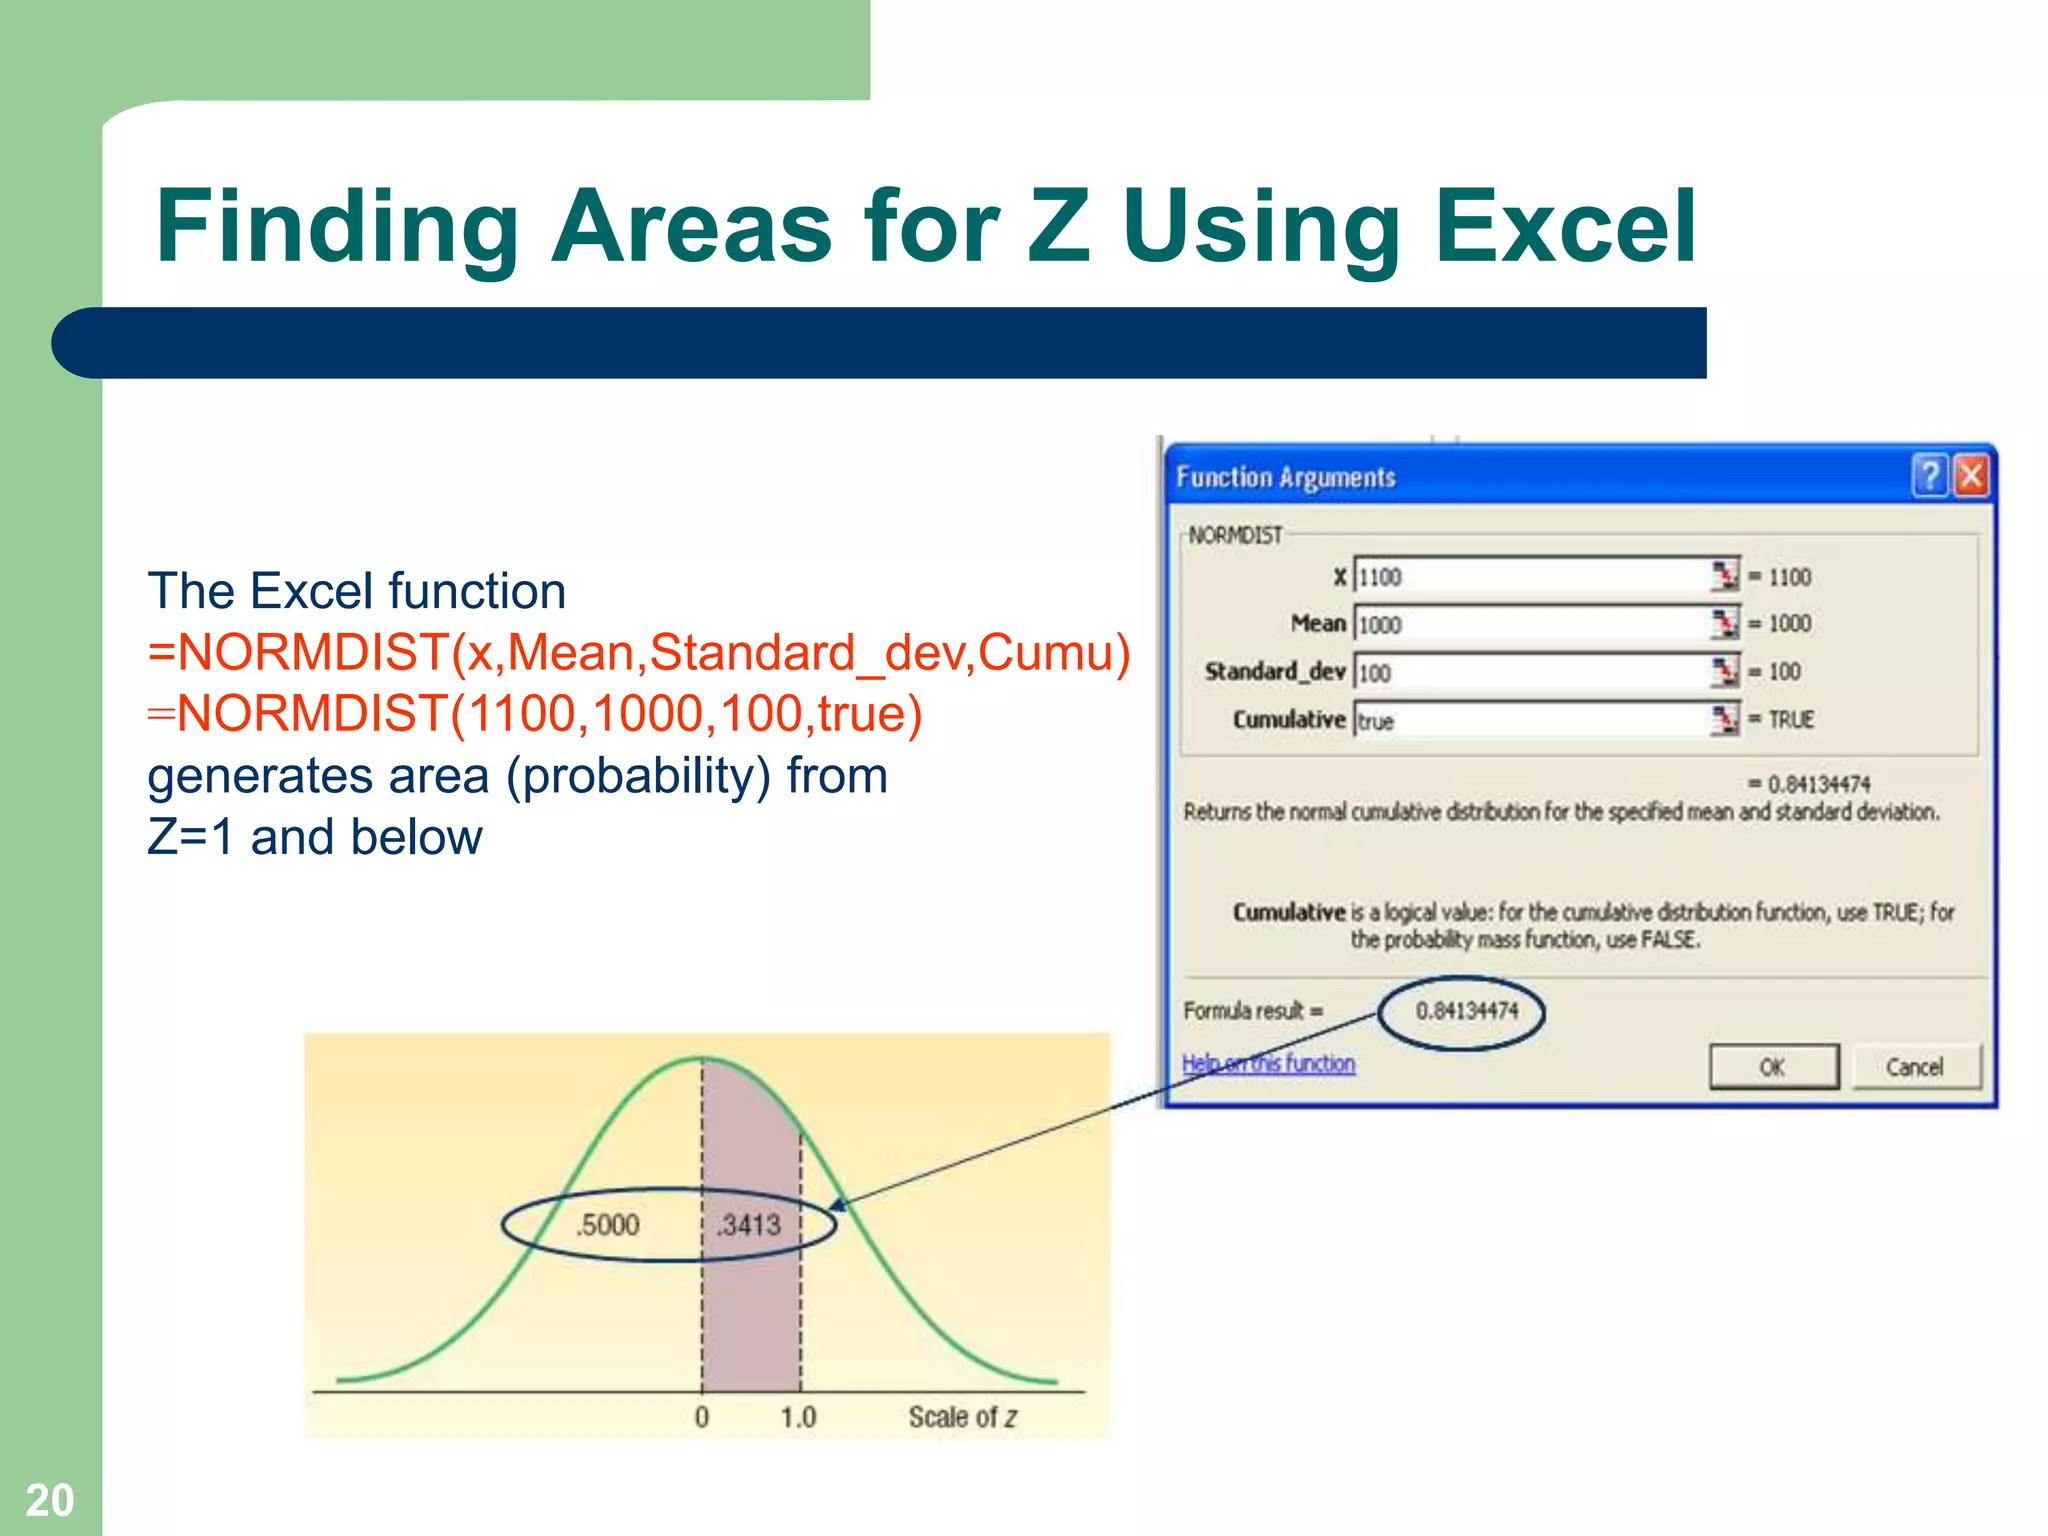
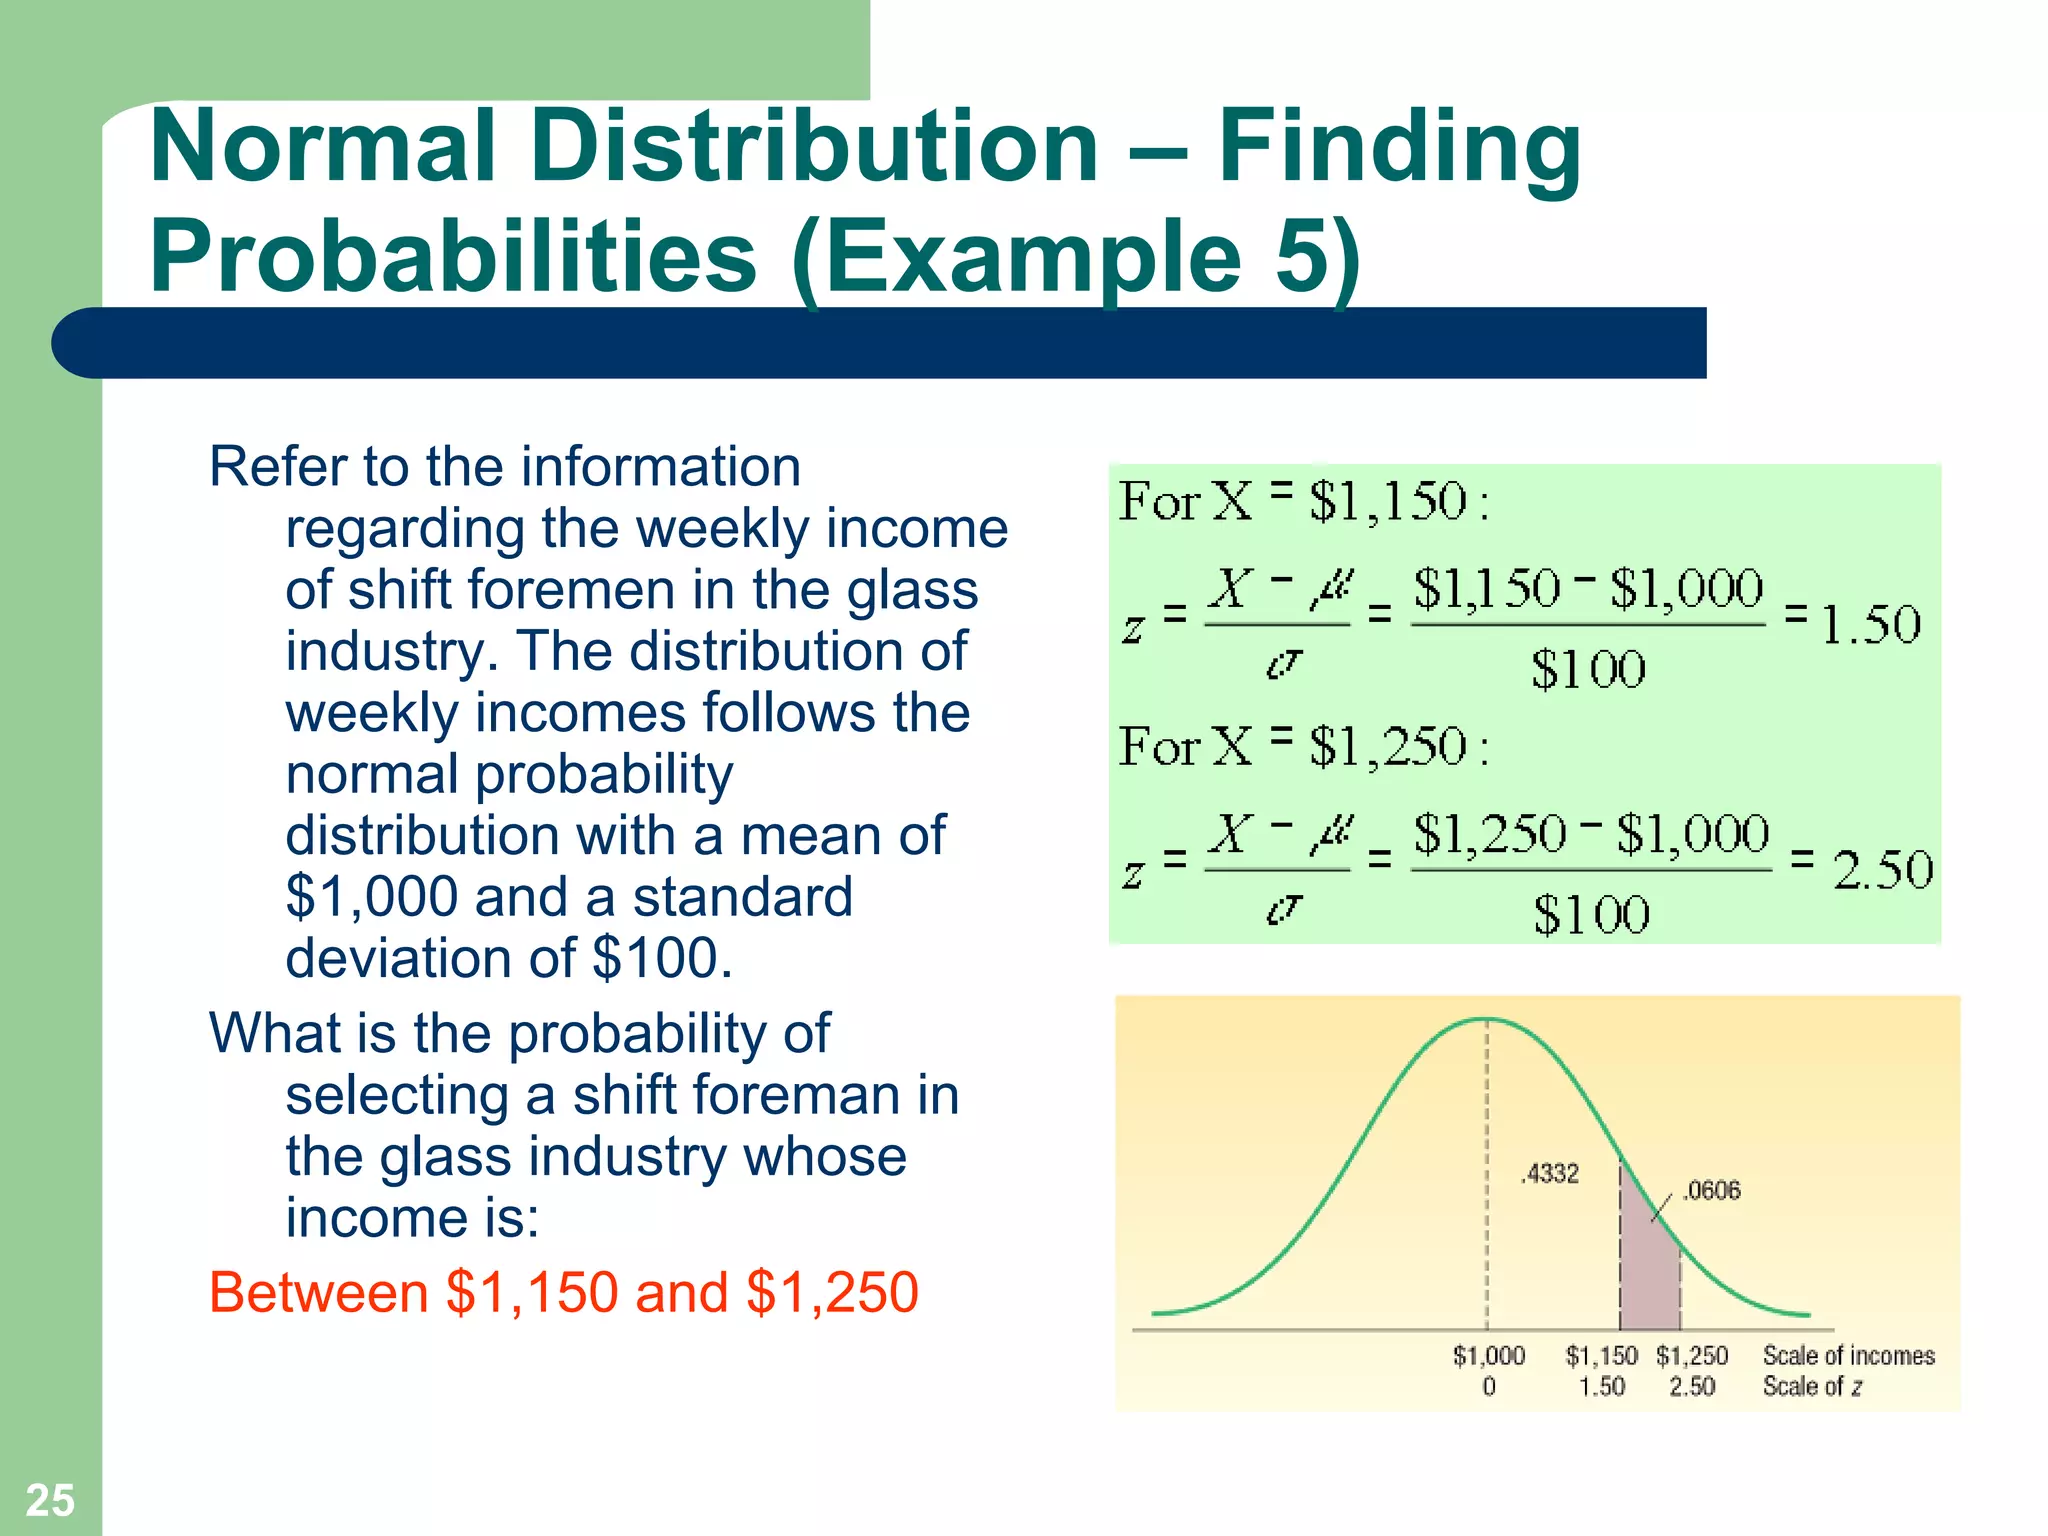
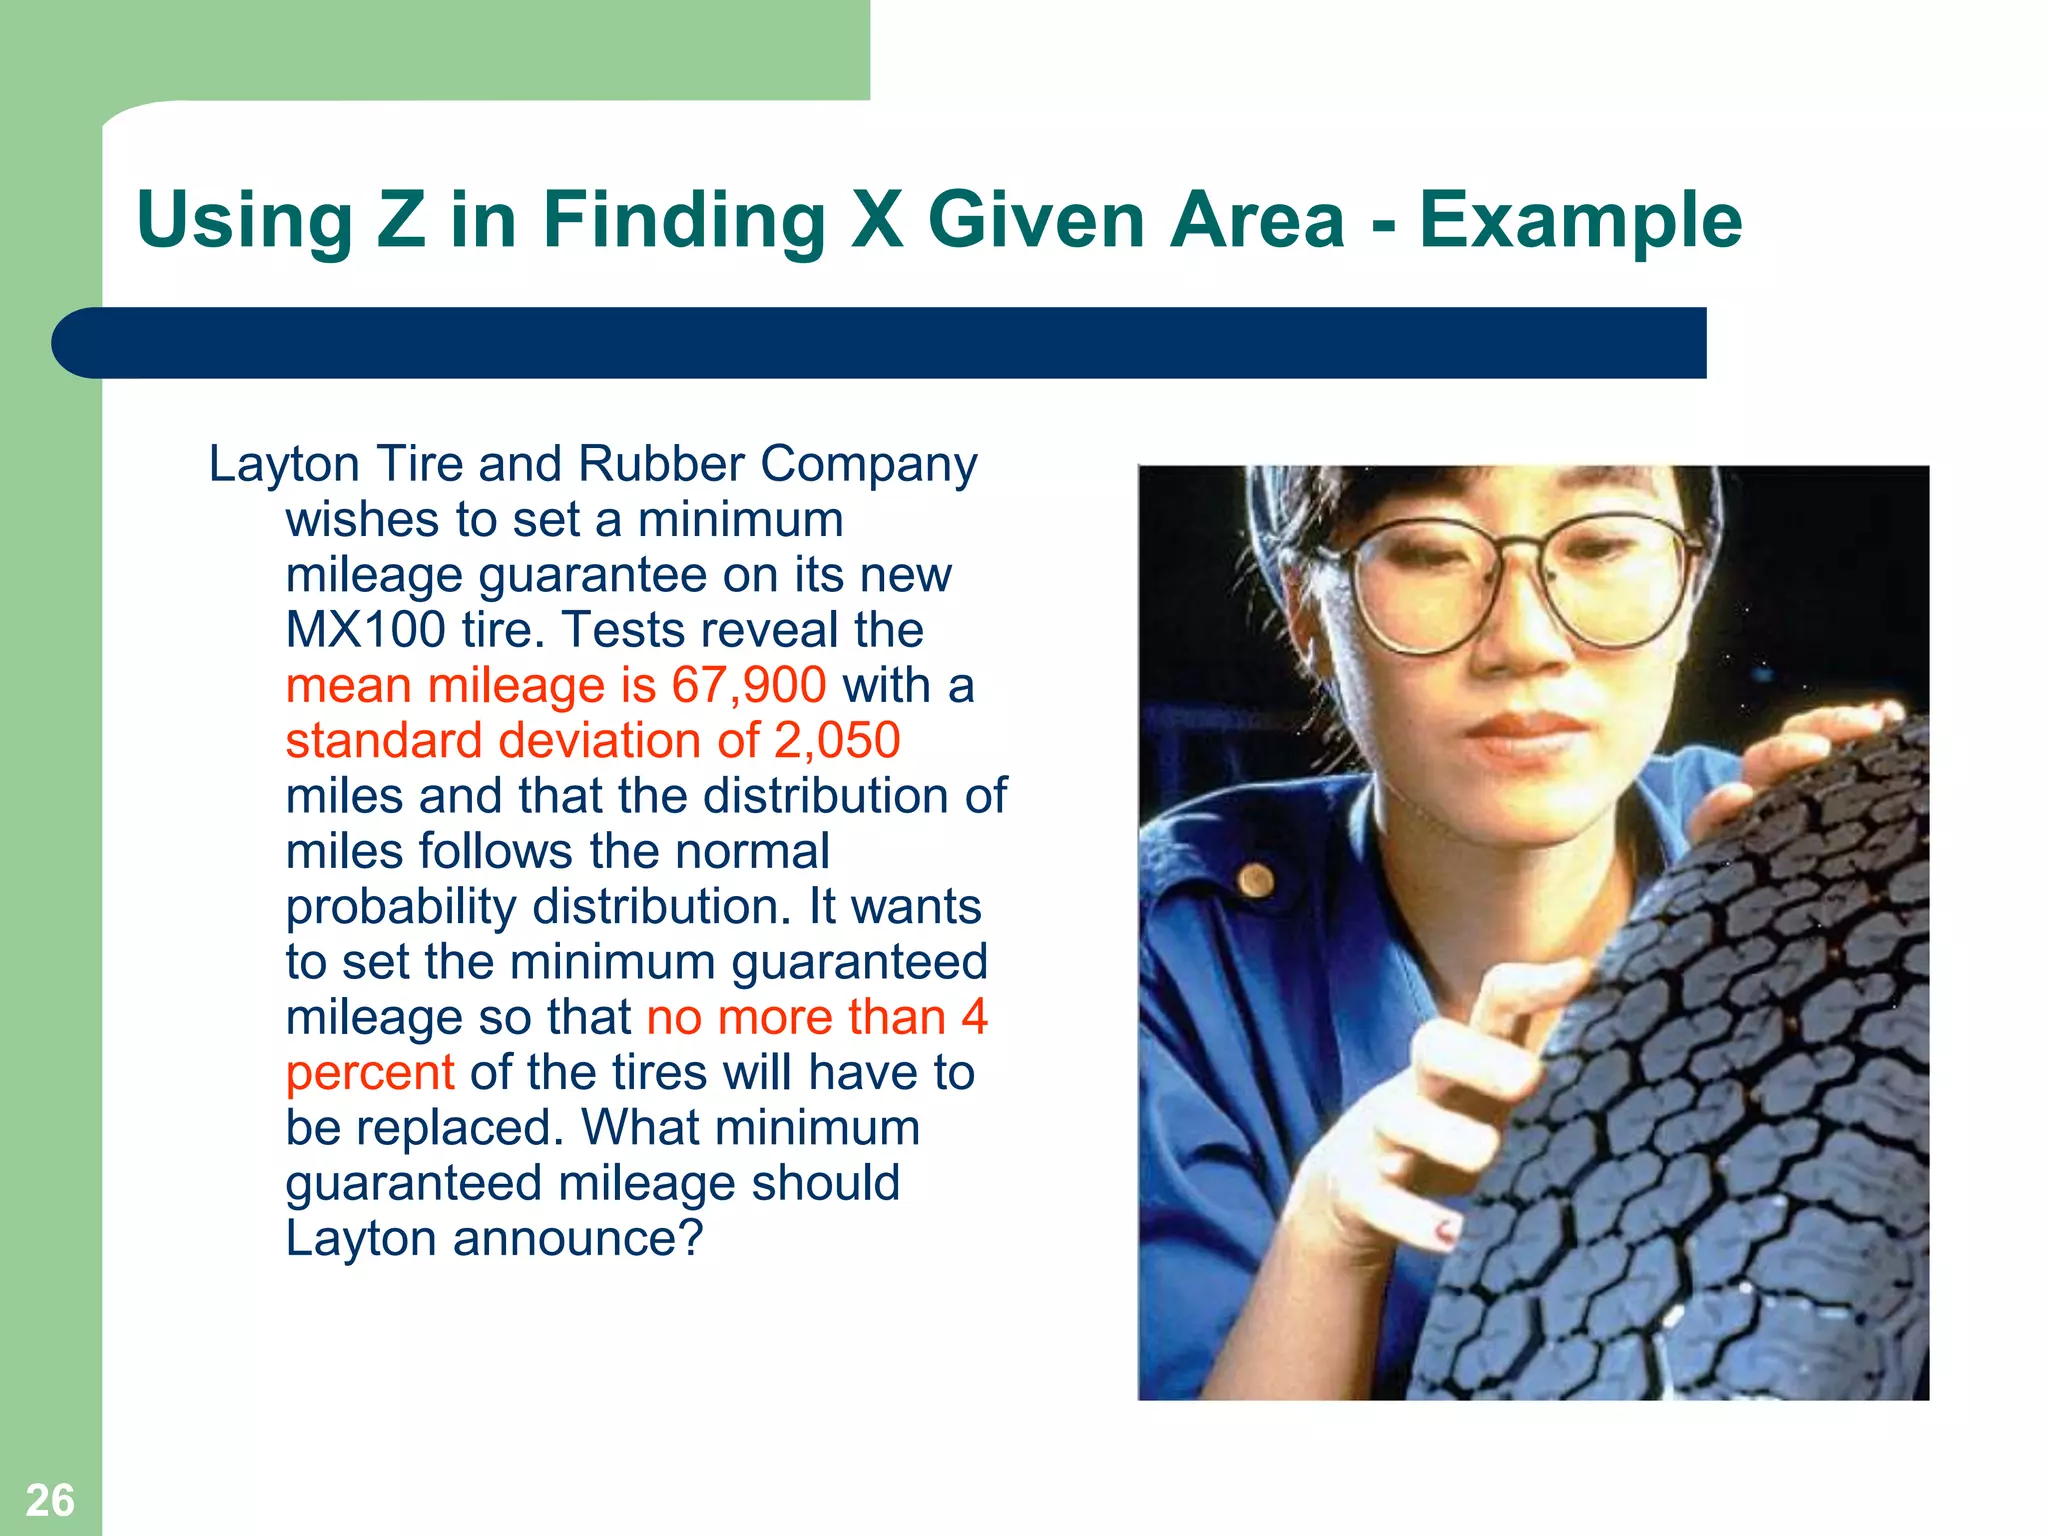
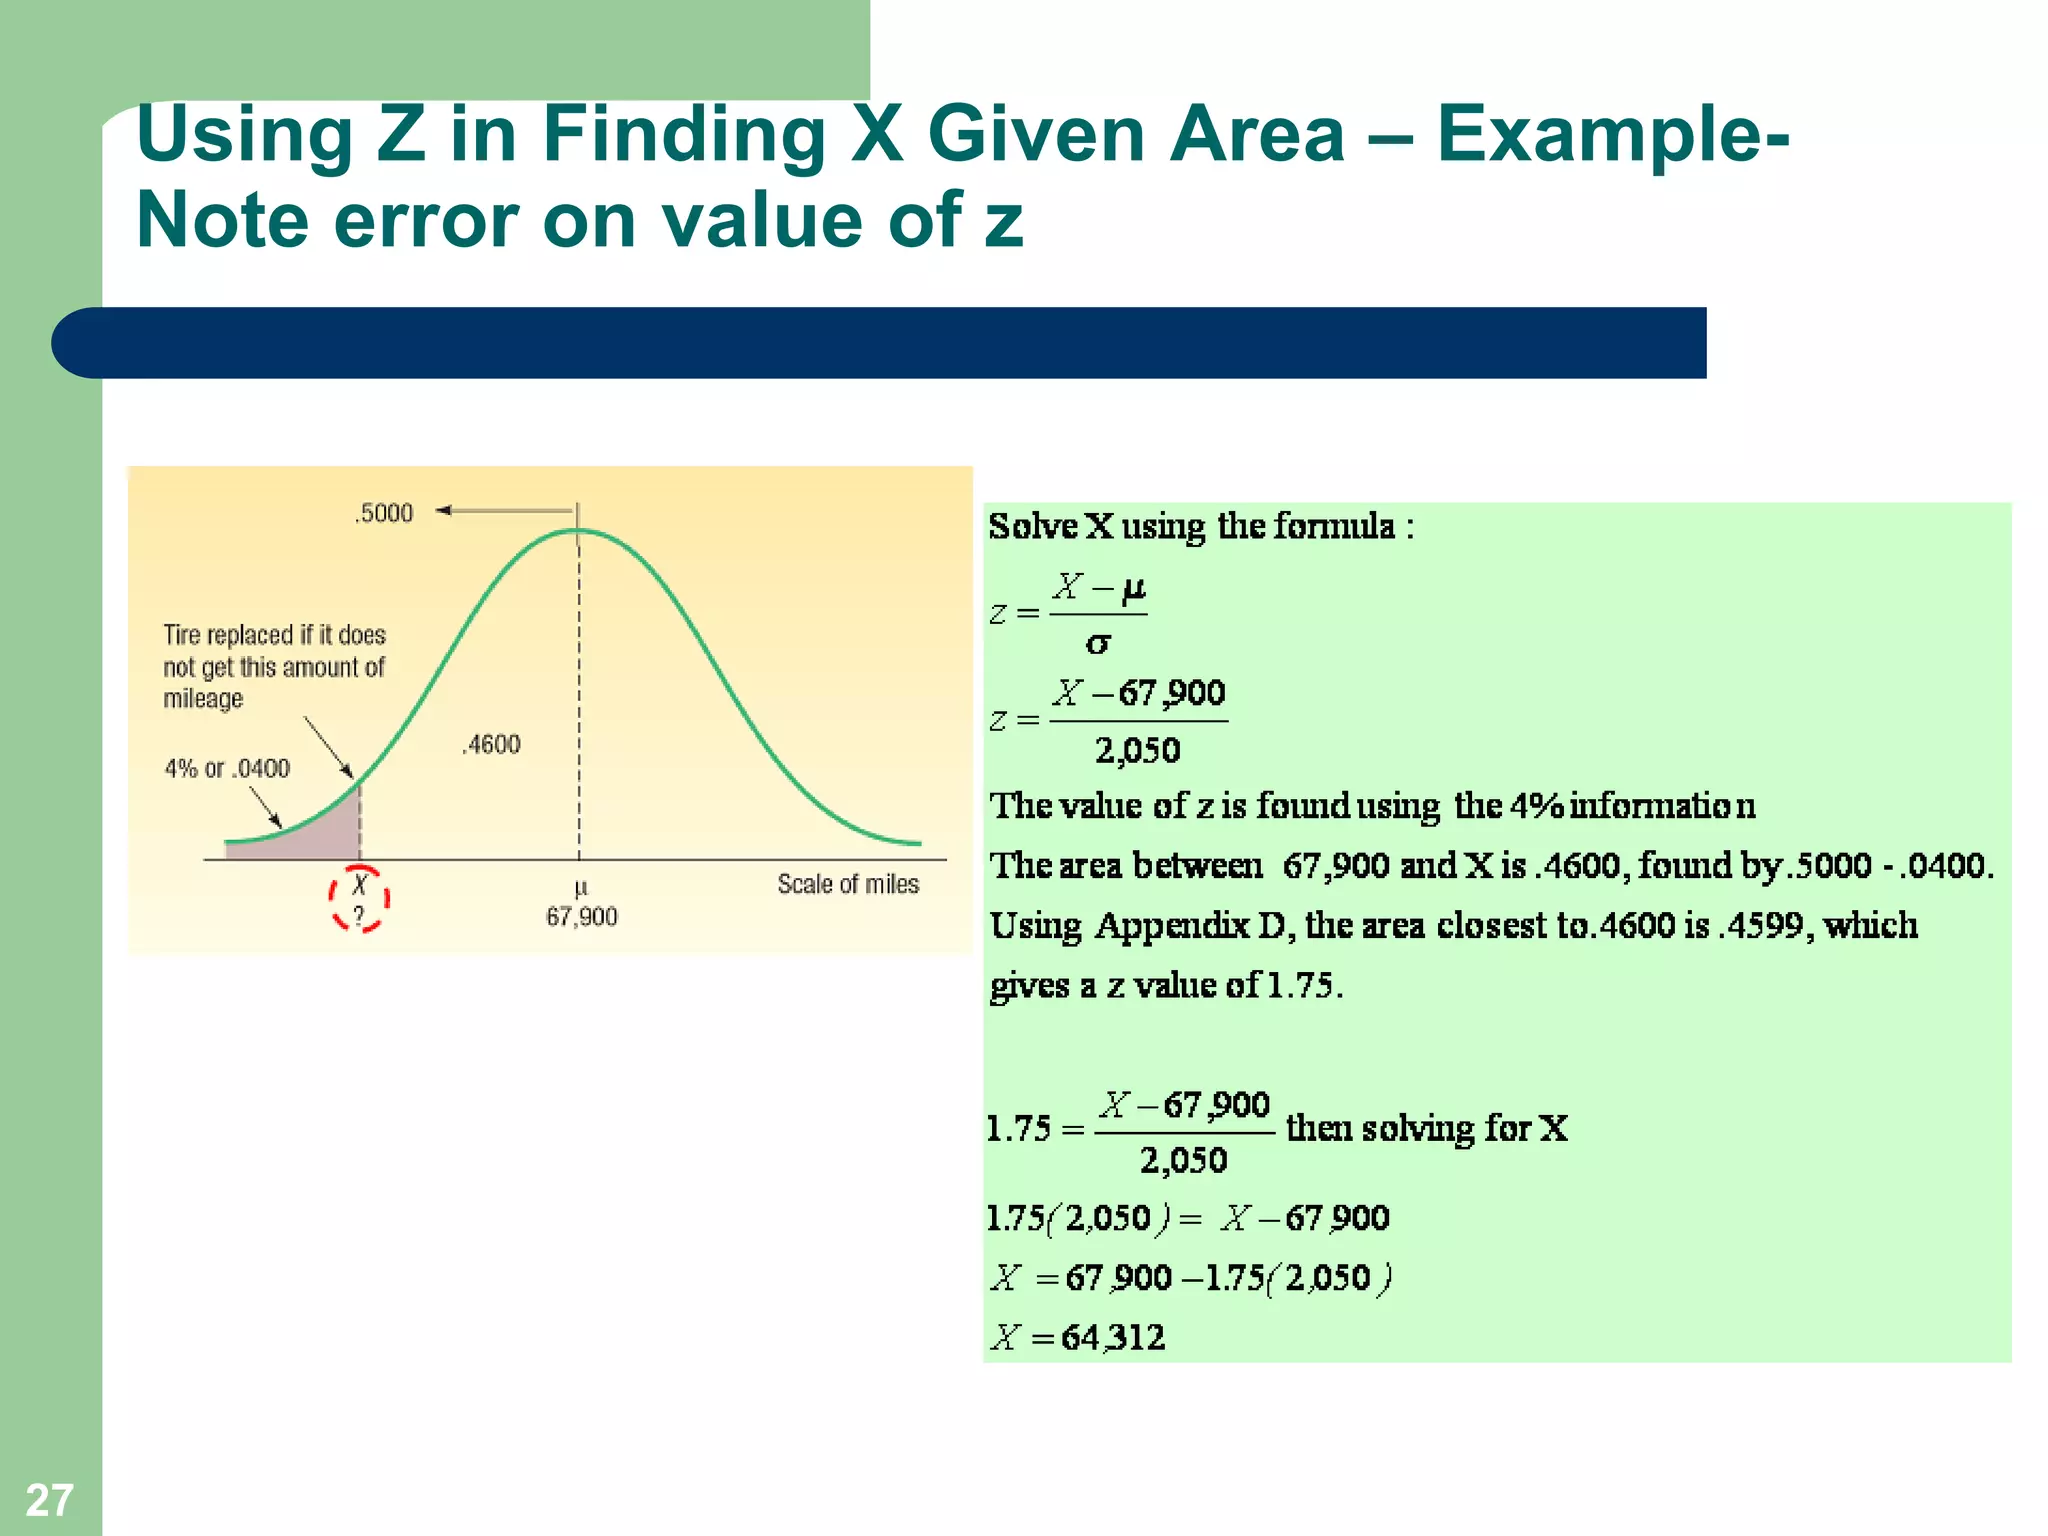
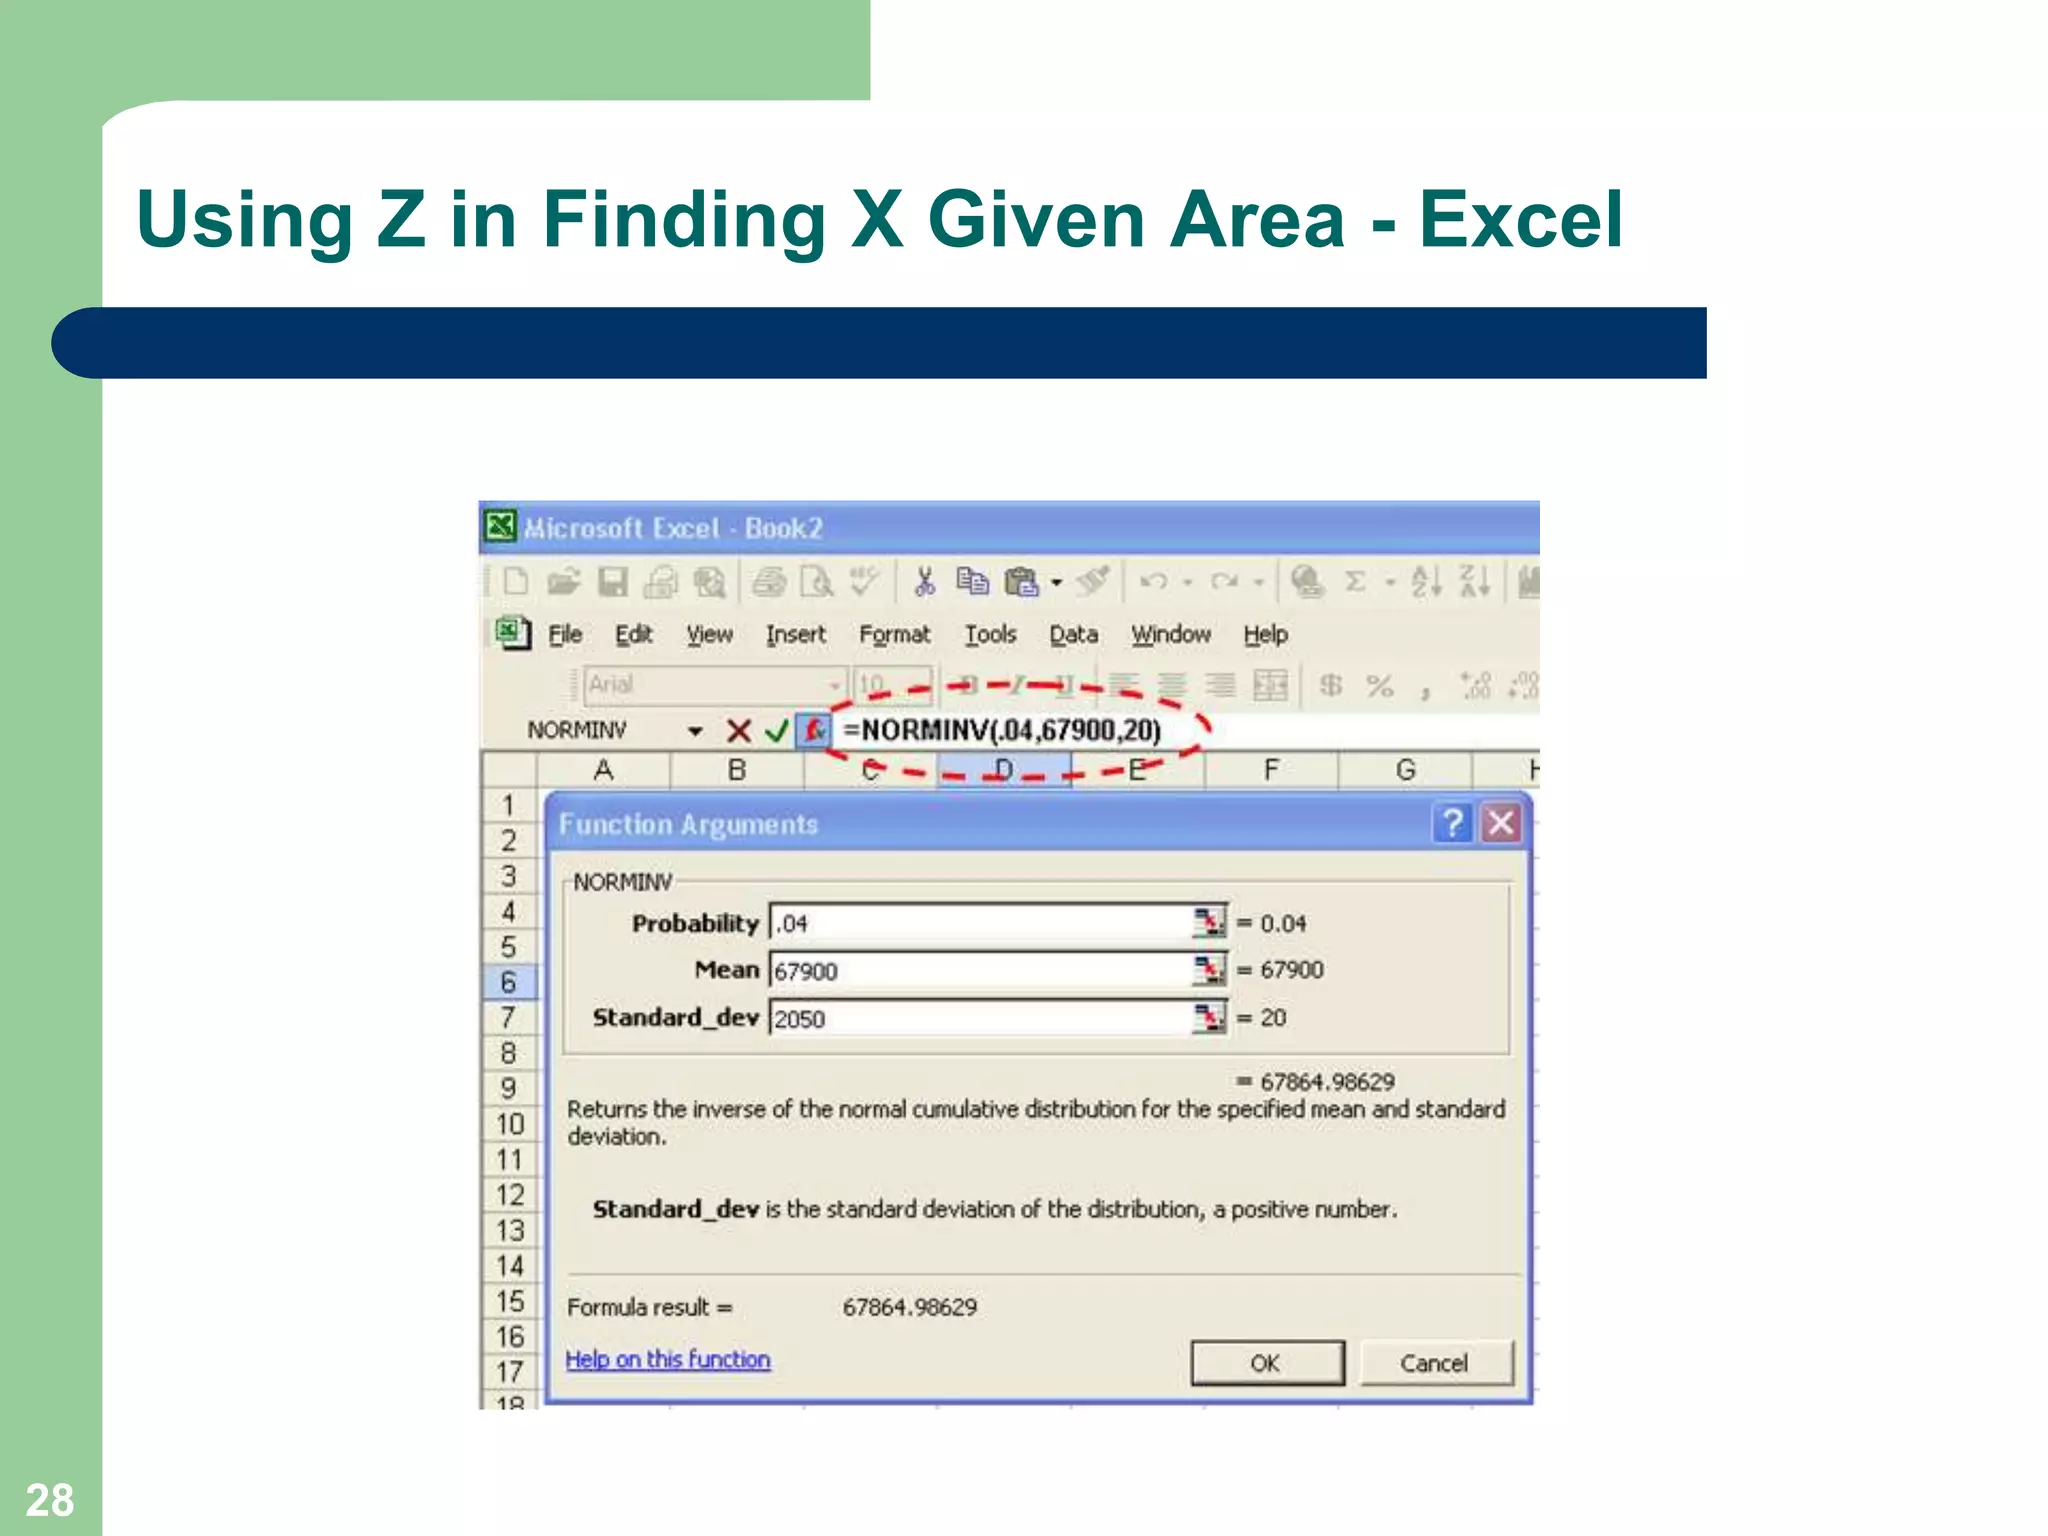
2) It provides examples of calculating probabilities and values using the uniform, normal, and binomial distributions as well as the normal approximation to the binomial.
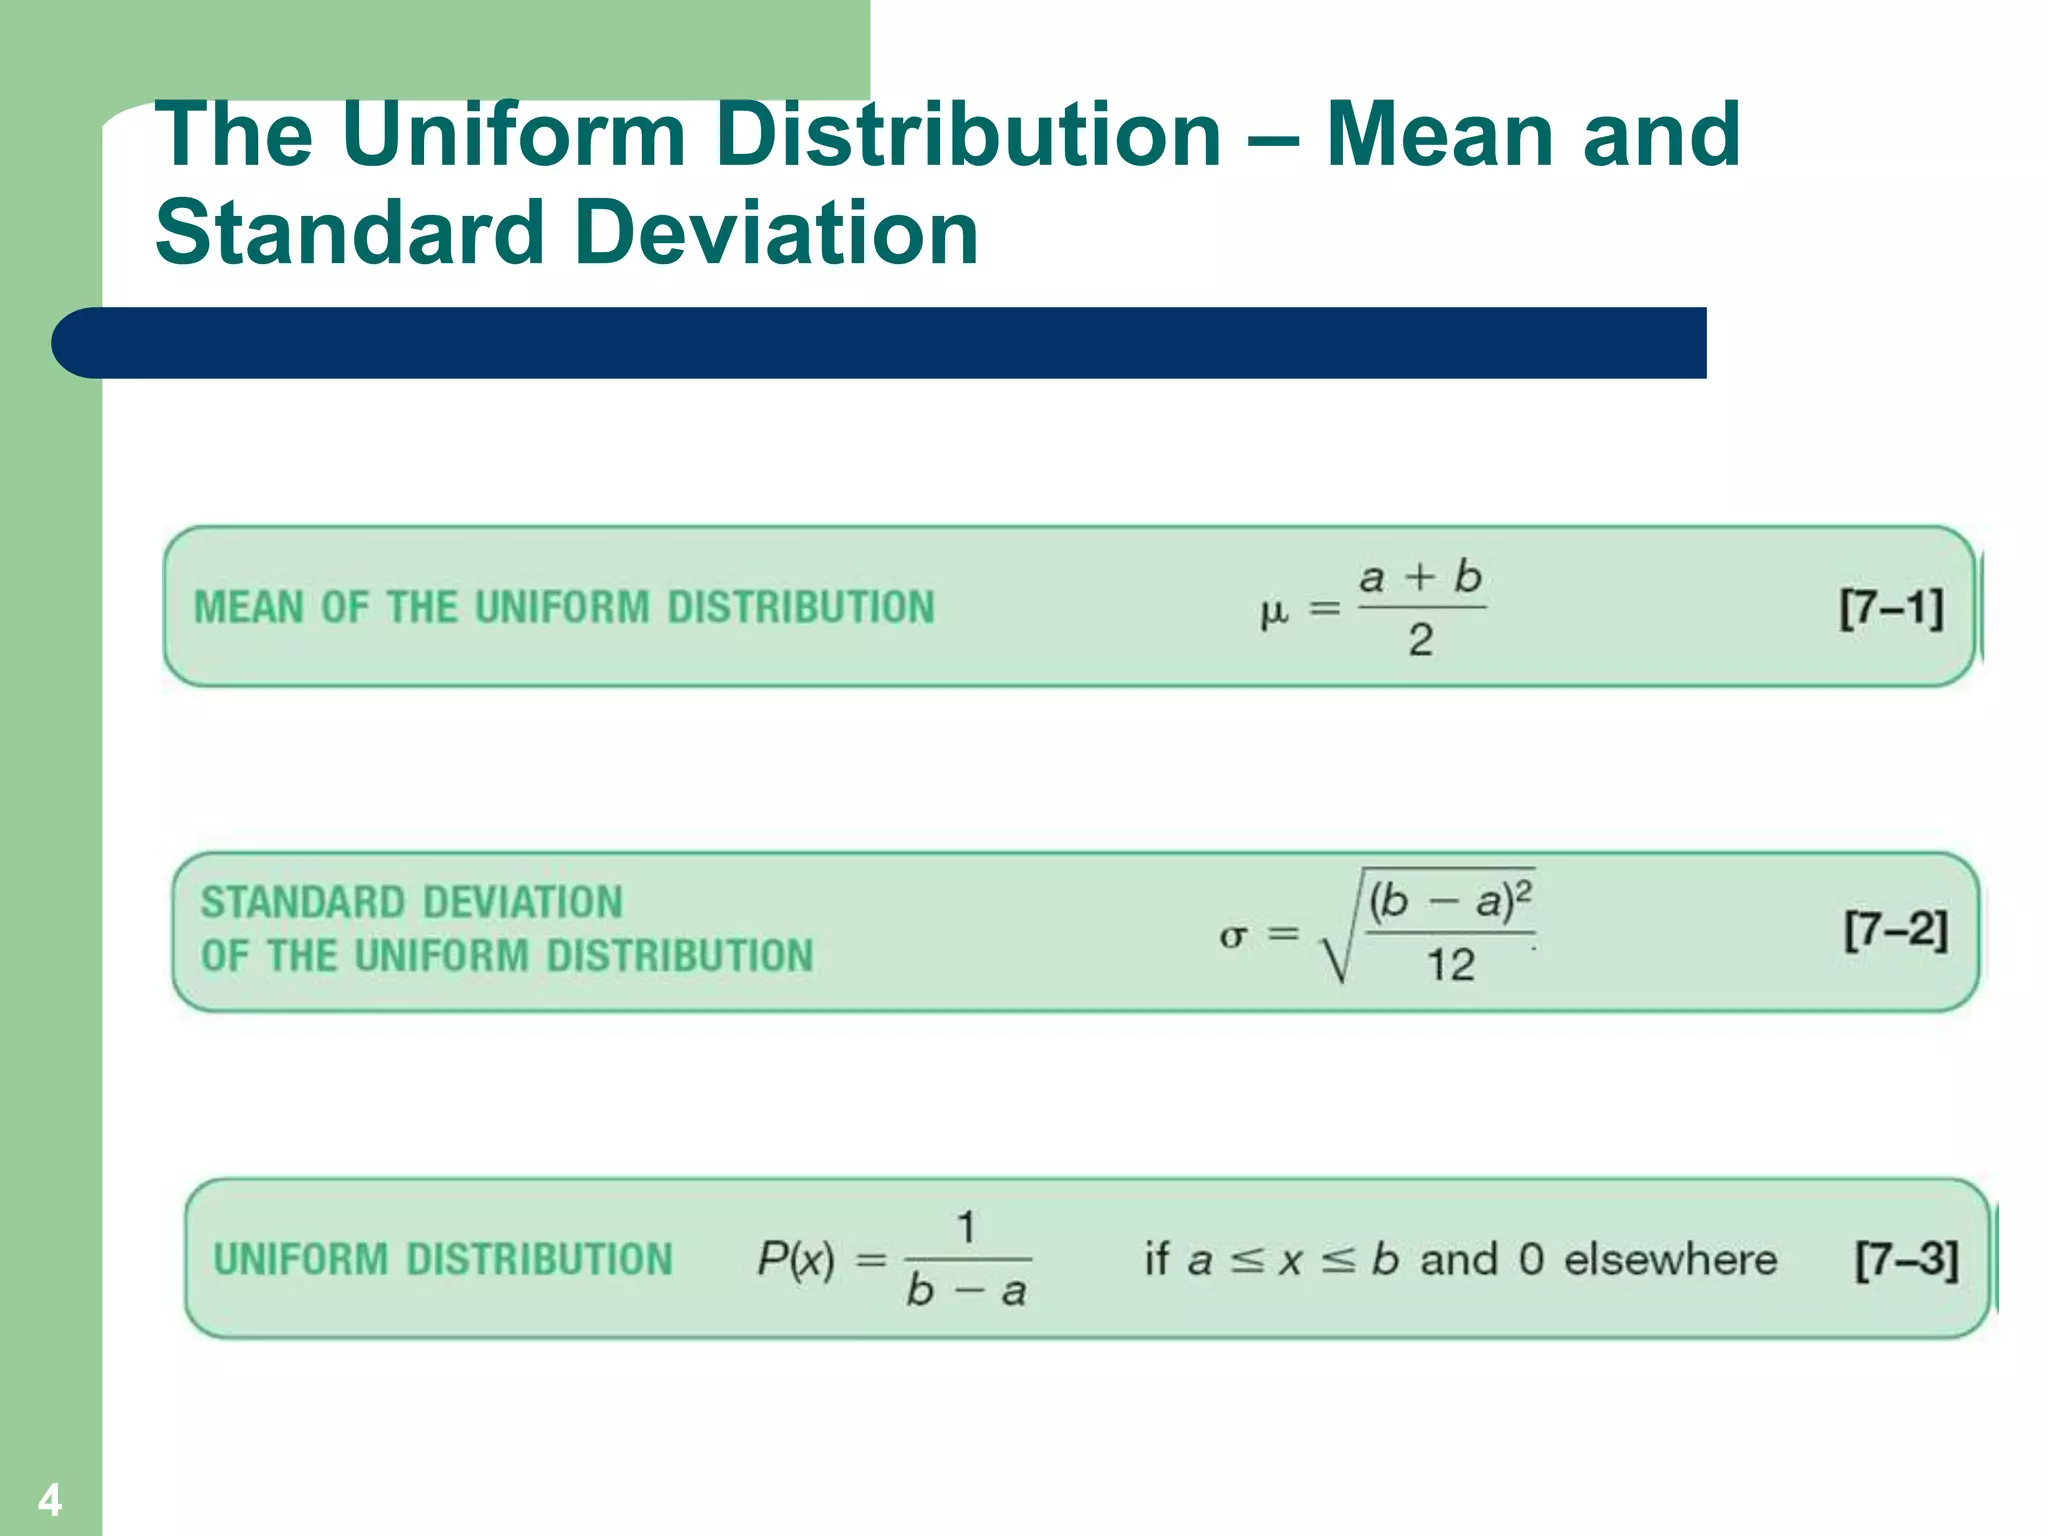
3) Key concepts covered include means, standard deviations, z-values, areas under the normal curve, and the continuity correction factor for approximating binomial with normal.
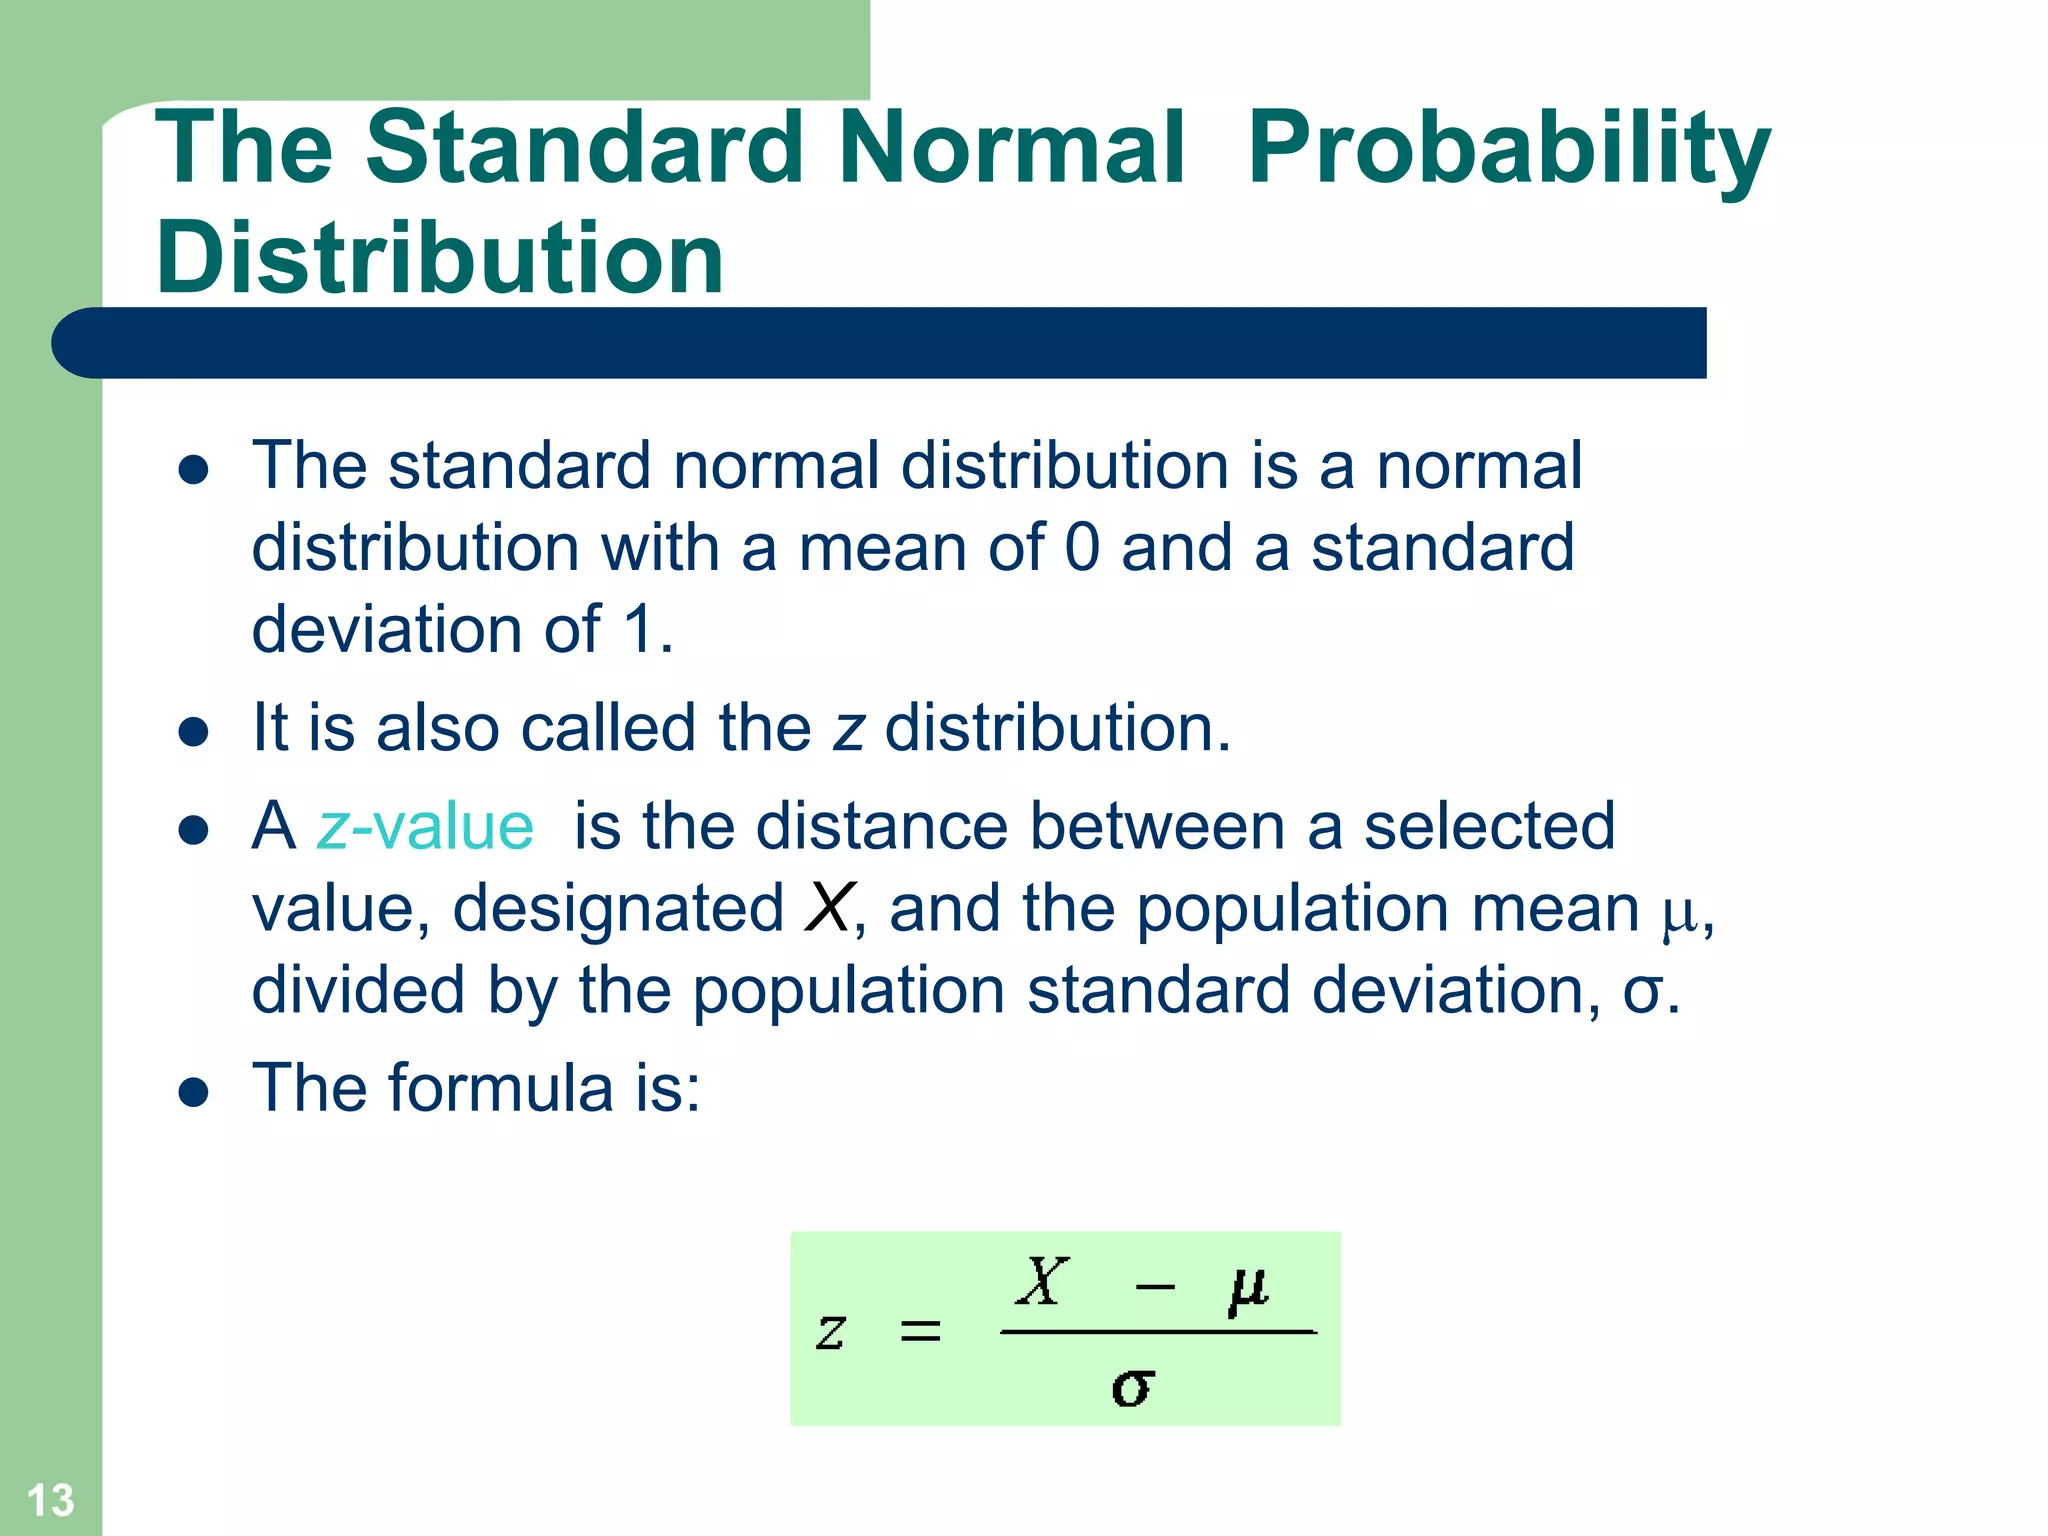
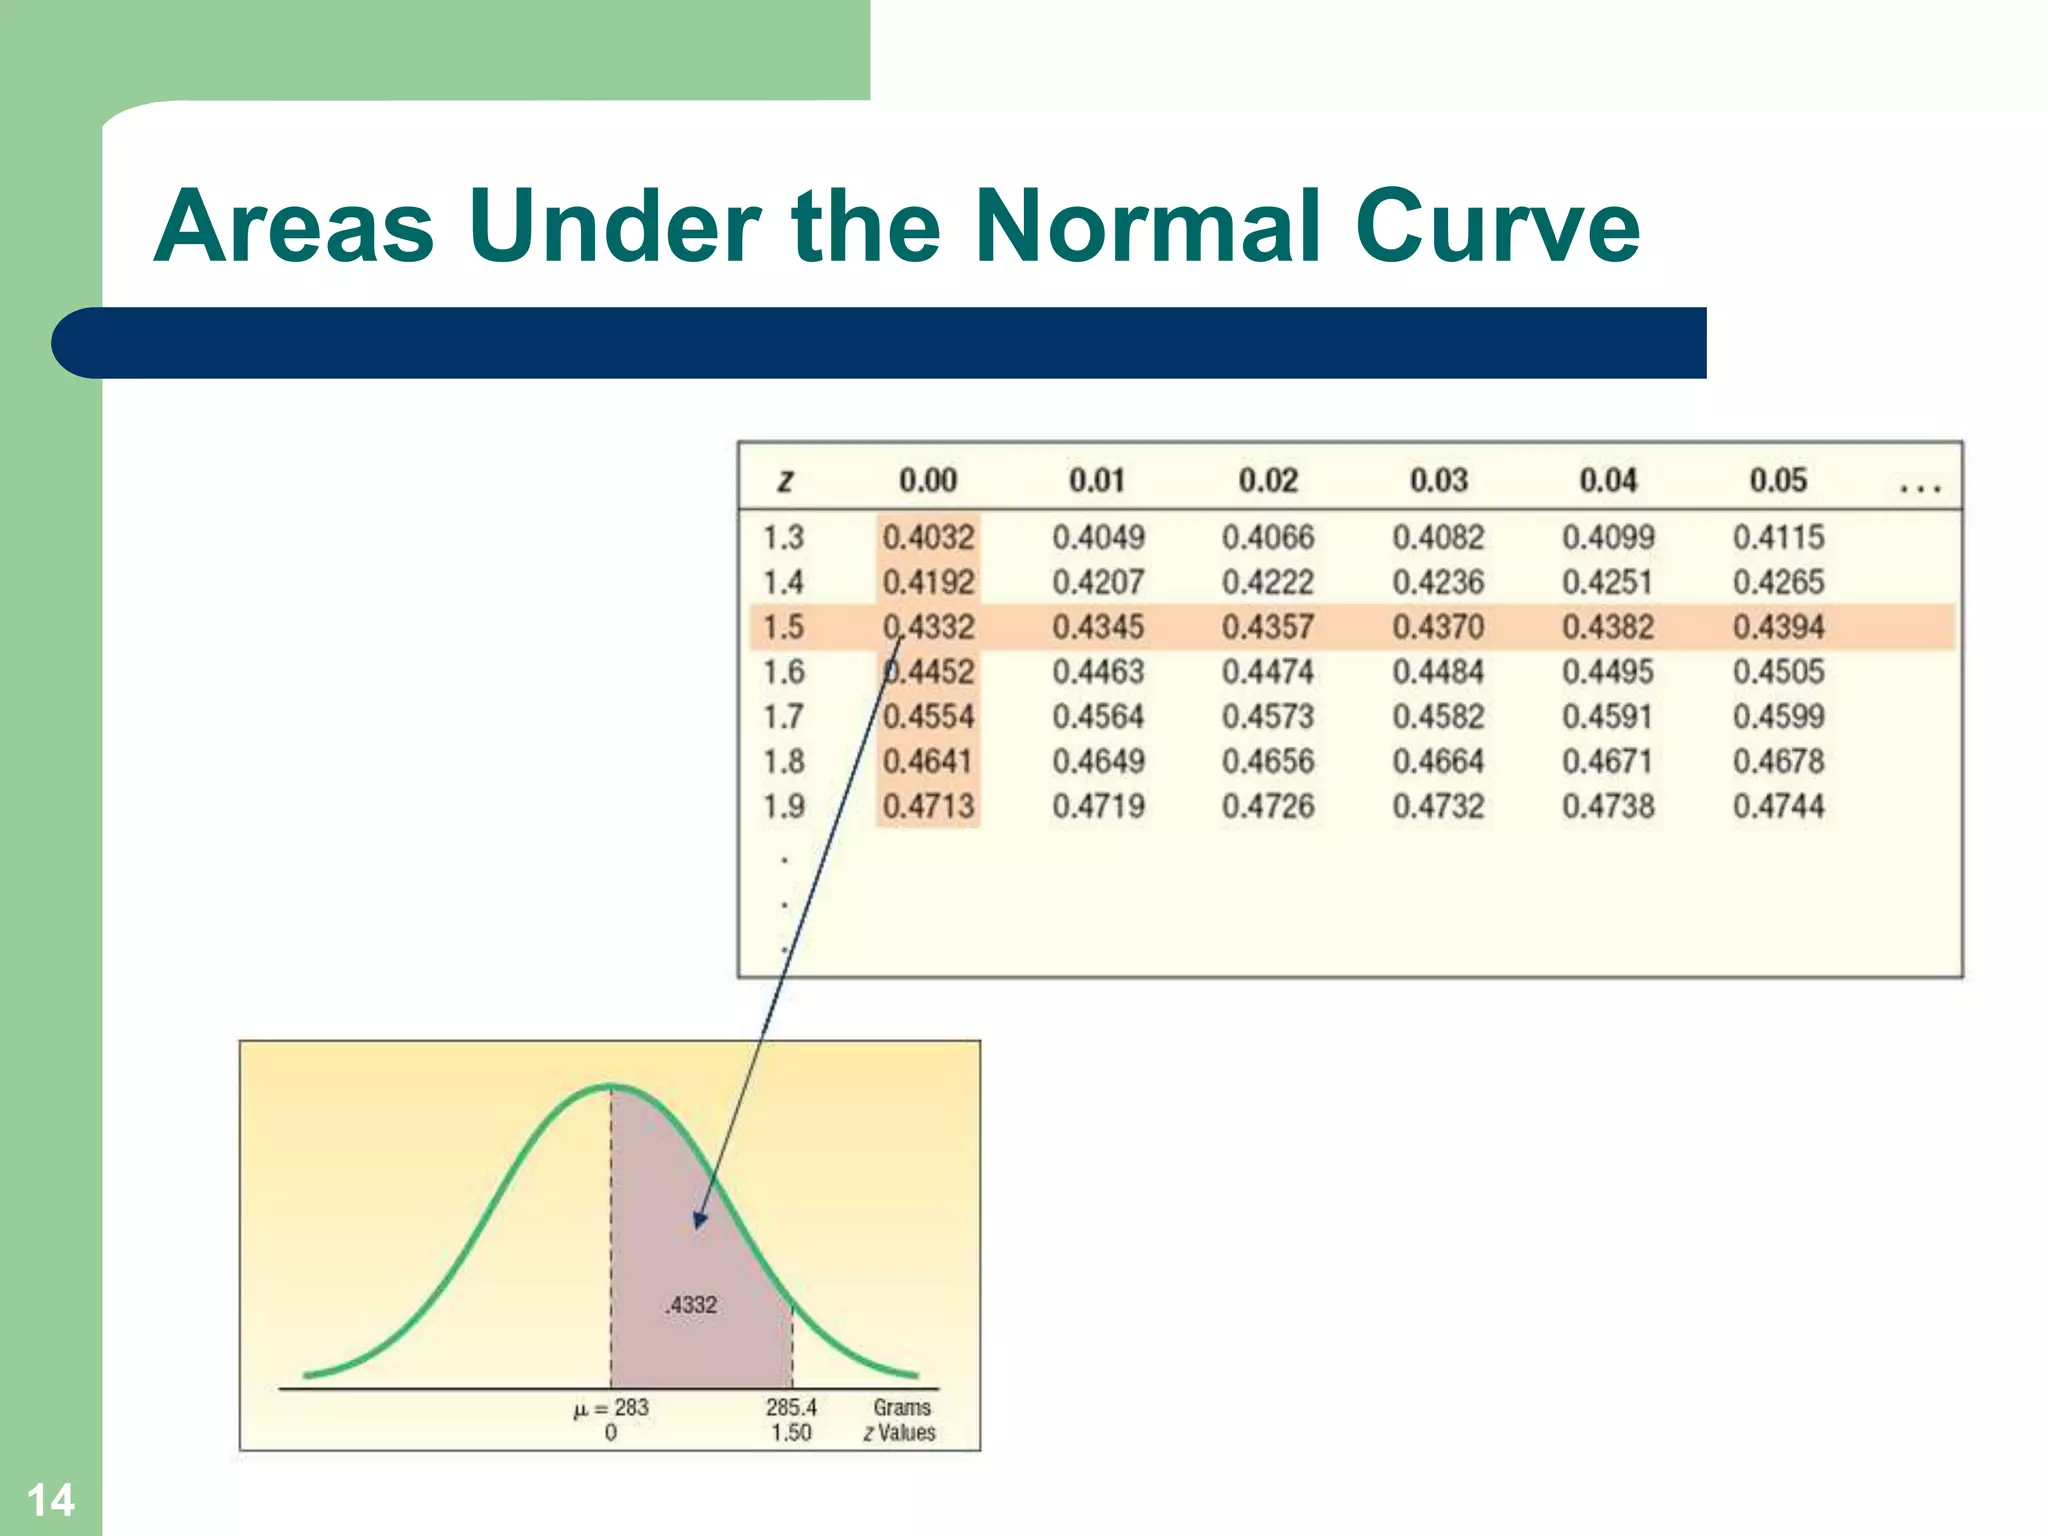
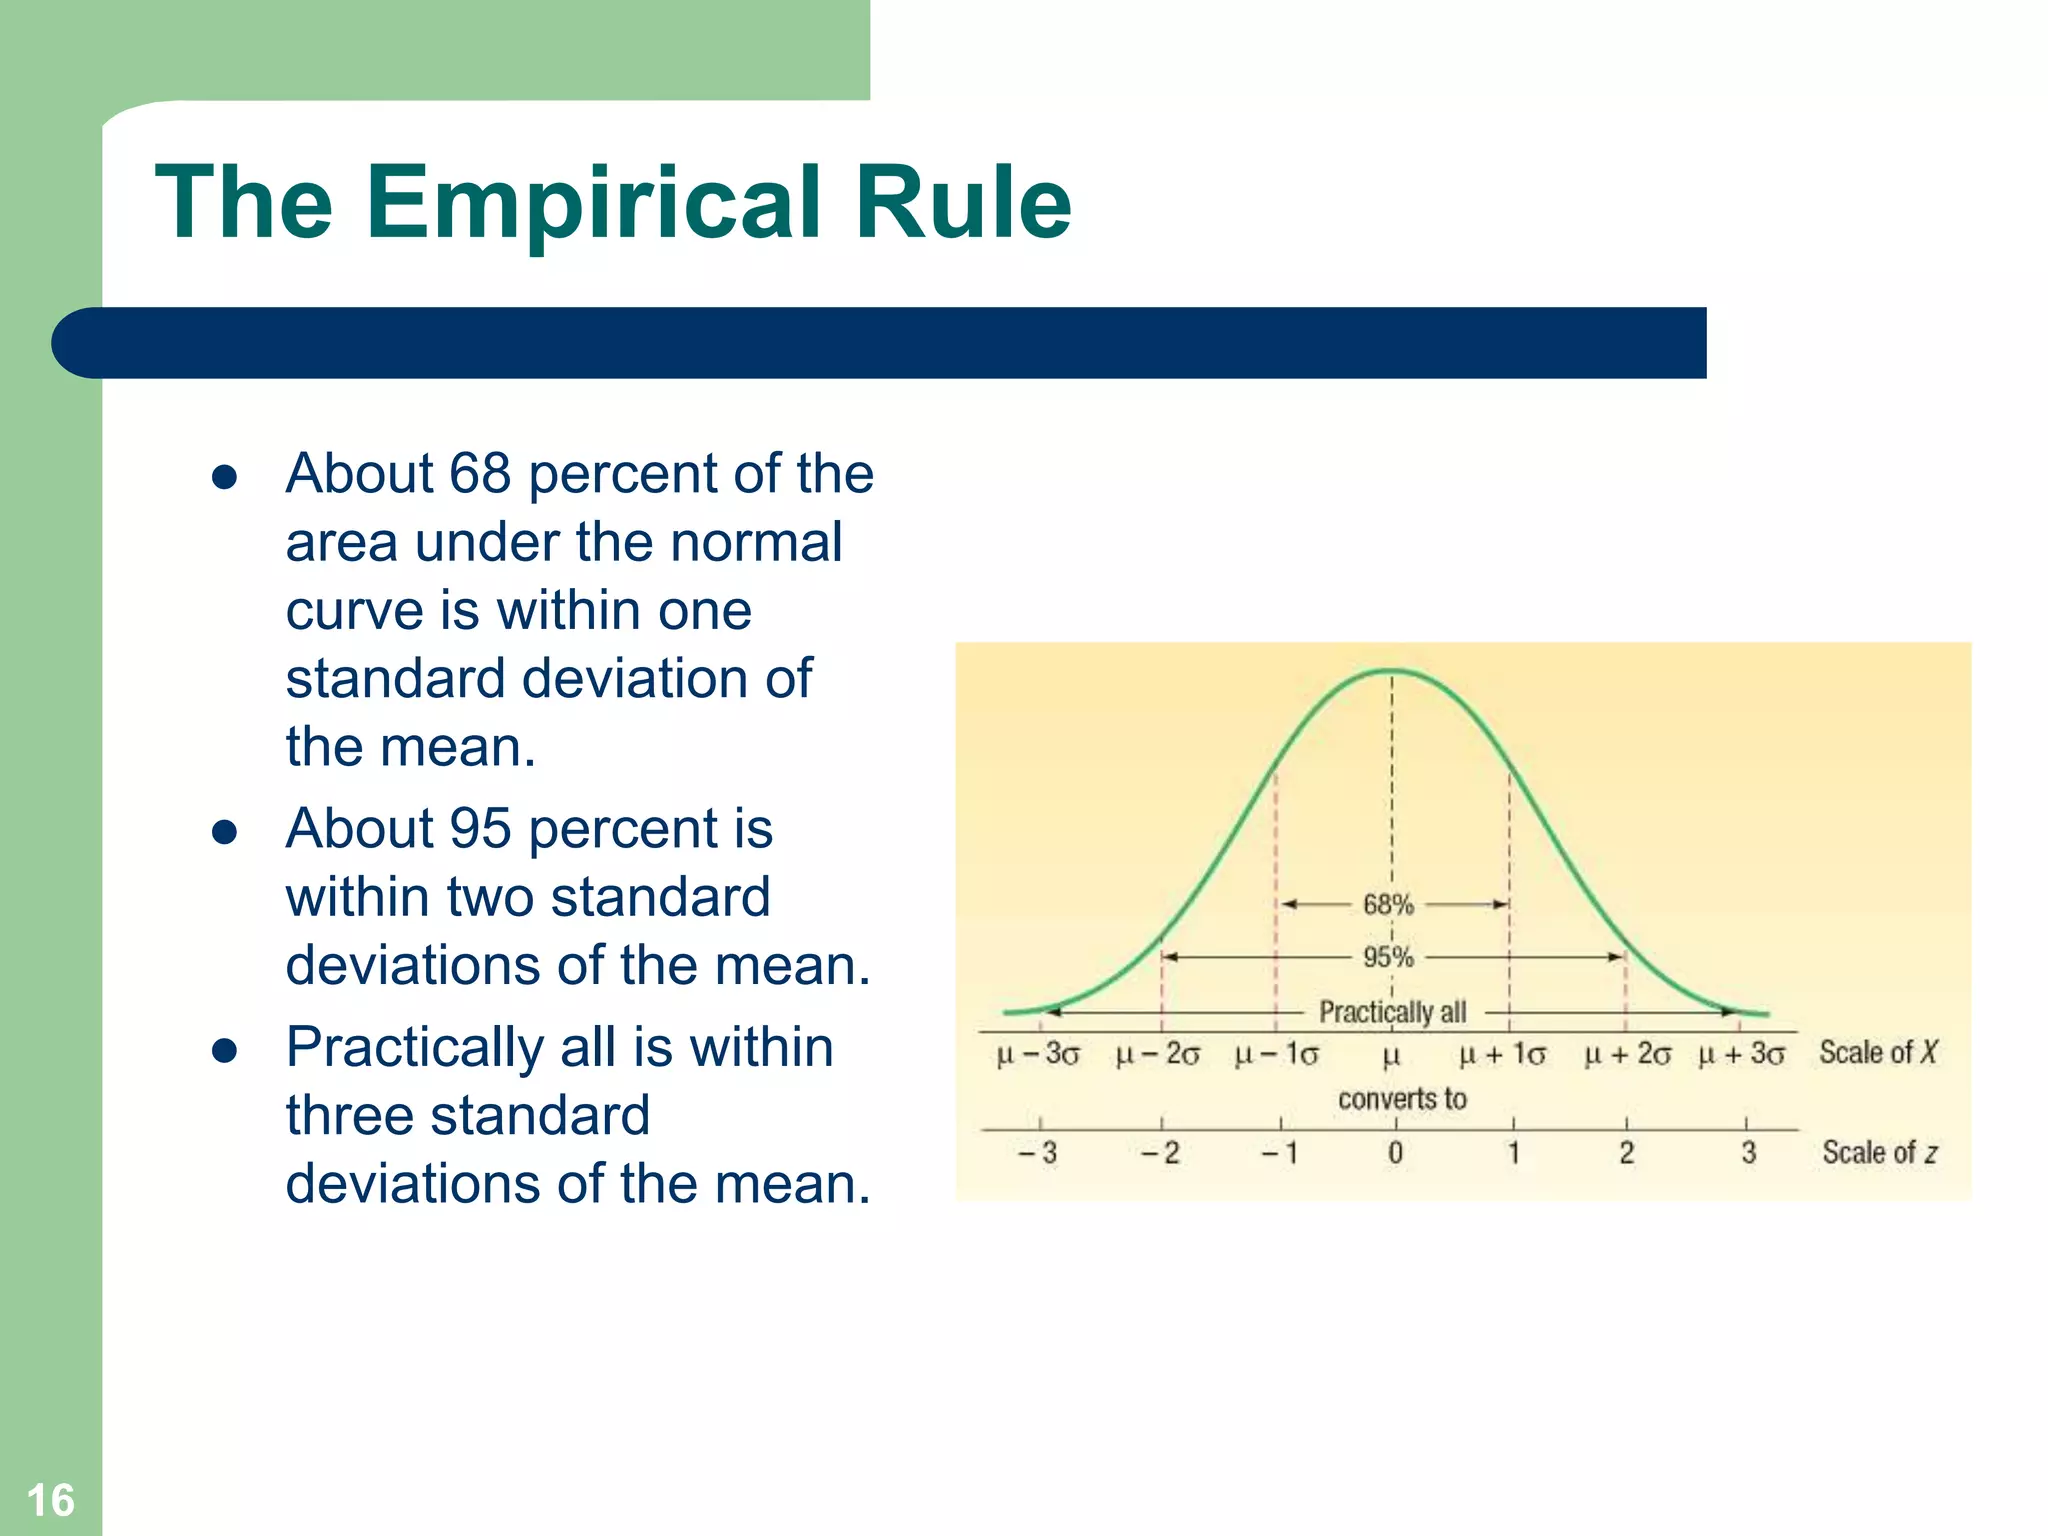

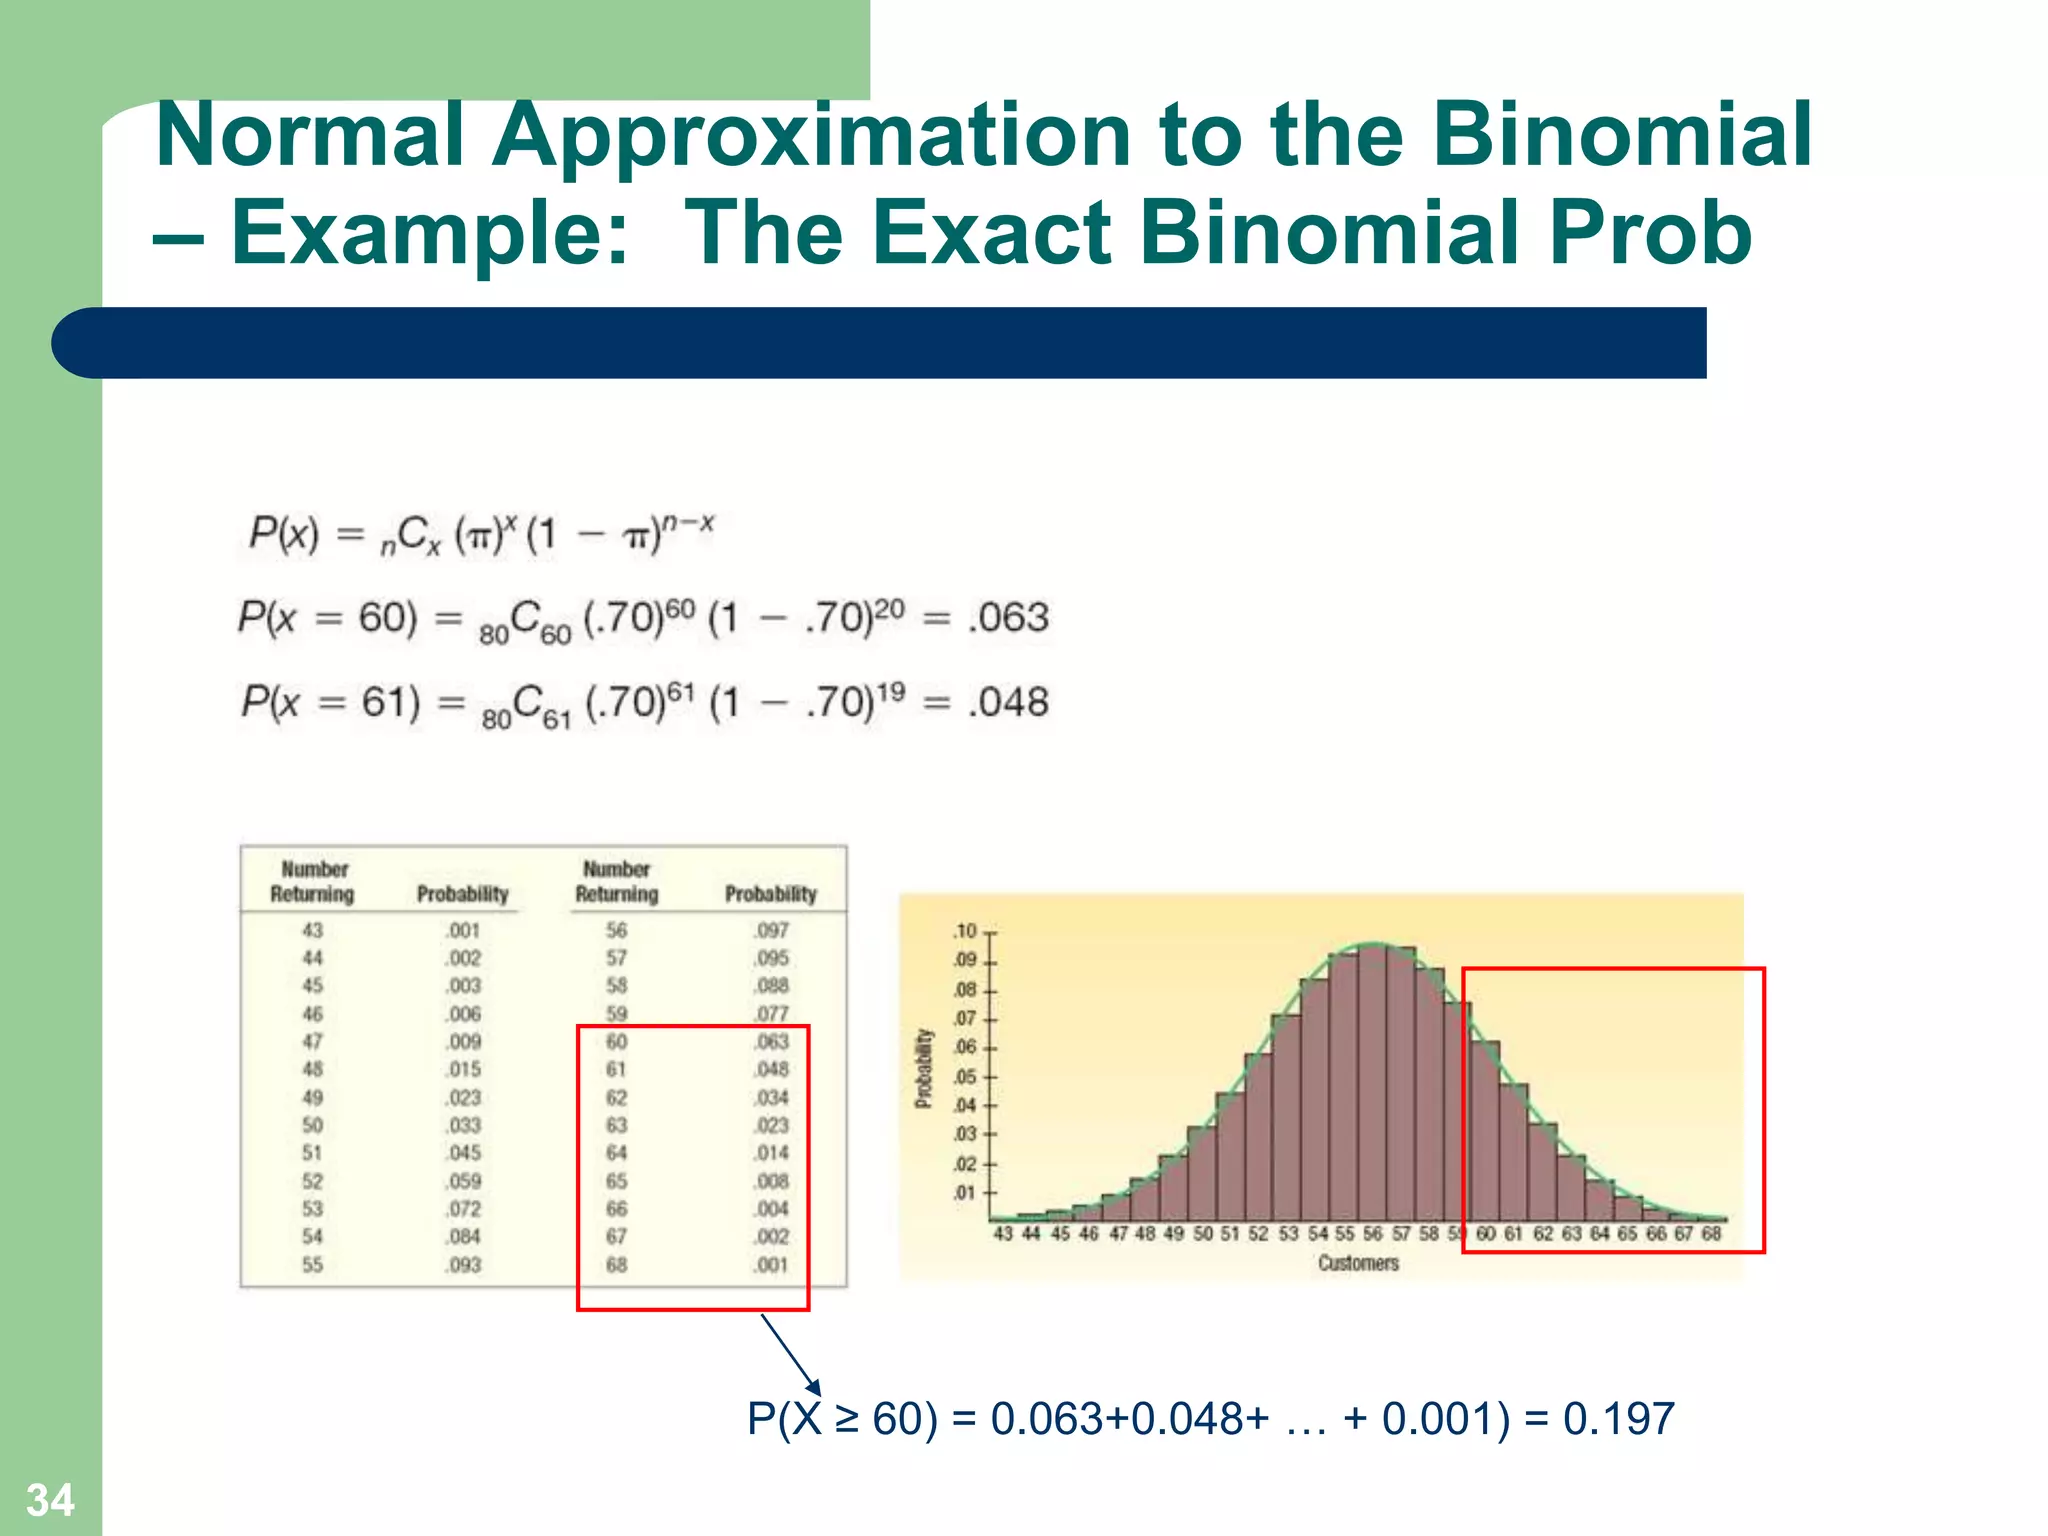
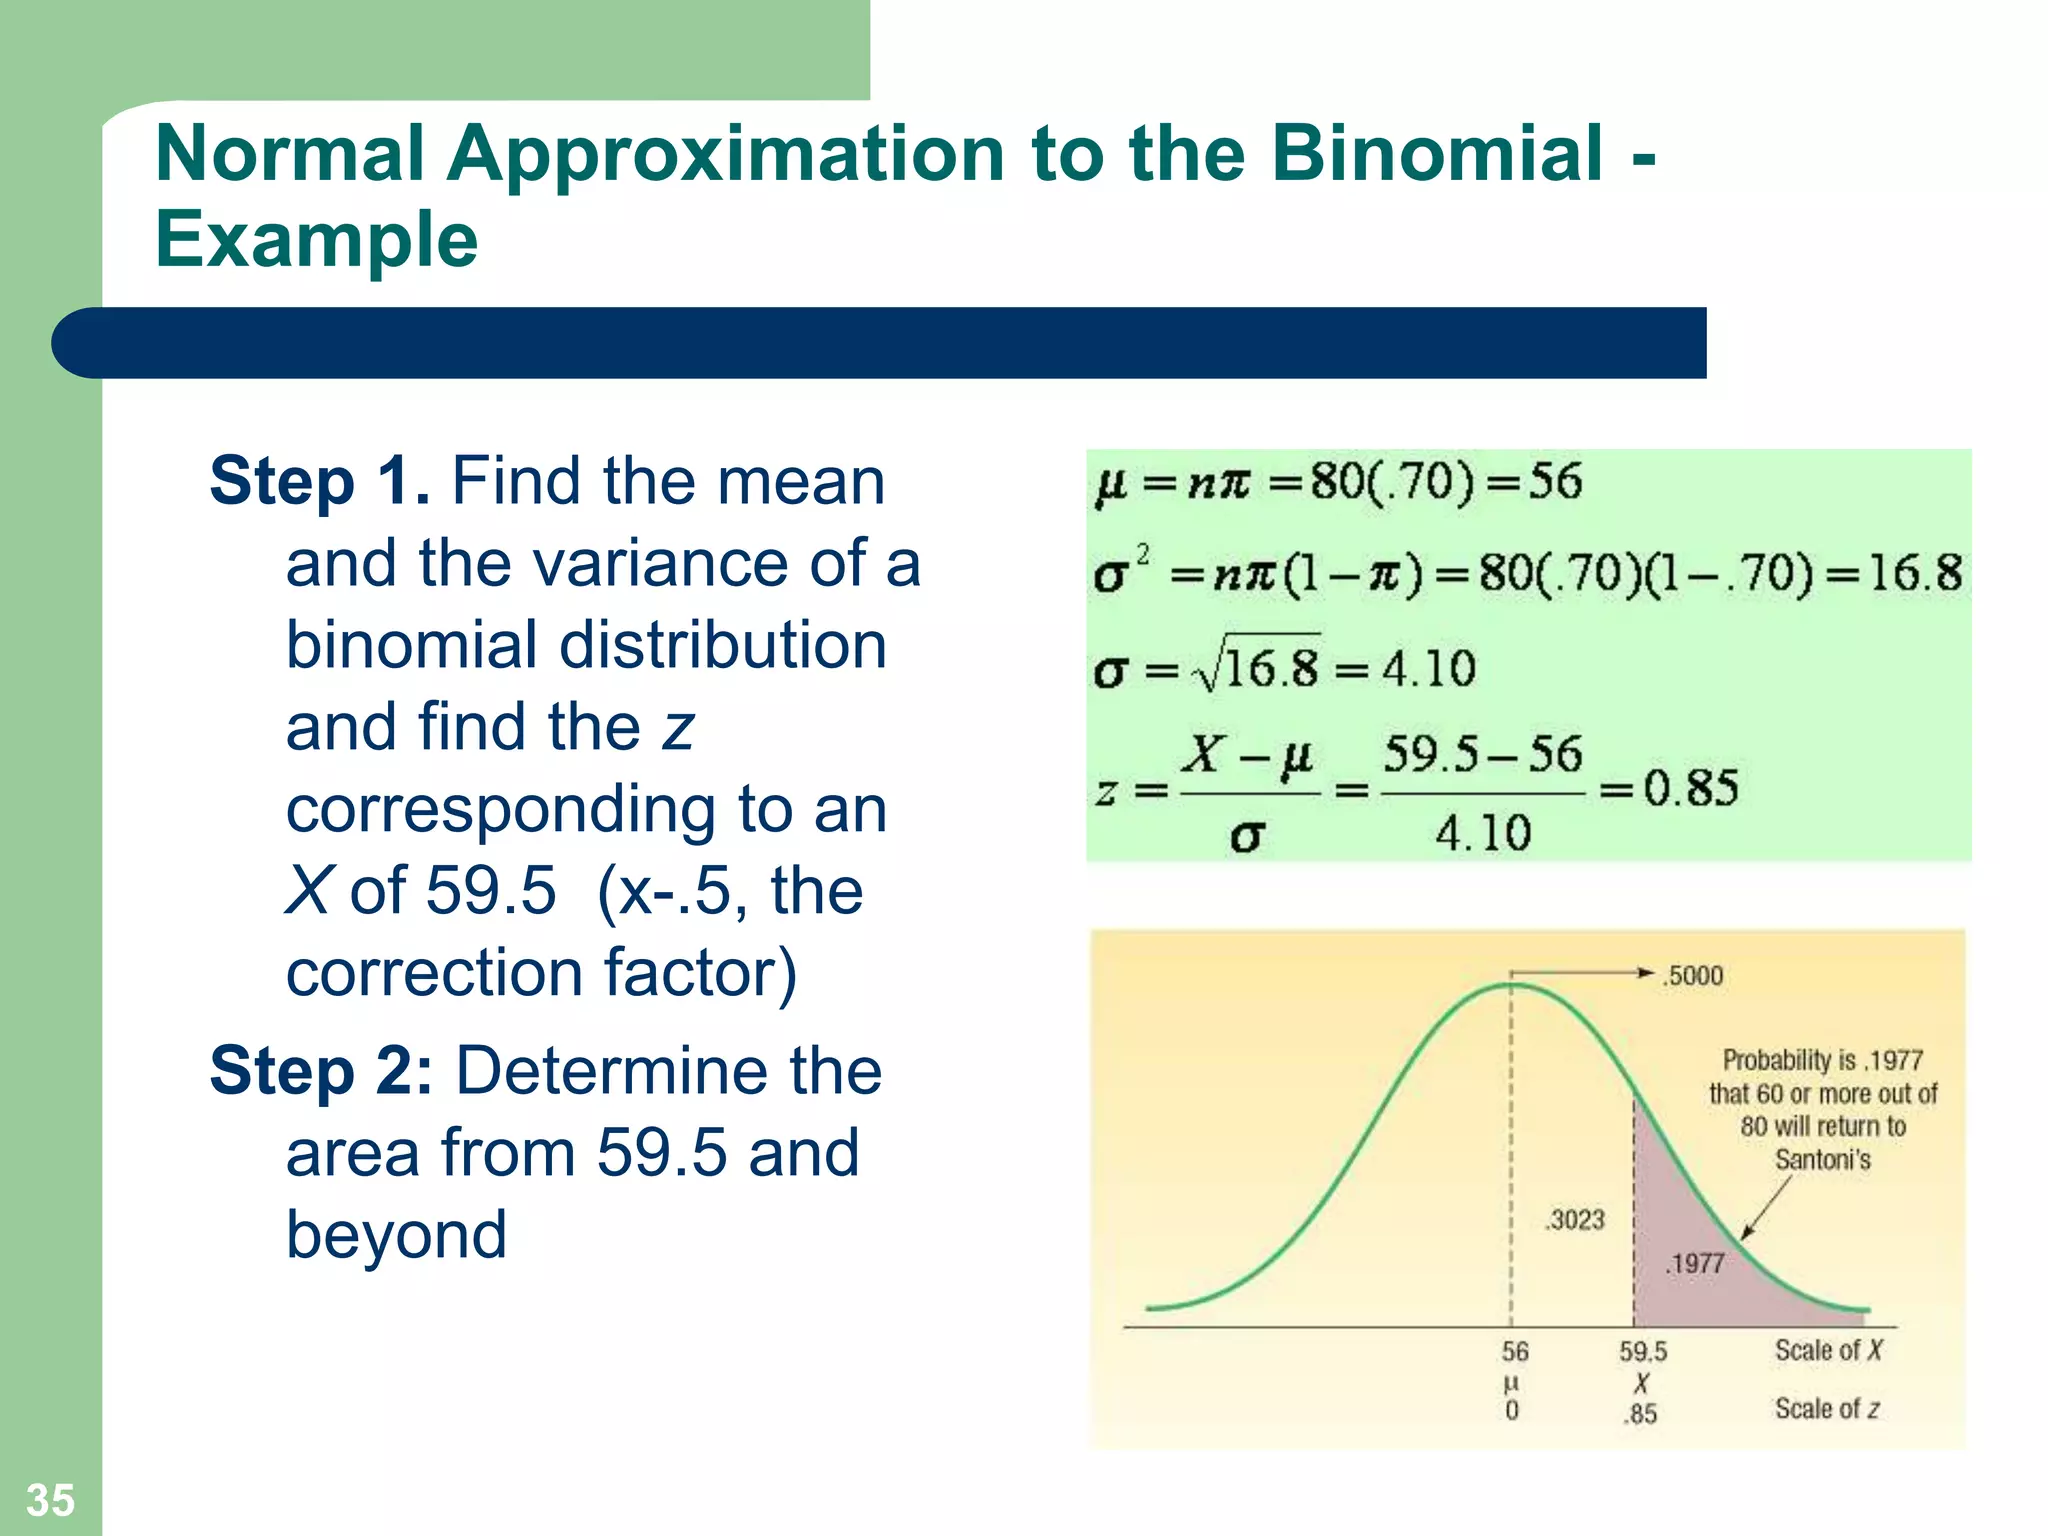


![NORMAL DISTRIBUTION FIN [Autosaved].pptx](https://cdn.slidesharecdn.com/ss_thumbnails/normaldistributionfinautosaved-250706062357-4c5756a9-thumbnail.jpg?width=640&height=640&fit=bounds)


