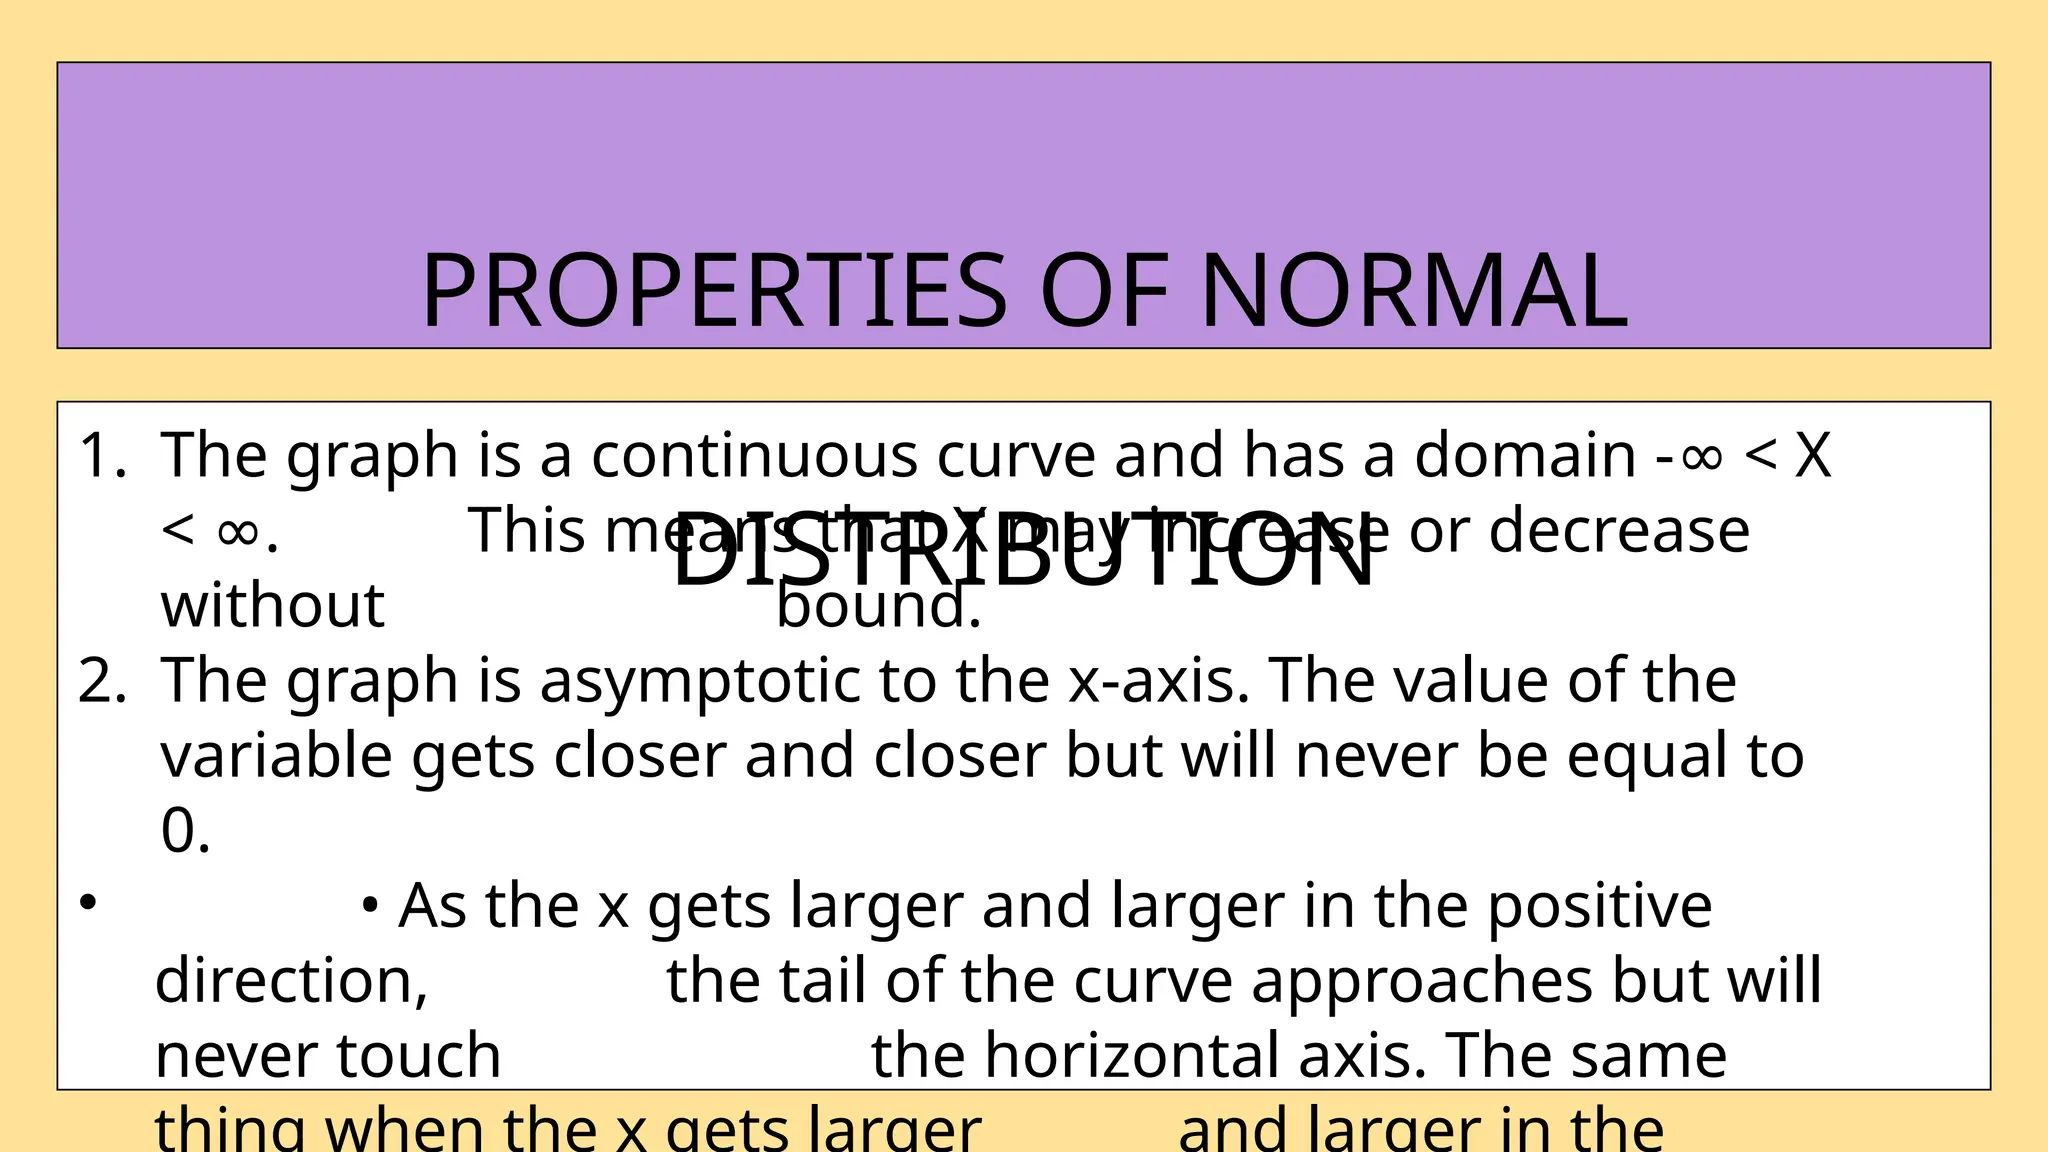
1. The graphis a continuous curve and has a domain - < X
∞
< .
∞ This means that X may increase or decrease
without bound.
2. The graph is asymptotic to the x-axis. The value of the
variable gets closer and closer but will never be equal to
0.
• • As the x gets larger and larger in the positive
direction, the tail of the curve approaches but will
never touch the horizontal axis. The same
thing when the x gets larger and larger in the
PROPERTIES OF NORMAL
DISTRIBUTION
4.
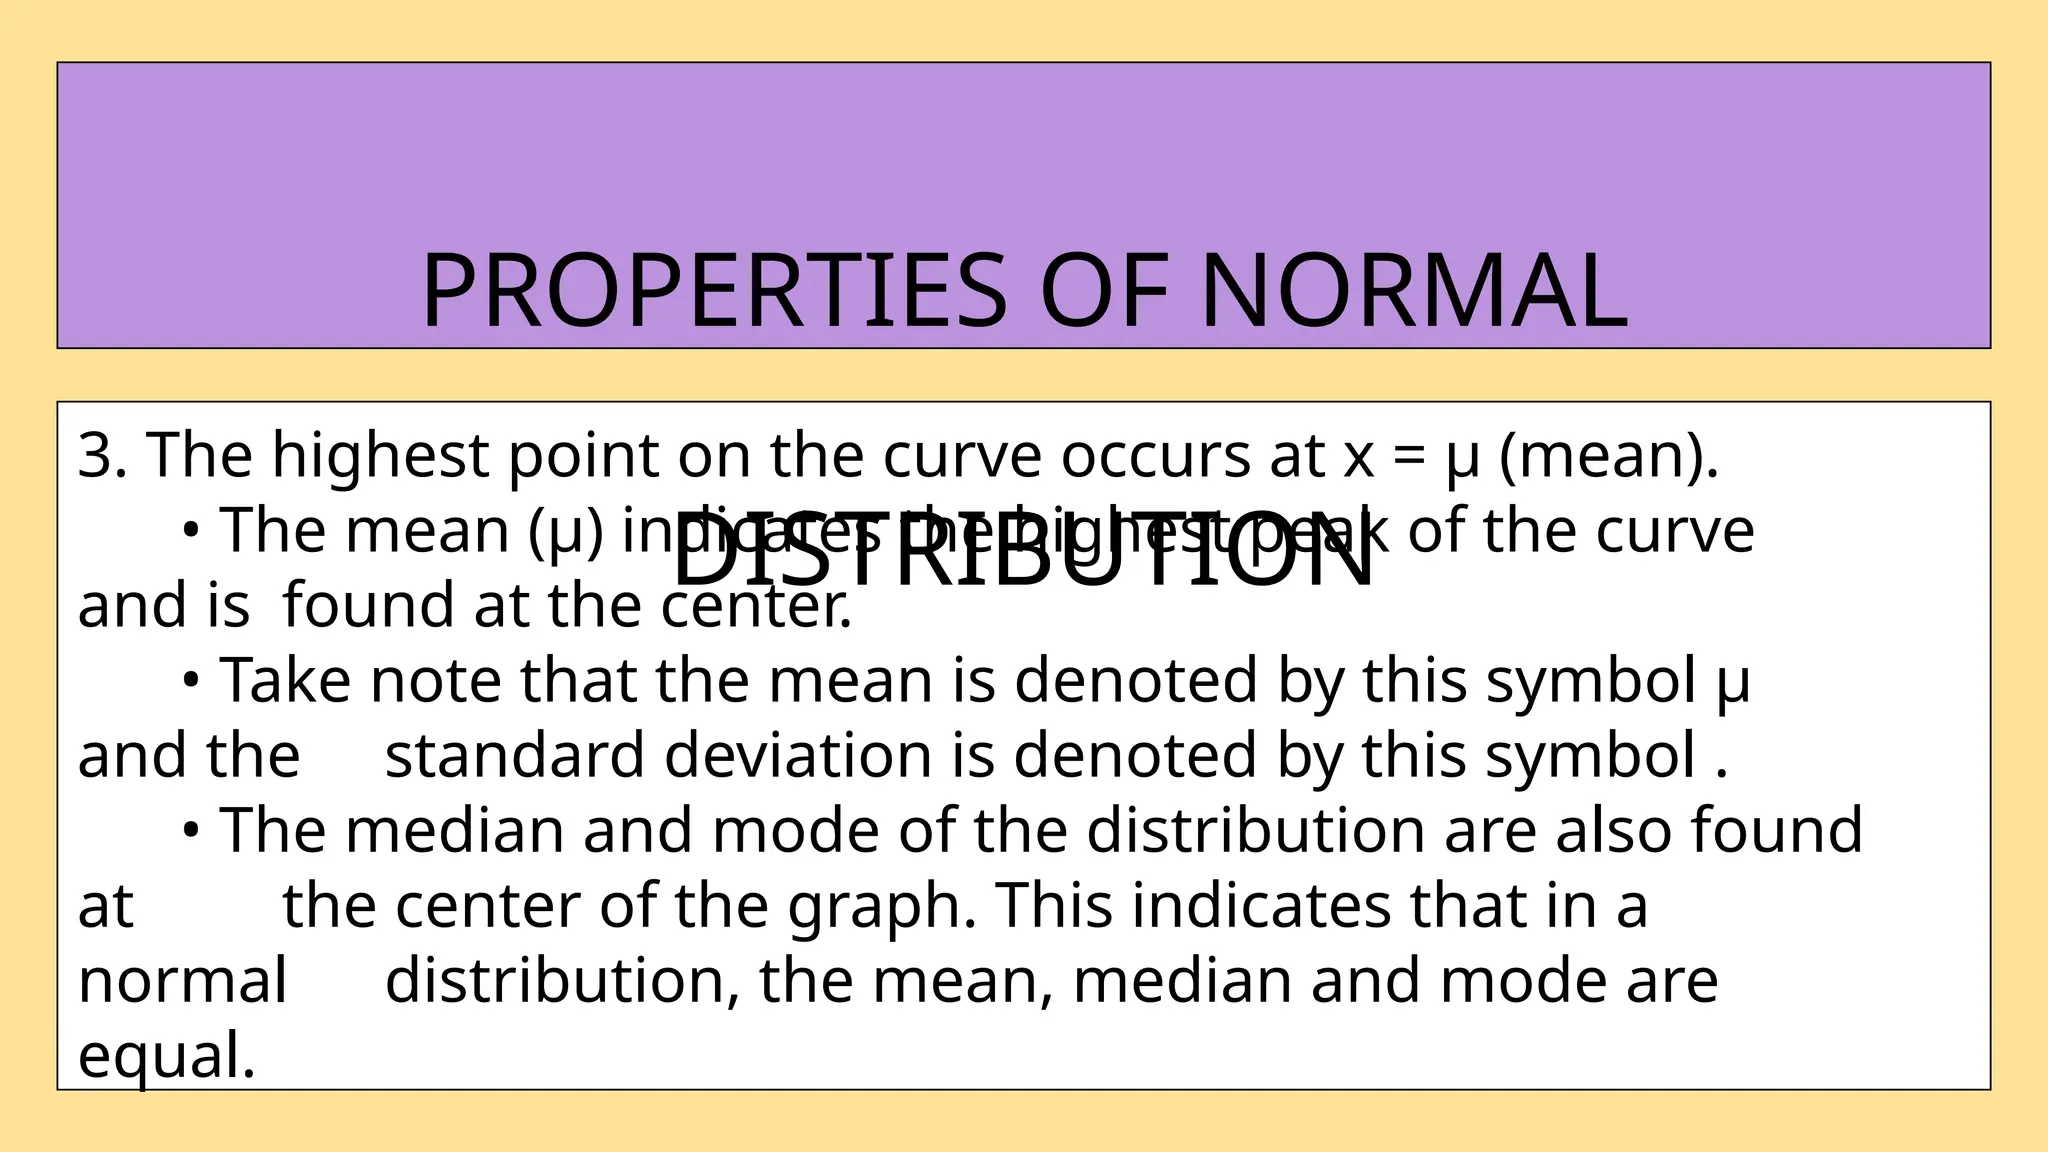
3. The highestpoint on the curve occurs at x = µ (mean).
• The mean (µ) indicates the highest peak of the curve
and is found at the center.
• Take note that the mean is denoted by this symbol µ
and the standard deviation is denoted by this symbol .
• The median and mode of the distribution are also found
at the center of the graph. This indicates that in a
normal distribution, the mean, median and mode are
equal.
PROPERTIES OF NORMAL
DISTRIBUTION
5.
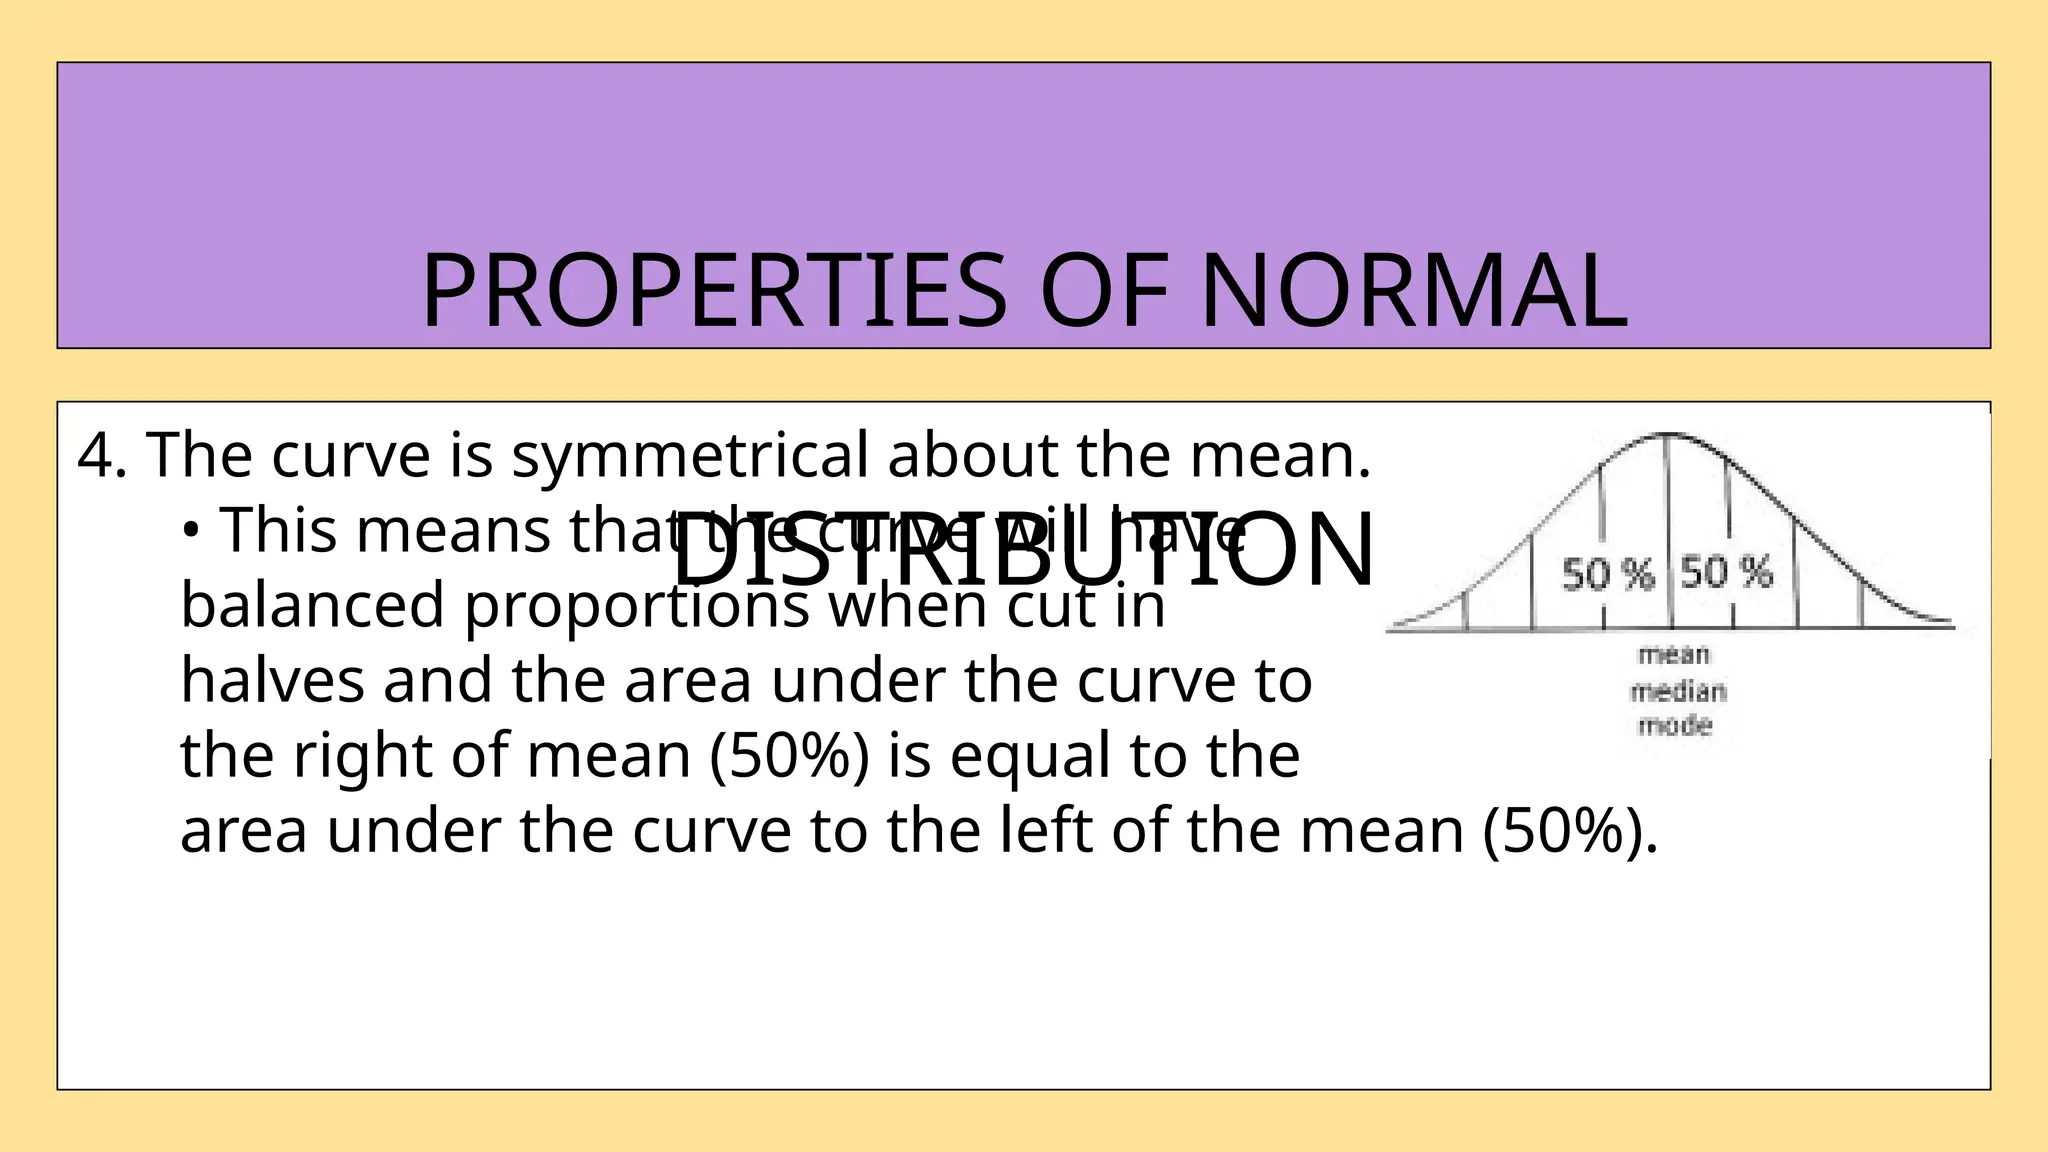
4. The curveis symmetrical about the mean.
• This means that the curve will have
balanced proportions when cut in
halves and the area under the curve to
the right of mean (50%) is equal to the
area under the curve to the left of the mean (50%).
PROPERTIES OF NORMAL
DISTRIBUTION
6.
5. The totalarea in the normal distribution under the curve is
equal to 1.
Since the mean divides the curve into halves, 50% of
the area is to the right and 50% to its left having a total
of 100% or 1.
PROPERTIES OF NORMAL
DISTRIBUTION
7.
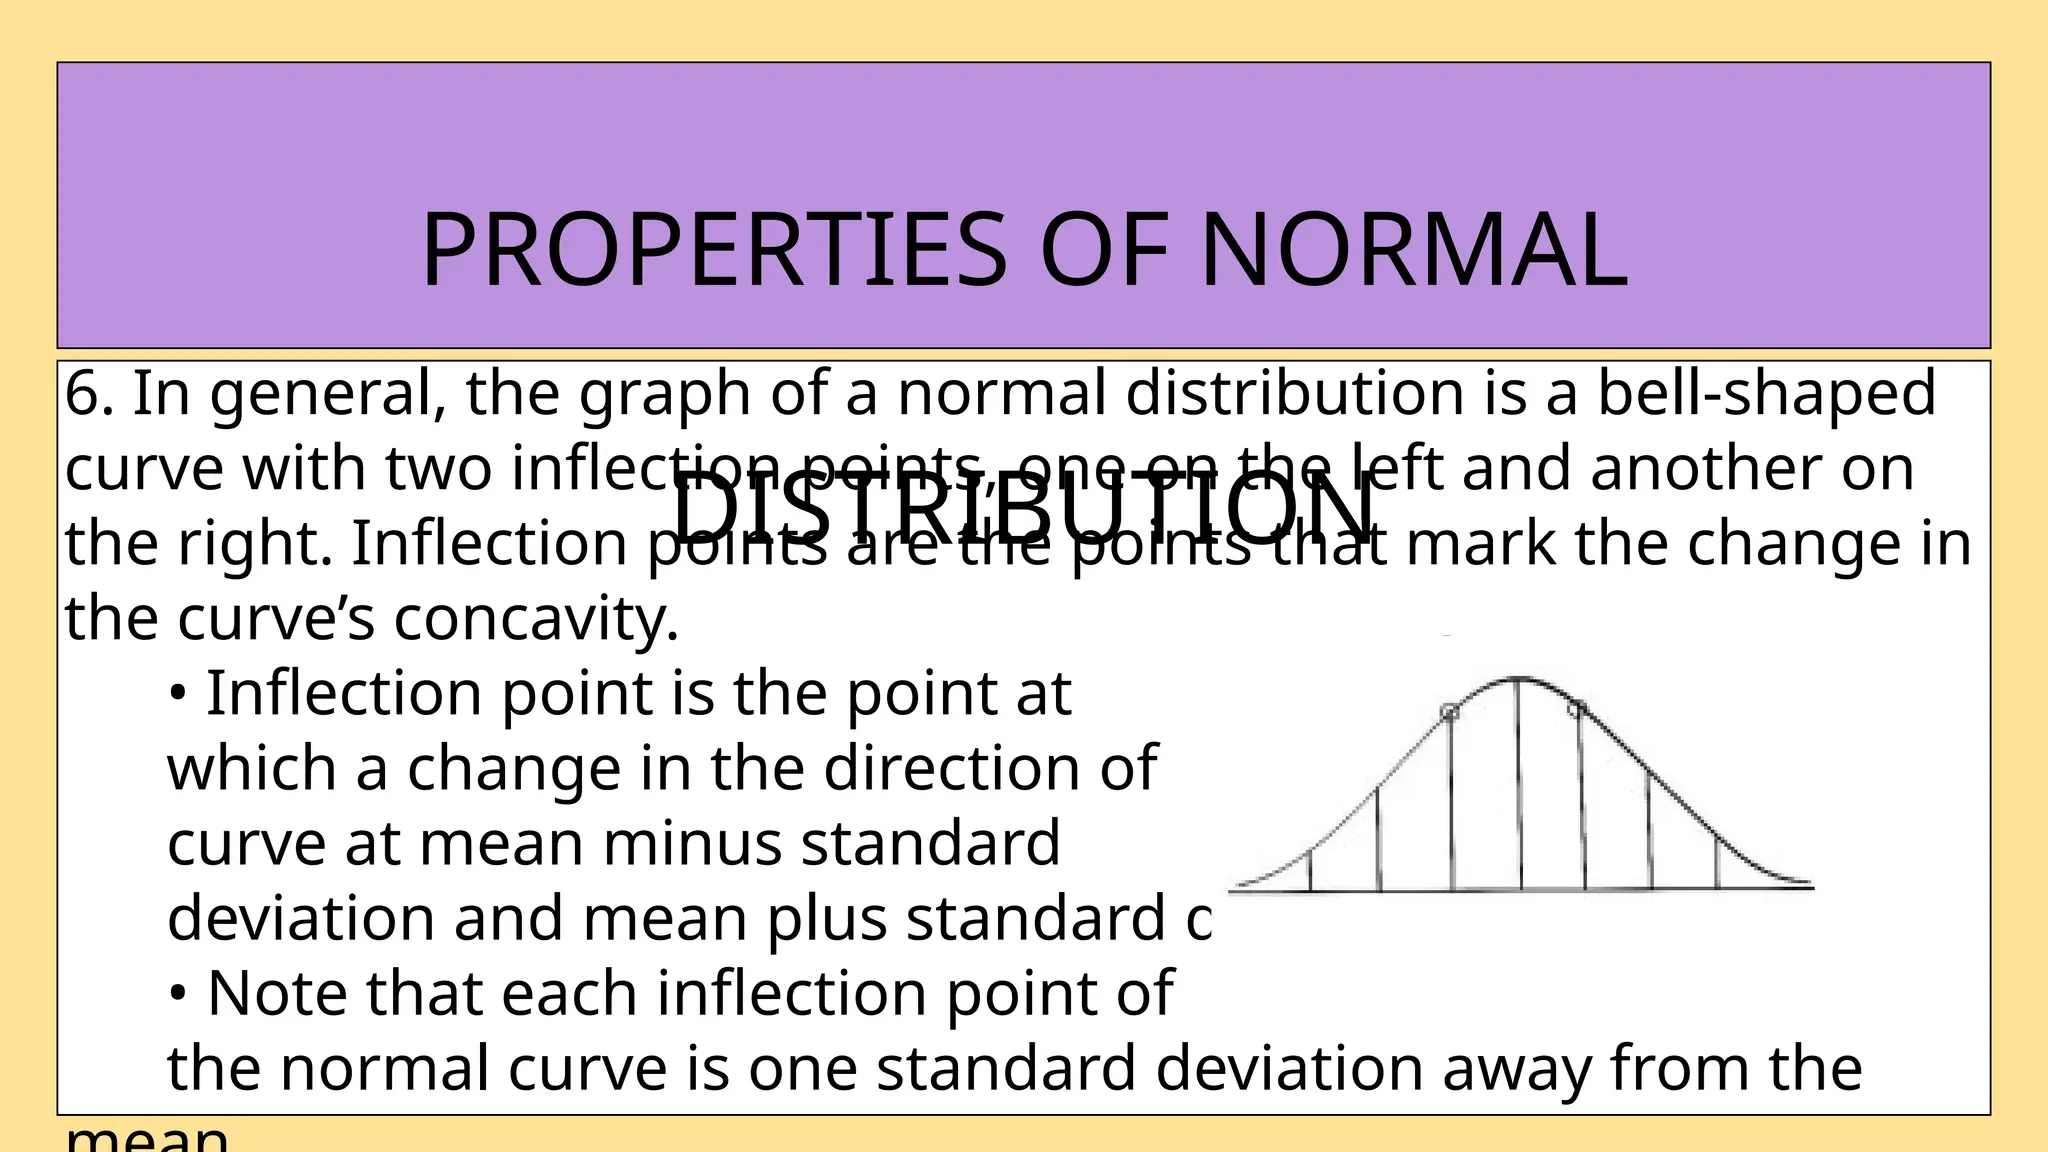
6. In general,the graph of a normal distribution is a bell-shaped
curve with two inflection points, one on the left and another on
the right. Inflection points are the points that mark the change in
the curve’s concavity.
• Inflection point is the point at
which a change in the direction of
curve at mean minus standard
deviation and mean plus standard deviation.
• Note that each inflection point of
the normal curve is one standard deviation away from the
PROPERTIES OF NORMAL
DISTRIBUTION
8.
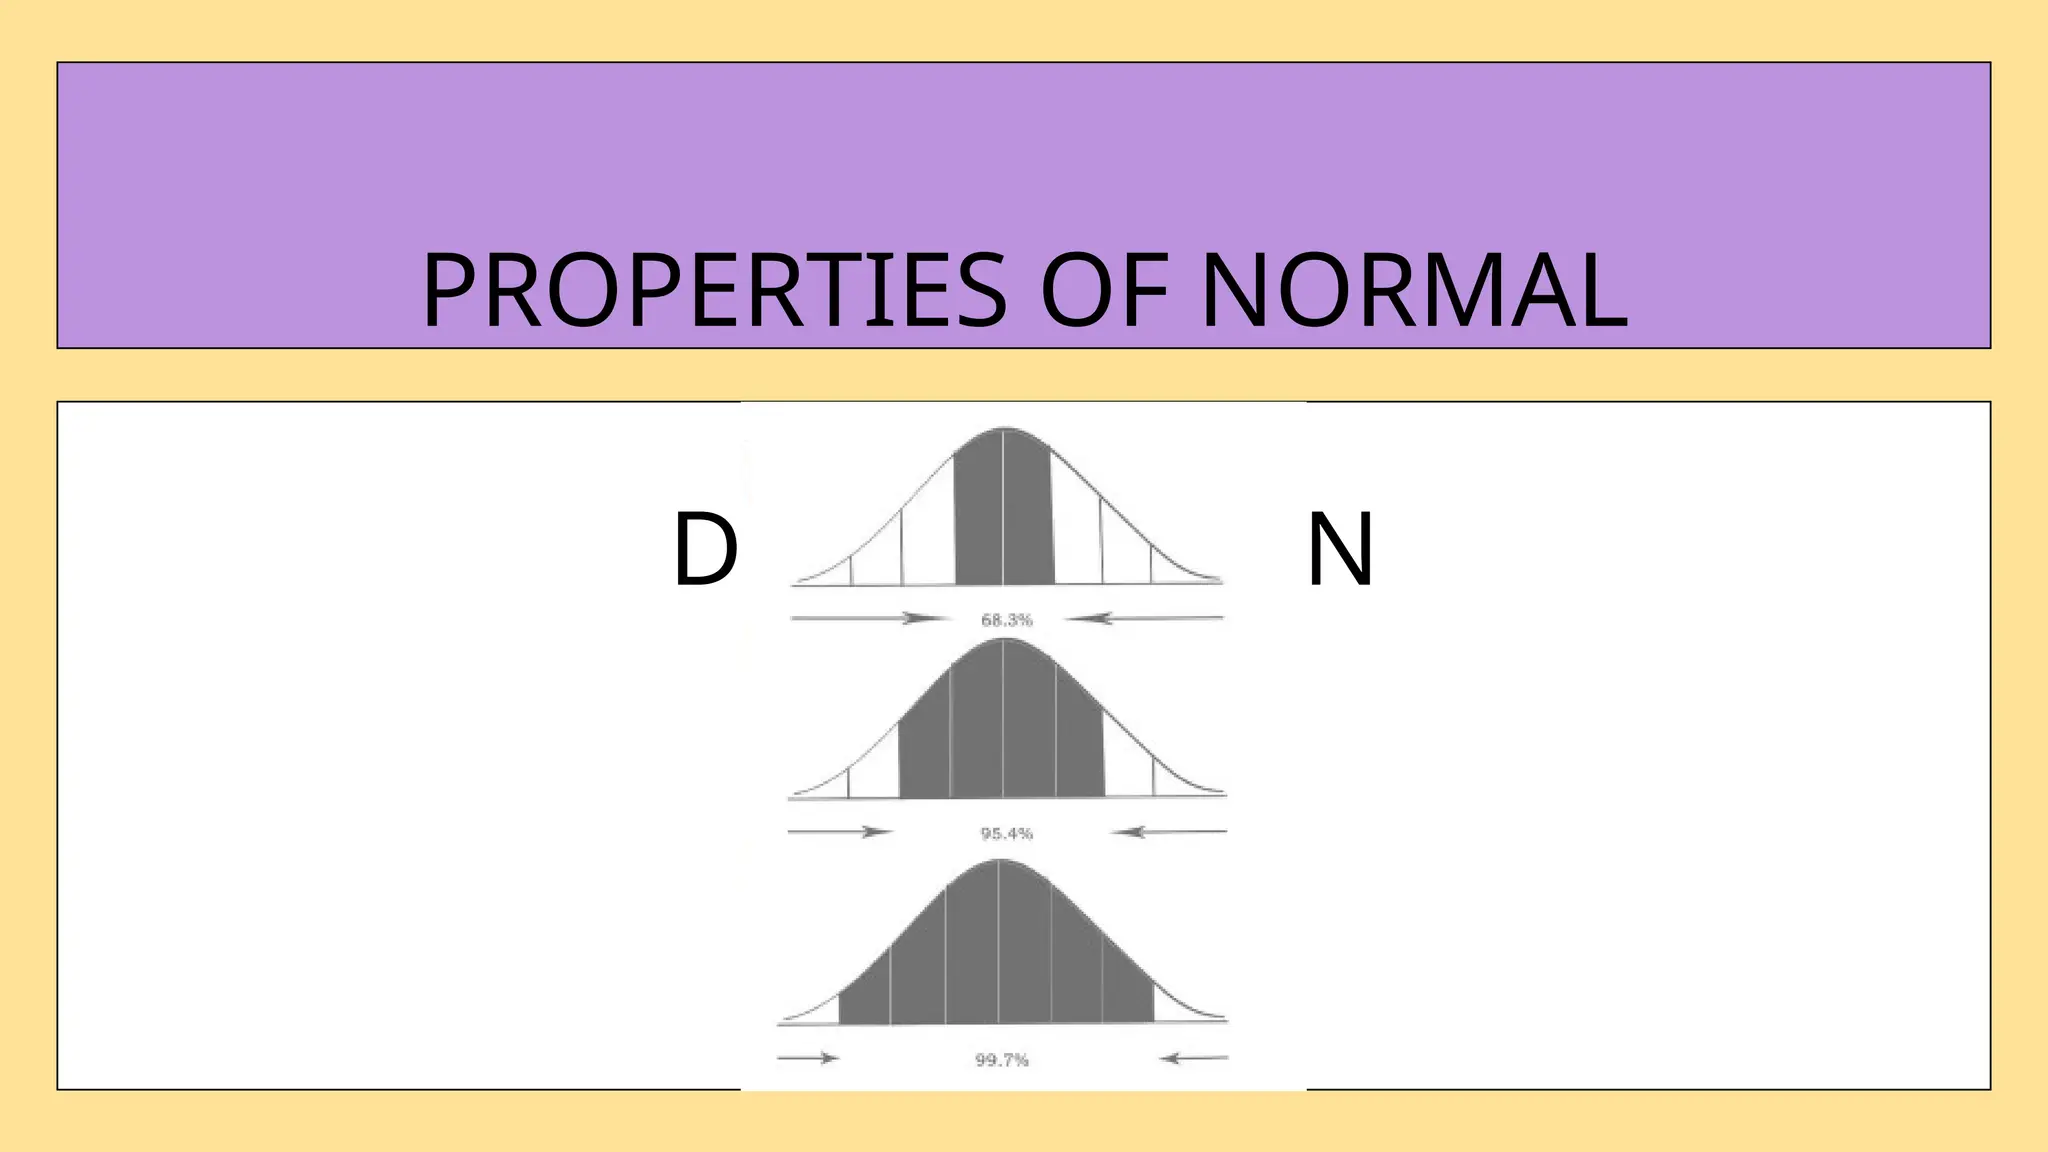
7. Every normalcurve corresponds to the “empirical rule” (also
called the 68 - 95 - 99.7% rule):
• about 68.3% of the area under the curve falls within 1
standard
deviation of the mean
• about 95.4% of the area under the curve falls within 2
standard
deviations of the mean
• about 99.7% of the area under the curve falls within 3
standard
PROPERTIES OF NORMAL
DISTRIBUTION
Examples
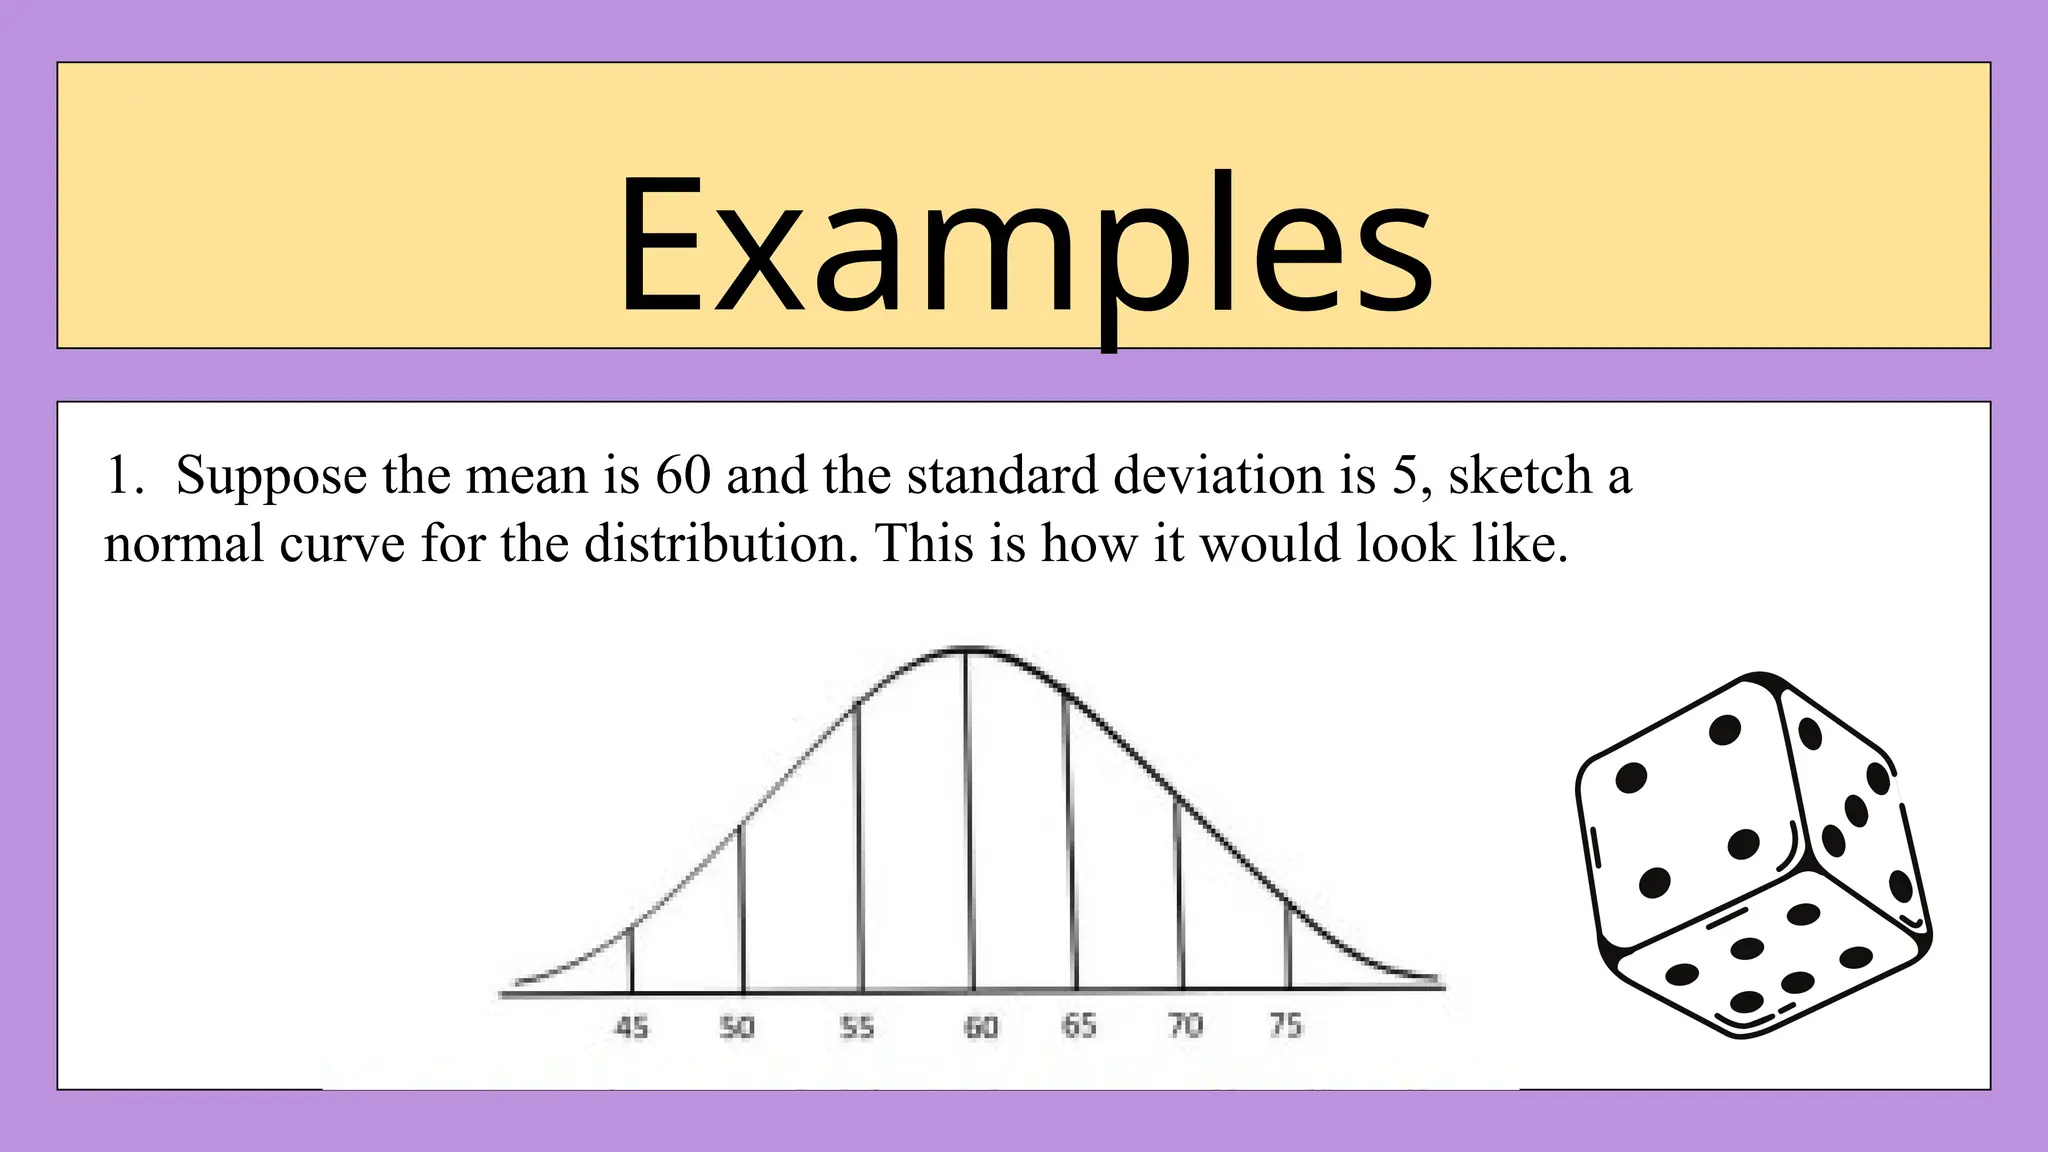
1. Suppose themean is 60 and the standard deviation is 5, sketch a
normal curve for the distribution. This is how it would look like.
11.
Examples
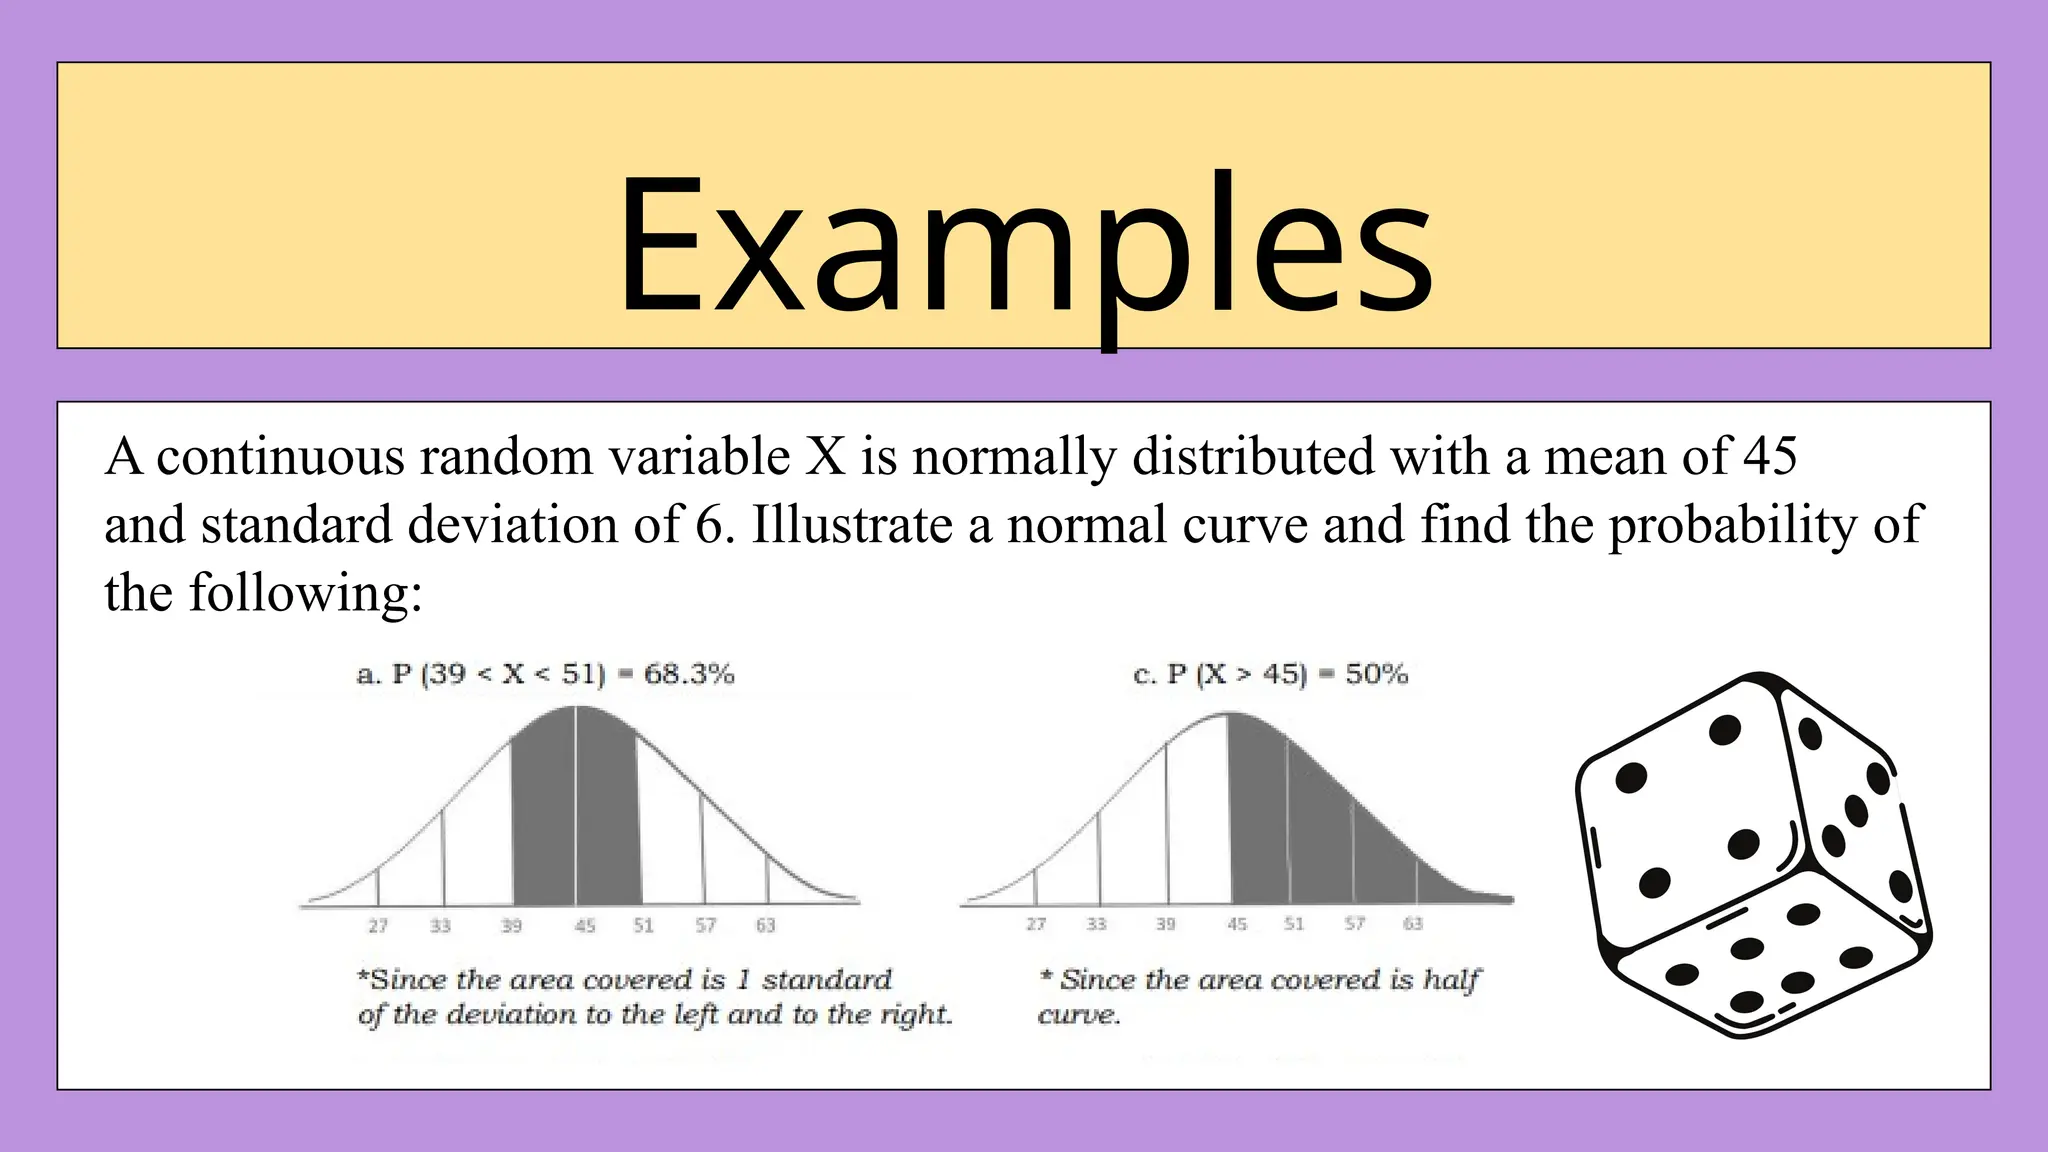
A continuous randomvariable X is normally distributed with a mean of 45
and standard deviation of 6. Illustrate a normal curve and find the probability of
the following:
12.
Examples
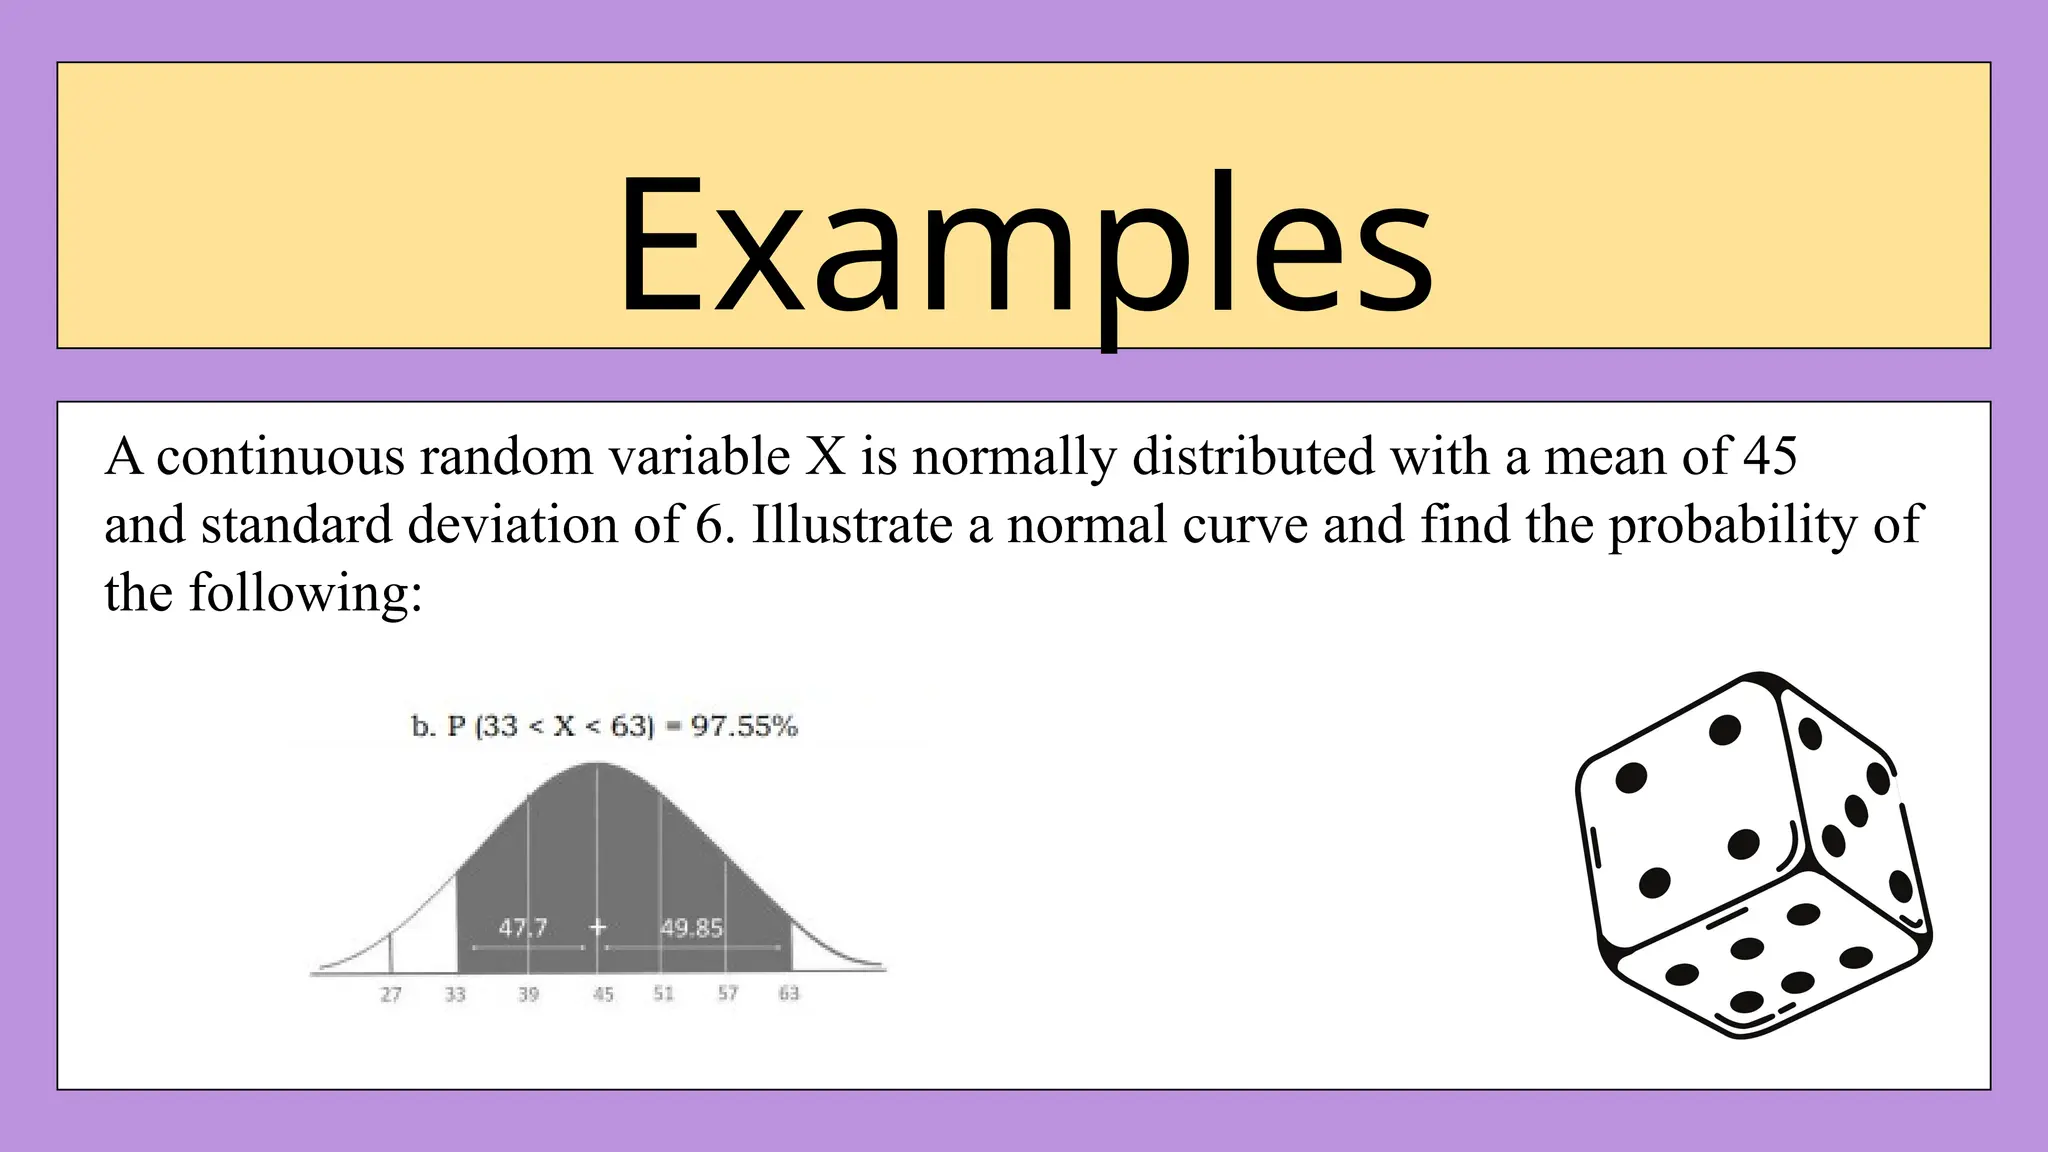
A continuous randomvariable X is normally distributed with a mean of 45
and standard deviation of 6. Illustrate a normal curve and find the probability of
the following:
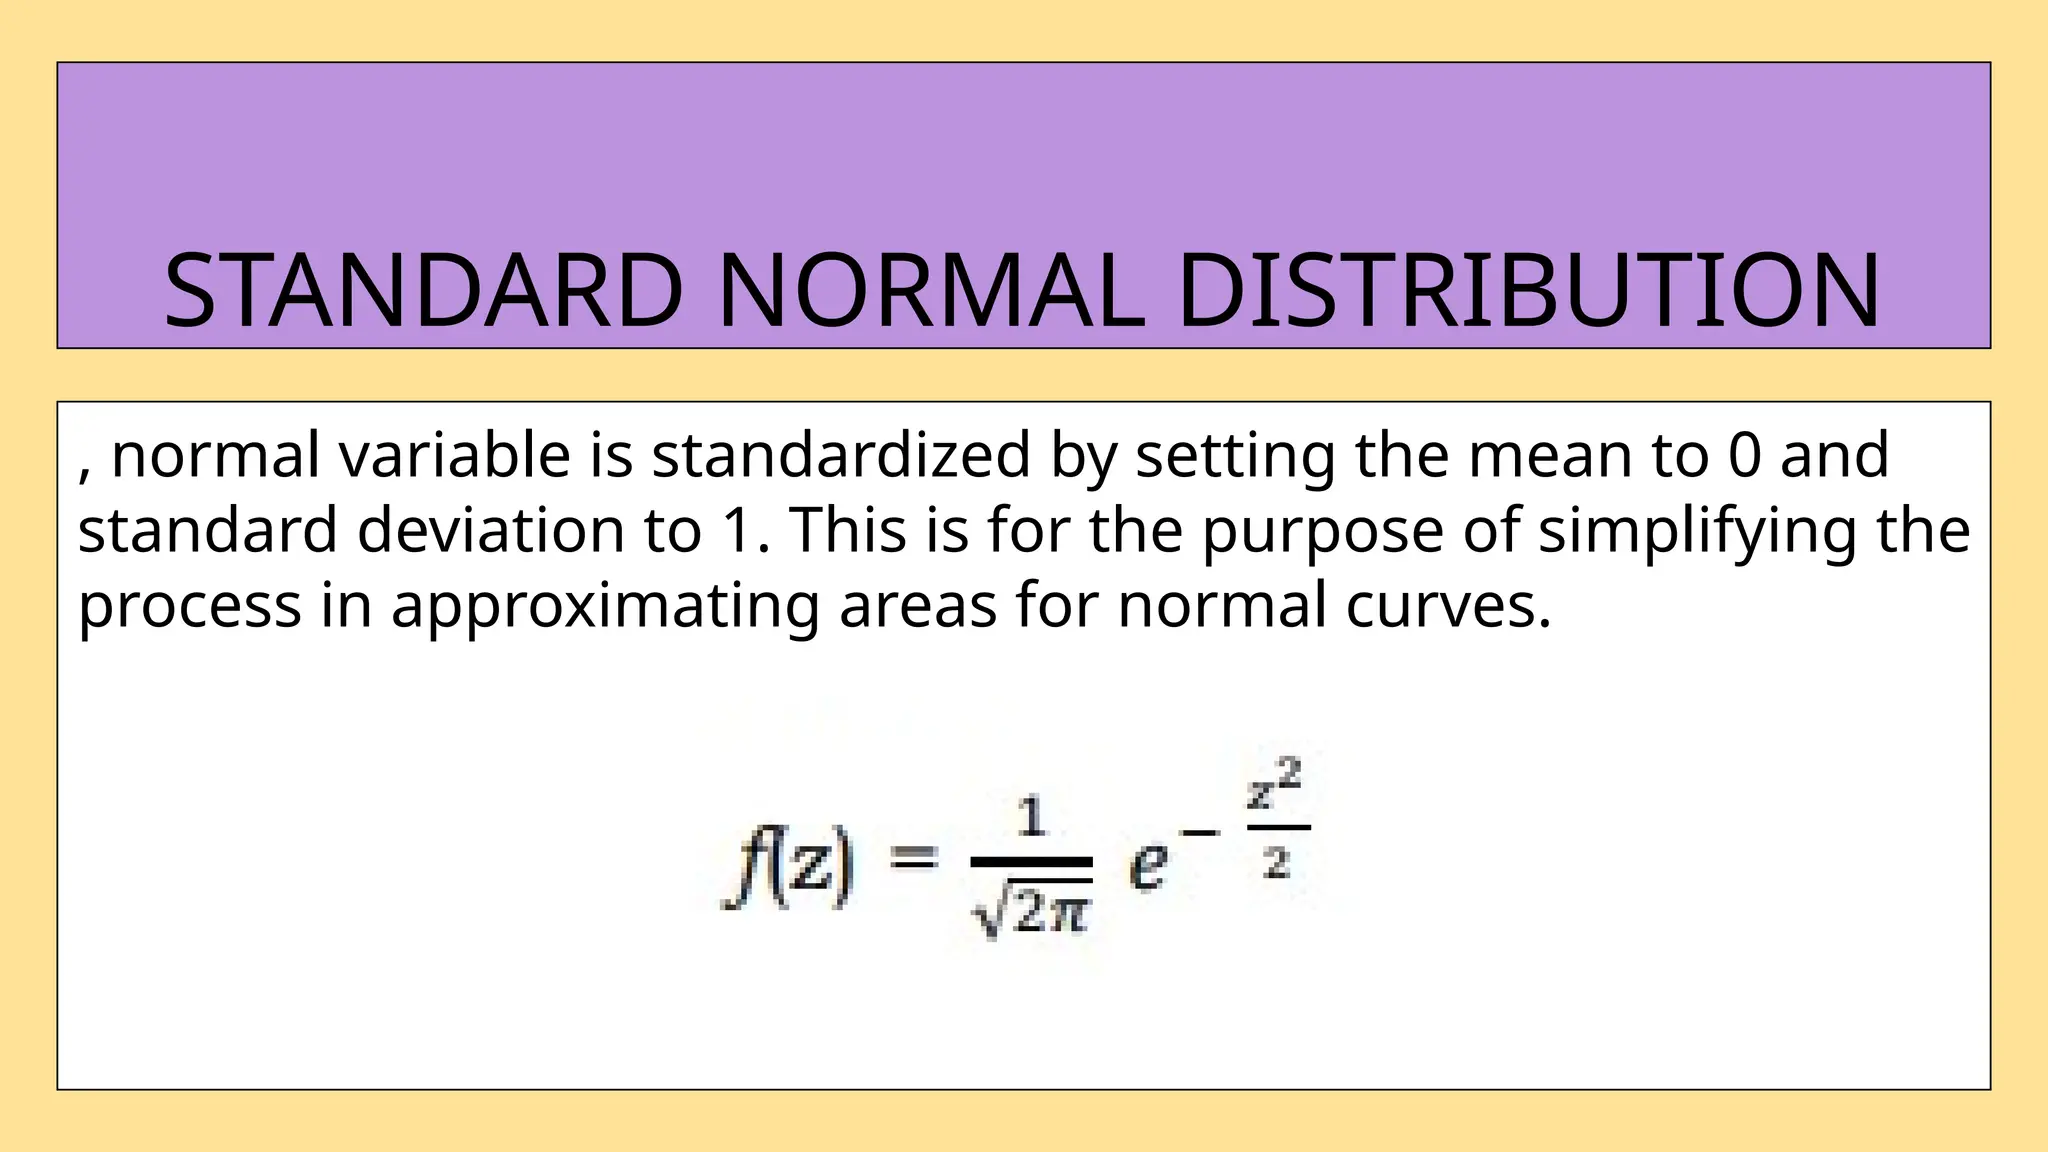
, normal variableis standardized by setting the mean to 0 and
standard deviation to 1. This is for the purpose of simplifying the
process in approximating areas for normal curves.
STANDARD NORMAL DISTRIBUTION
16.
The probability notationP(a < Z < b) indicates that the z-value is
between a and b, P(Z > a) means z-value is above a and P(Z < a)
means z-value is below a. It would not matter whether we are
considering P(Z < a) or P(Z a)
≤ or P(Z > a) or P(Z a)
≥
Find the area that corresponds to z
17.
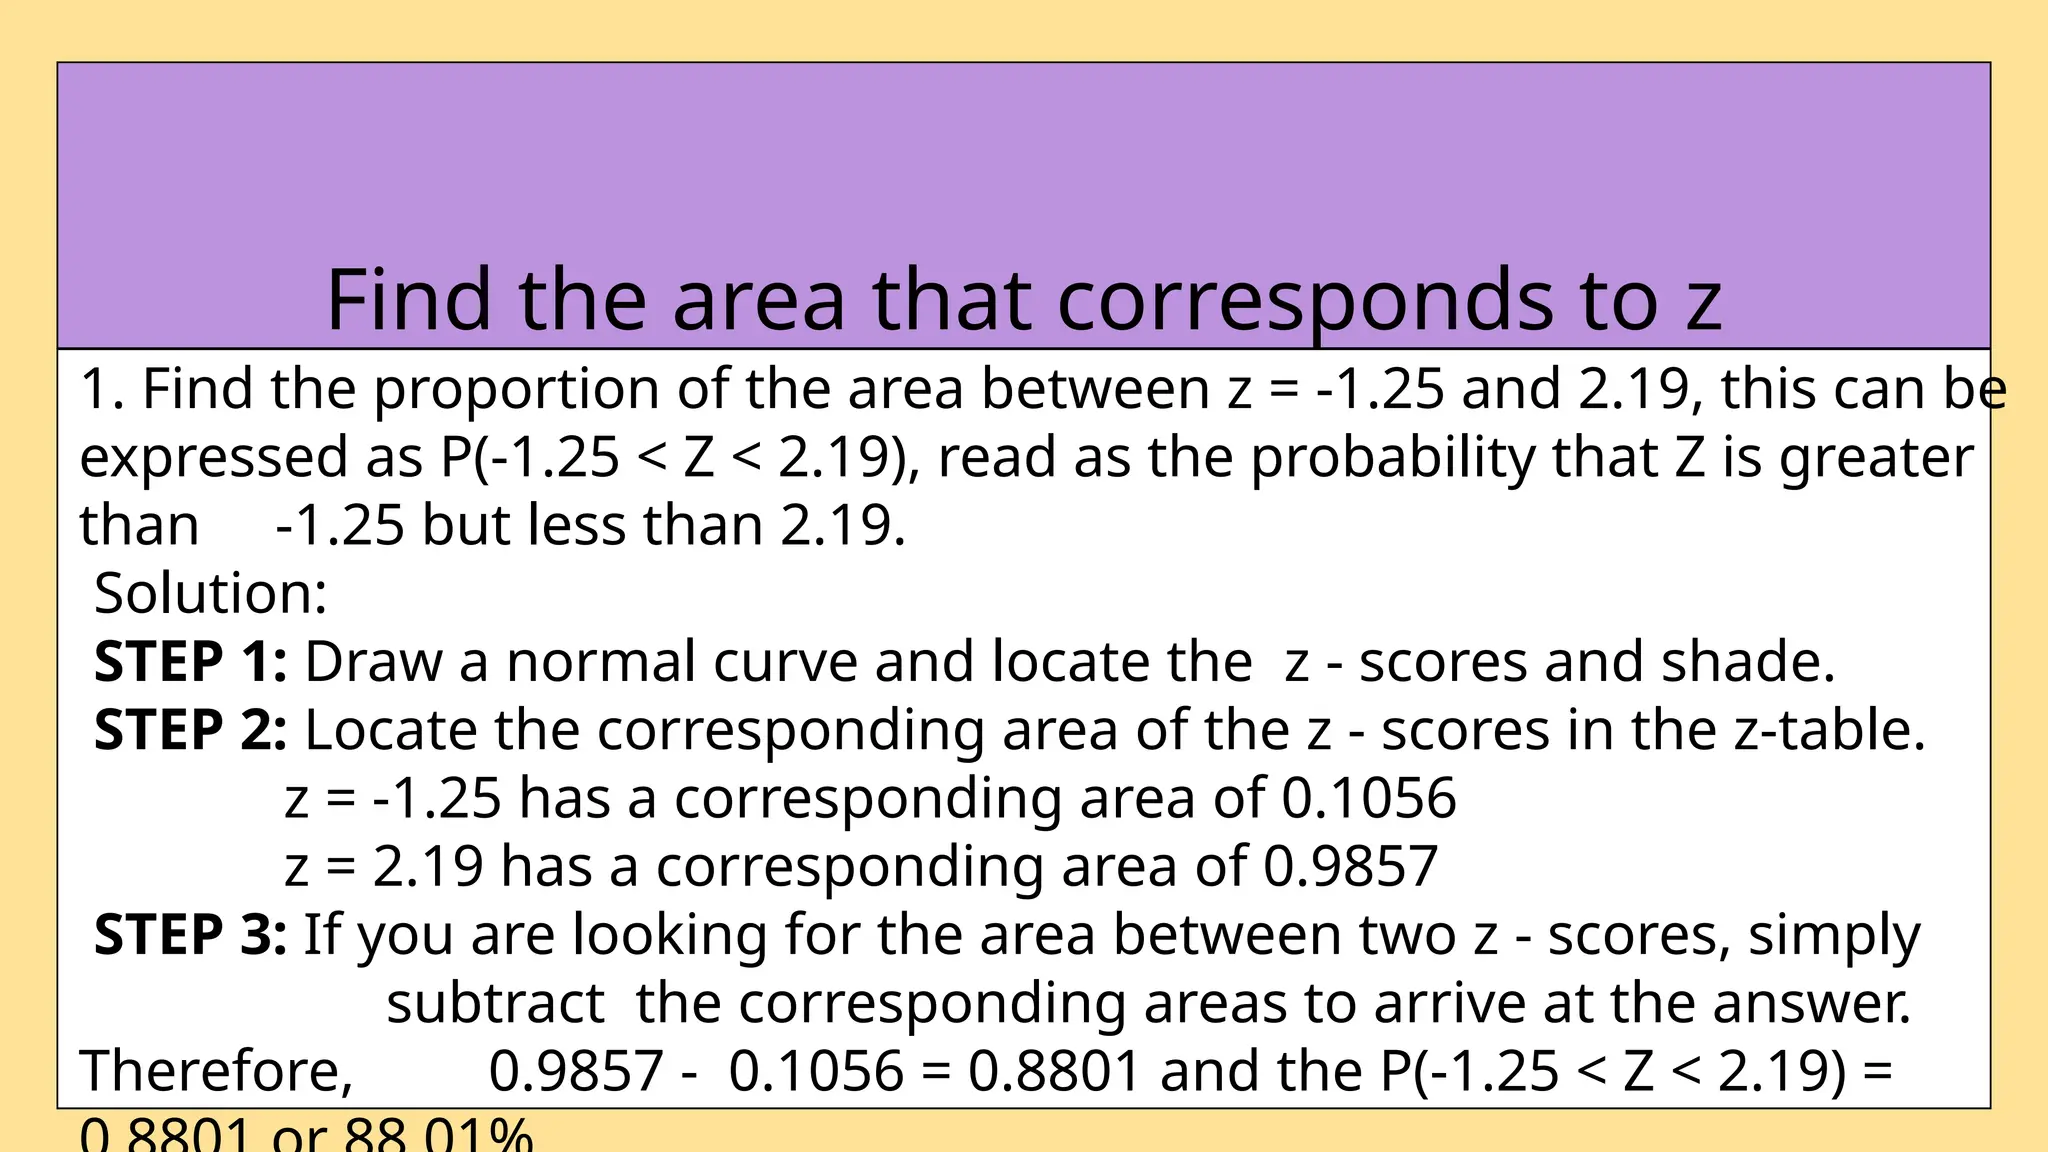
1. Find theproportion of the area between z = -1.25 and 2.19, this can be
expressed as P(-1.25 < Z < 2.19), read as the probability that Z is greater
than -1.25 but less than 2.19.
Solution:
STEP 1: Draw a normal curve and locate the z - scores and shade.
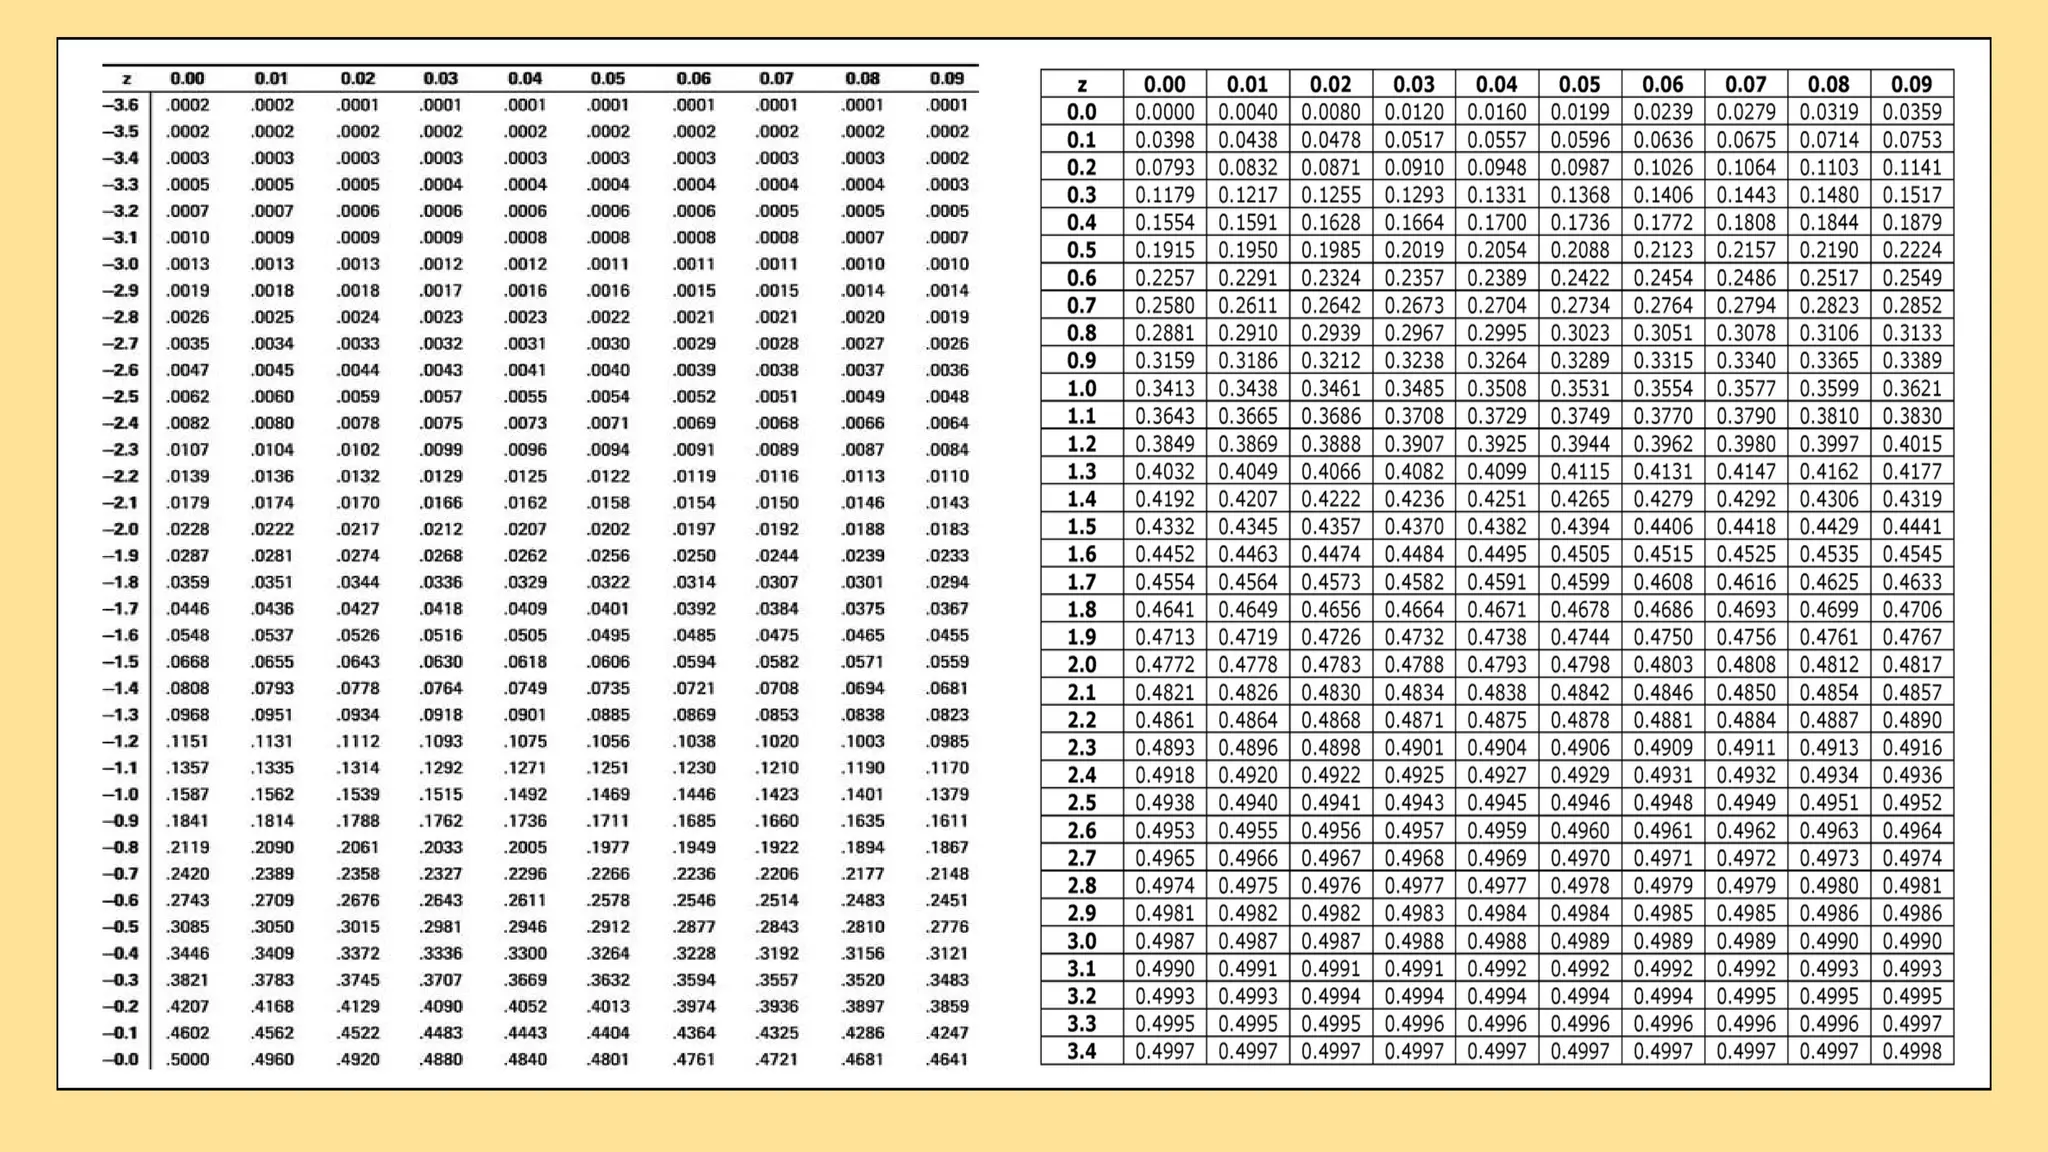
STEP 2: Locate the corresponding area of the z - scores in the z-table.
z = -1.25 has a corresponding area of 0.1056
z = 2.19 has a corresponding area of 0.9857
STEP 3: If you are looking for the area between two z - scores, simply
subtract the corresponding areas to arrive at the answer.
Therefore, 0.9857 - 0.1056 = 0.8801 and the P(-1.25 < Z < 2.19) =
Find the area that corresponds to z
18.
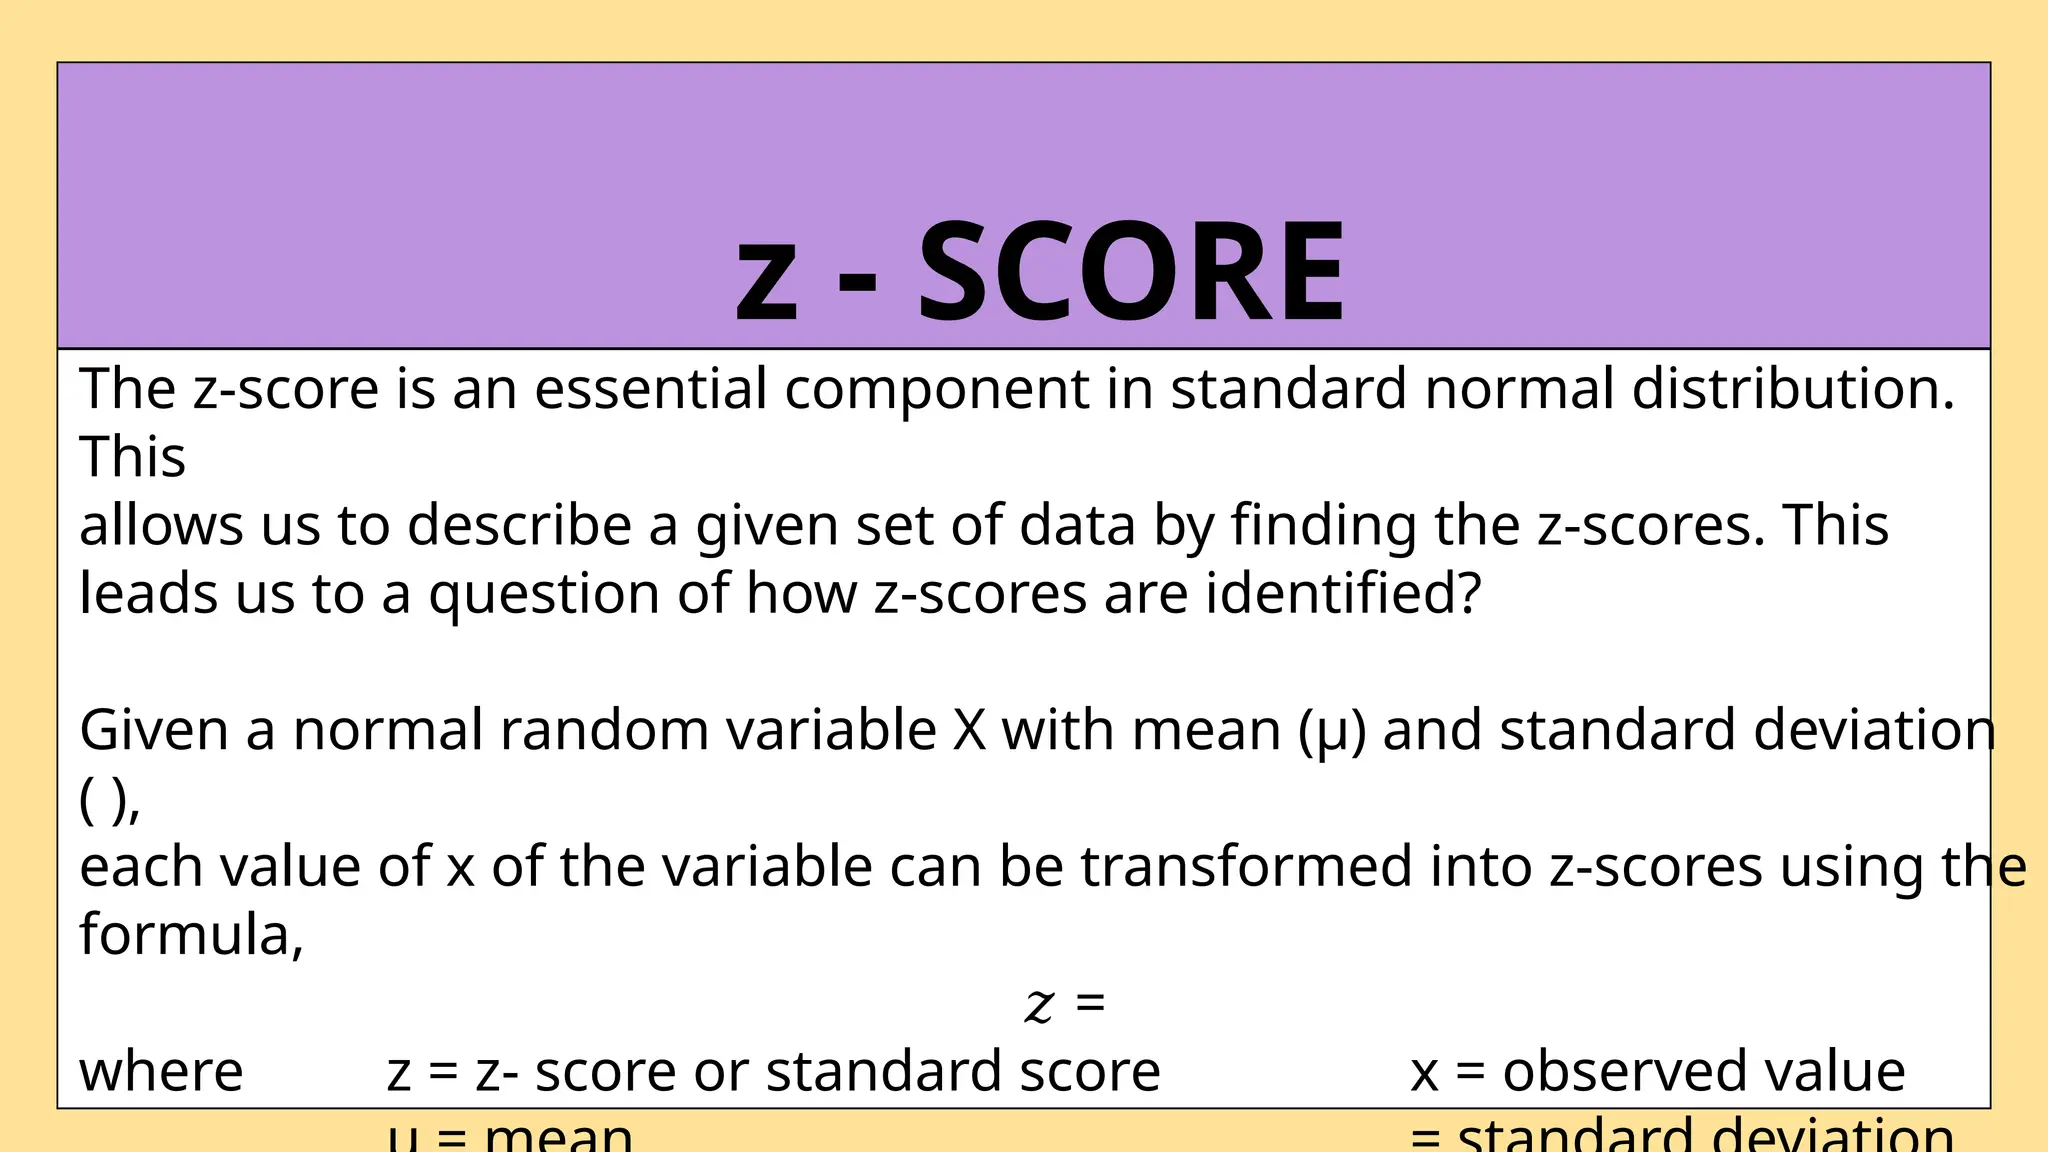
The z-score isan essential component in standard normal distribution.
This
allows us to describe a given set of data by finding the z-scores. This
leads us to a question of how z-scores are identified?
Given a normal random variable X with mean (µ) and standard deviation
( ),
each value of x of the variable can be transformed into z-scores using the
formula,
𝑧 =
where z = z- score or standard score x = observed value
z - SCORE
19.
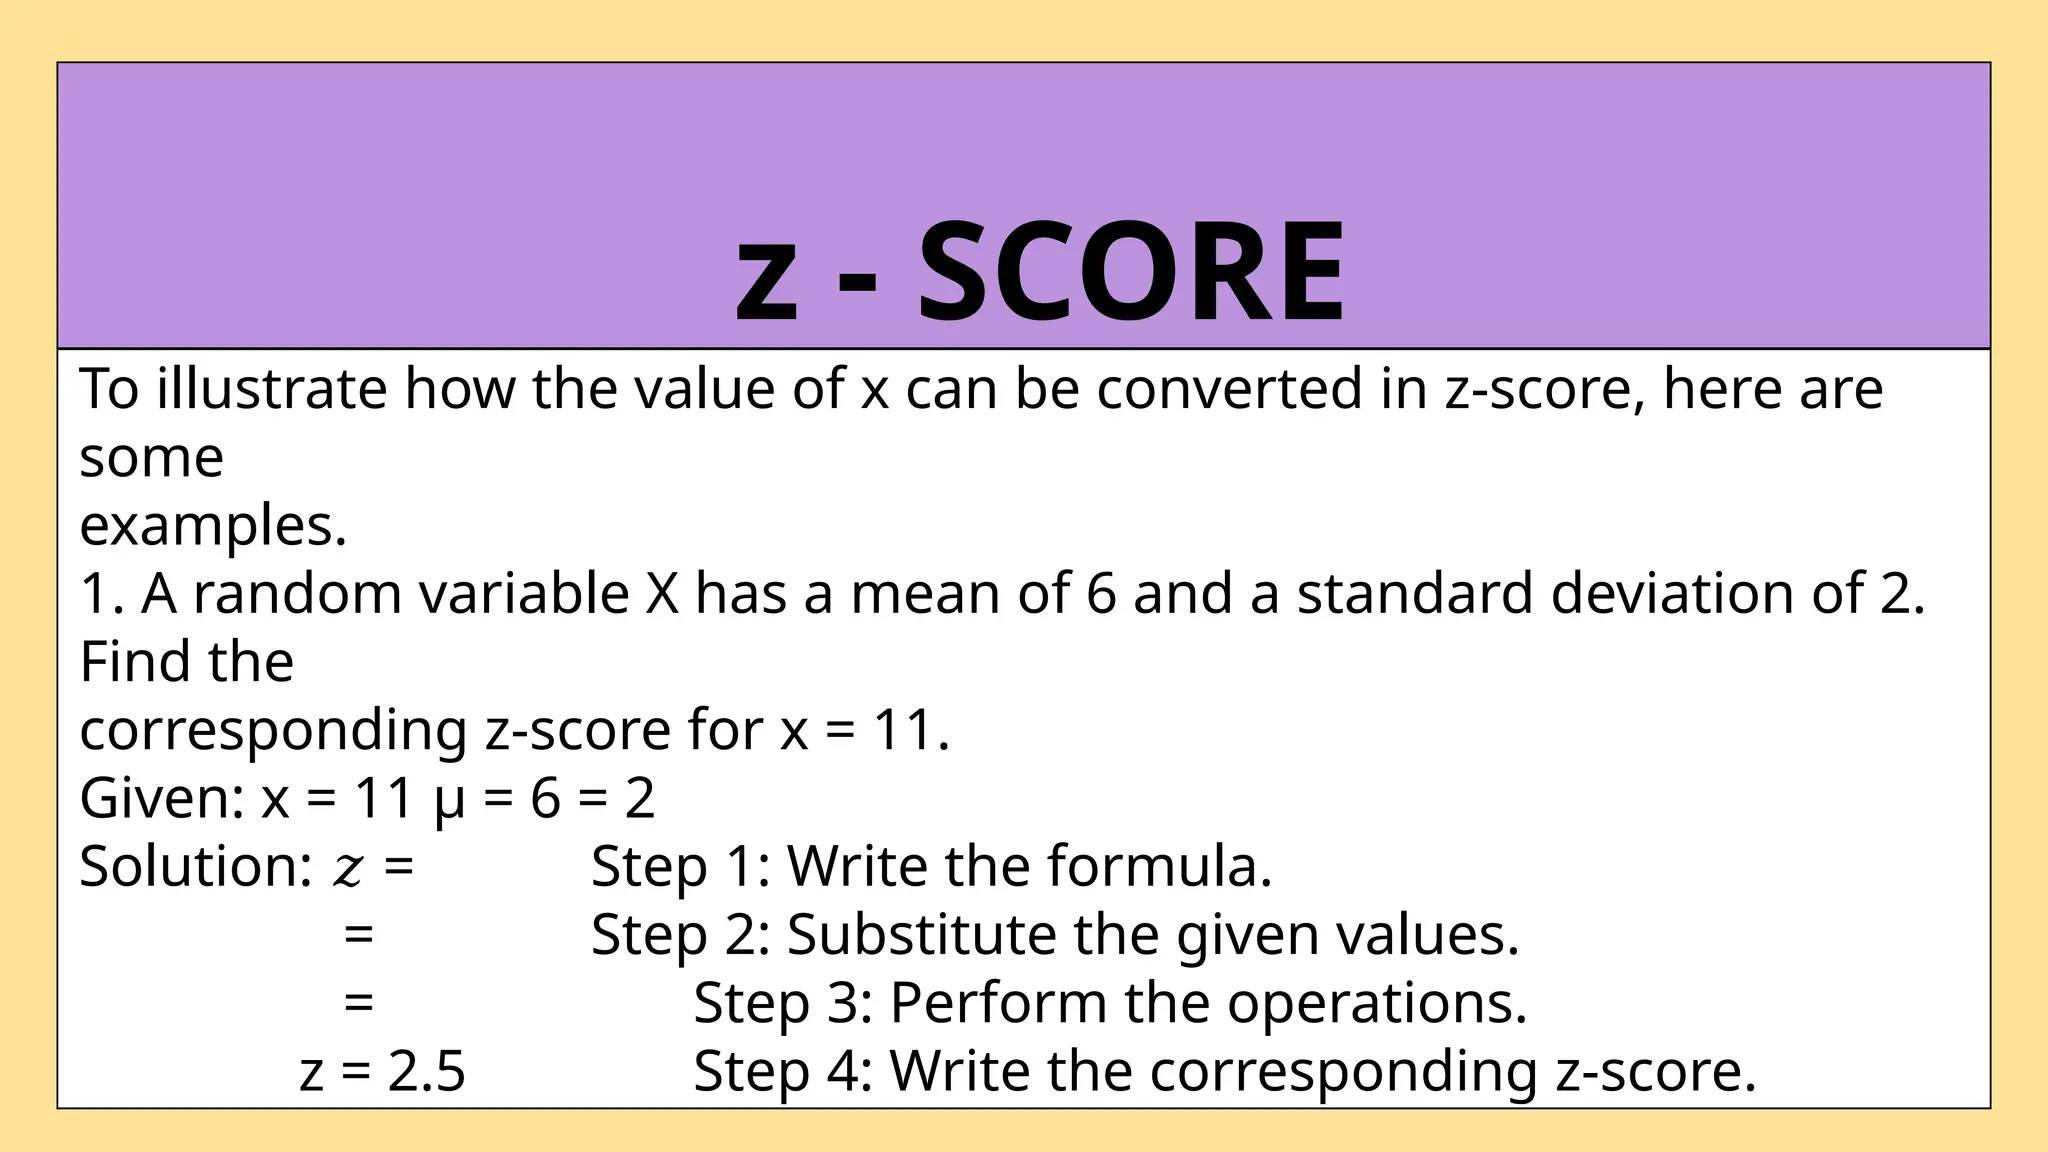
To illustrate howthe value of x can be converted in z-score, here are
some
examples.
1. A random variable X has a mean of 6 and a standard deviation of 2.
Find the
corresponding z-score for x = 11.
Given: x = 11 µ = 6 = 2
Solution: =
𝑧 Step 1: Write the formula.
= Step 2: Substitute the given values.
= Step 3: Perform the operations.
z = 2.5 Step 4: Write the corresponding z-score.
z - SCORE
20.
To illustrate howthe value of x can be converted in z-score, here are
some
examples.
2. The scores in the summative test of 11- STEM B are normally
distributed with a mean of 65 and a standard deviation of 12. Find the
probability that some students got a score below 40.
z - SCORE
21.
activity:
Compute the followingprobabilities using the standard
normal curve. Construct a curve then shade the region
corresponding to the area.
1. P(-1.65 < Z < 2.15)
2. P(-1.25 < Z < 2.19)

![NORMAL DISTRIBUTION FIN [Autosaved].pptx](https://cdn.slidesharecdn.com/ss_thumbnails/normaldistributionfinautosaved-250706062357-4c5756a9-thumbnail.jpg?width=640&height=640&fit=bounds)


