SlideShare a Scribd company logo
1 of 3
Case Study 4.2 Images

More Related Content

More from SERC at Carleton College

KSKL_Chapter 4_ Chem Properties of Soils.pptx
KSKL_Chapter 4_ Chem Properties of Soils.pptxKSKL_Chapter 4_ Chem Properties of Soils.pptx
KSKL_Chapter 4_ Chem Properties of Soils.pptx
SERC at Carleton College
 
StatVignette04_Distribution_v04_07_15_2020.pptx
StatVignette04_Distribution_v04_07_15_2020.pptxStatVignette04_Distribution_v04_07_15_2020.pptx
StatVignette04_Distribution_v04_07_15_2020.pptx
SERC at Carleton College
 
StatVignette01-Correlation_06_15_2020.pptx
StatVignette01-Correlation_06_15_2020.pptxStatVignette01-Correlation_06_15_2020.pptx
StatVignette01-Correlation_06_15_2020.pptx
SERC at Carleton College
 
Unit 1 Introduction to Flooding Presentation
Unit 1 Introduction to Flooding PresentationUnit 1 Introduction to Flooding Presentation
Unit 1 Introduction to Flooding Presentation
SERC at Carleton College
 

More from SERC at Carleton College (20)

StatVignette05_M3_v02_10_21_2020.pptx
StatVignette05_M3_v02_10_21_2020.pptxStatVignette05_M3_v02_10_21_2020.pptx
StatVignette05_M3_v02_10_21_2020.pptx
 
KSKL chapter 8 PPT
KSKL chapter 8 PPTKSKL chapter 8 PPT
KSKL chapter 8 PPT
 
KSKL chap 5 PPT
KSKL chap 5 PPTKSKL chap 5 PPT
KSKL chap 5 PPT
 
KSKL_Chapter 4_ Chem Properties of Soils.pptx
KSKL_Chapter 4_ Chem Properties of Soils.pptxKSKL_Chapter 4_ Chem Properties of Soils.pptx
KSKL_Chapter 4_ Chem Properties of Soils.pptx
 
Degraded Soil Images.pptx
Degraded Soil Images.pptxDegraded Soil Images.pptx
Degraded Soil Images.pptx
 
Educators PPT file chapter 7
Educators PPT file chapter 7Educators PPT file chapter 7
Educators PPT file chapter 7
 
Educators PPT file chapter 2
Educators PPT file chapter 2Educators PPT file chapter 2
Educators PPT file chapter 2
 
Educators PPT file chapter 6
Educators PPT file chapter 6Educators PPT file chapter 6
Educators PPT file chapter 6
 
Educators PPT chapter 3
Educators PPT chapter 3Educators PPT chapter 3
Educators PPT chapter 3
 
Unit 4 background presentation
Unit 4 background presentationUnit 4 background presentation
Unit 4 background presentation
 
Presentation: Unit 3 background information
Presentation: Unit 3 background informationPresentation: Unit 3 background information
Presentation: Unit 3 background information
 
Presentation: Unit 2 Measuring Groundwater Background Information
Presentation: Unit 2 Measuring Groundwater Background InformationPresentation: Unit 2 Measuring Groundwater Background Information
Presentation: Unit 2 Measuring Groundwater Background Information
 
Introduction to GPS presentation
Introduction to GPS presentationIntroduction to GPS presentation
Introduction to GPS presentation
 
StatVignette04_Distribution_v04_07_15_2020.pptx
StatVignette04_Distribution_v04_07_15_2020.pptxStatVignette04_Distribution_v04_07_15_2020.pptx
StatVignette04_Distribution_v04_07_15_2020.pptx
 
StatVignette02-Regression.pptx
StatVignette02-Regression.pptxStatVignette02-Regression.pptx
StatVignette02-Regression.pptx
 
StatVignette01-Correlation_06_15_2020.pptx
StatVignette01-Correlation_06_15_2020.pptxStatVignette01-Correlation_06_15_2020.pptx
StatVignette01-Correlation_06_15_2020.pptx
 
Unit 1 Introduction to Flooding Presentation
Unit 1 Introduction to Flooding PresentationUnit 1 Introduction to Flooding Presentation
Unit 1 Introduction to Flooding Presentation
 
GETSI Powerpoint Template
GETSI Powerpoint TemplateGETSI Powerpoint Template
GETSI Powerpoint Template
 
Early Career 2020 Participants
Early Career 2020 ParticipantsEarly Career 2020 Participants
Early Career 2020 Participants
 
B_7_20_EER_Participant_Aha_Quotes.pptx
B_7_20_EER_Participant_Aha_Quotes.pptxB_7_20_EER_Participant_Aha_Quotes.pptx
B_7_20_EER_Participant_Aha_Quotes.pptx
 

Editor's Notes

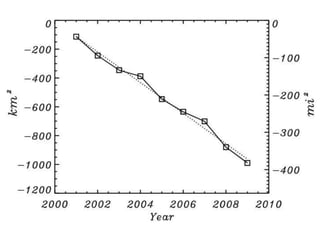
  1. Area change in Greenland marine terminating outlet glaciers, 2001-2009. Data from Byrd Polar Research Center.
  2. Area changes from 2000-2010 for Greenland’s top 5 losing marine terminating outlet glaciers. Data from Byrd Polar Research Center.
  3. Area change in Greenland marine terminating outlet glaciers, 2010 update. Data have been provided for 2010 including the Petermann Glacier and excluding the Petermann Glacier. Data from Byrd Polar Research Center.