Download as PDF, PPTX

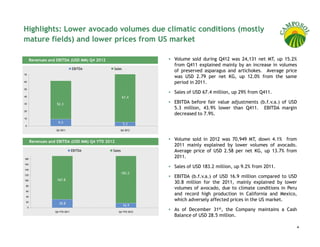

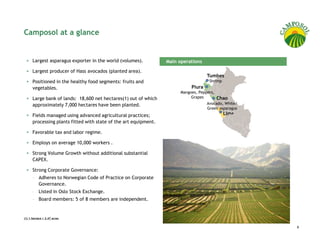
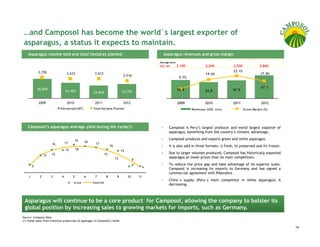
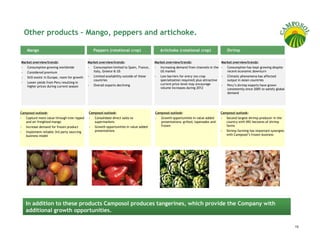
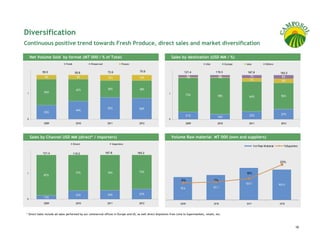
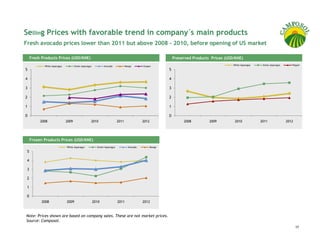

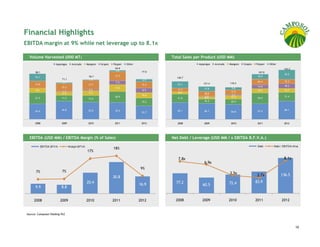
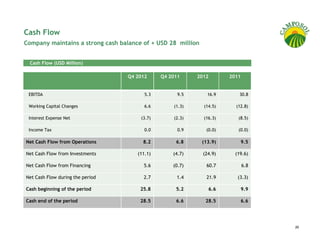
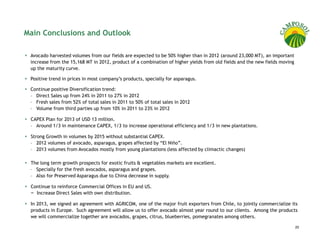
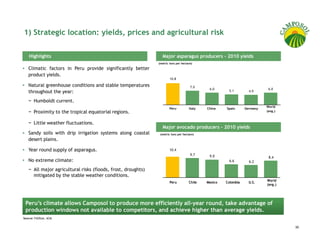
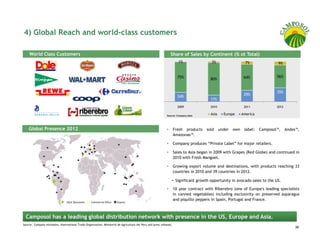
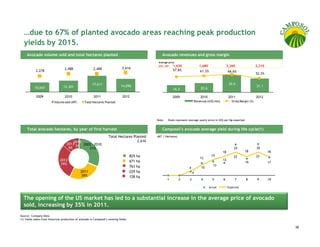

Camposol is the world's largest asparagus exporter, with strong financial results for Q4 and full-year 2012, despite lower avocado volumes due to adverse climatic conditions. The company reported increased sales of preserved asparagus and artichokes, while facing challenges in avocado pricing and production. Camposol is well-positioned to capitalize on rising global demand for avocados and grapes, leveraging its advanced agricultural practices and strong yield potential.


