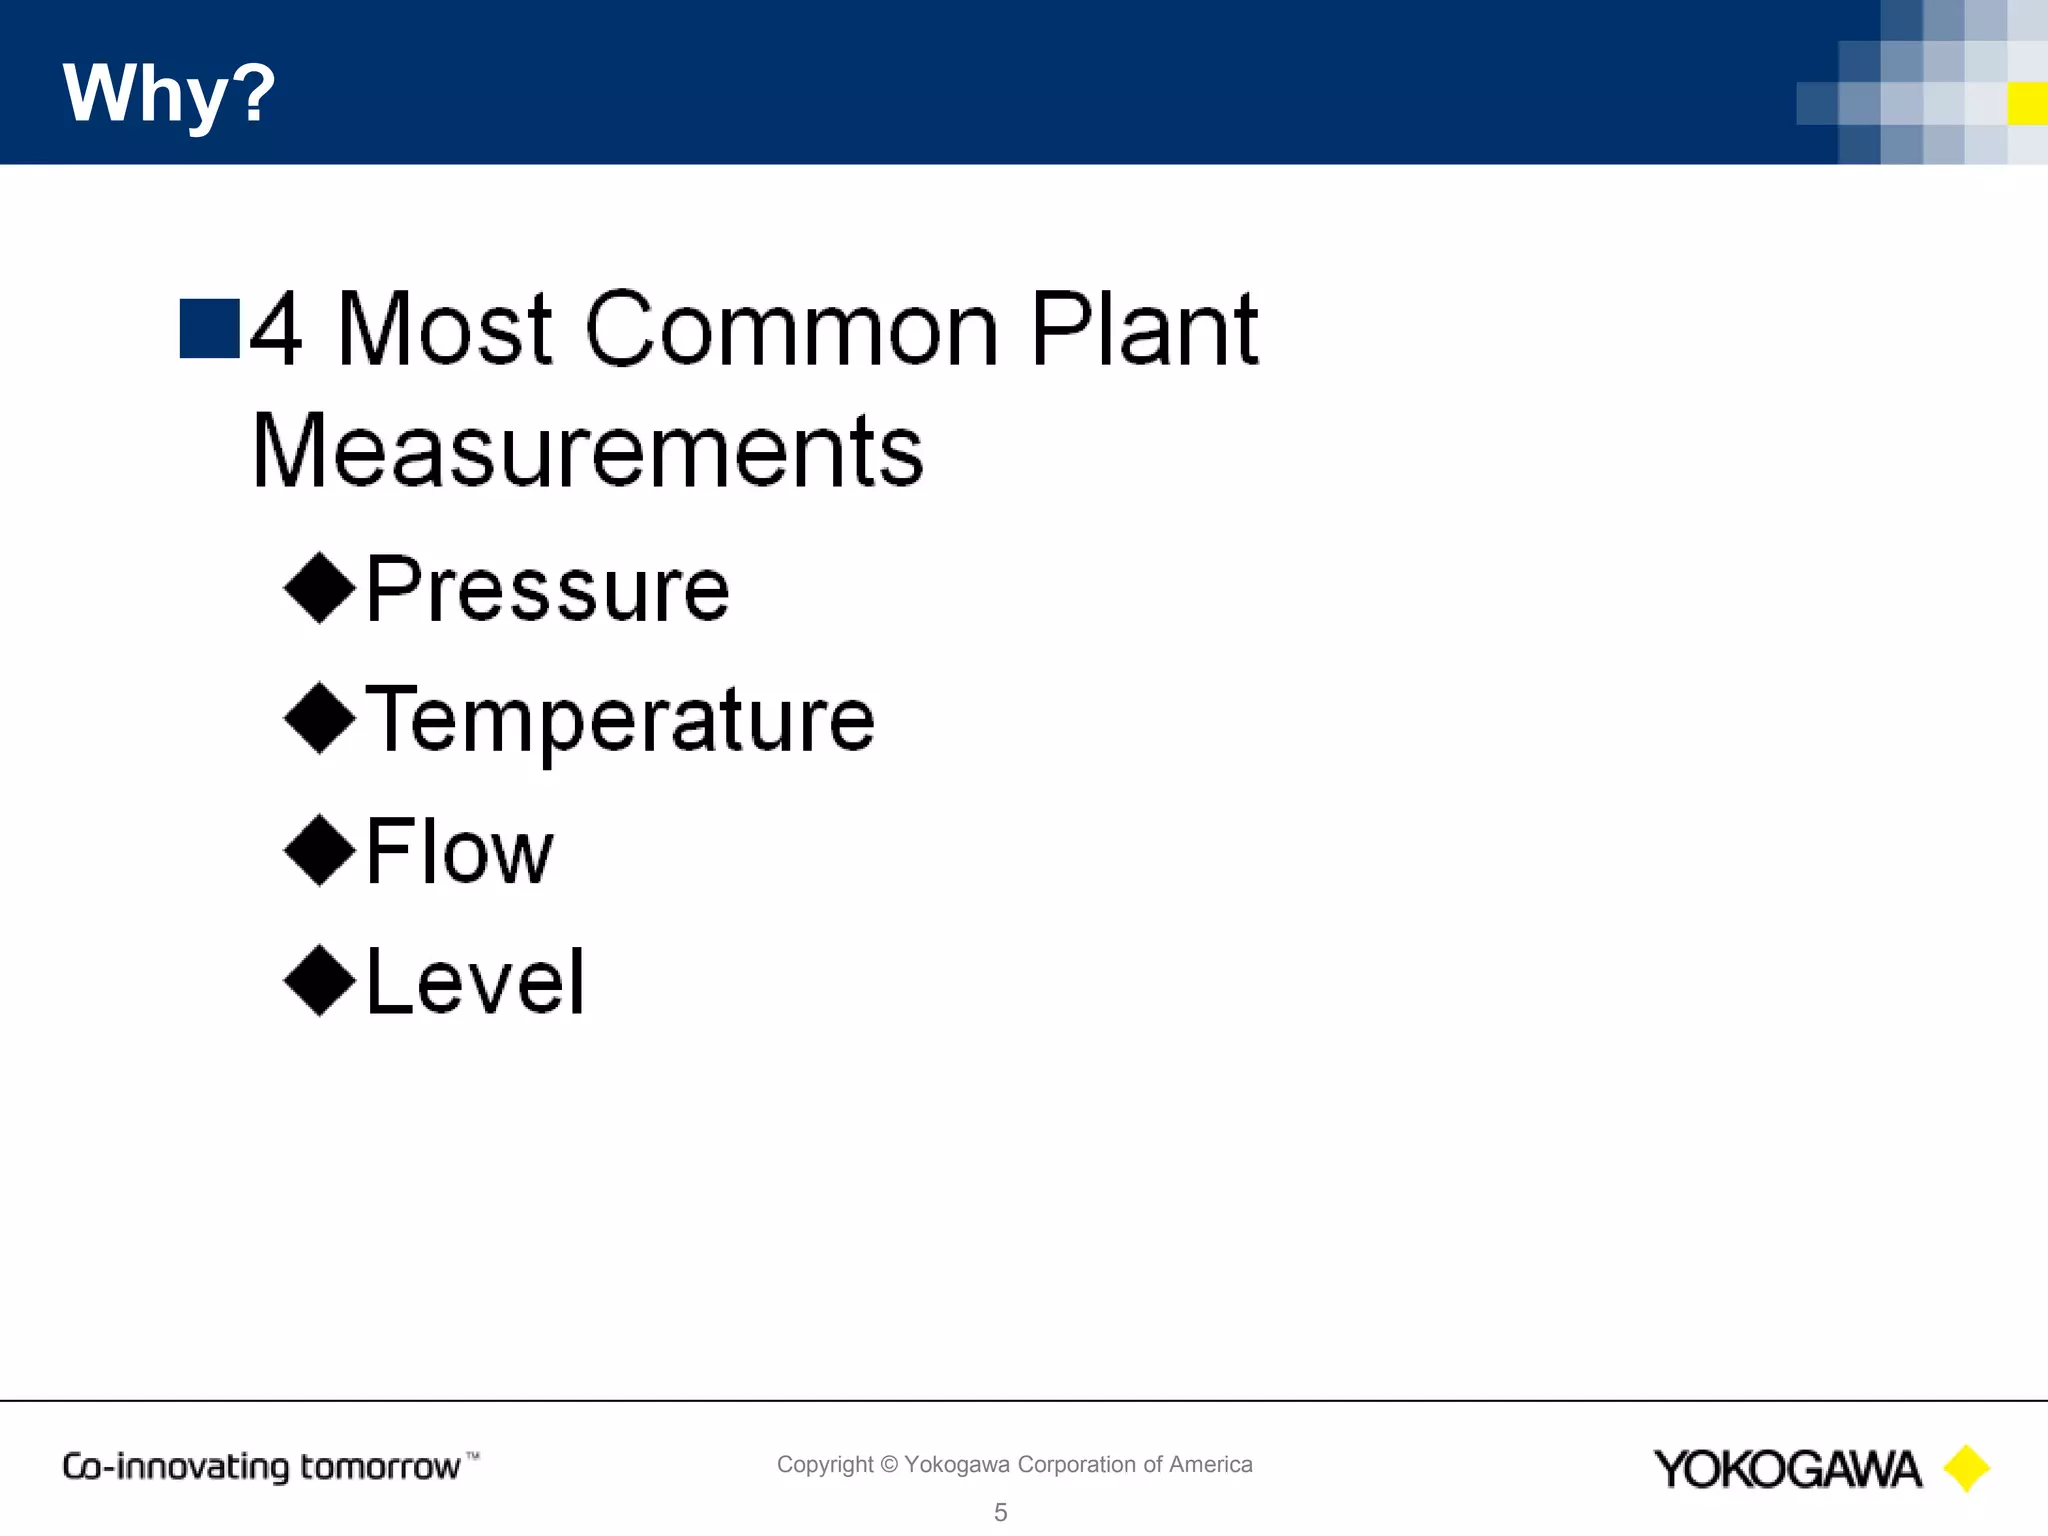
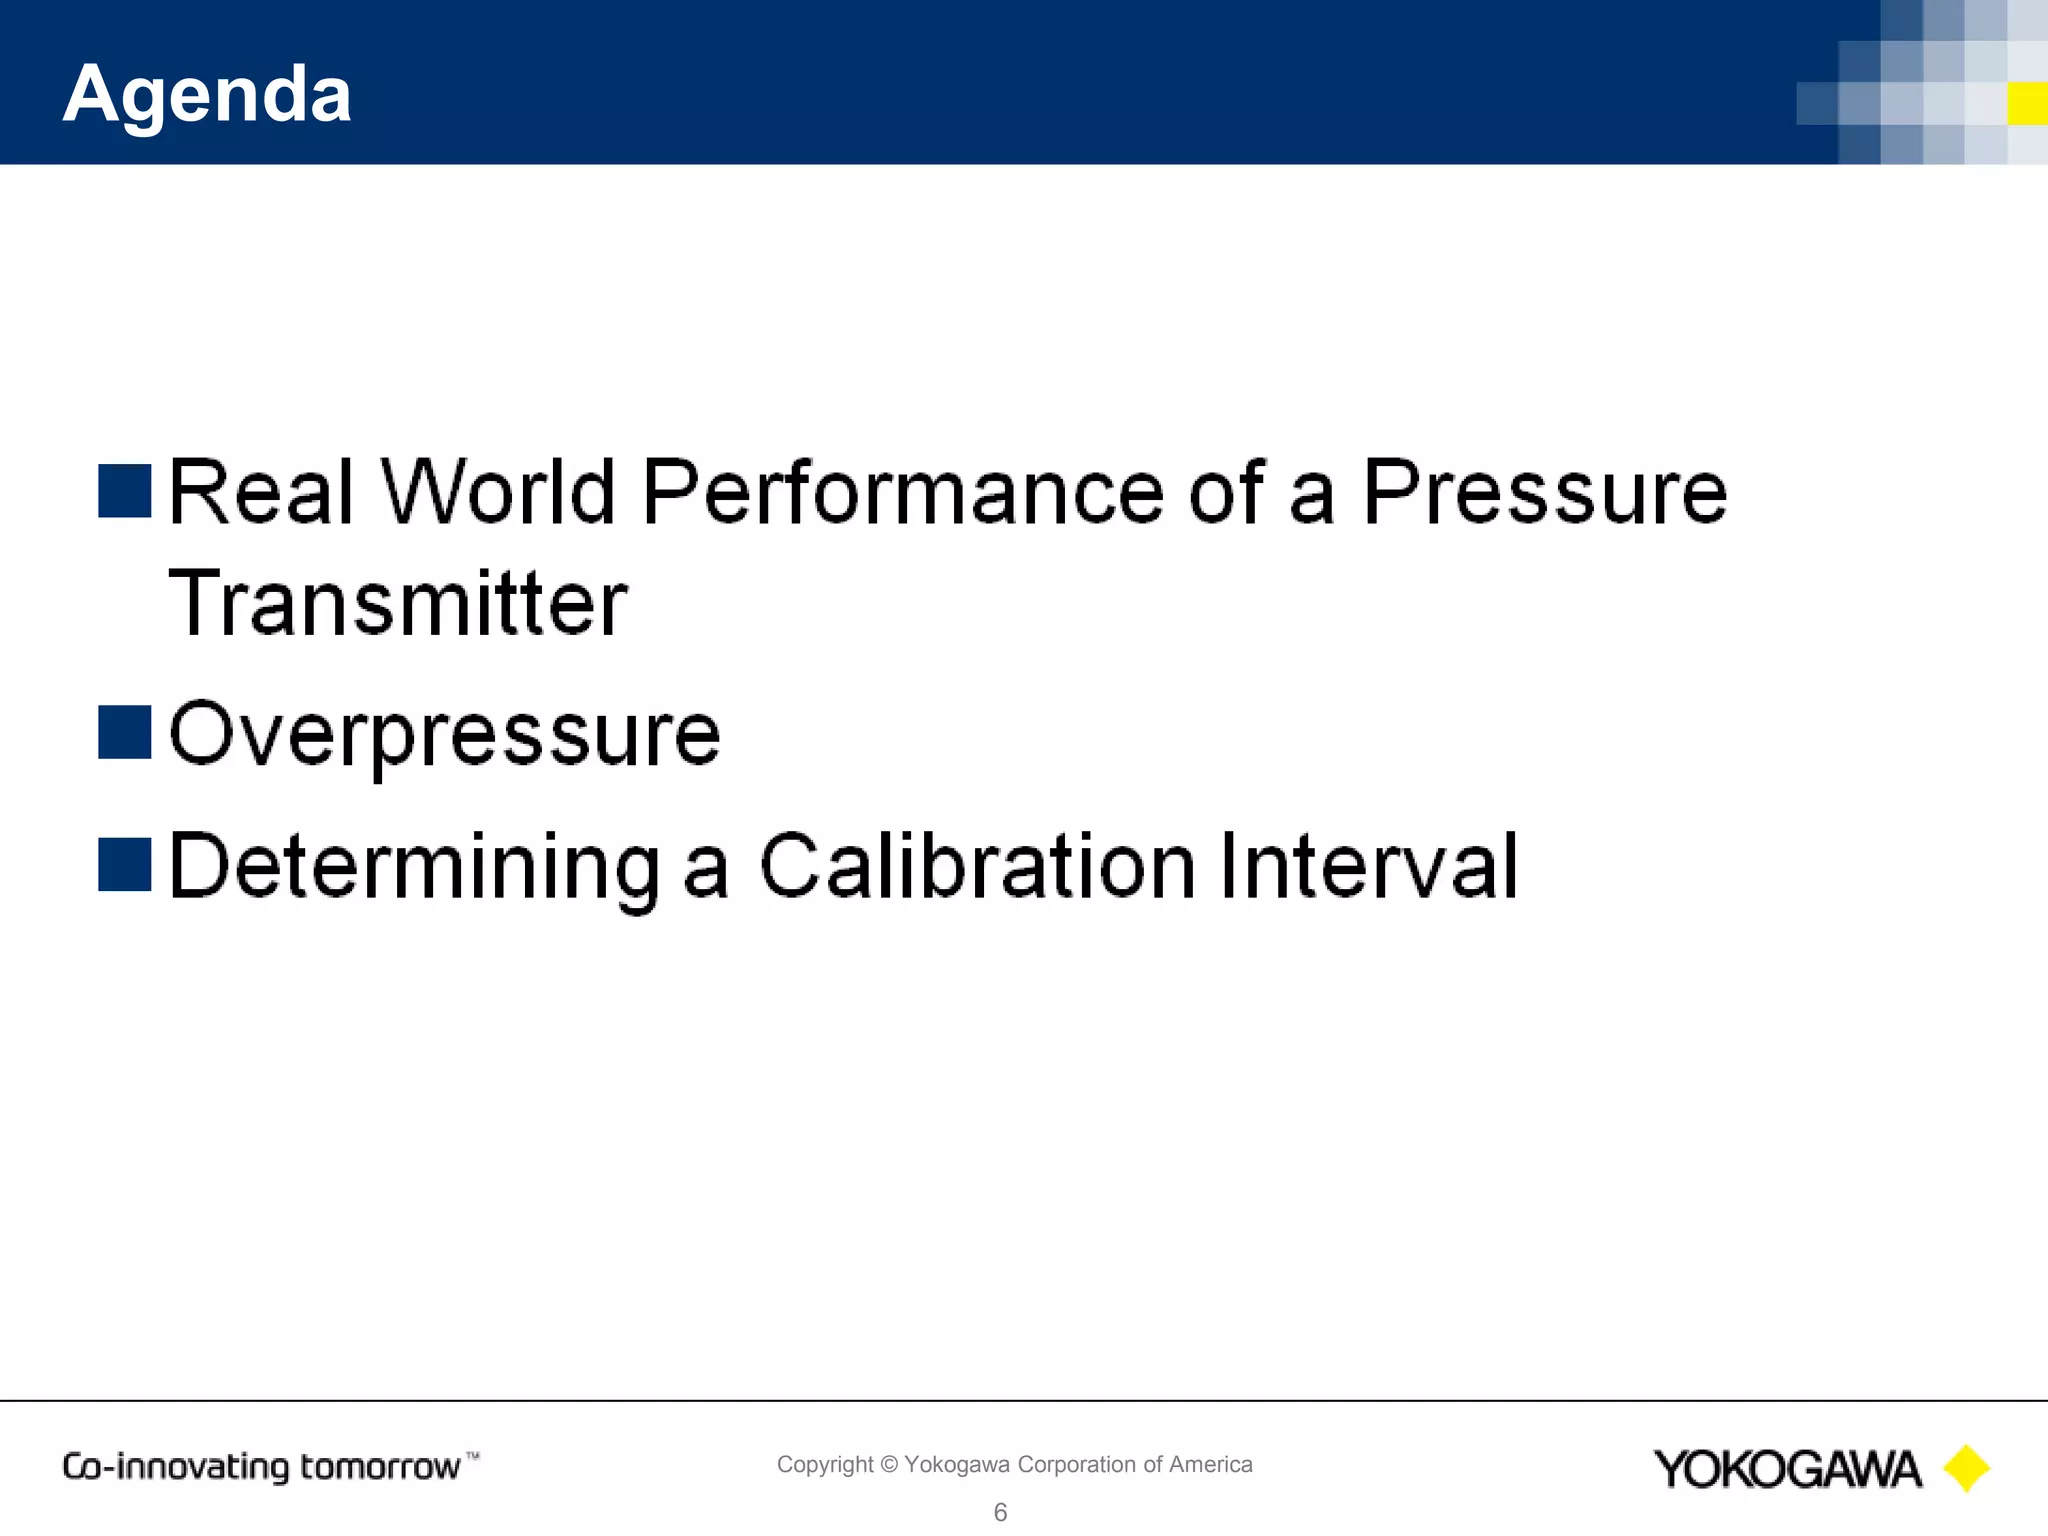
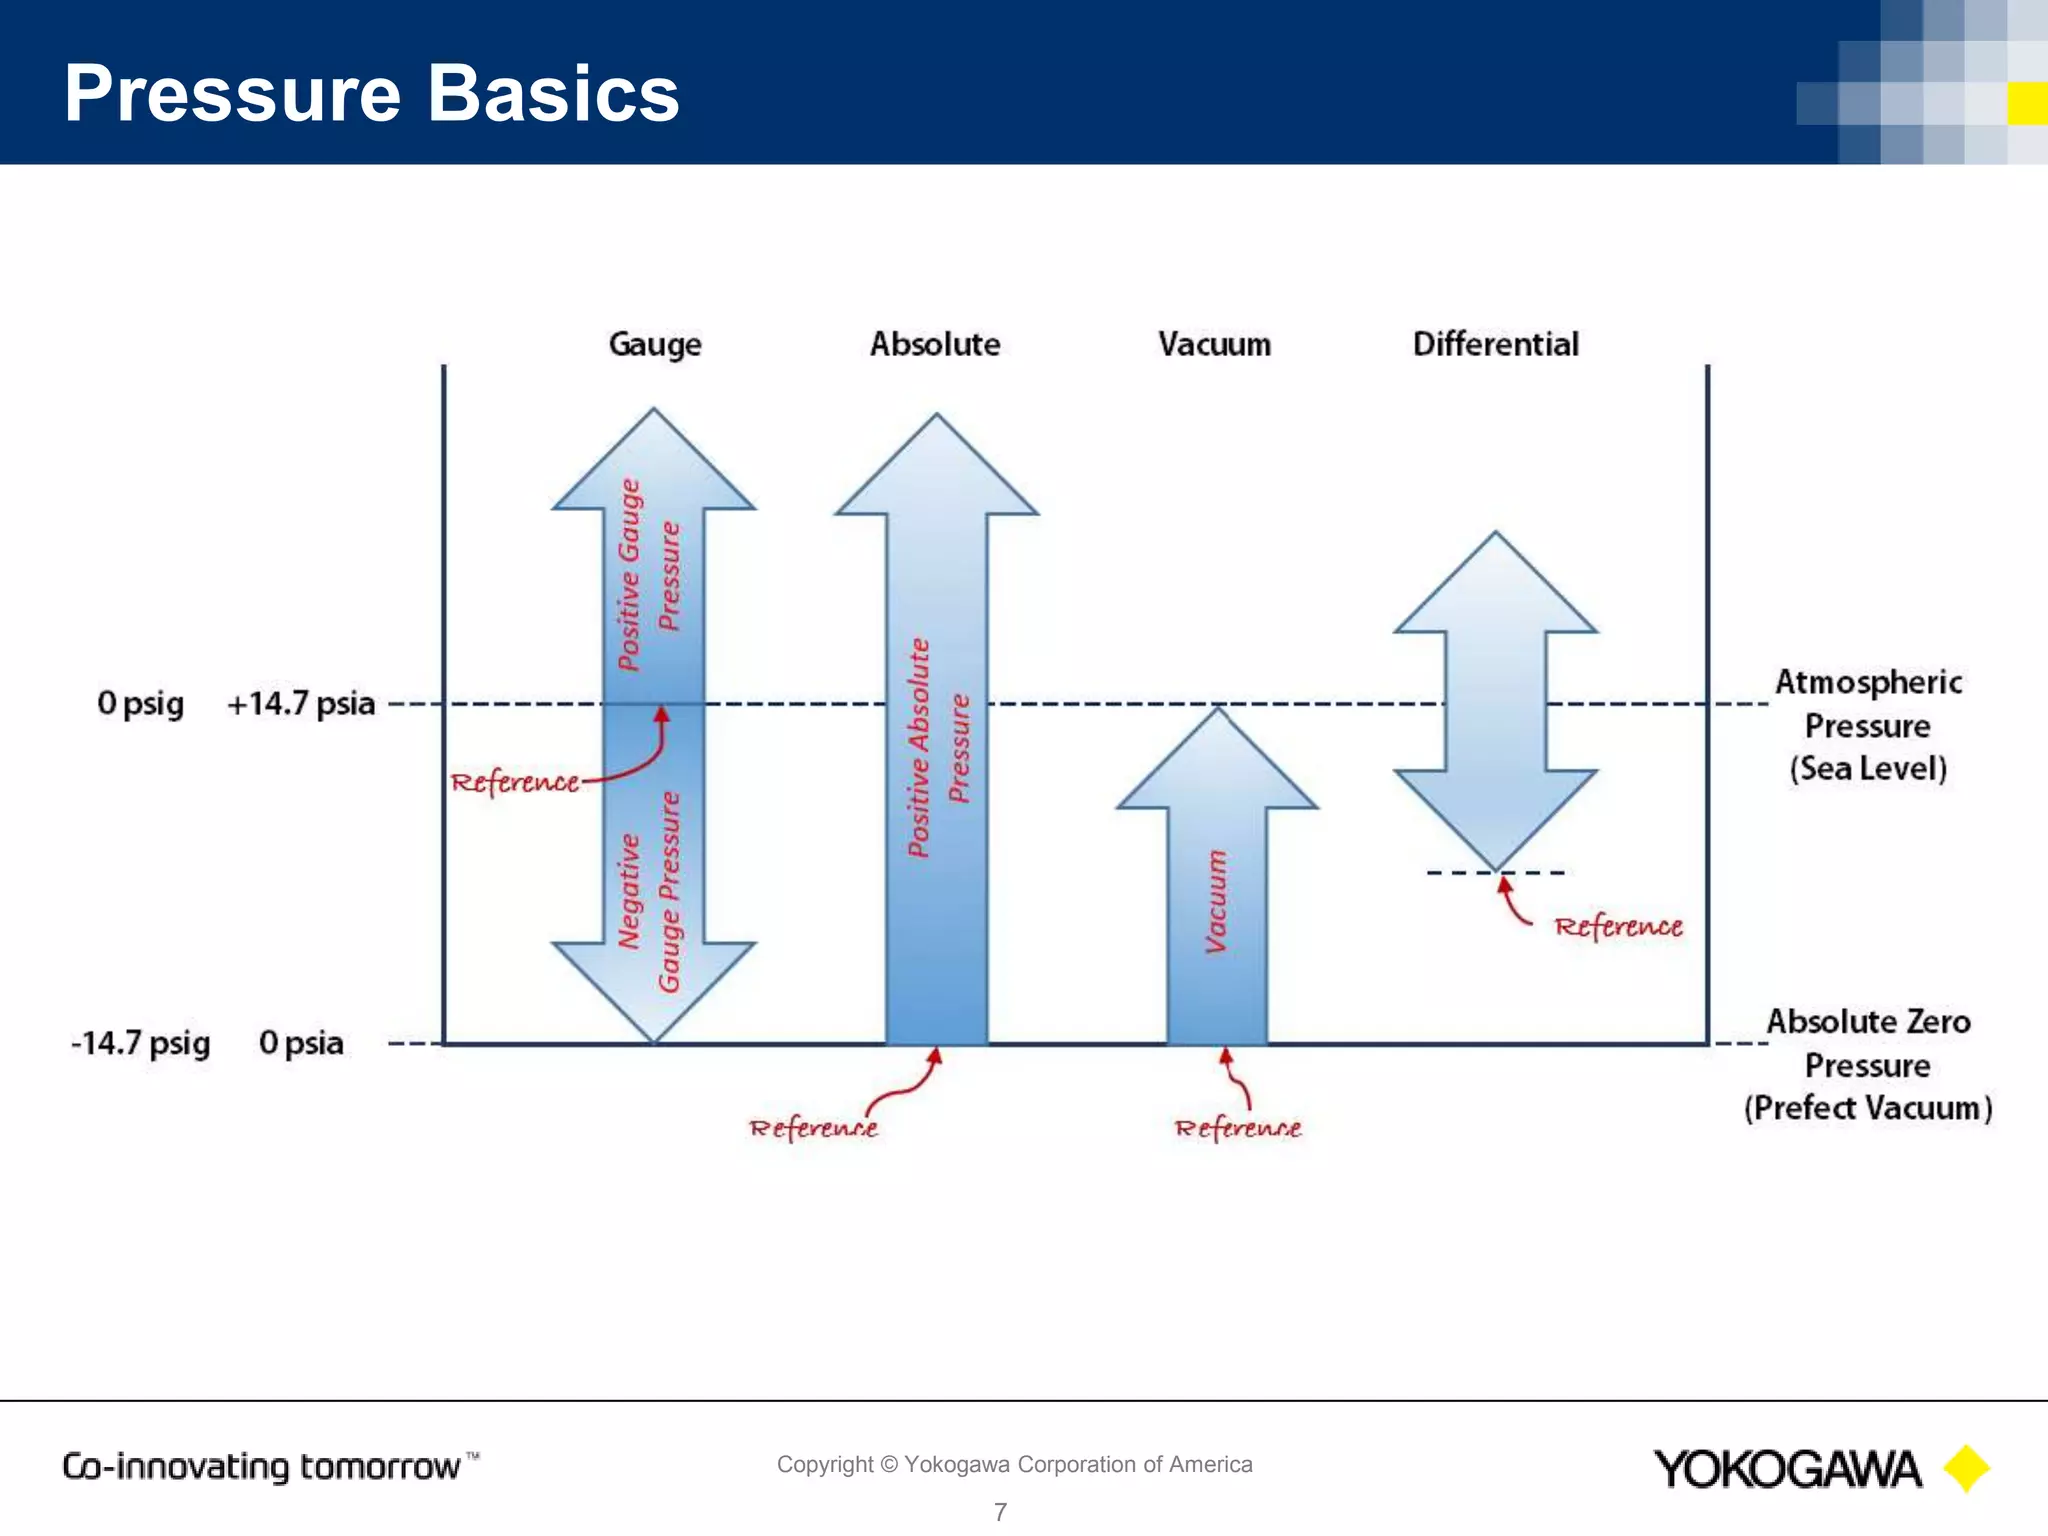
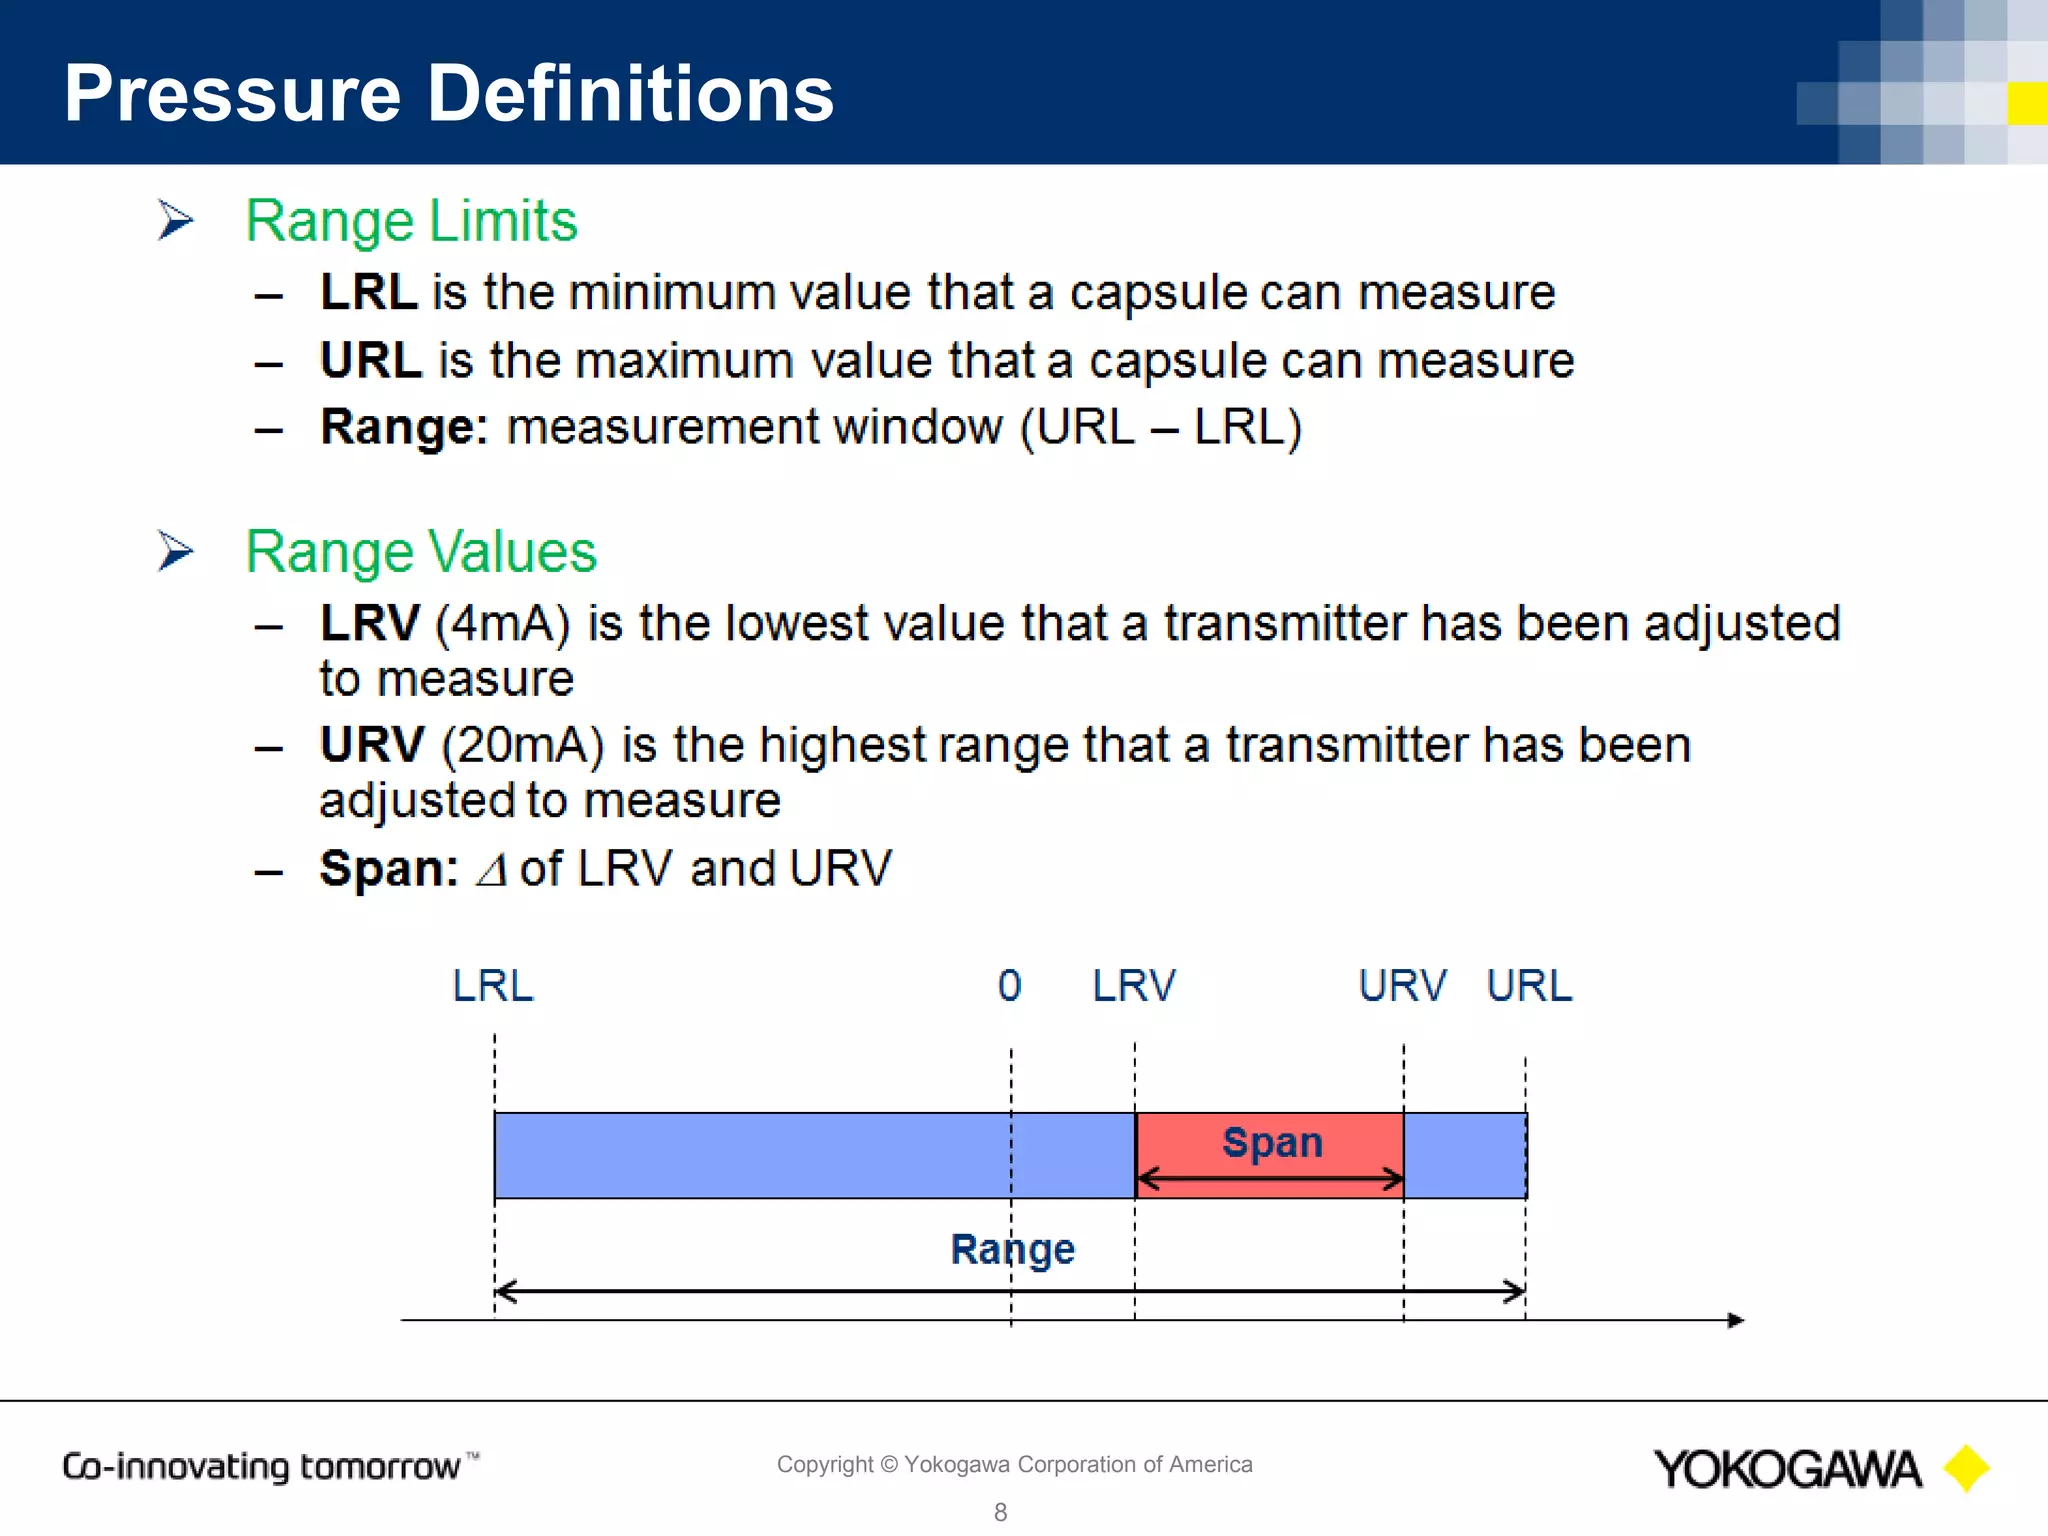
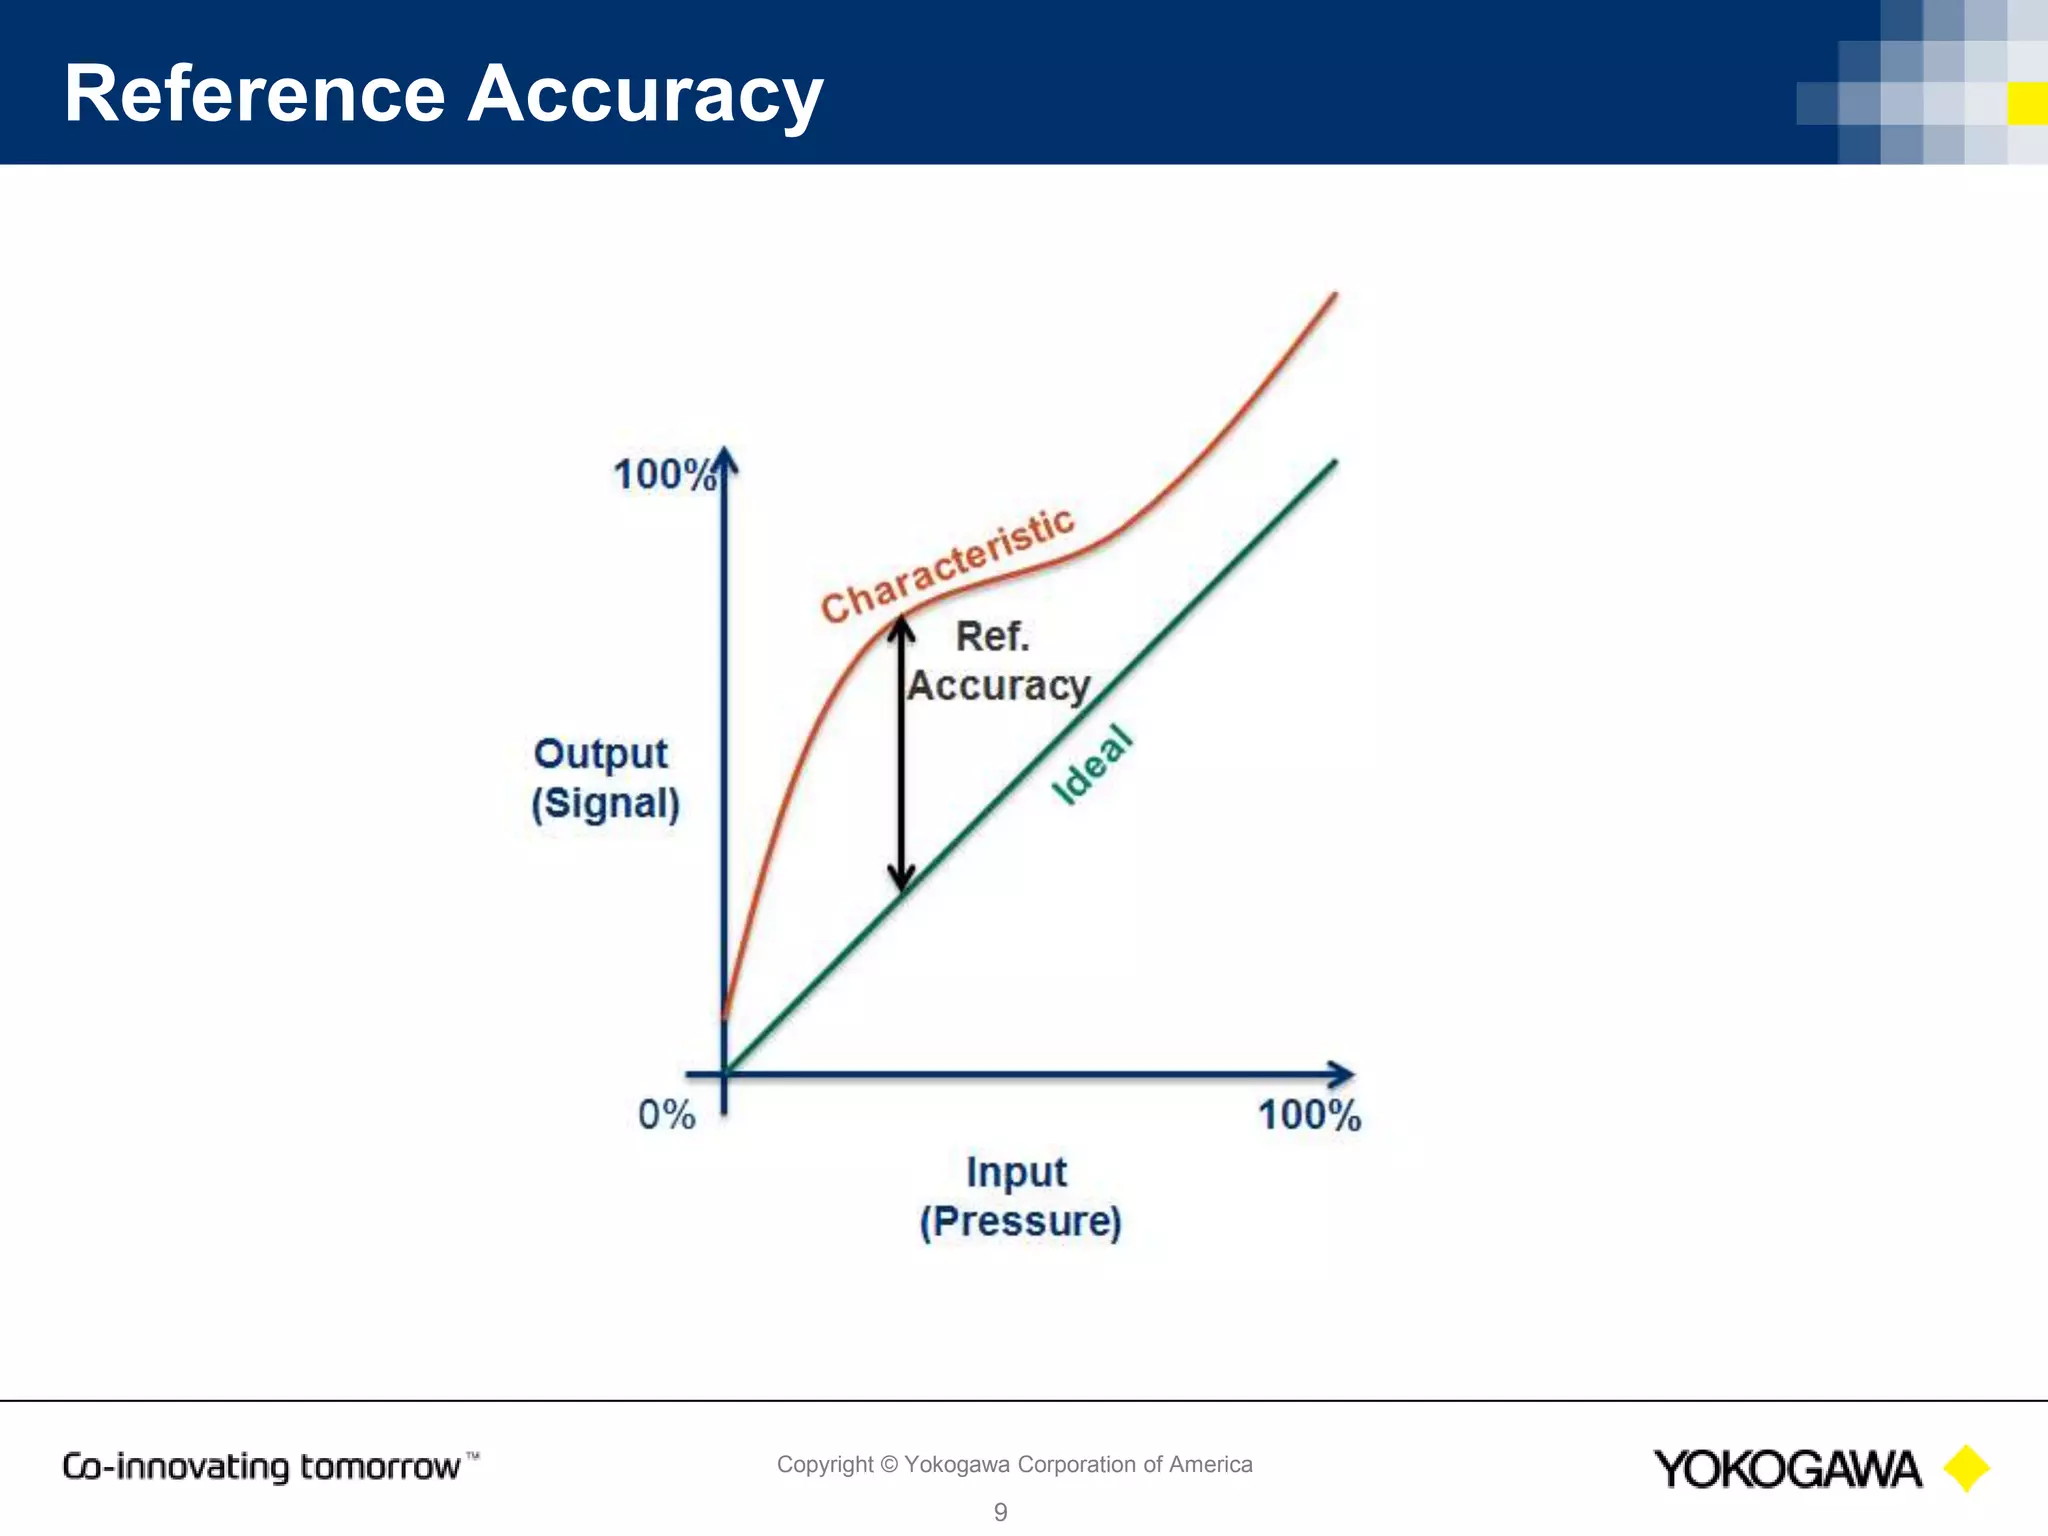
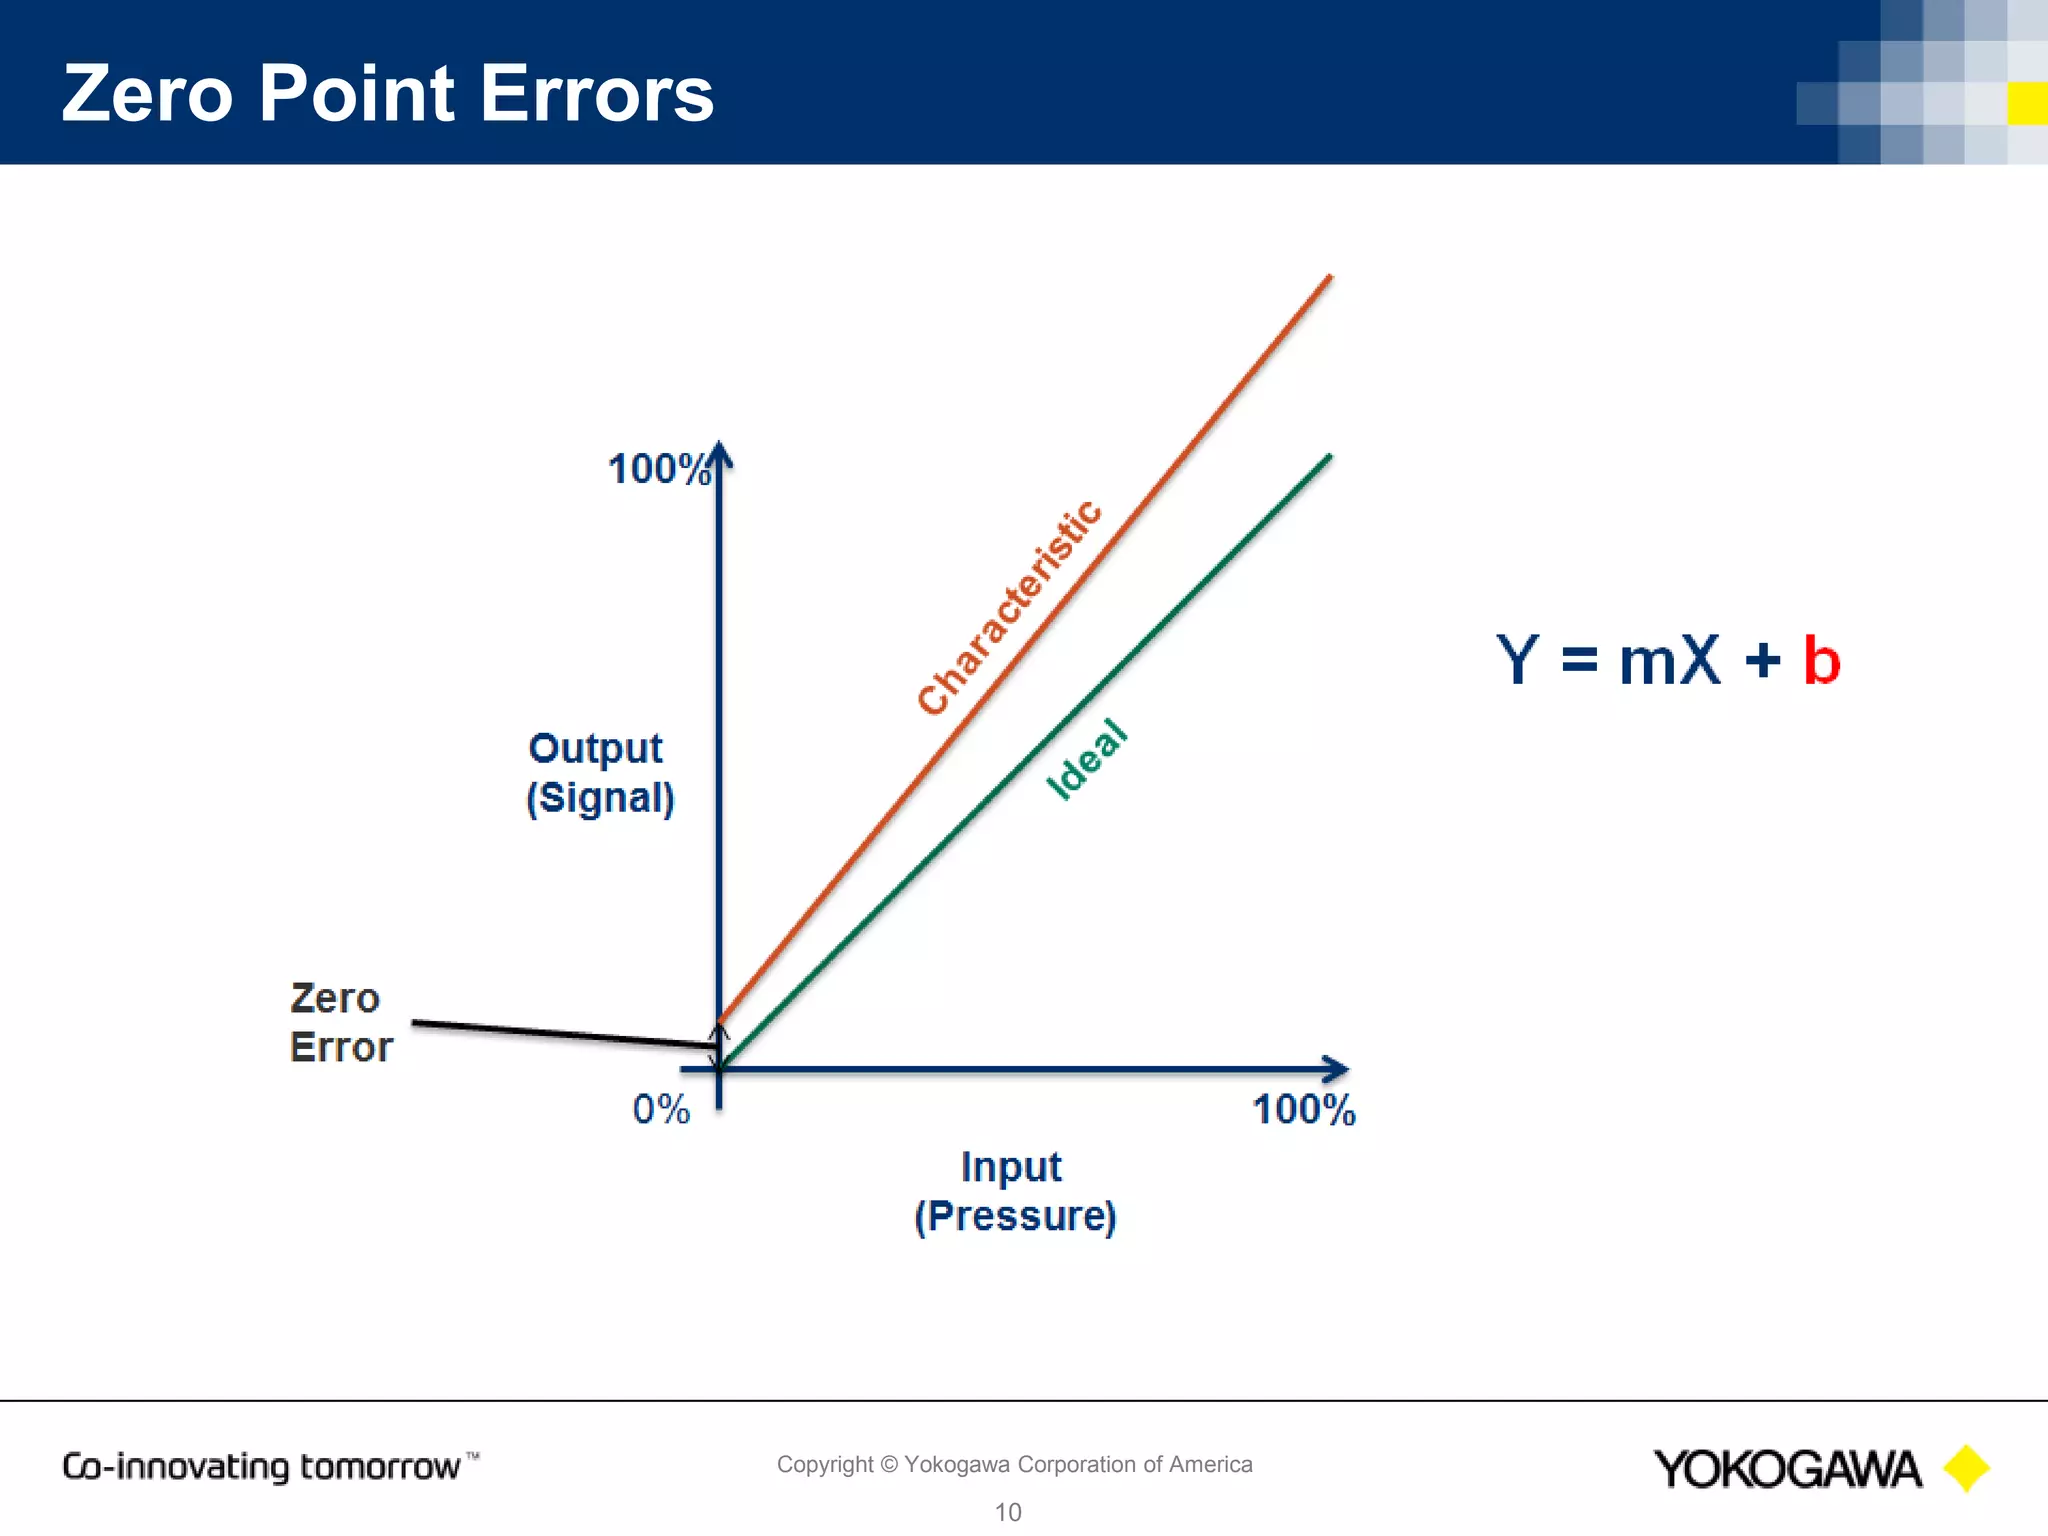
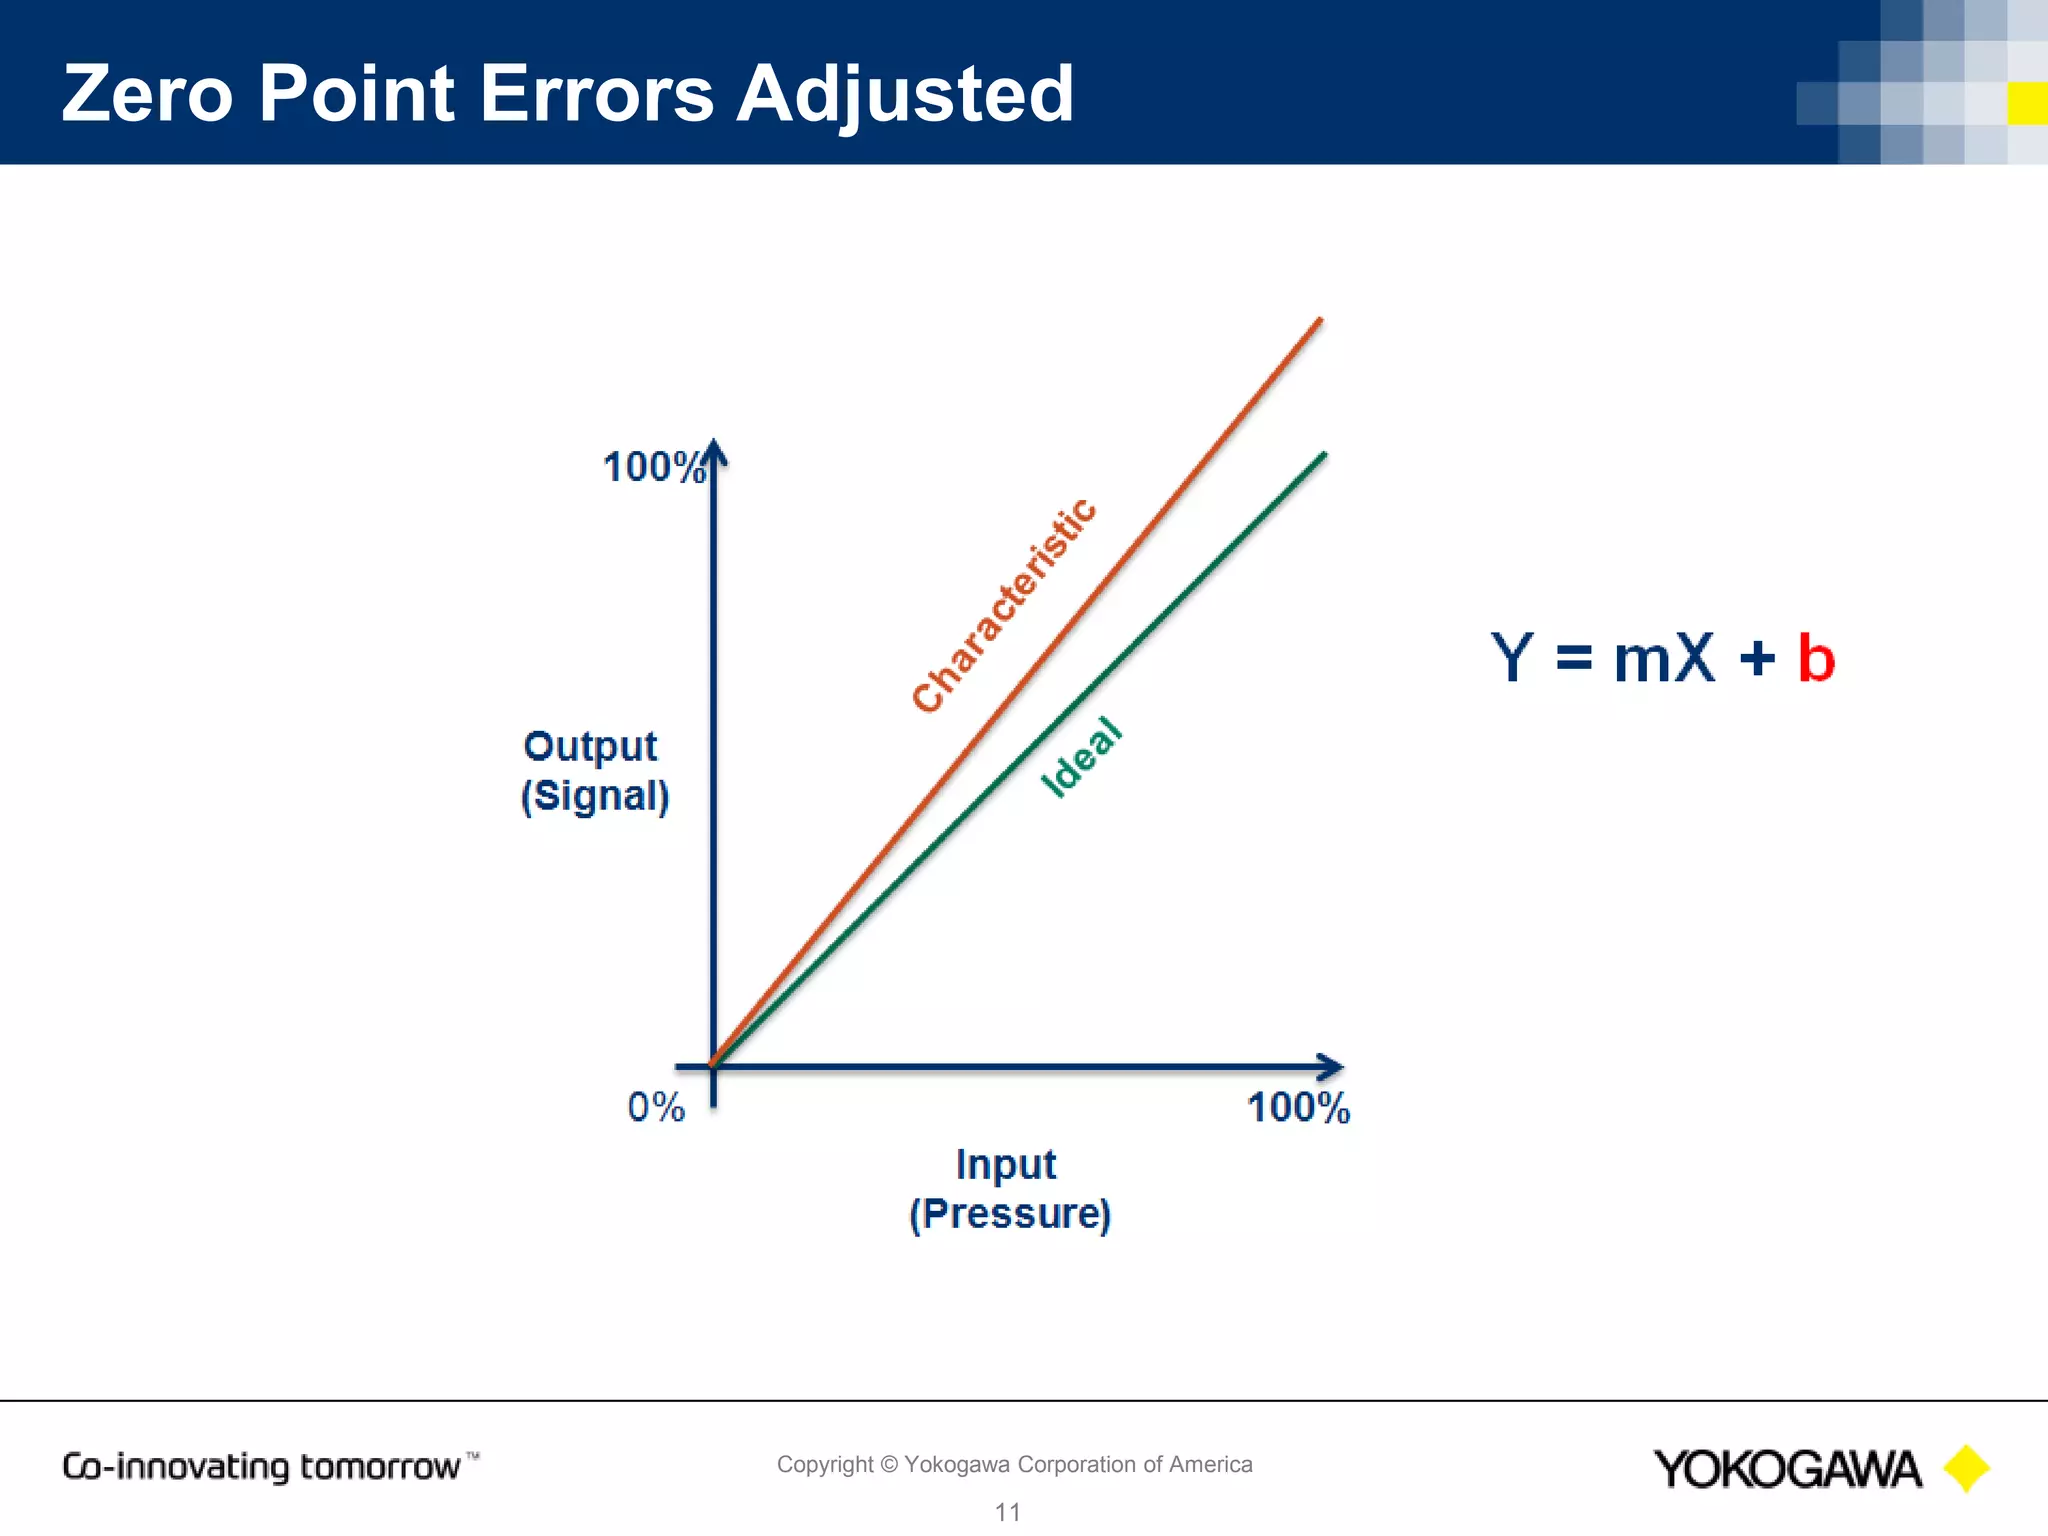
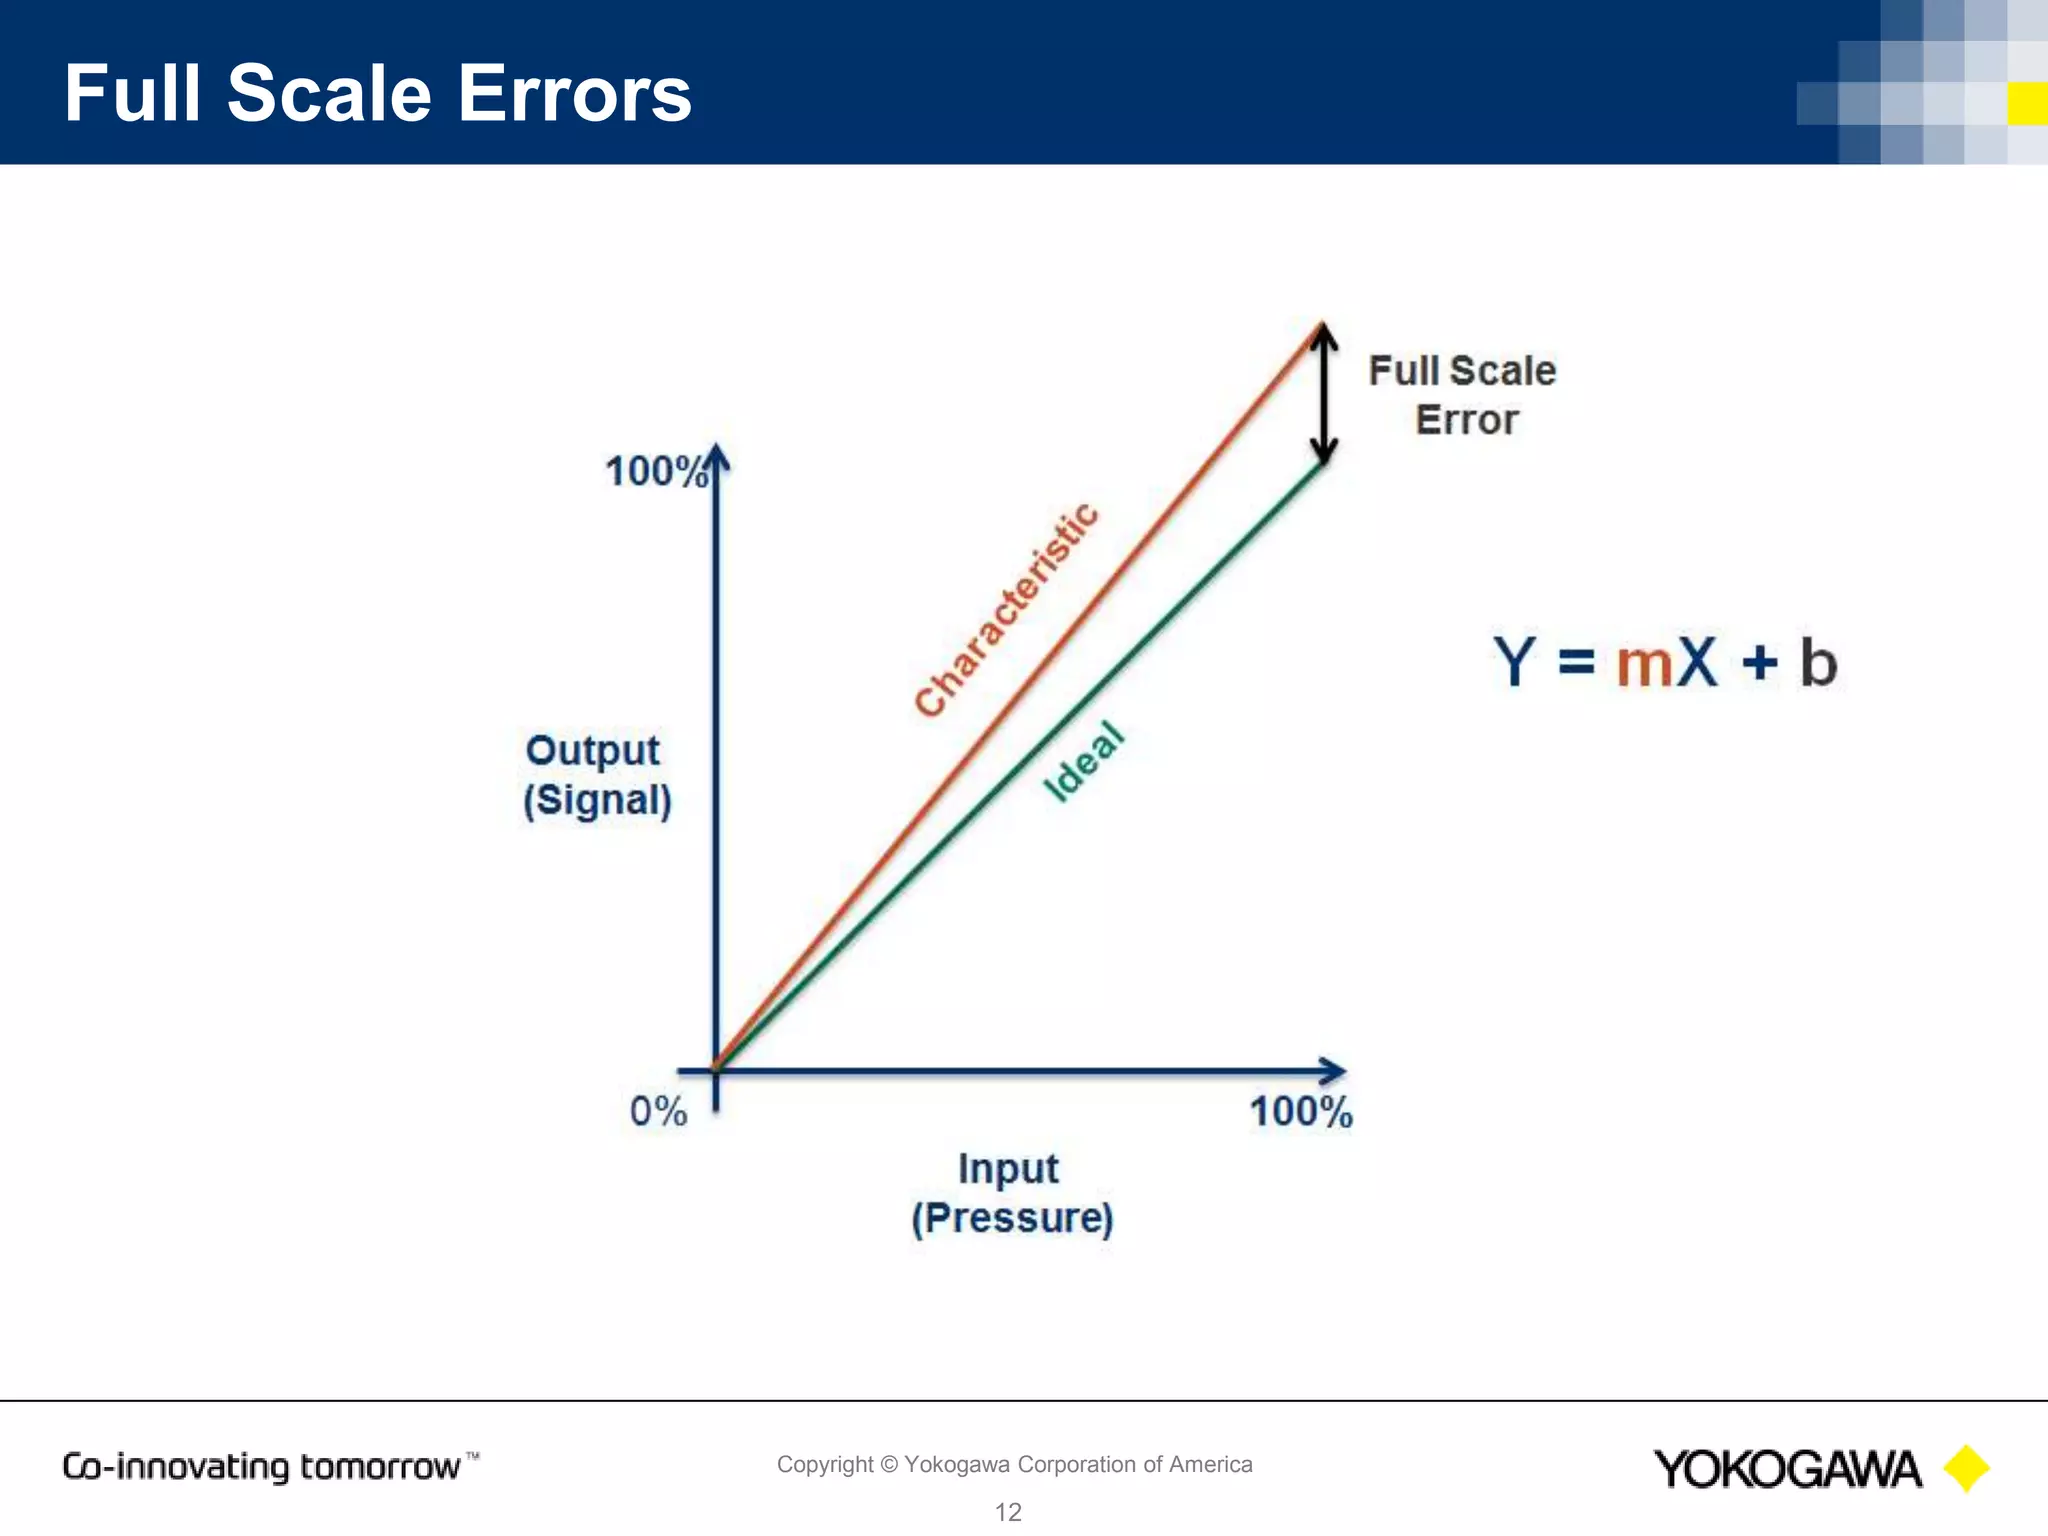
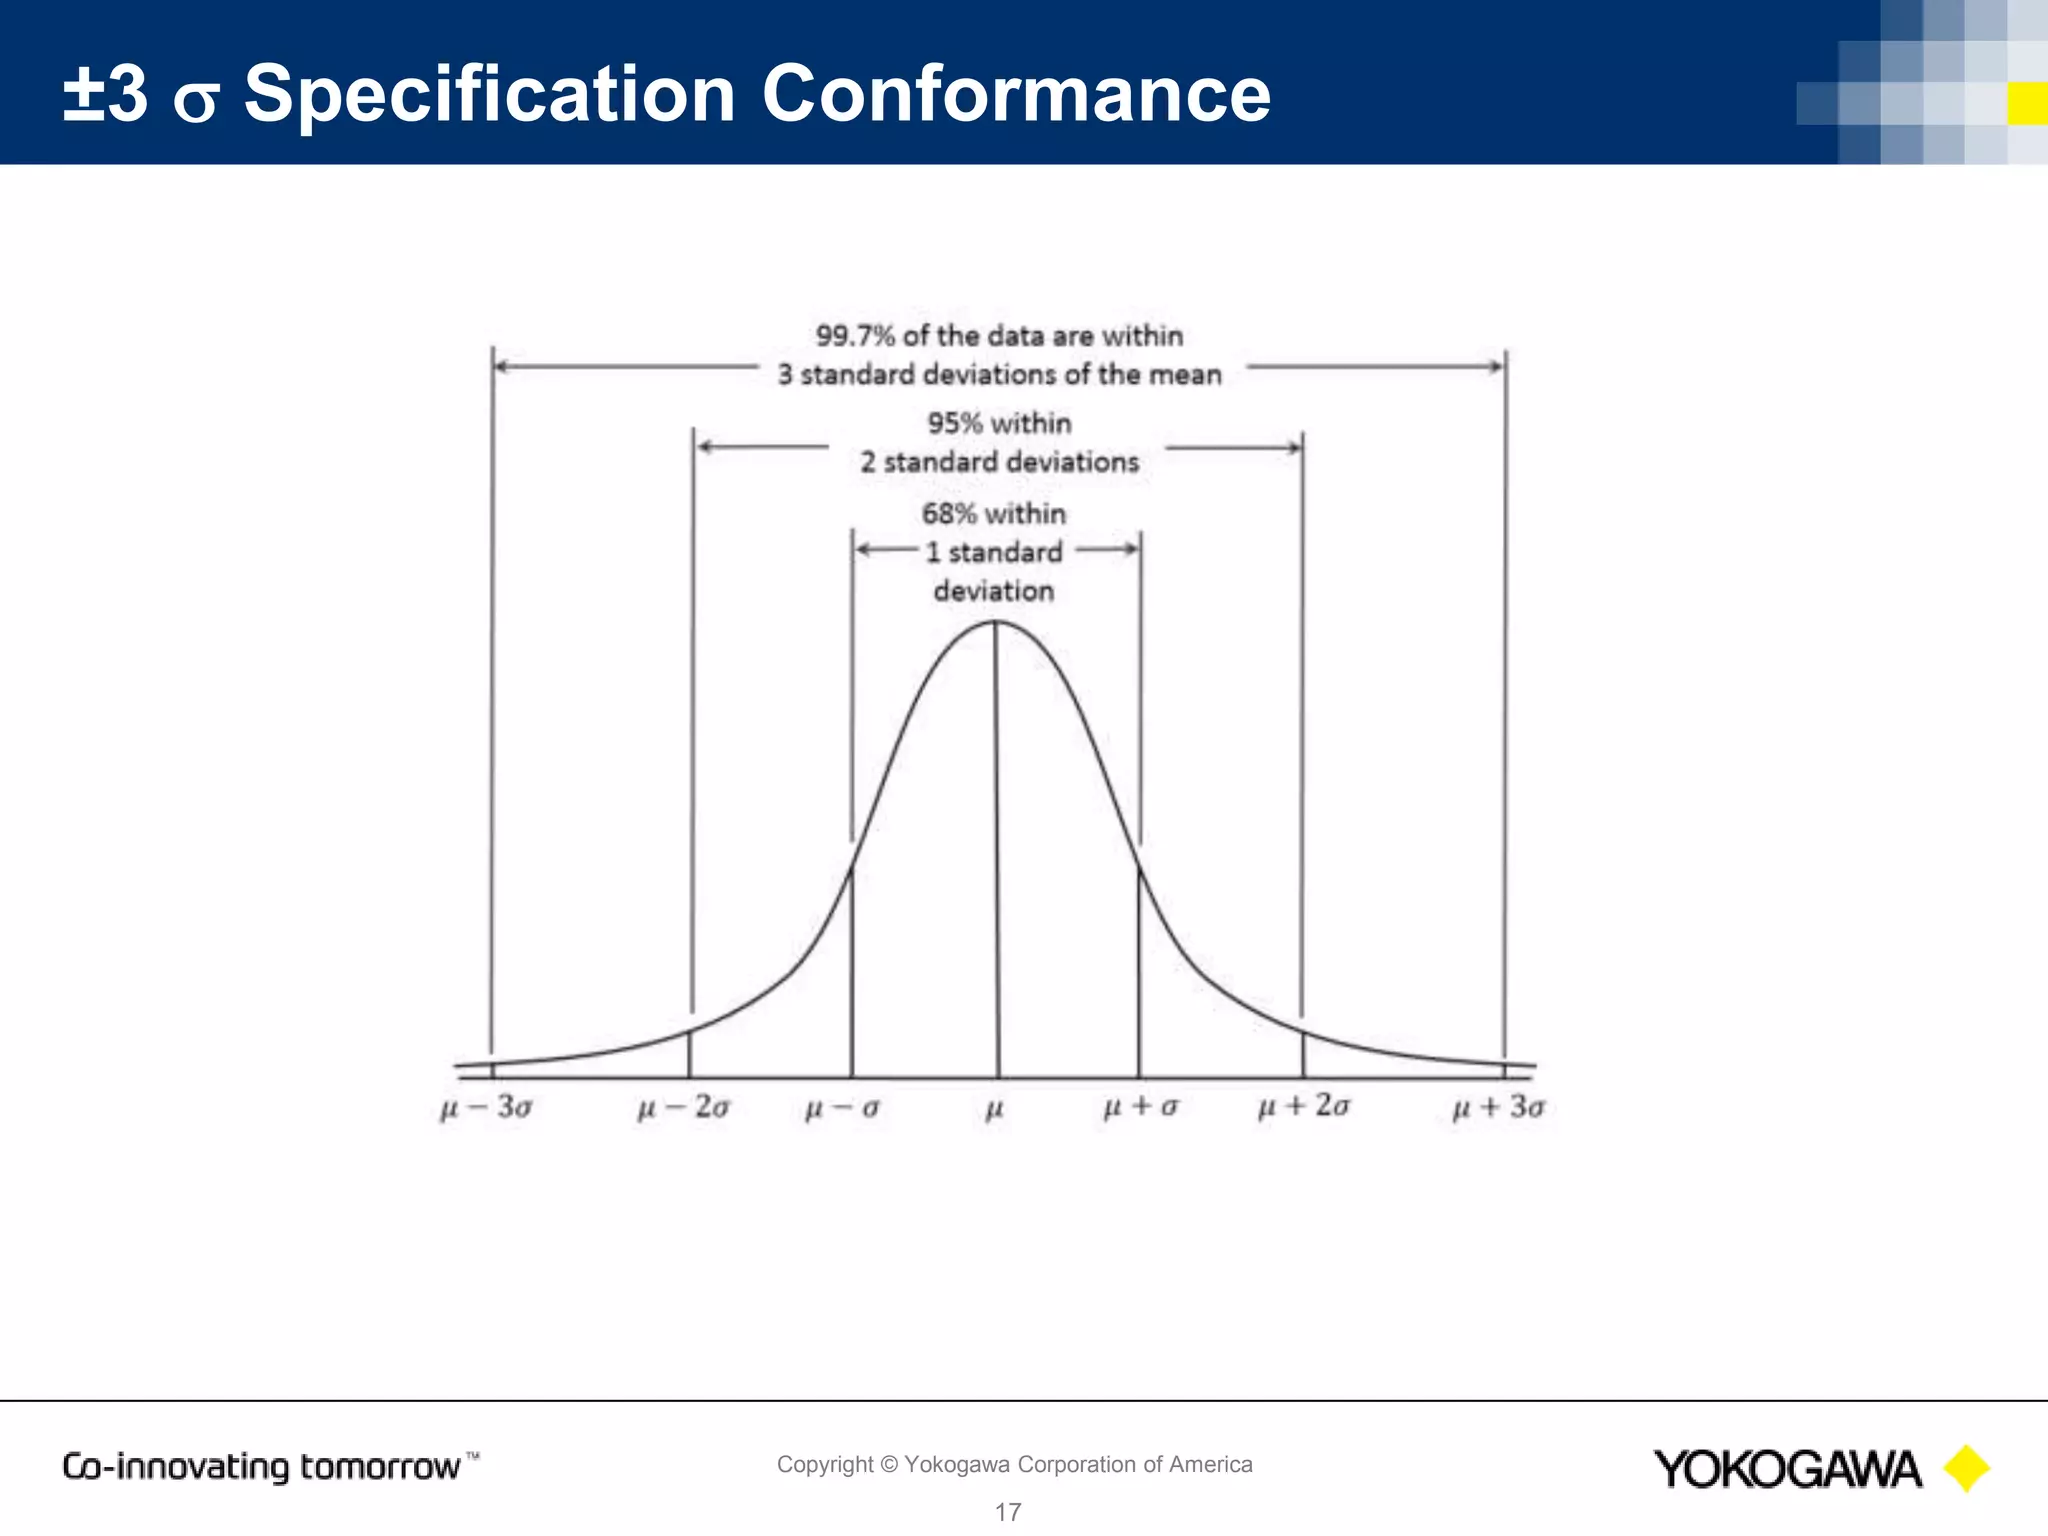
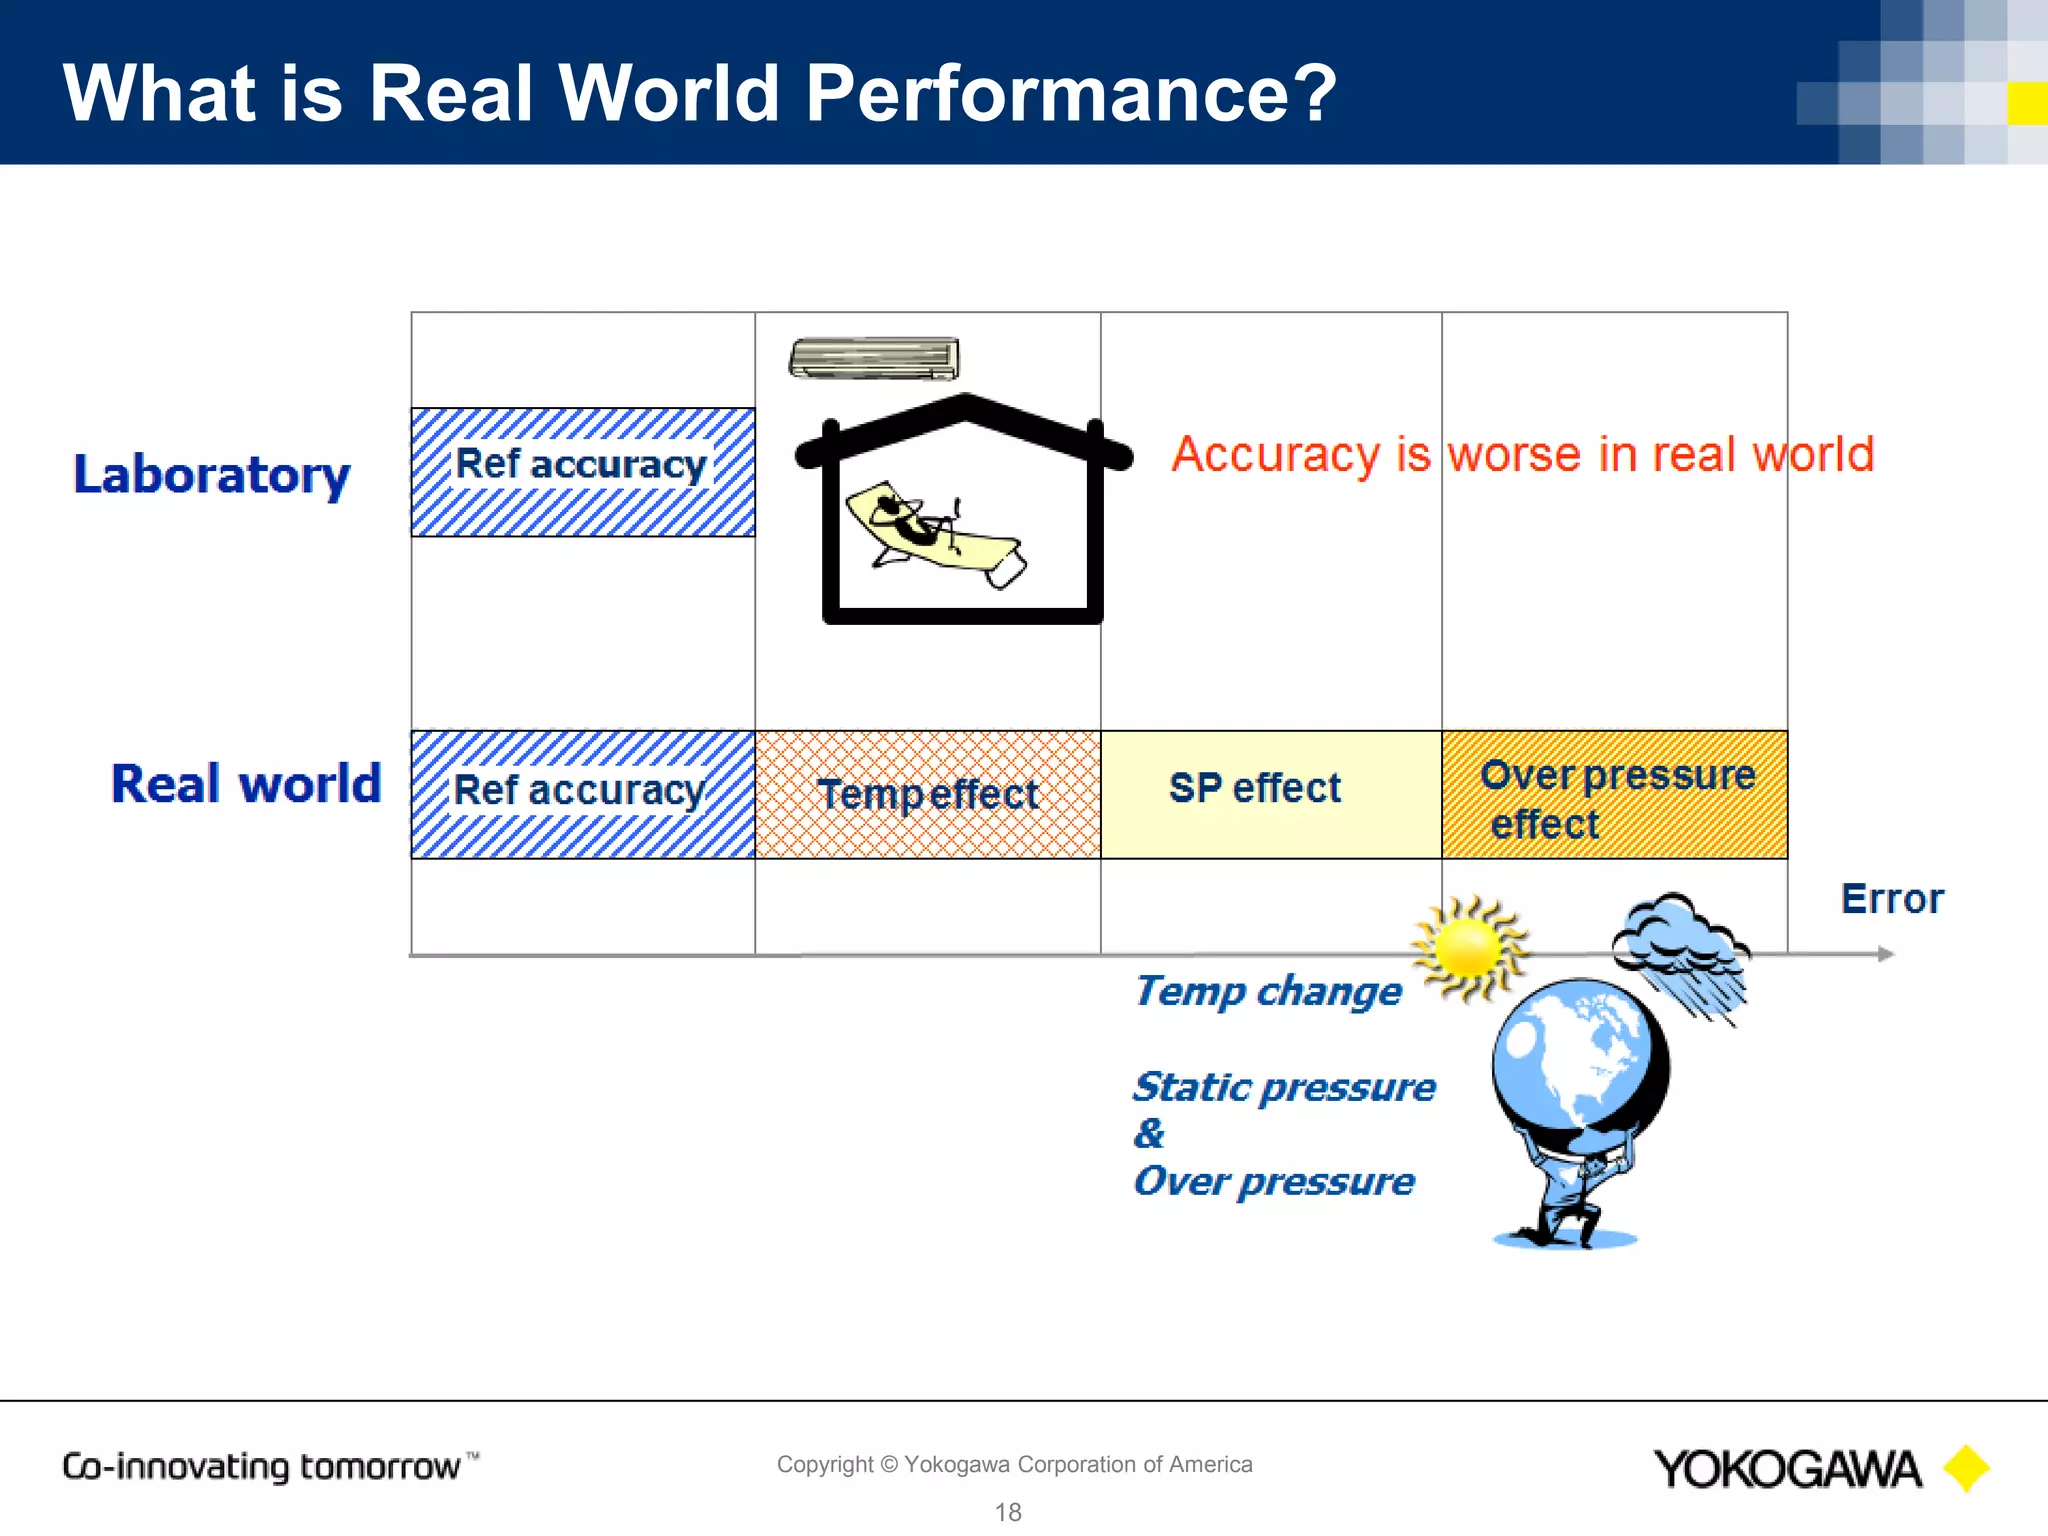
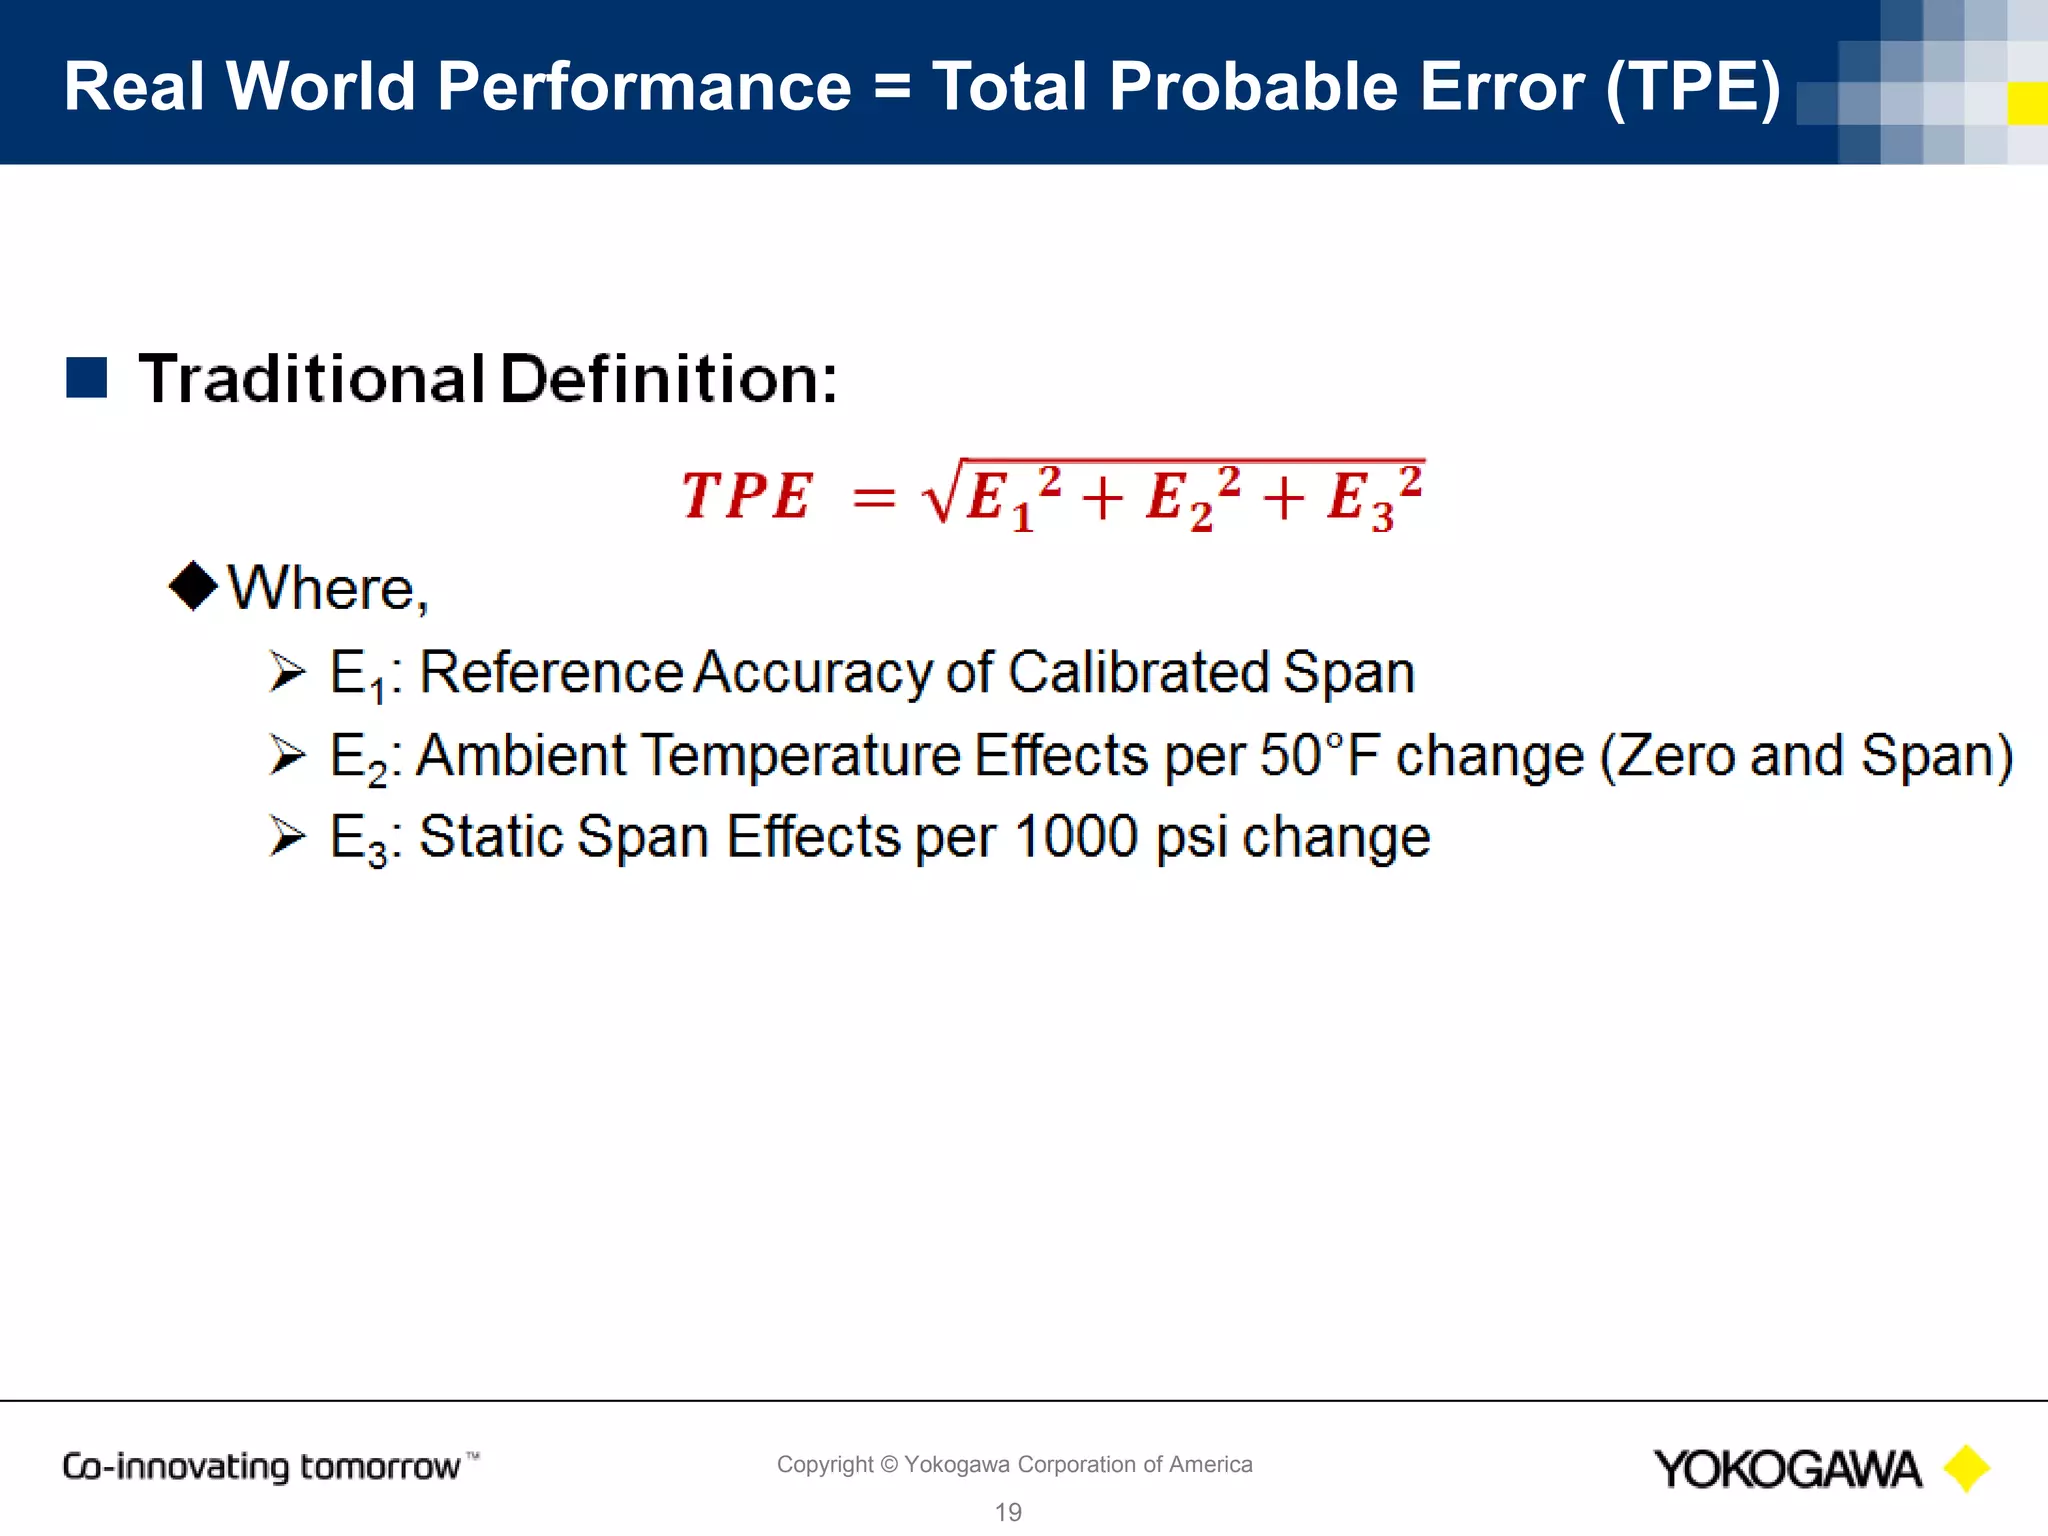
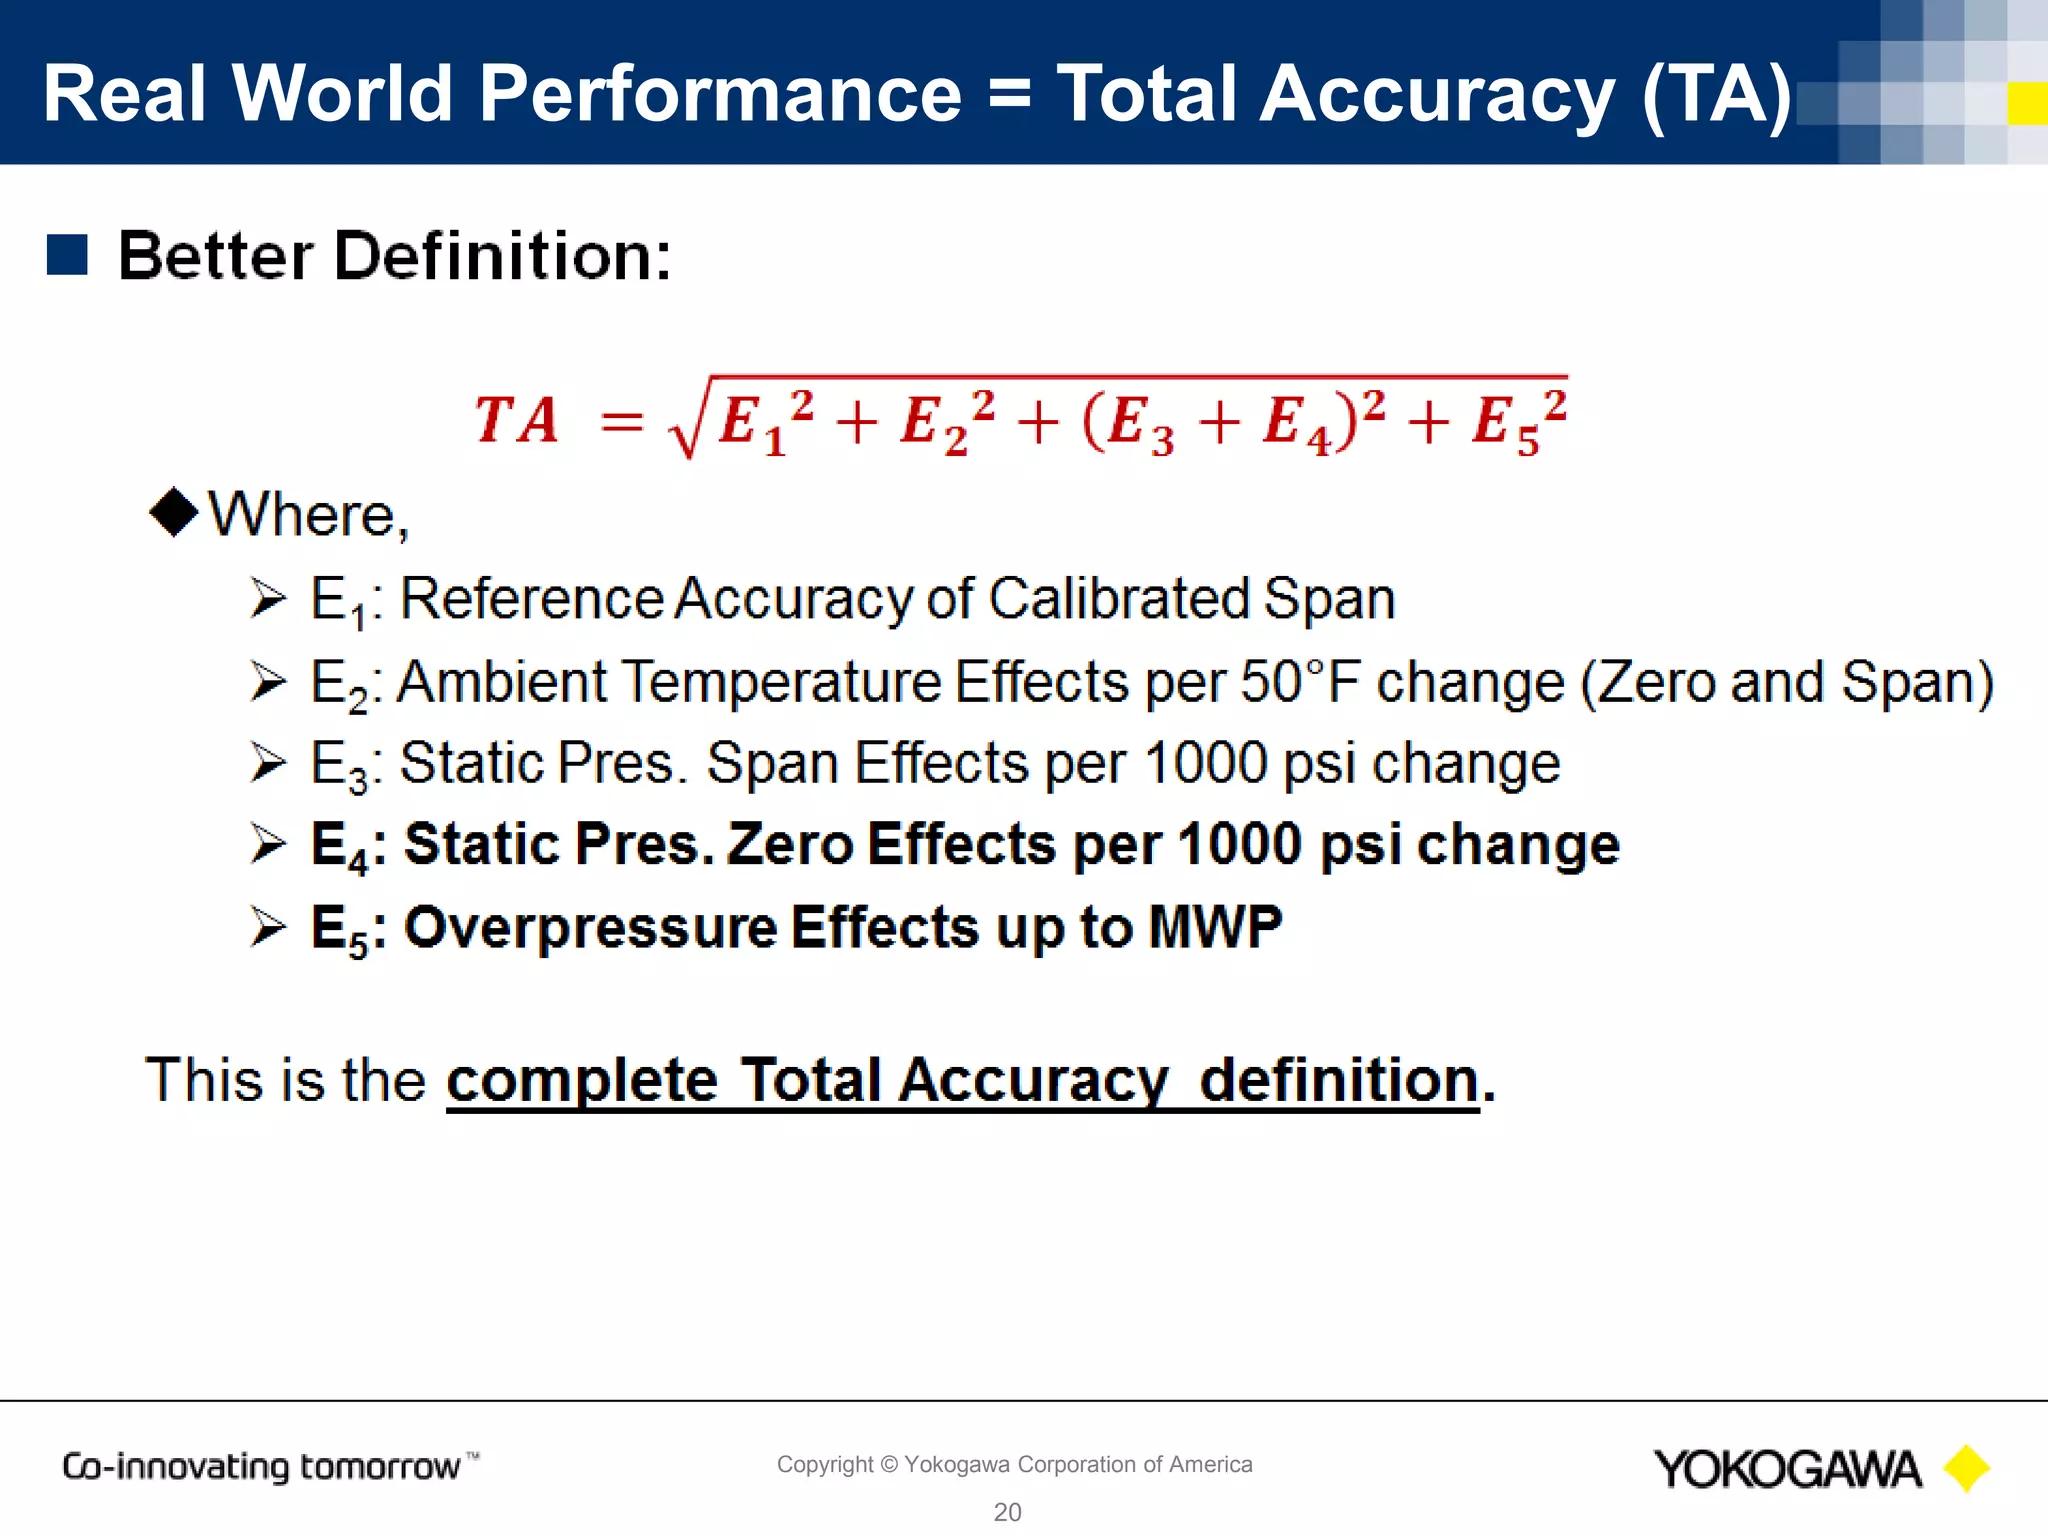
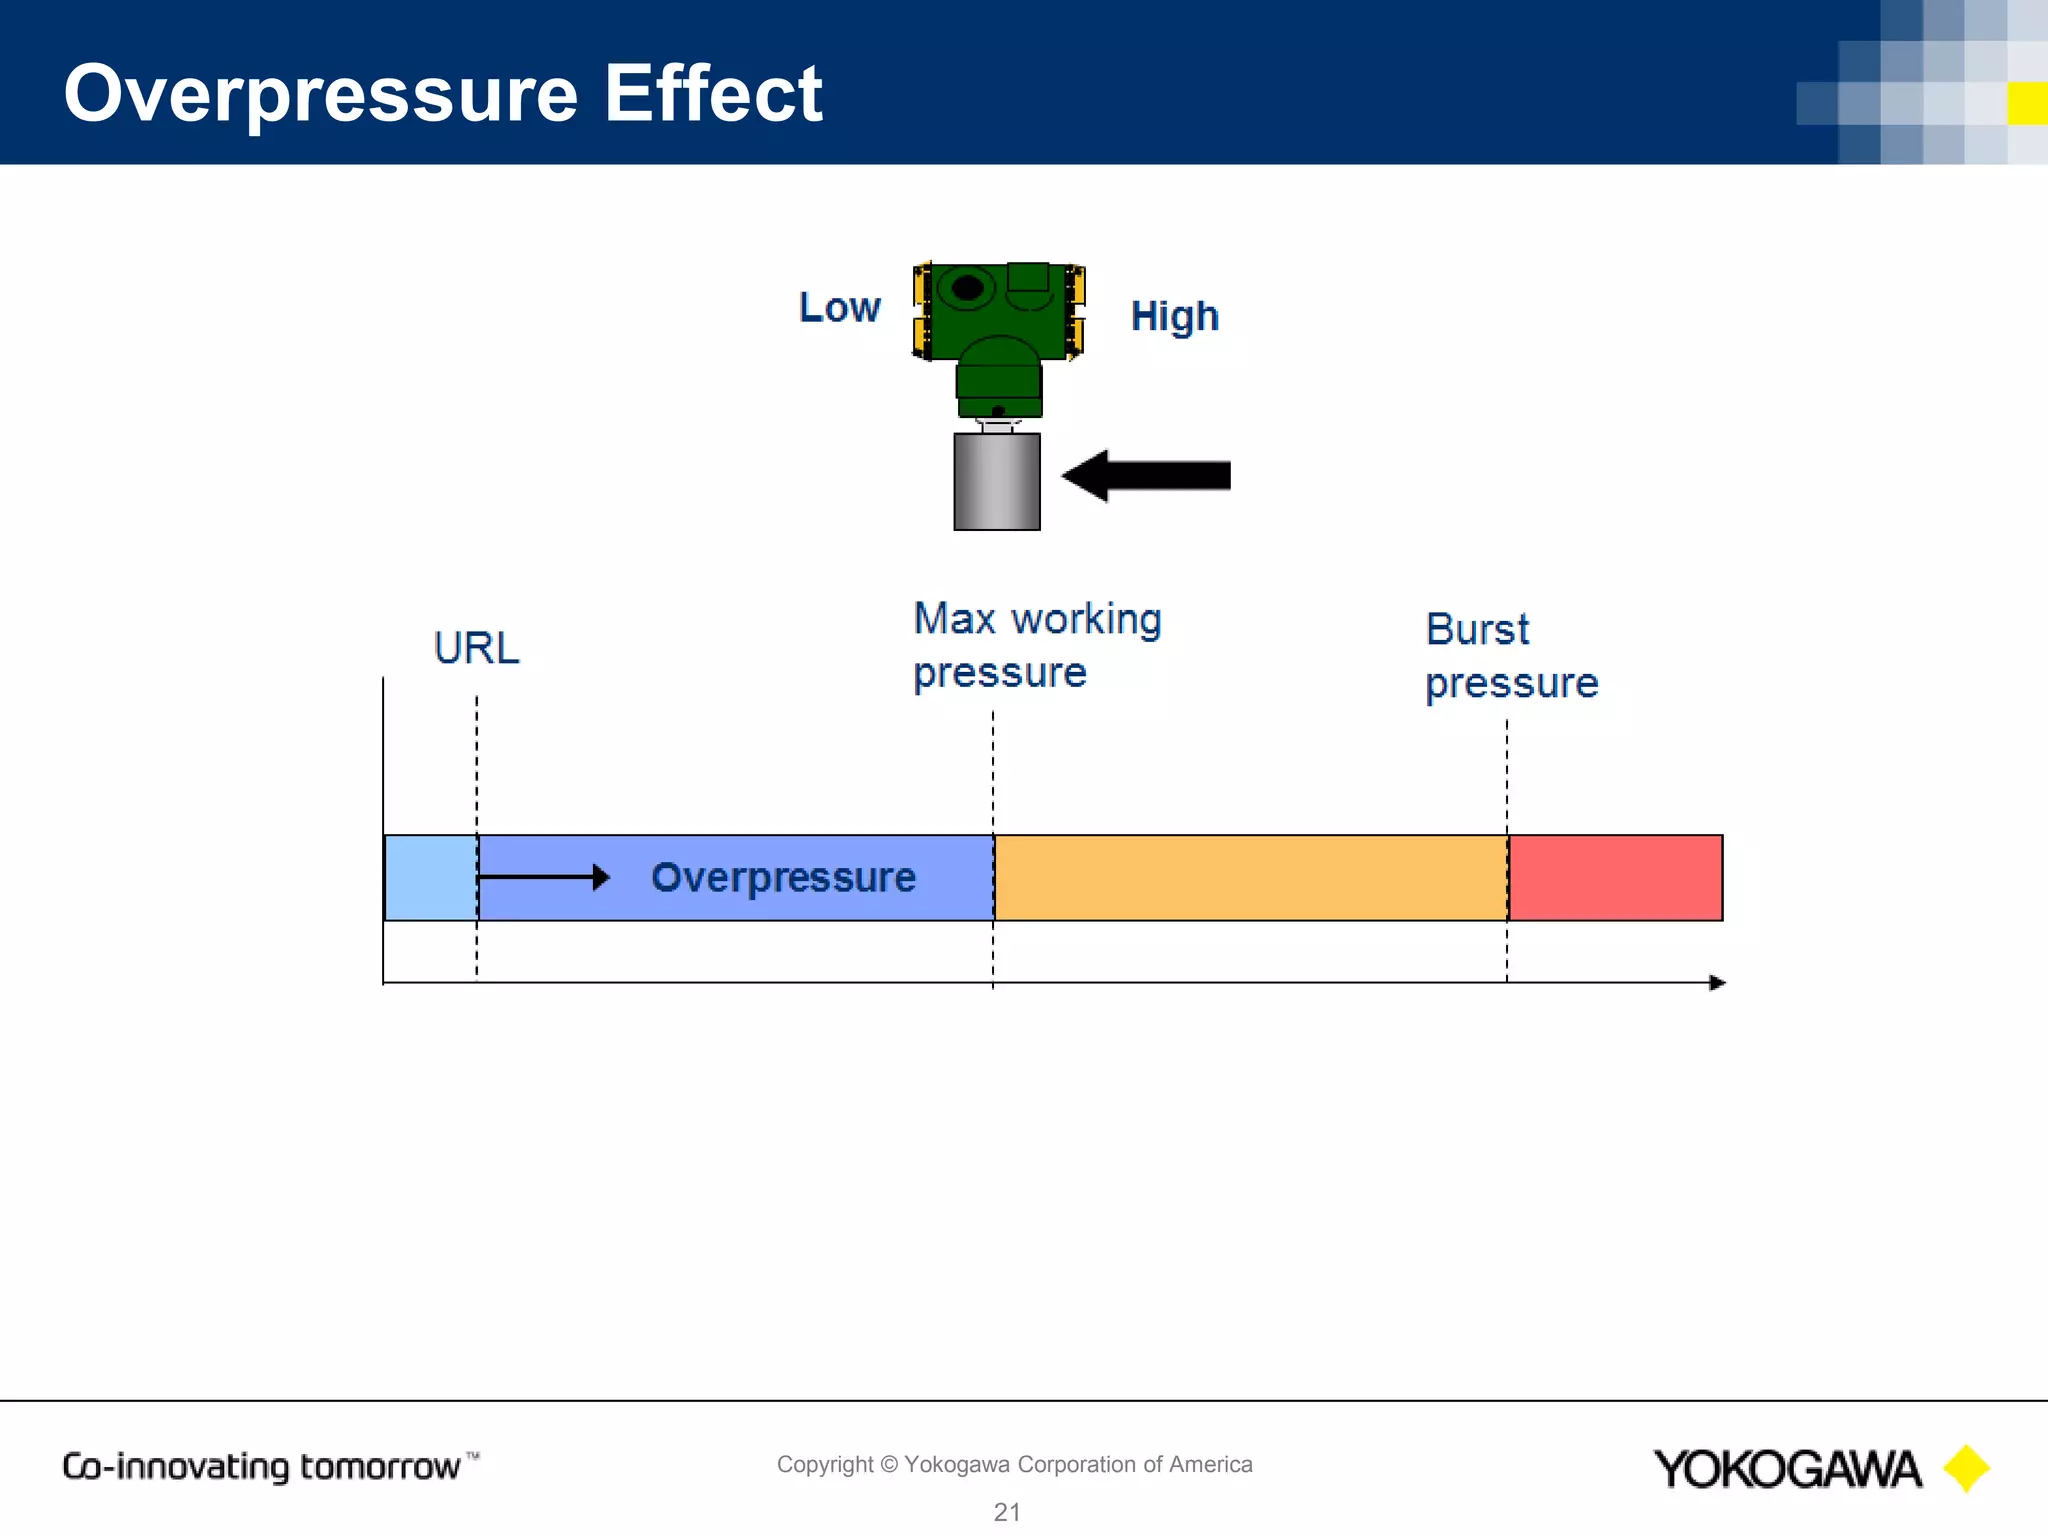
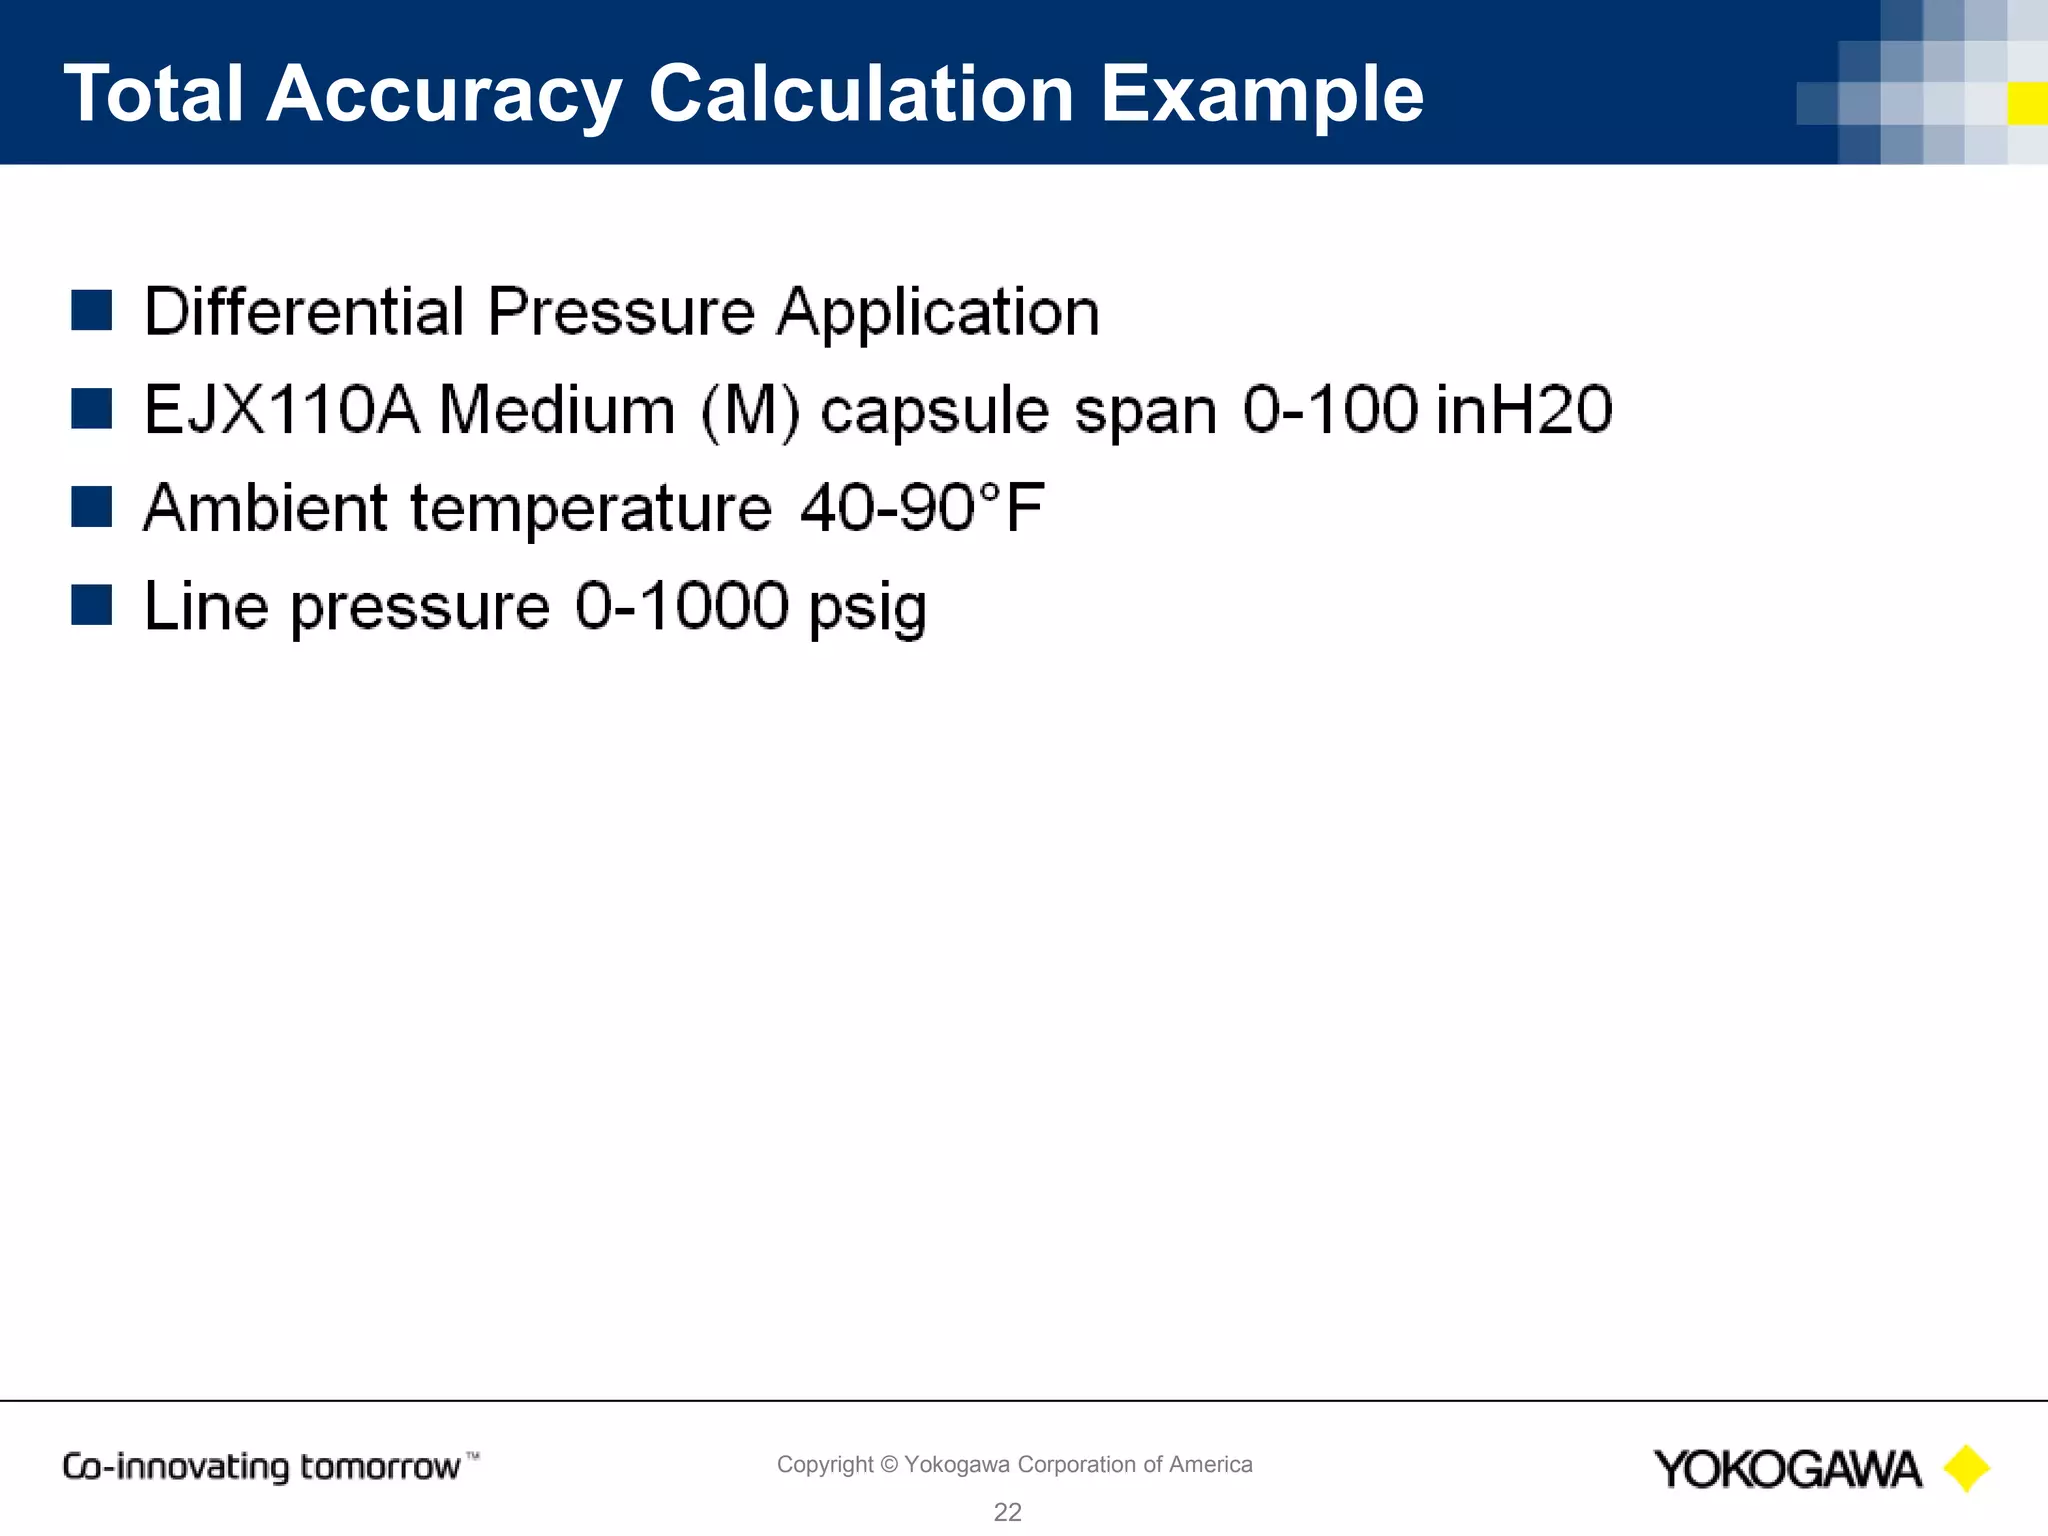
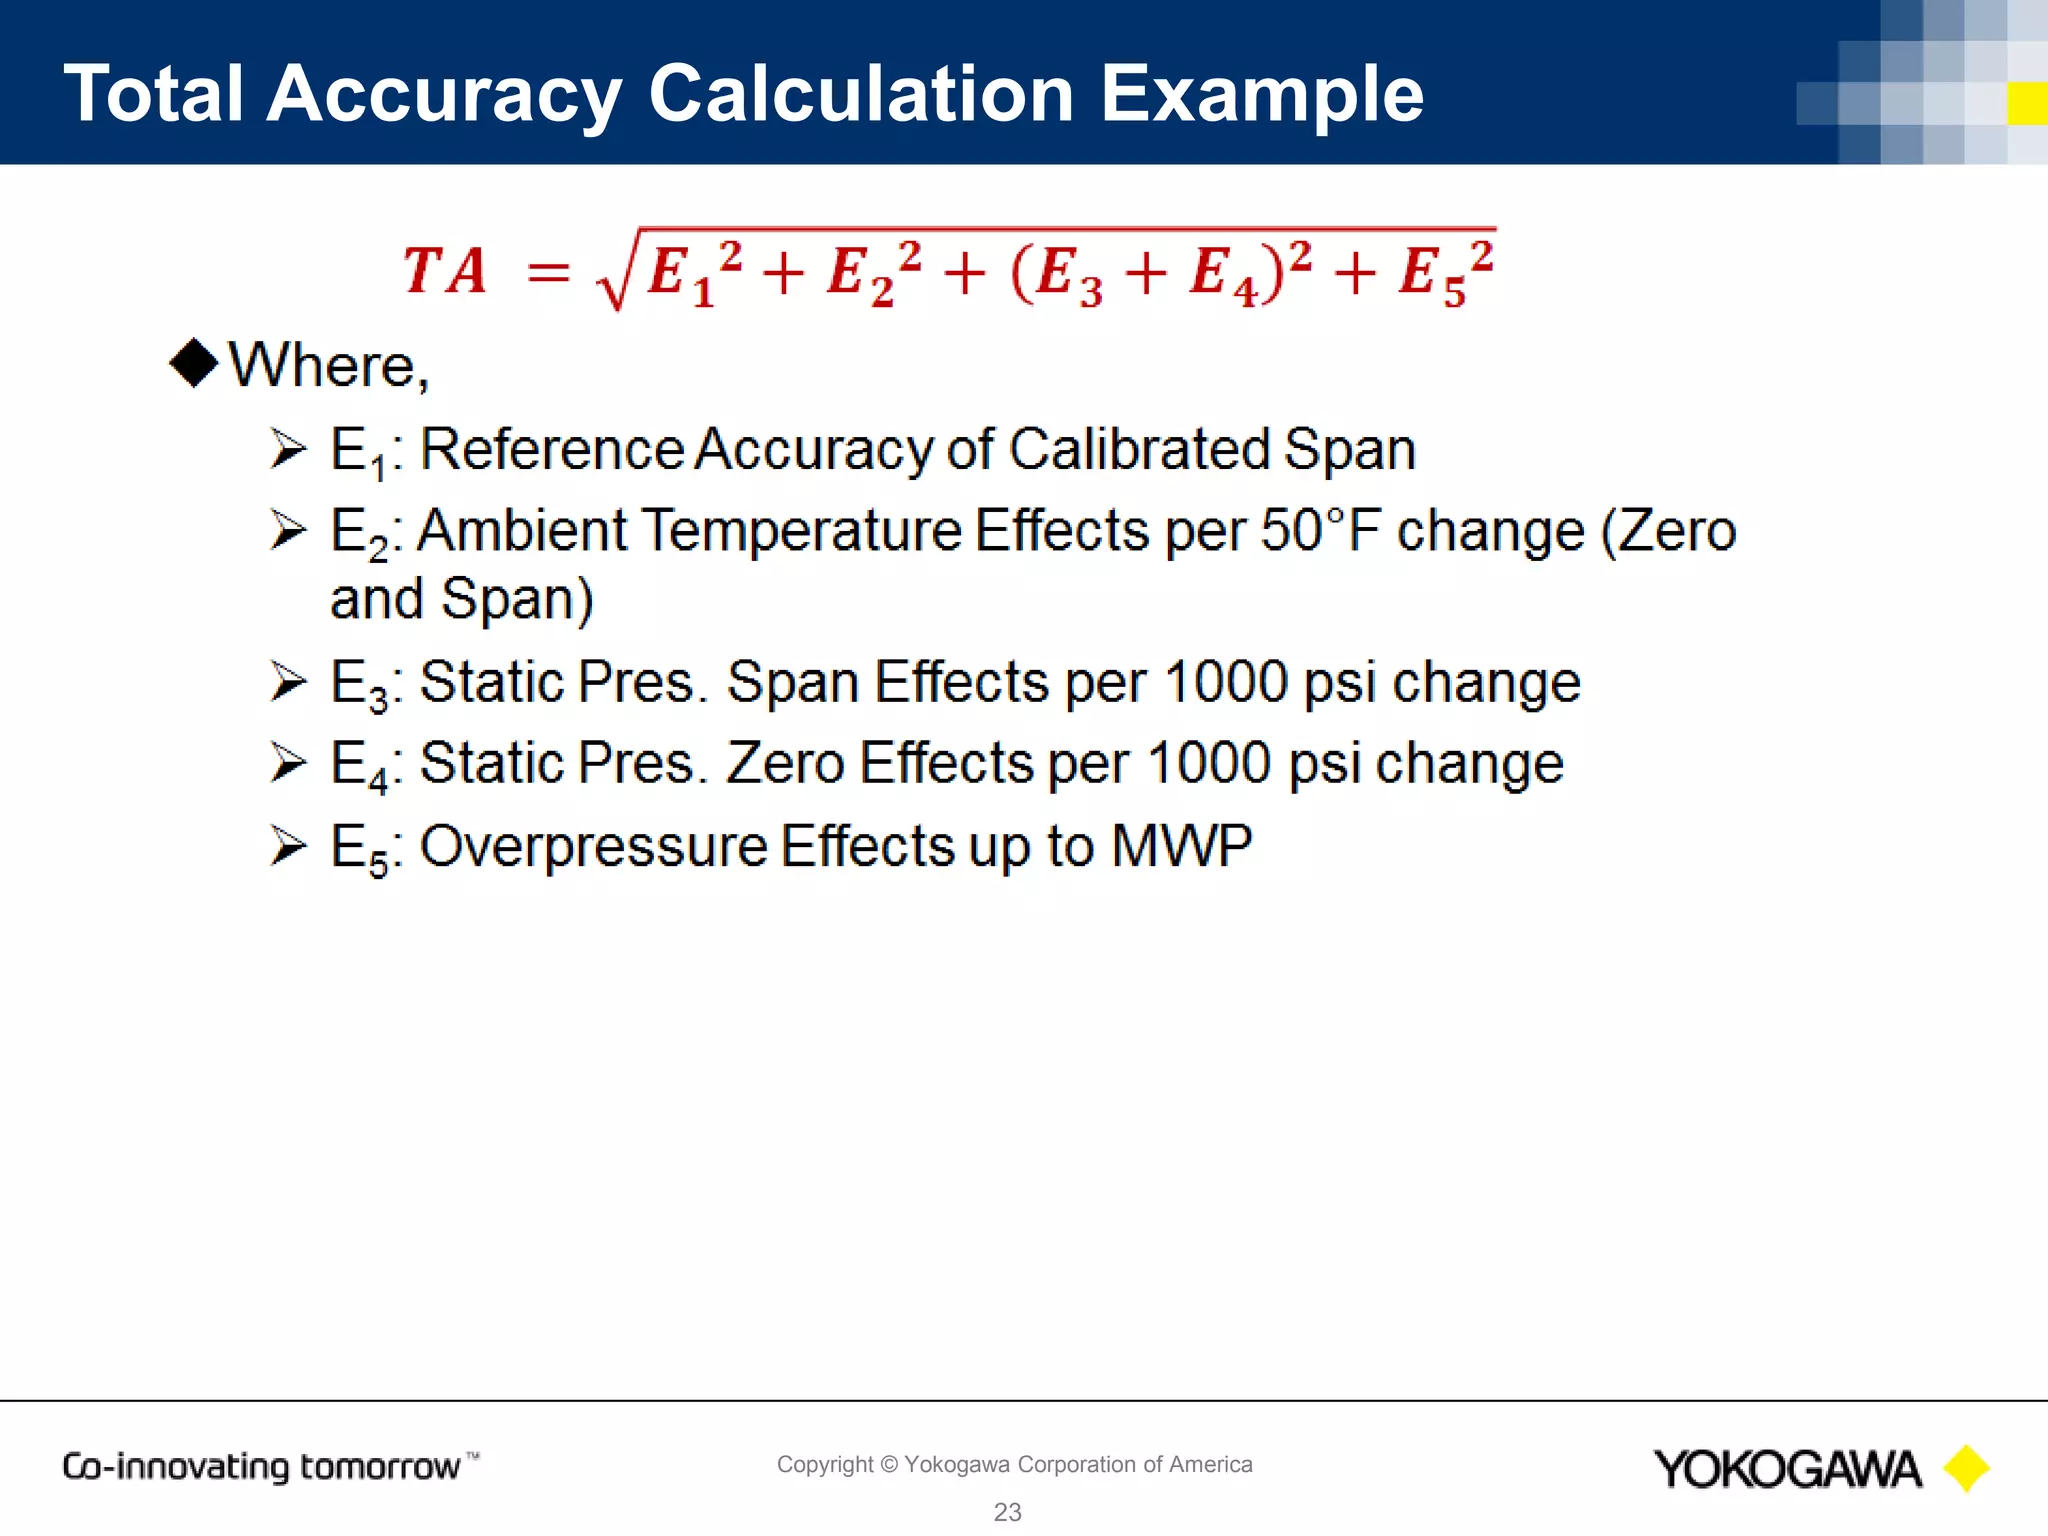
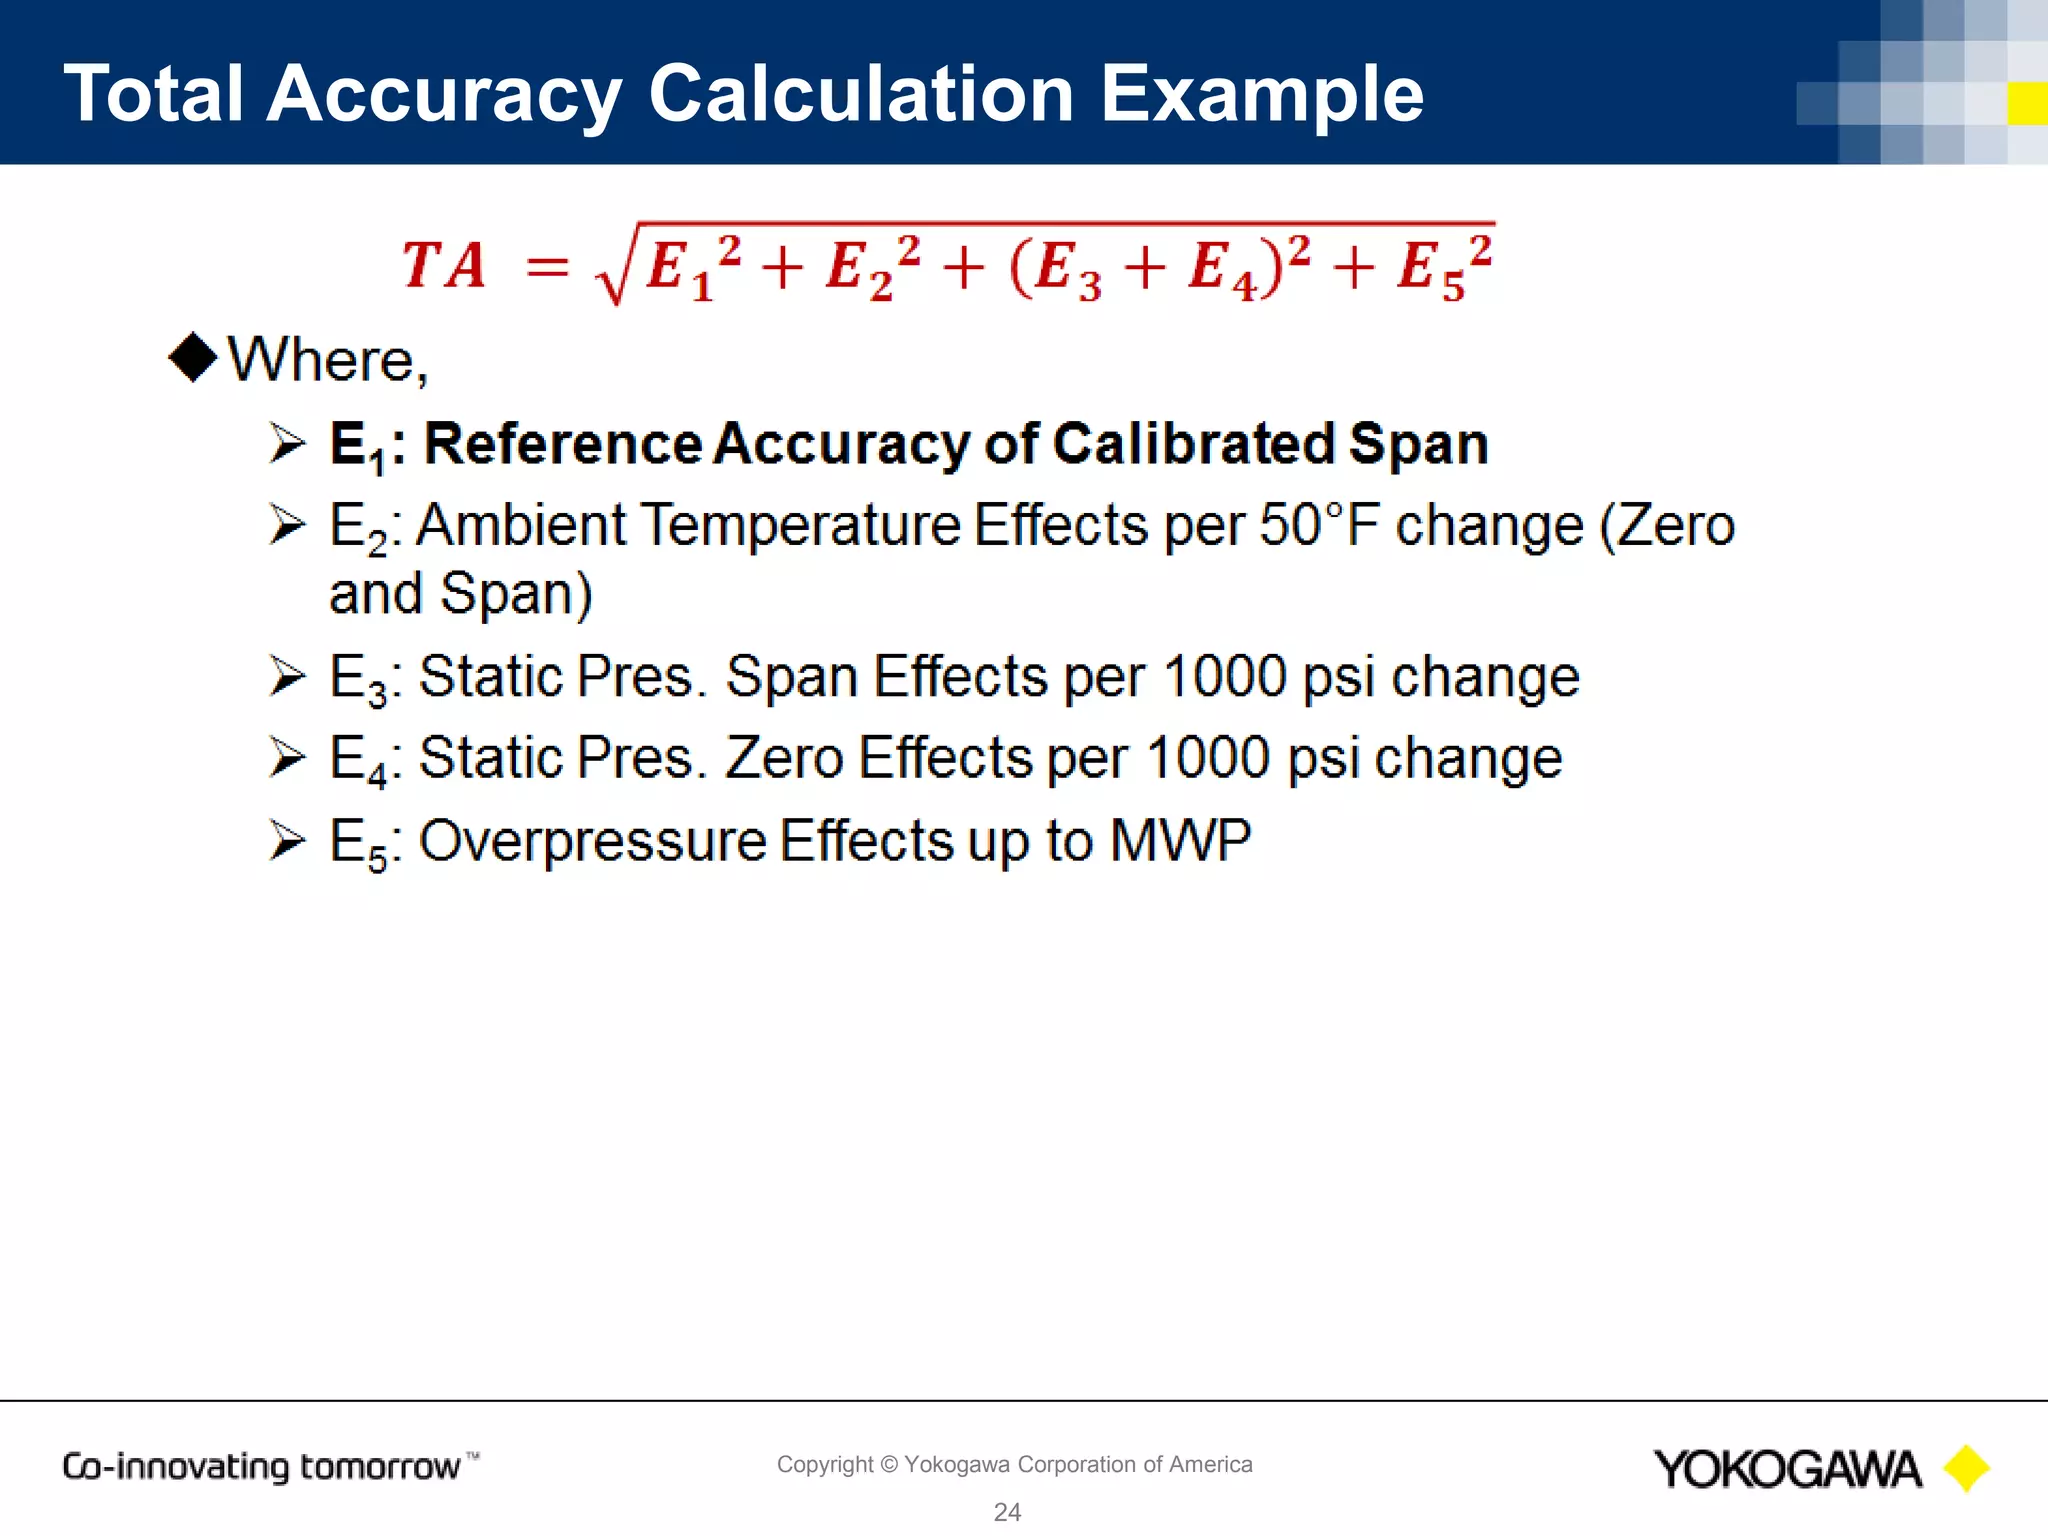
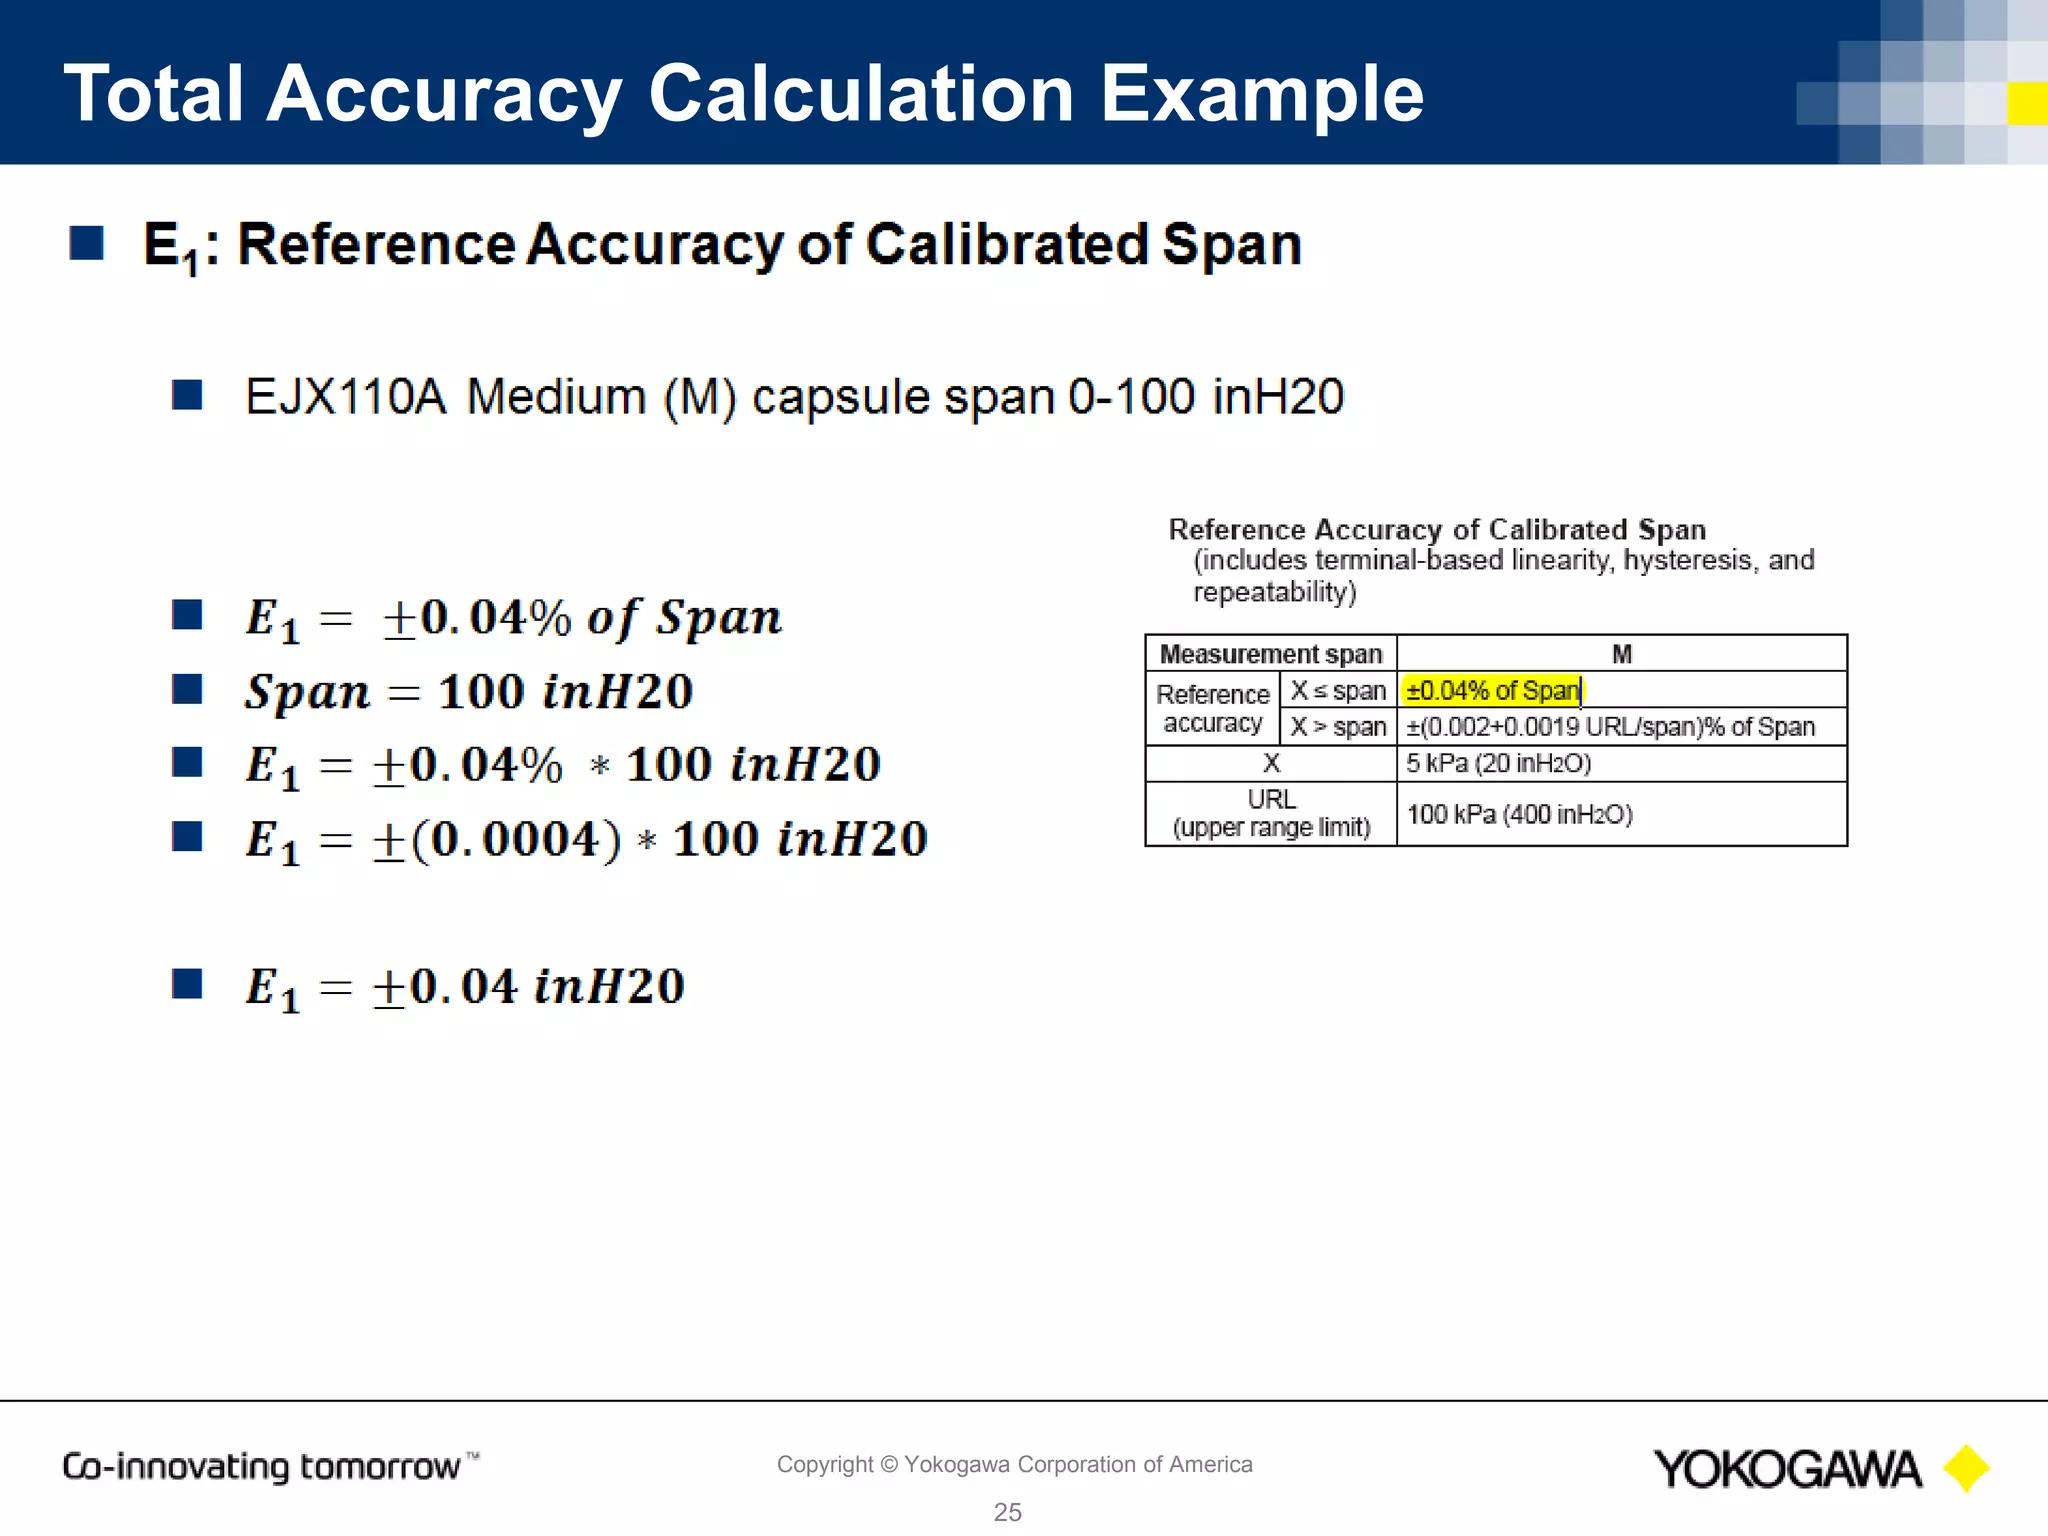
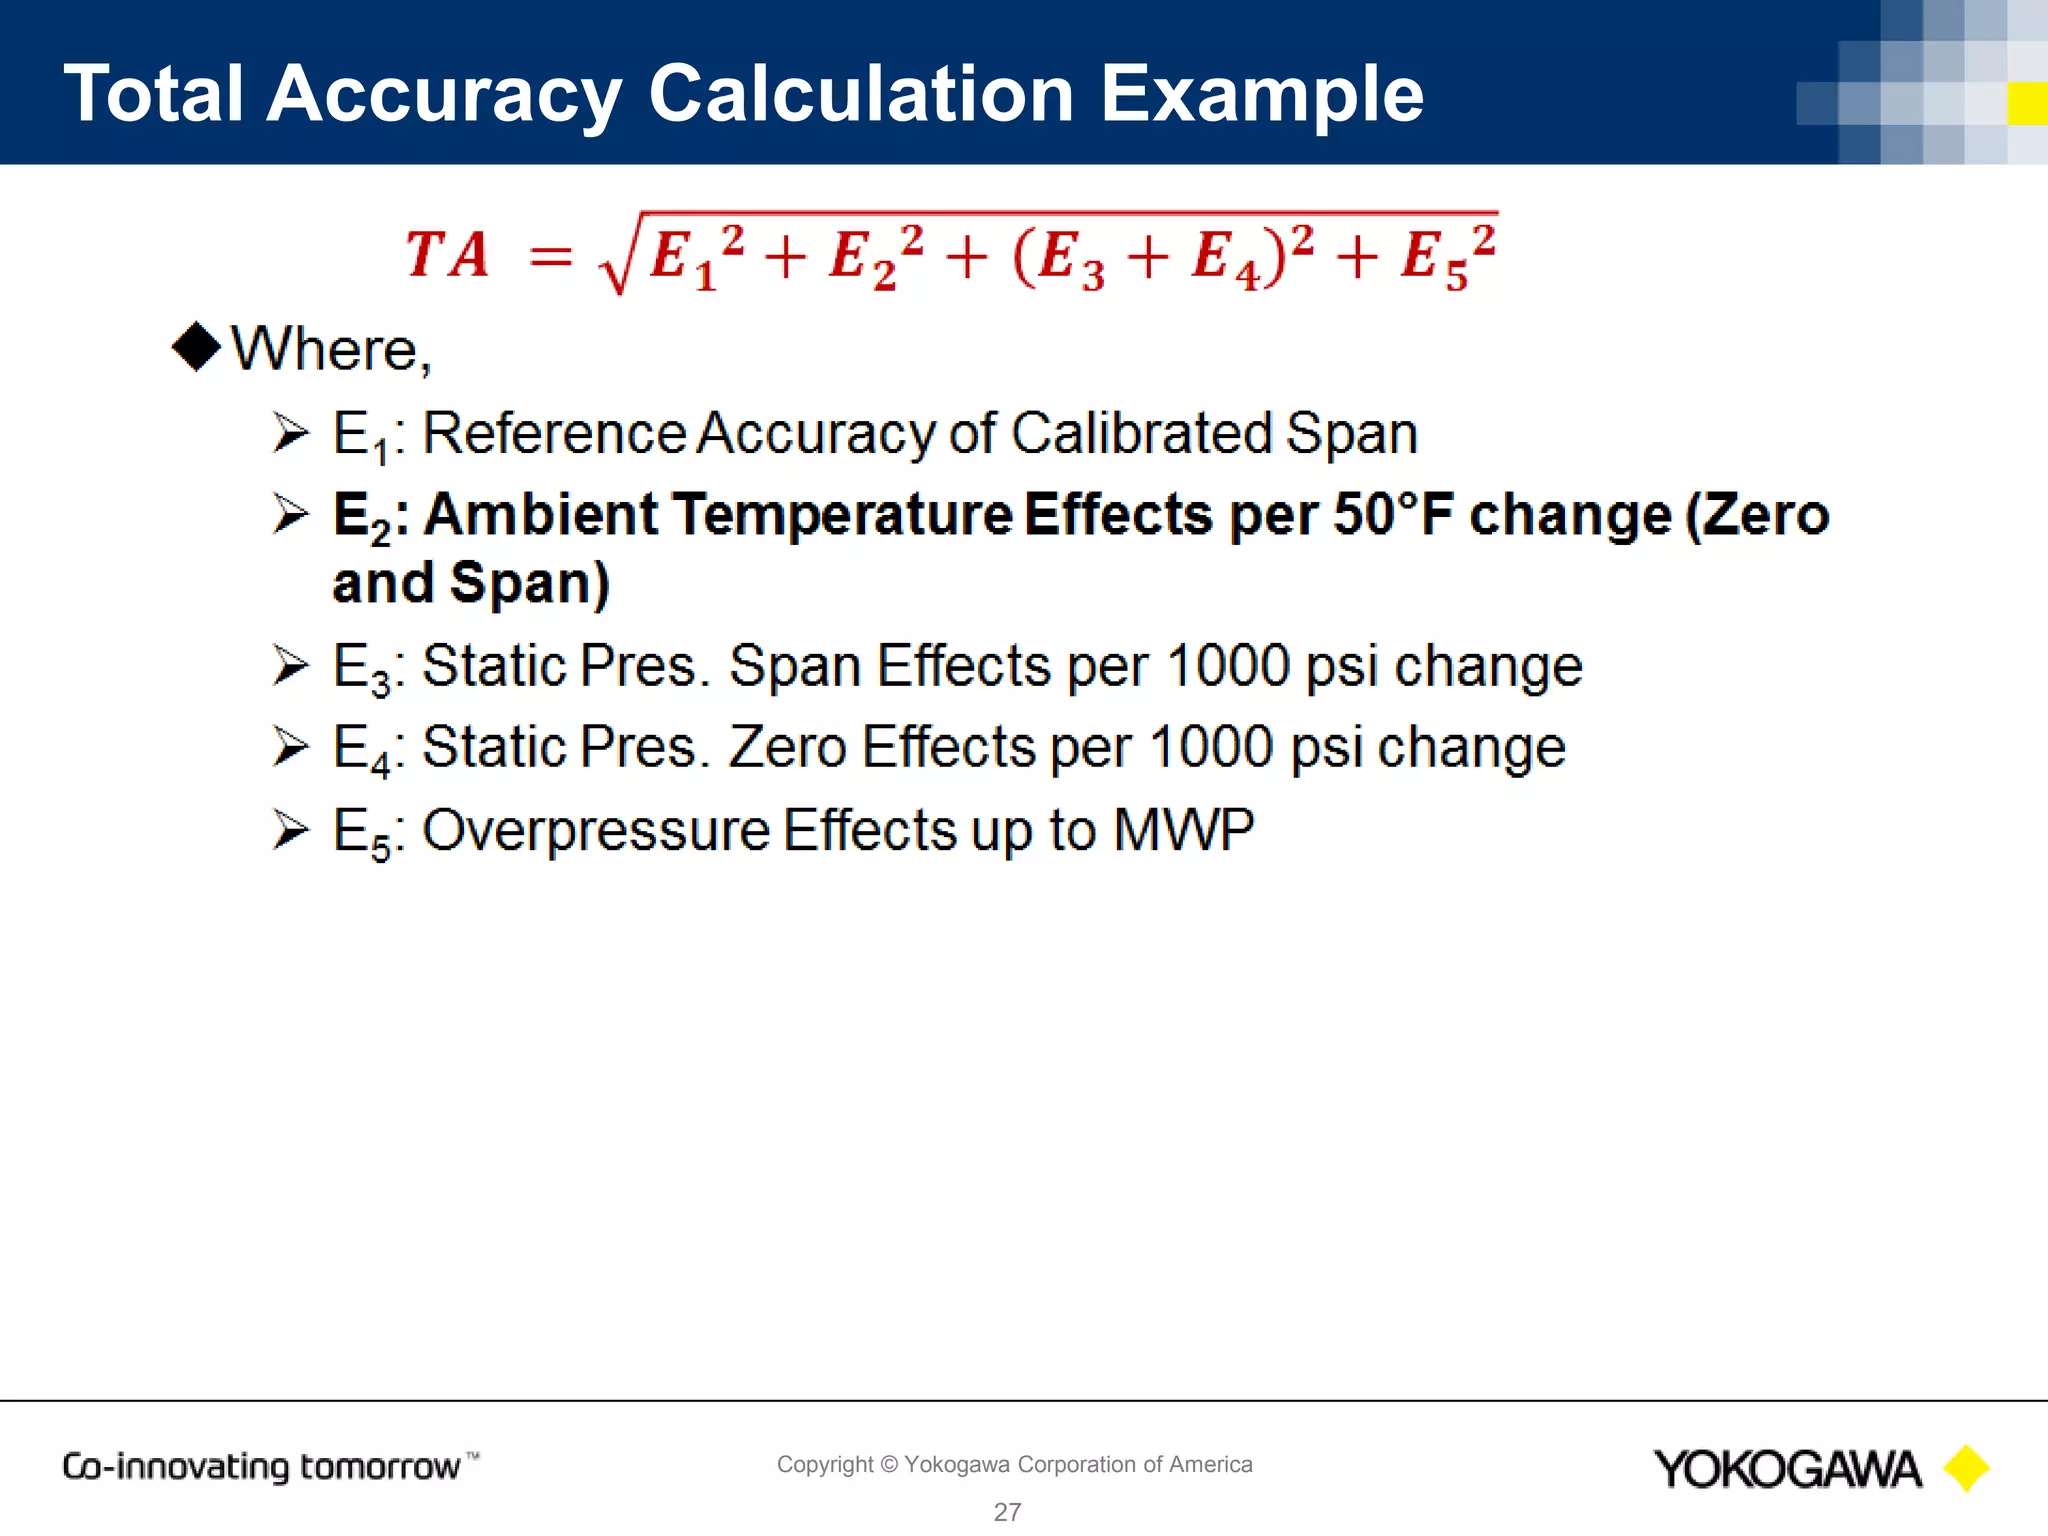
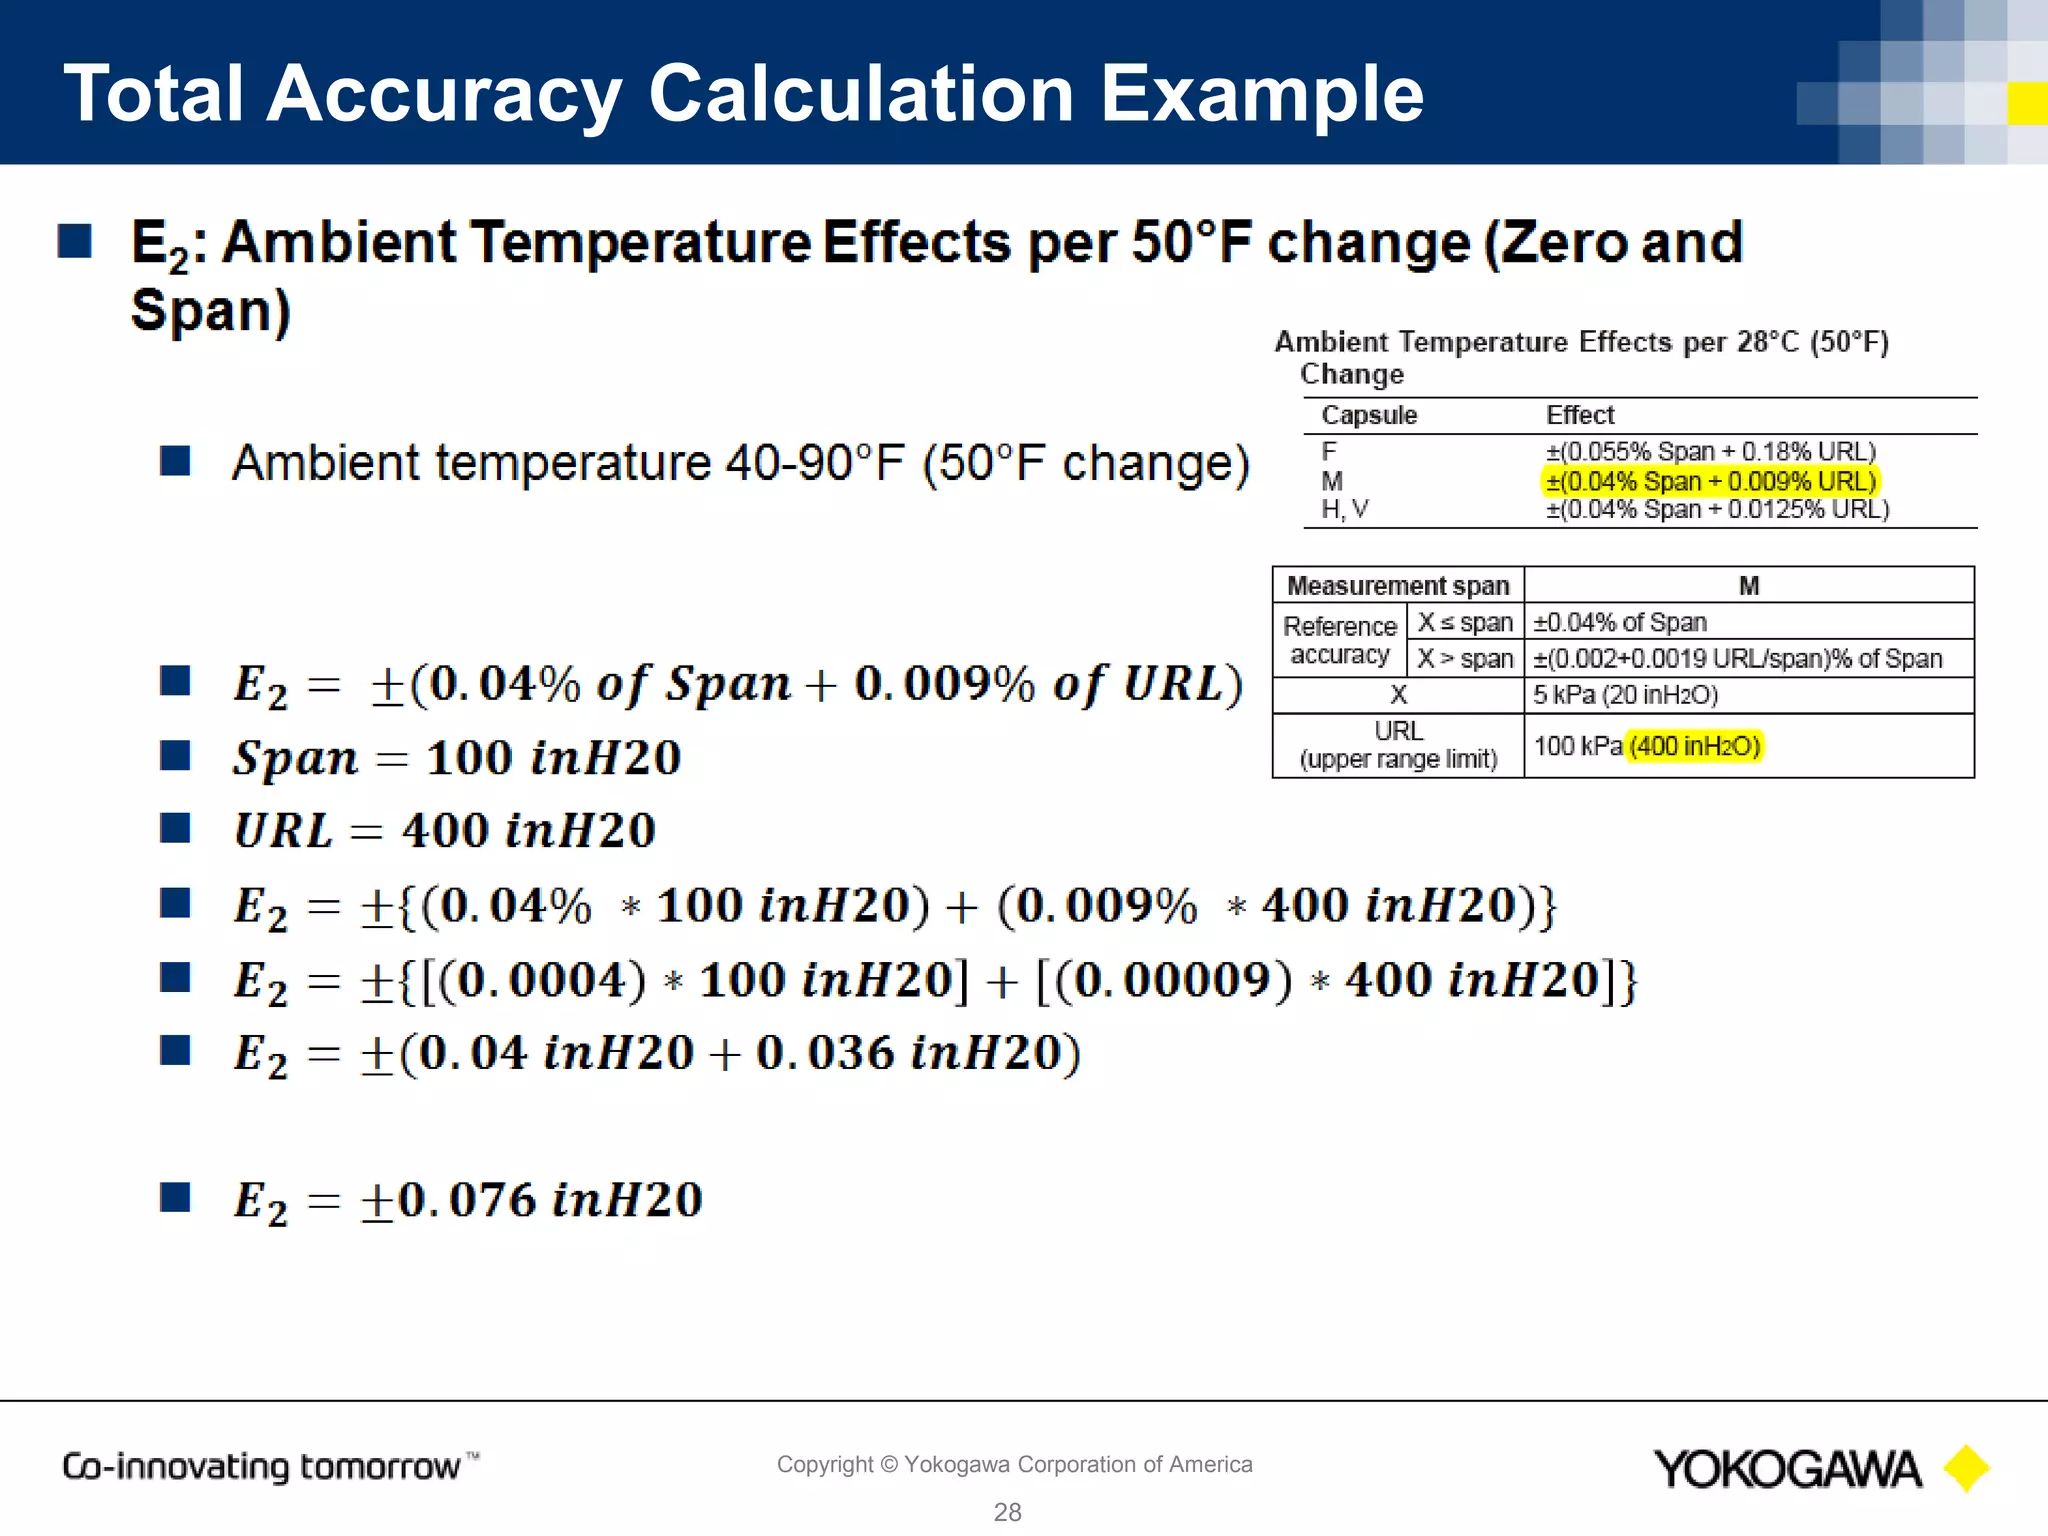
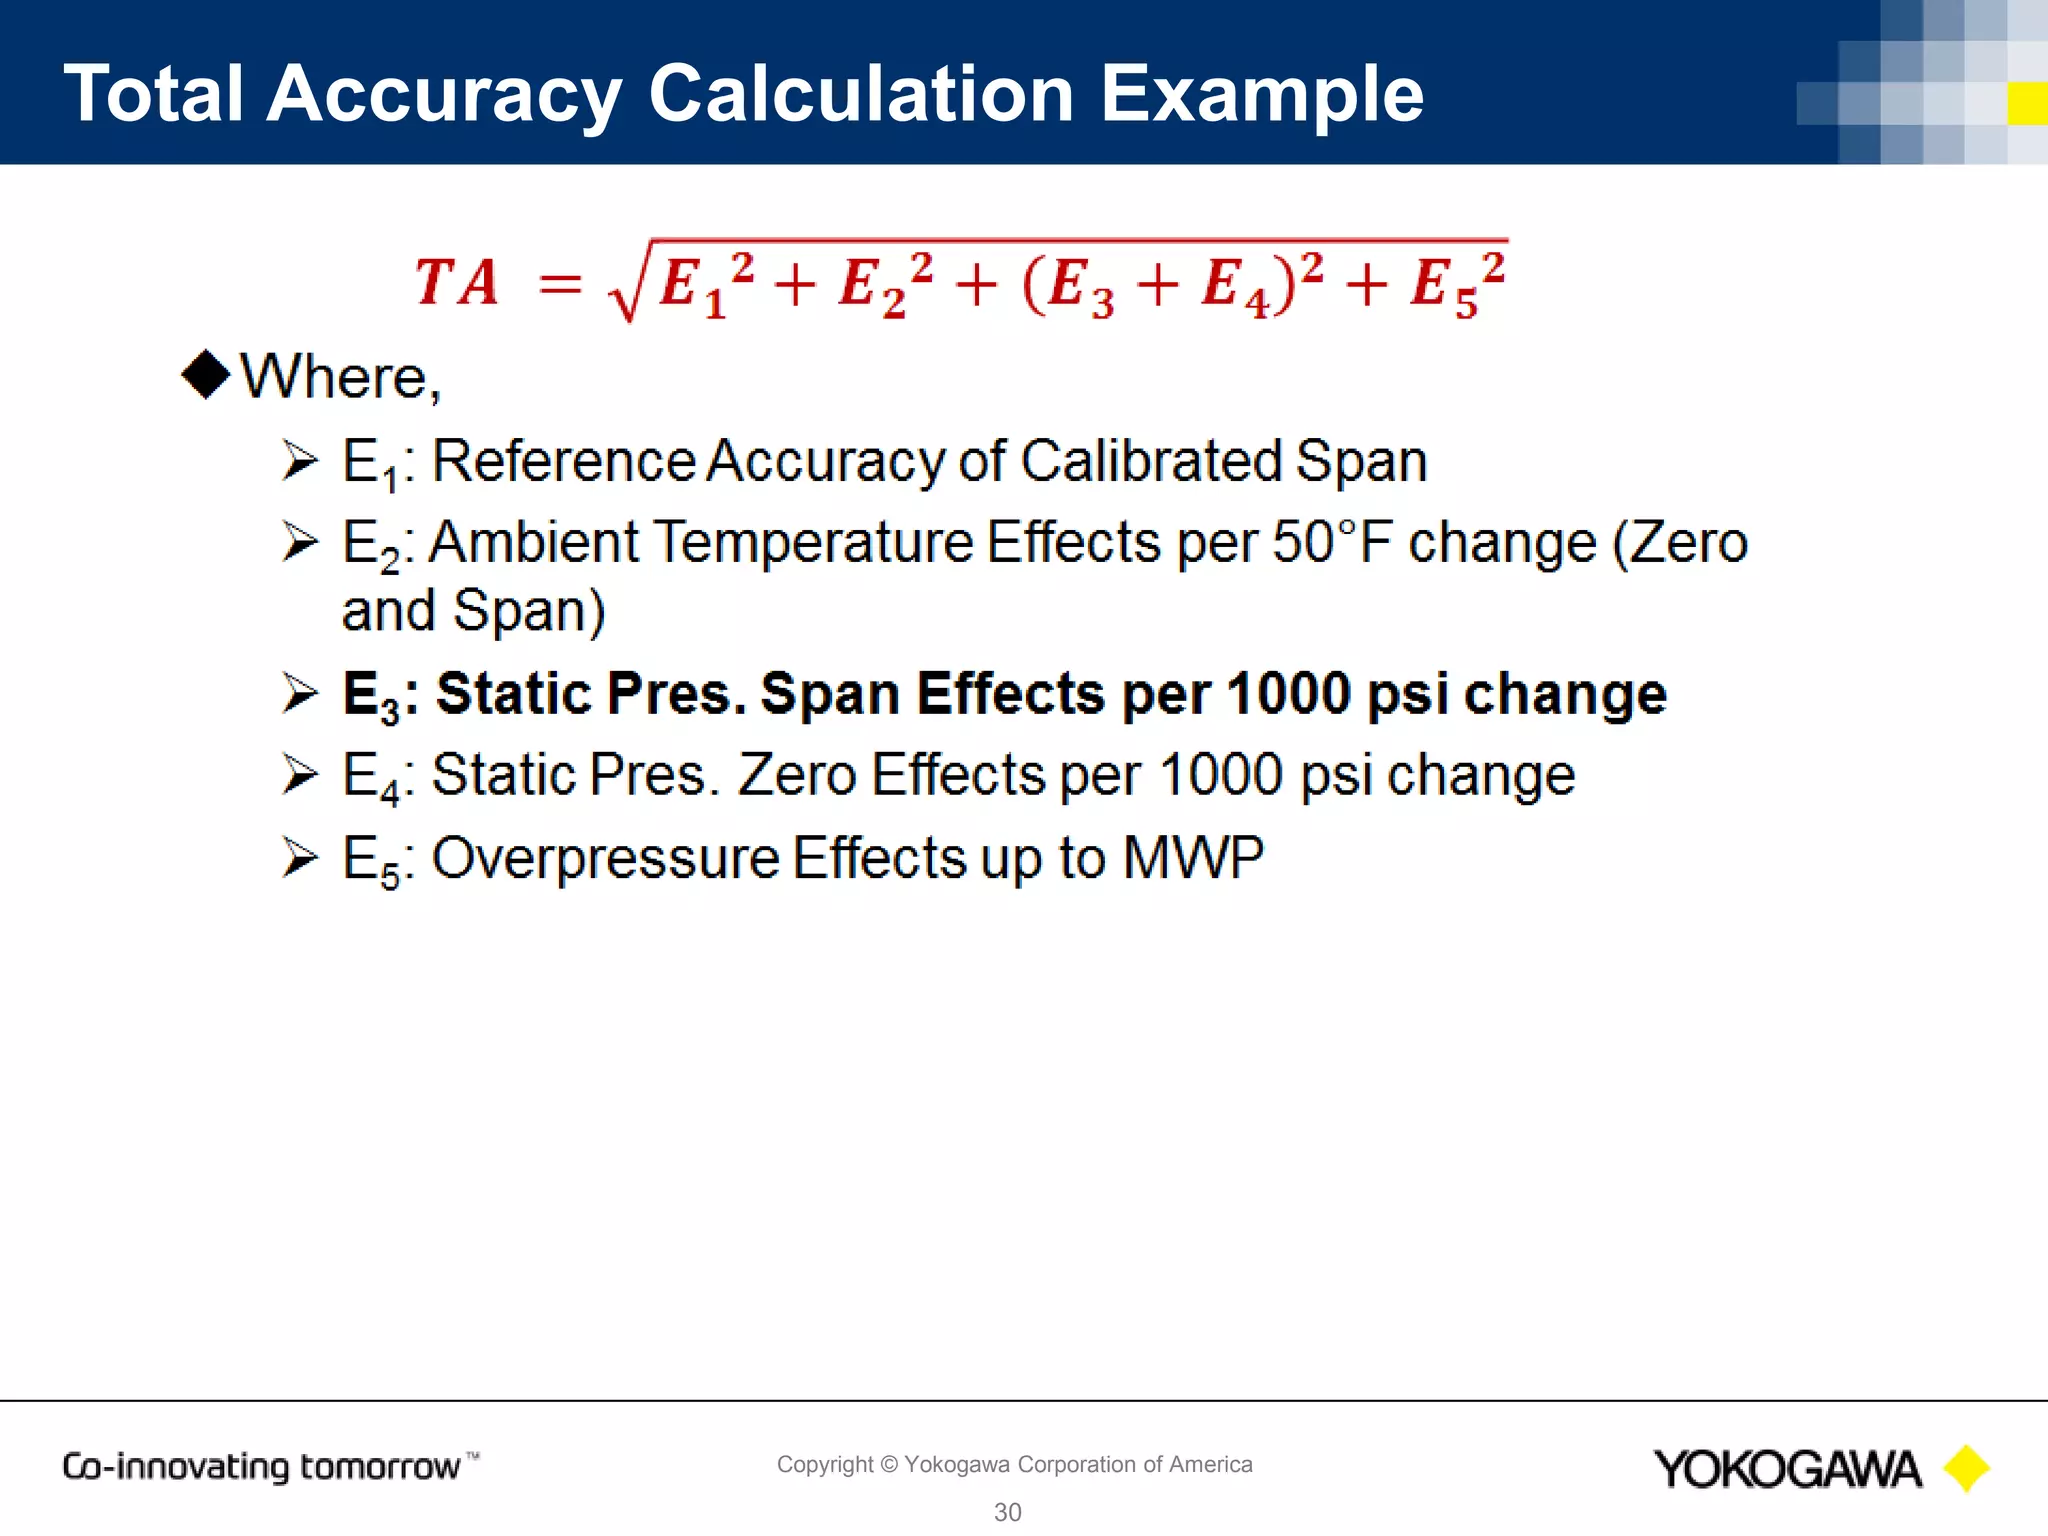
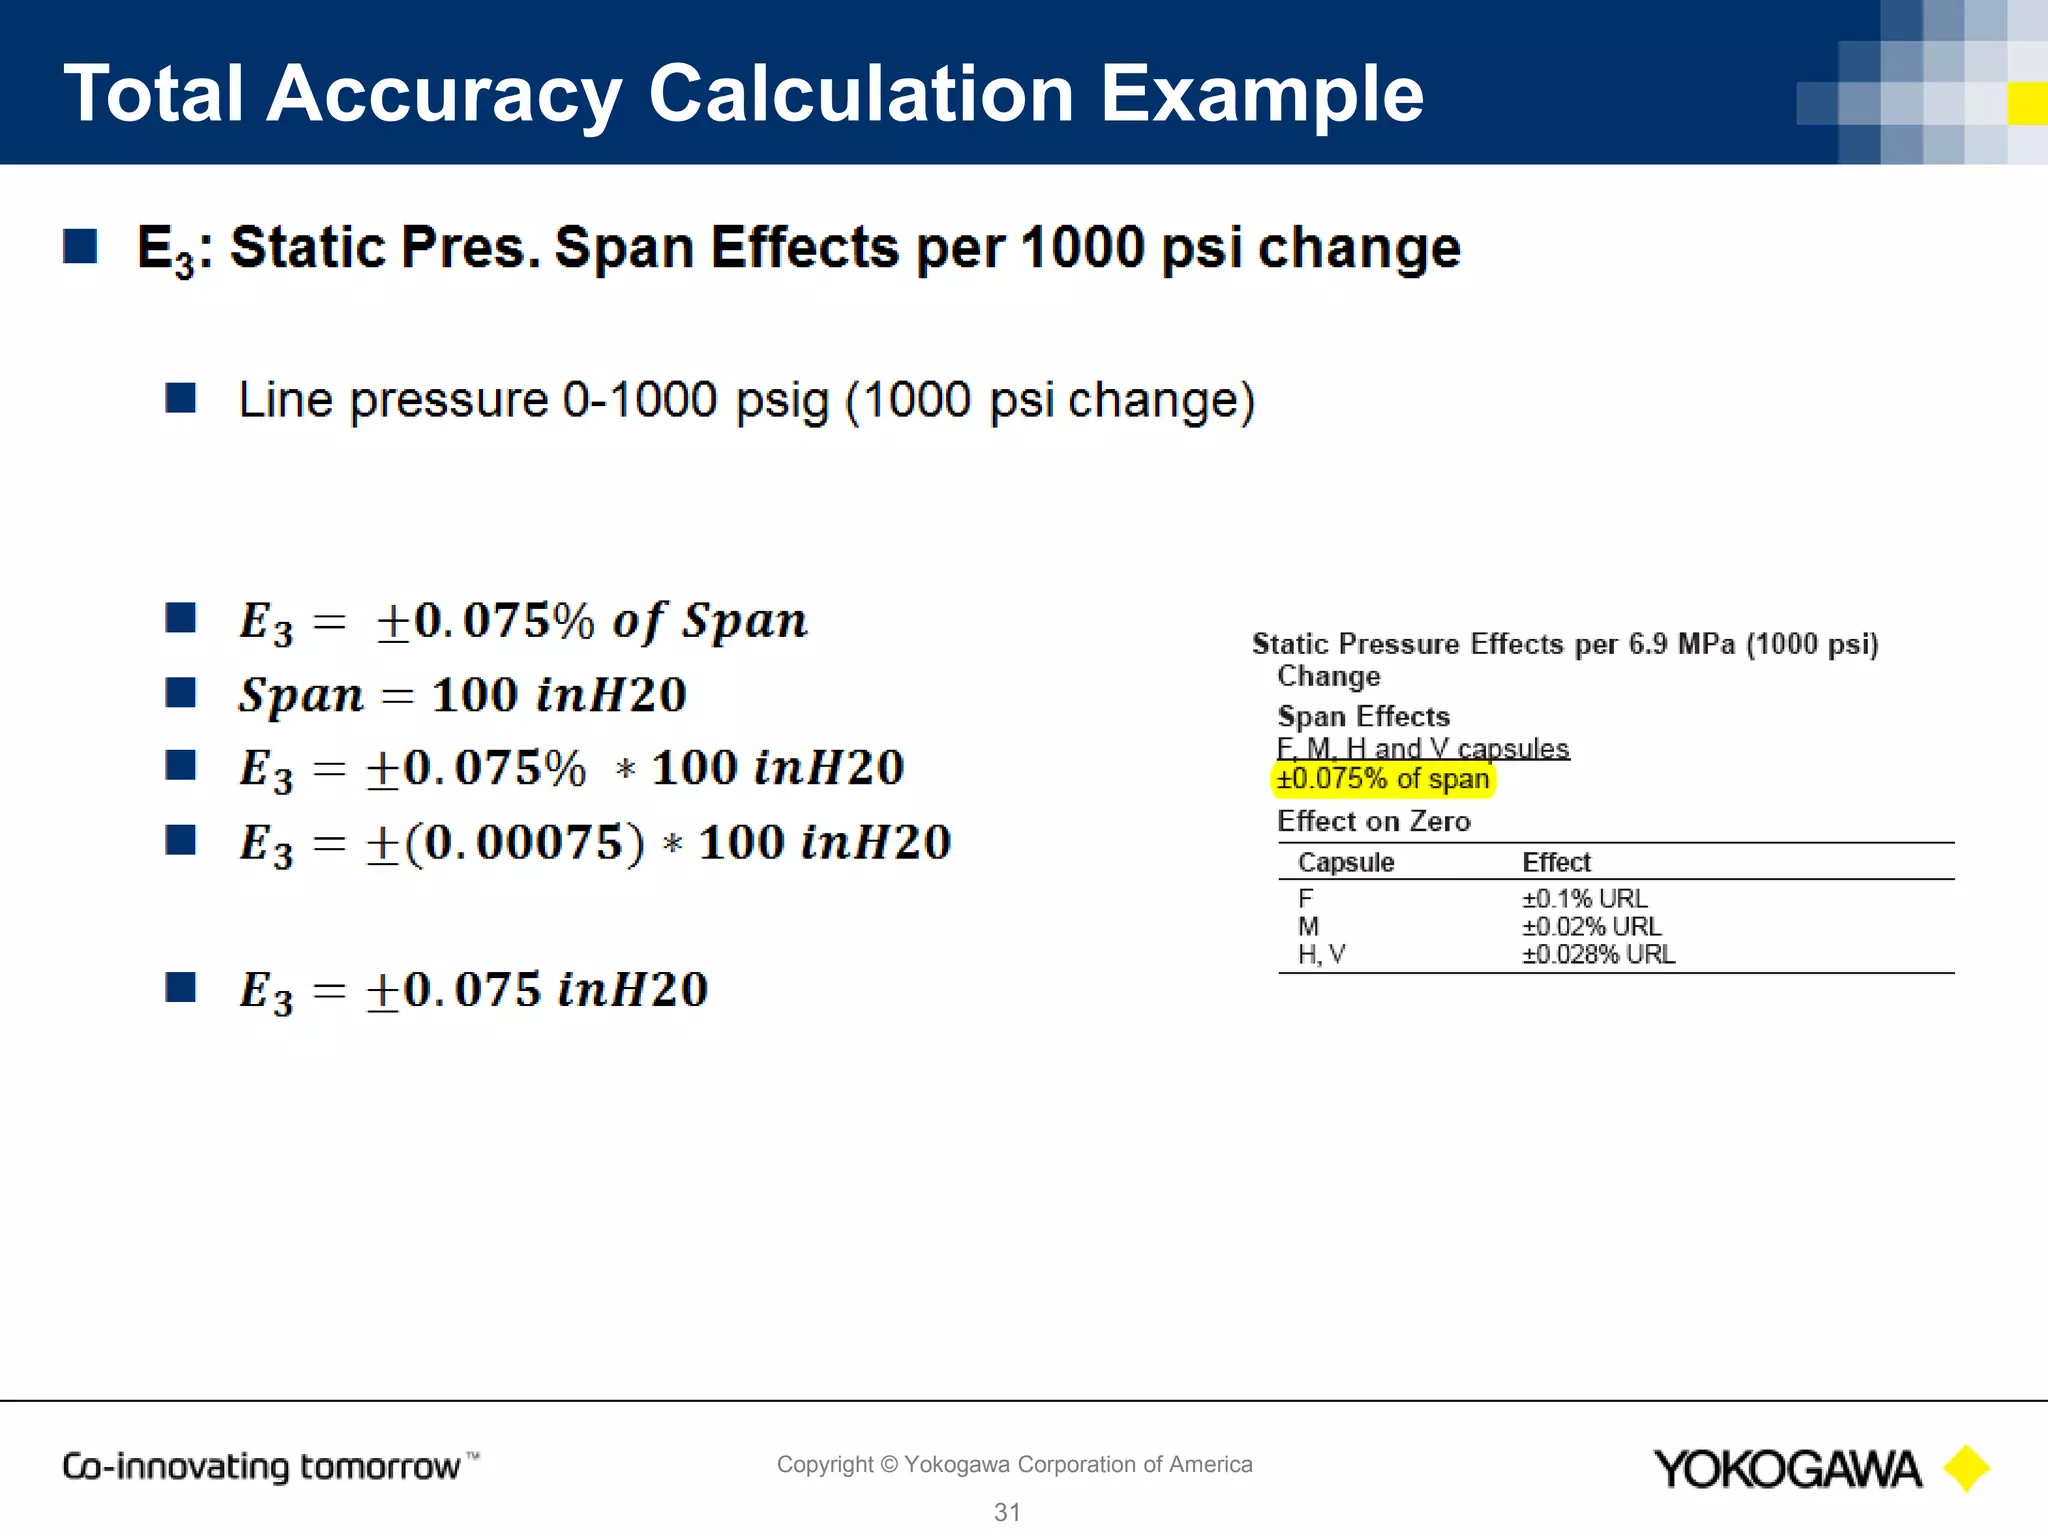
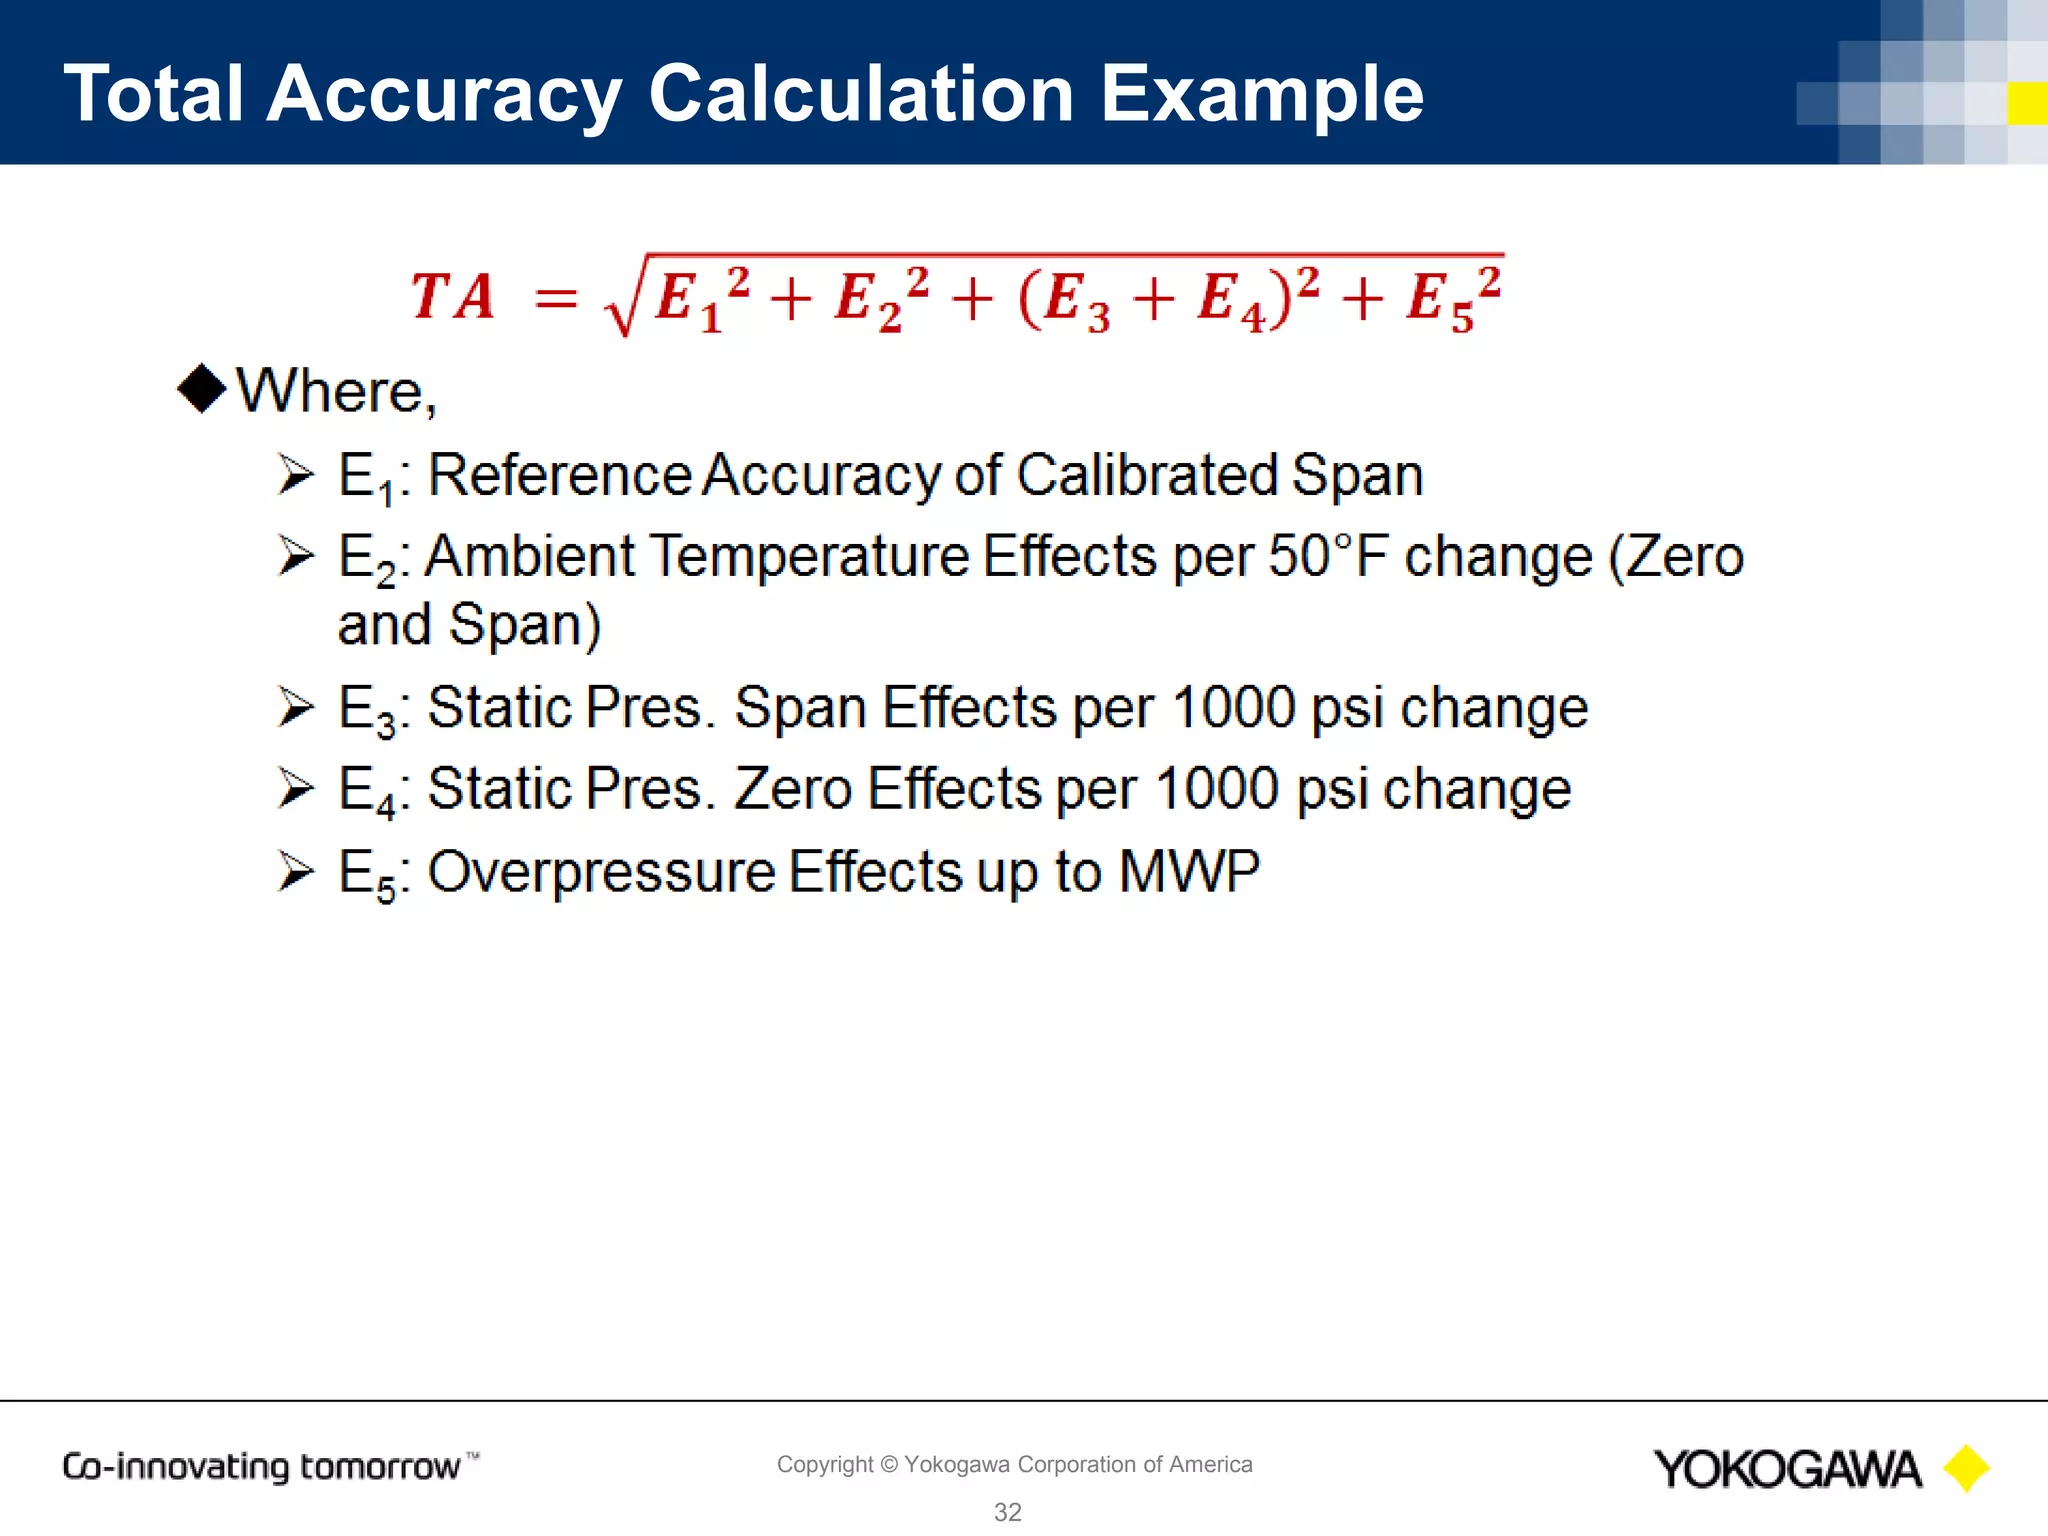
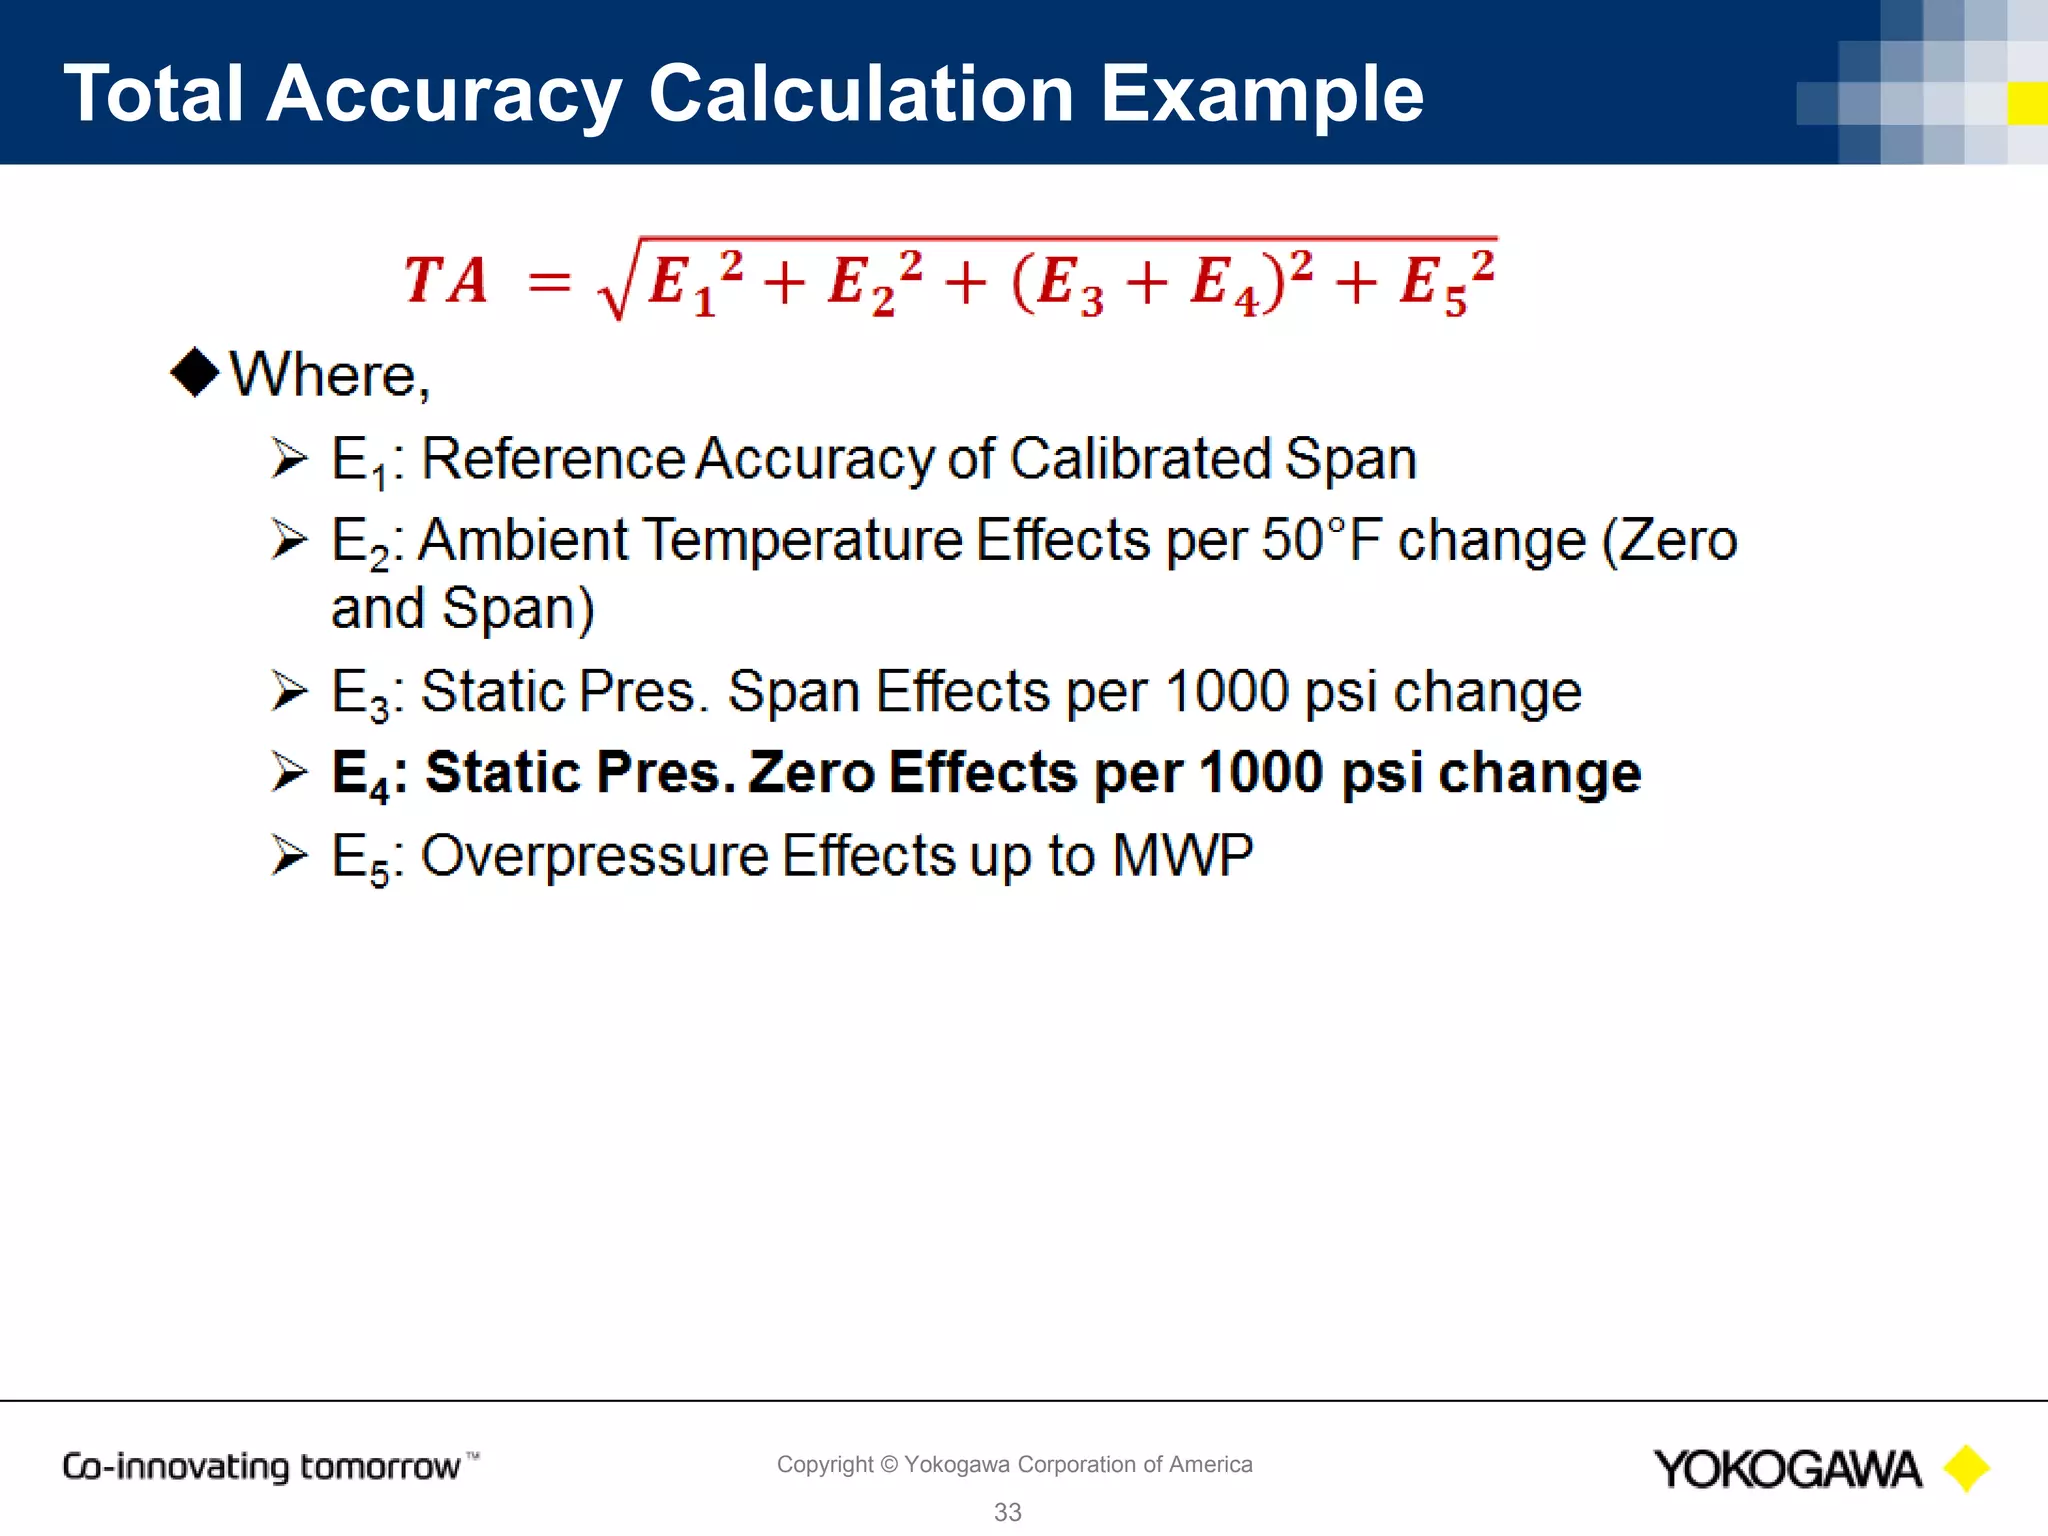
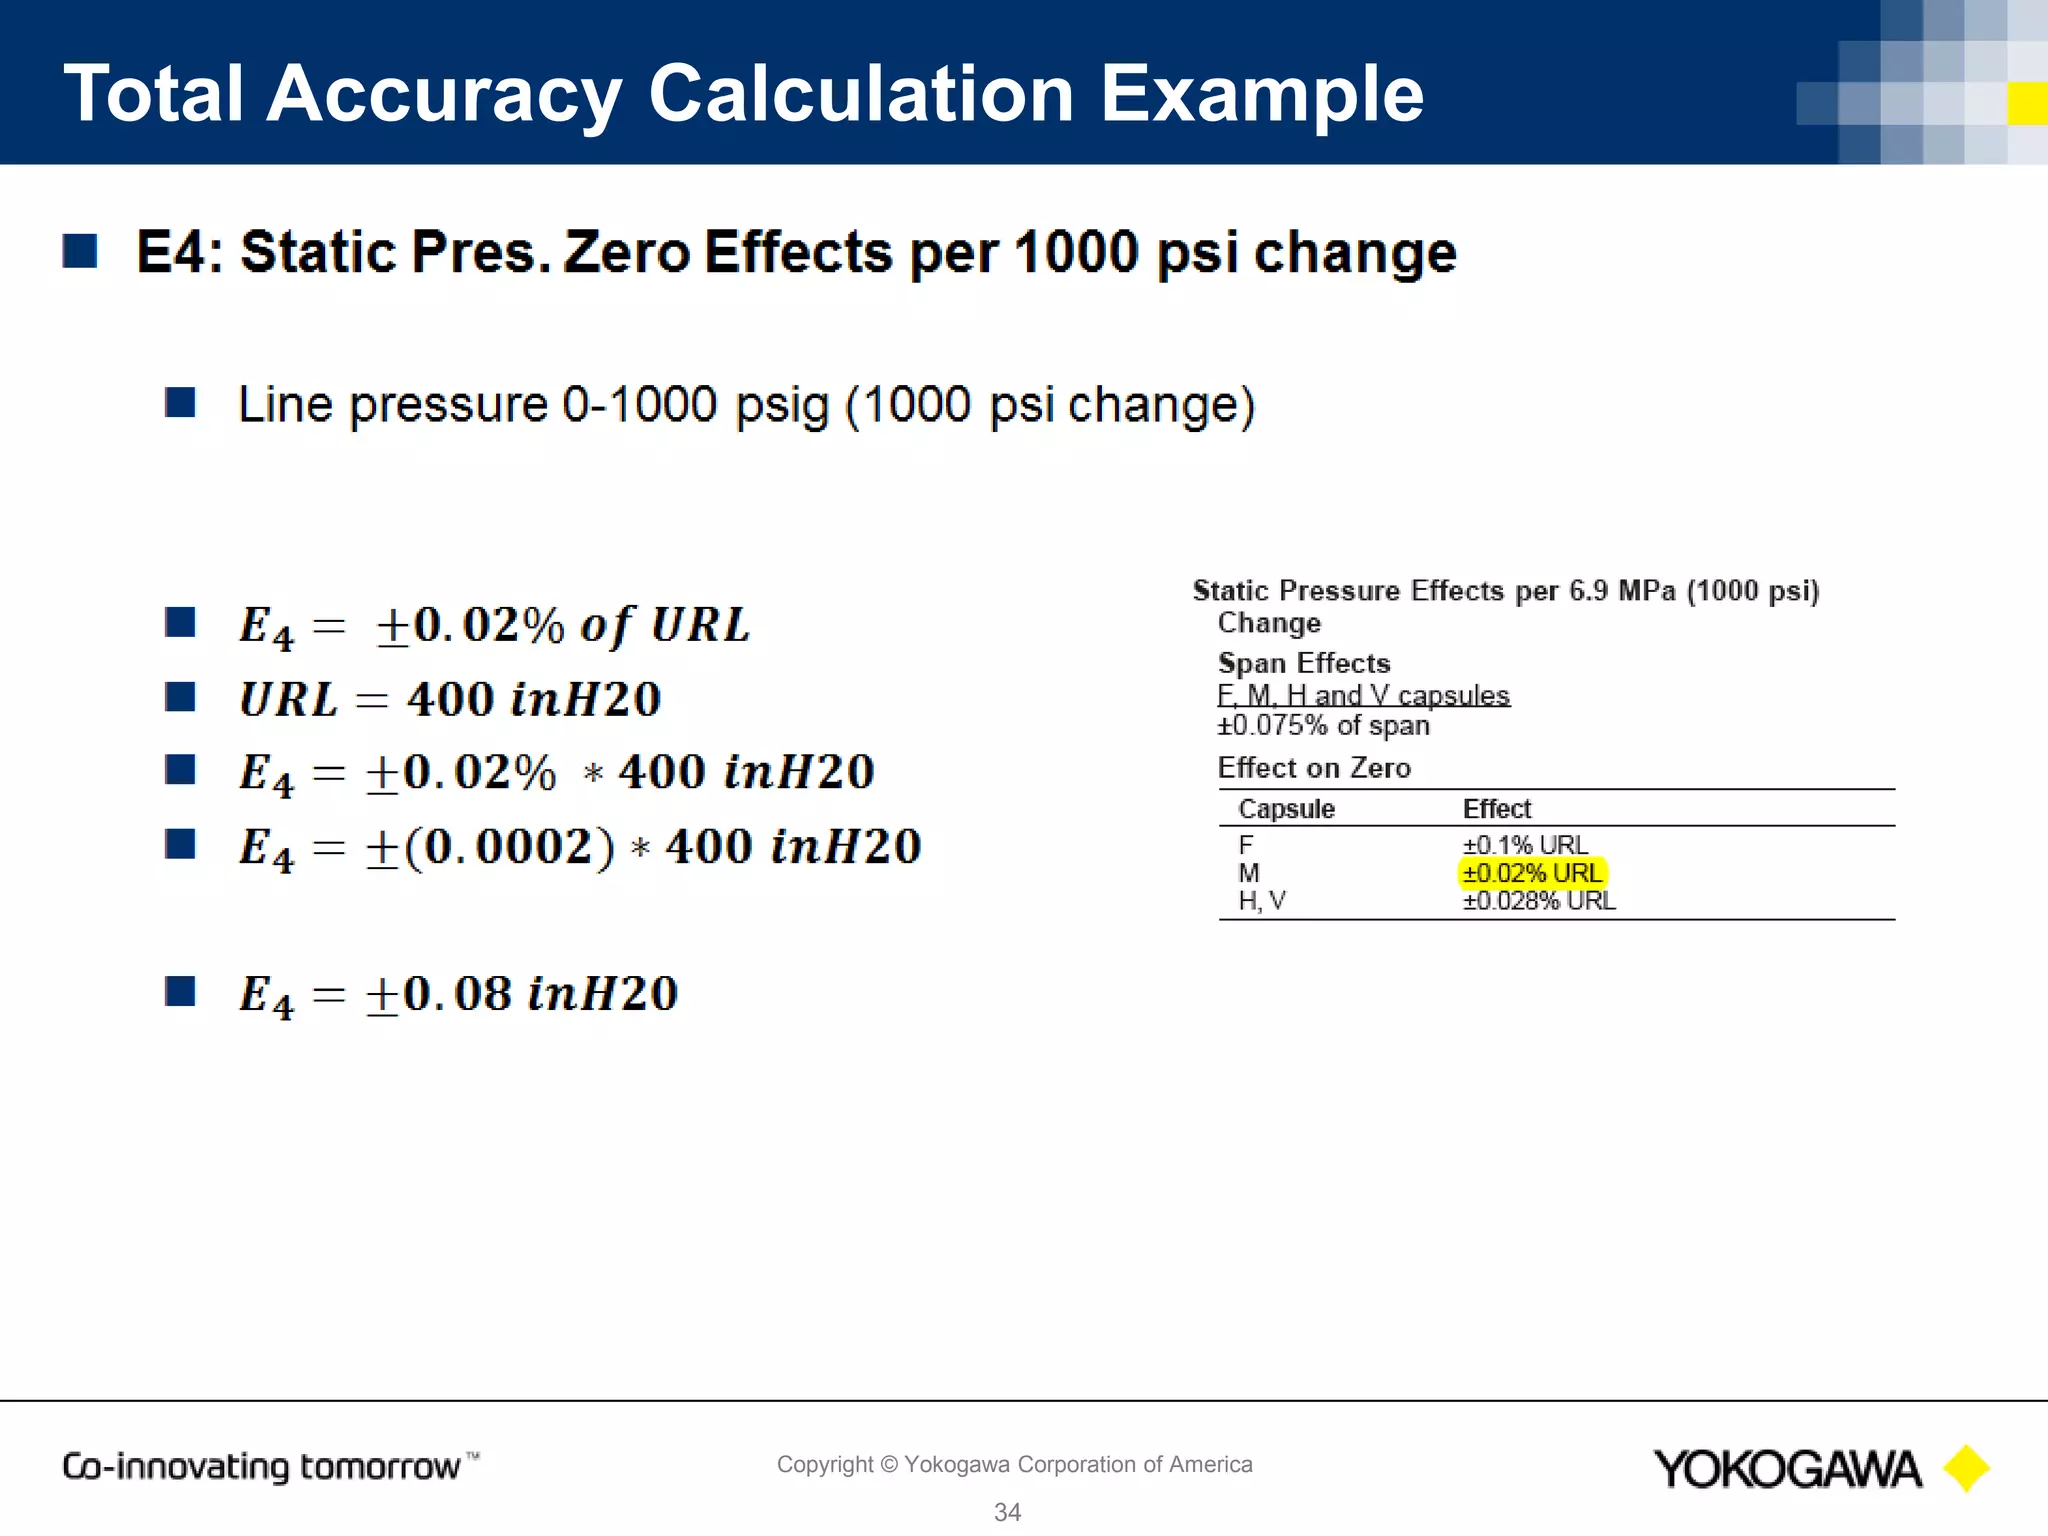
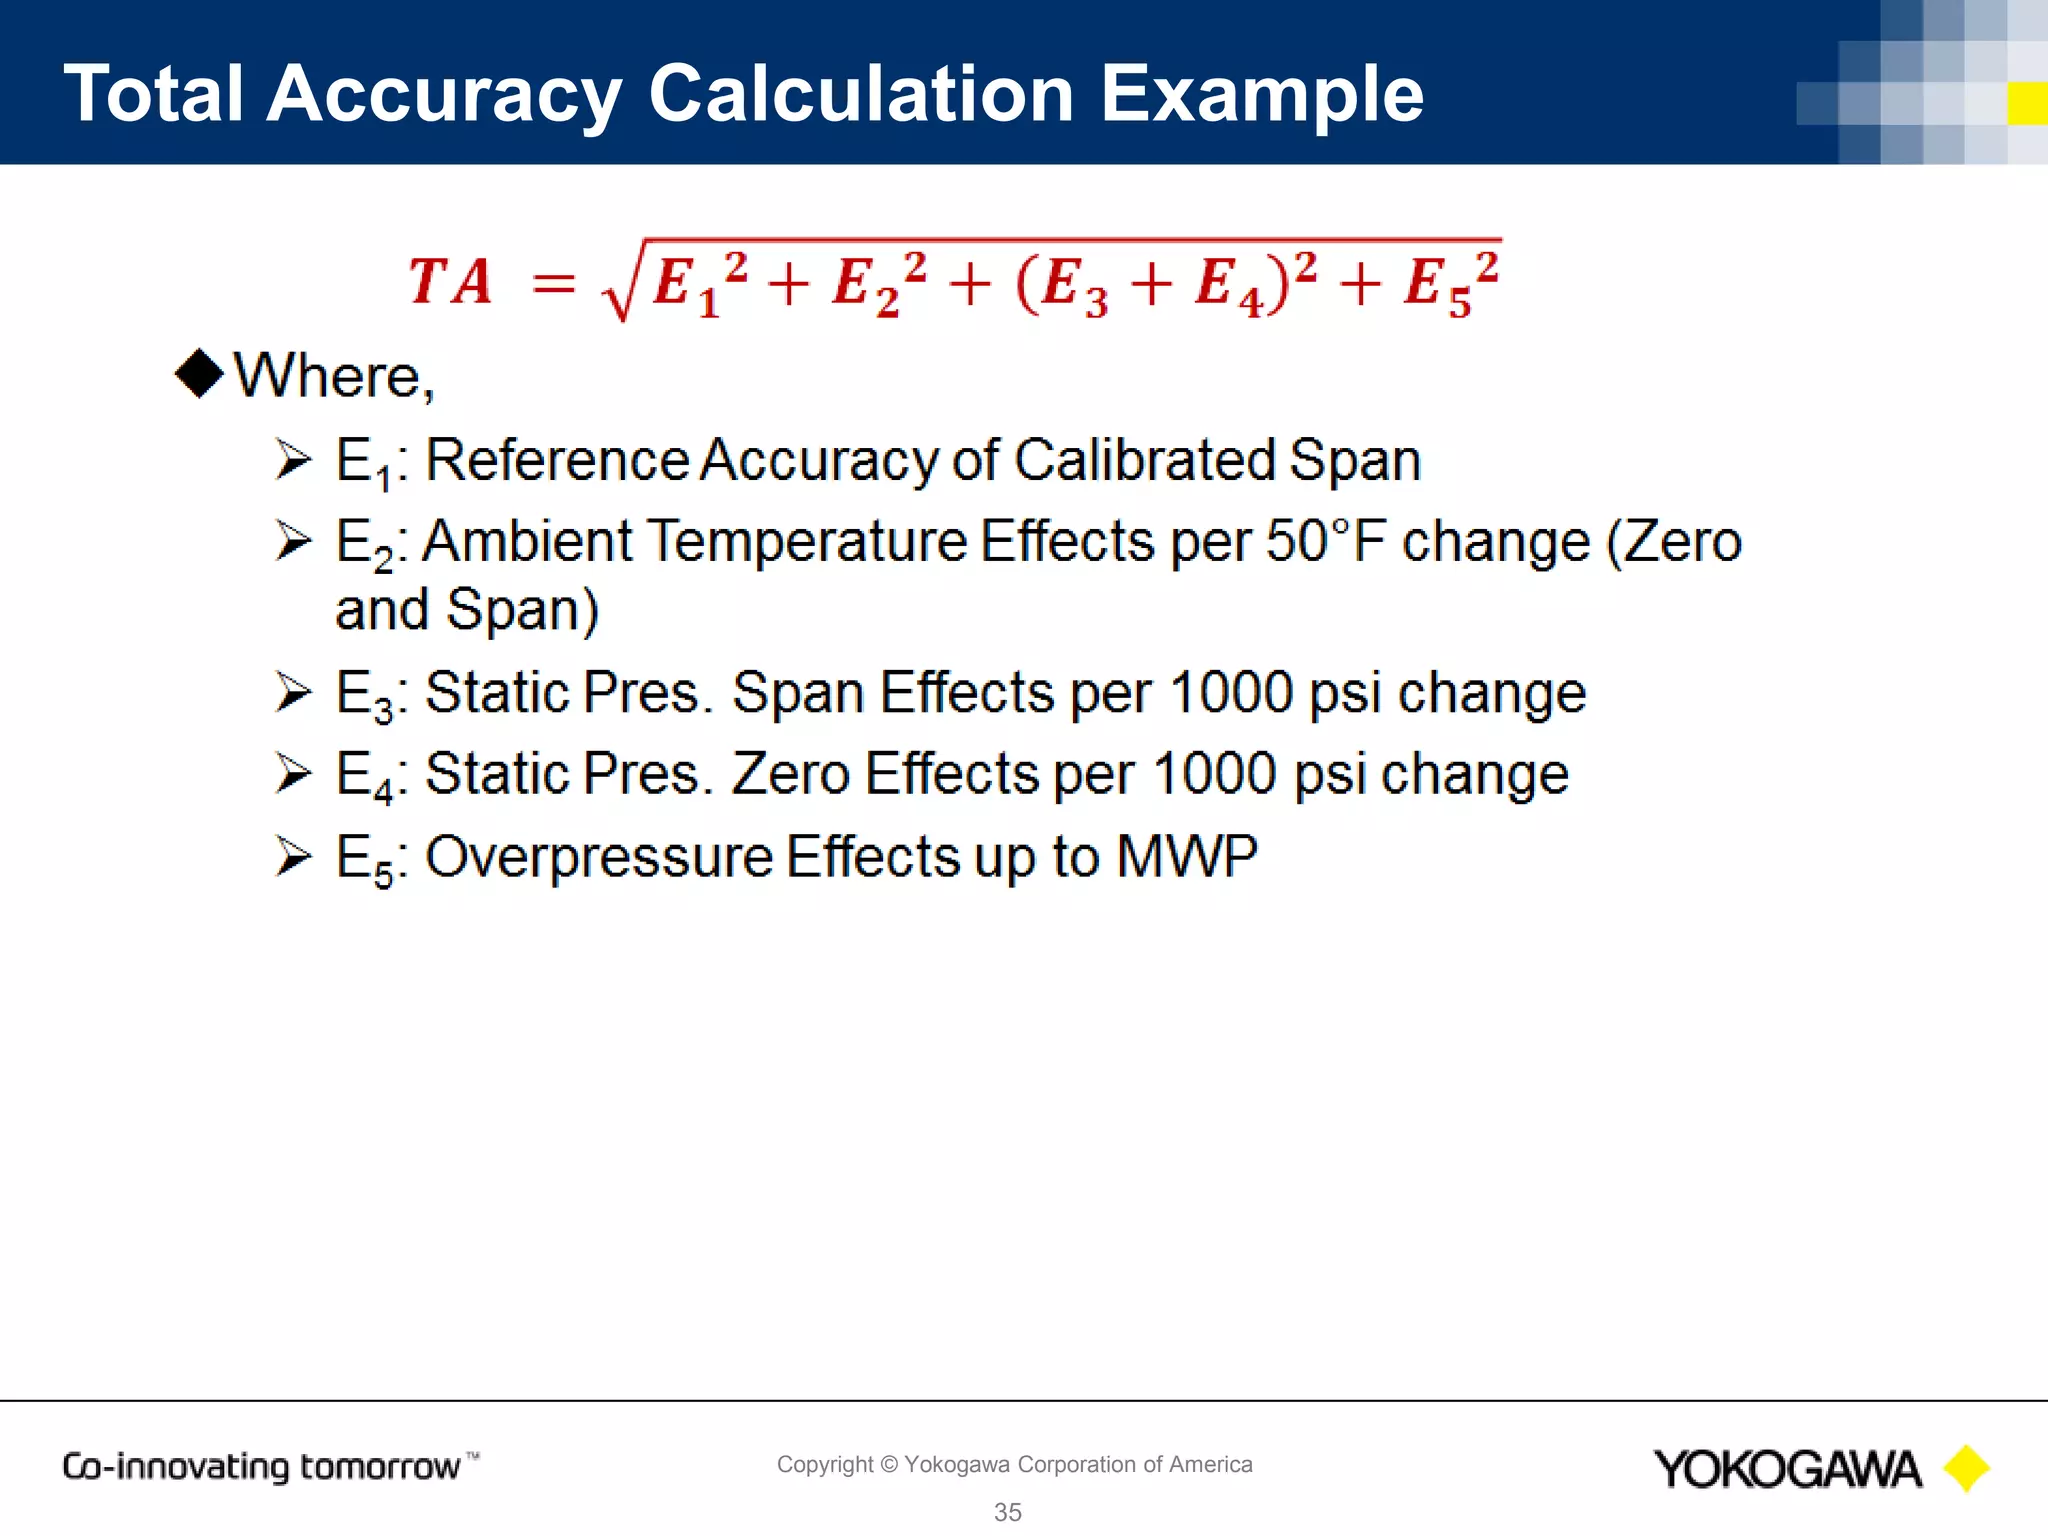
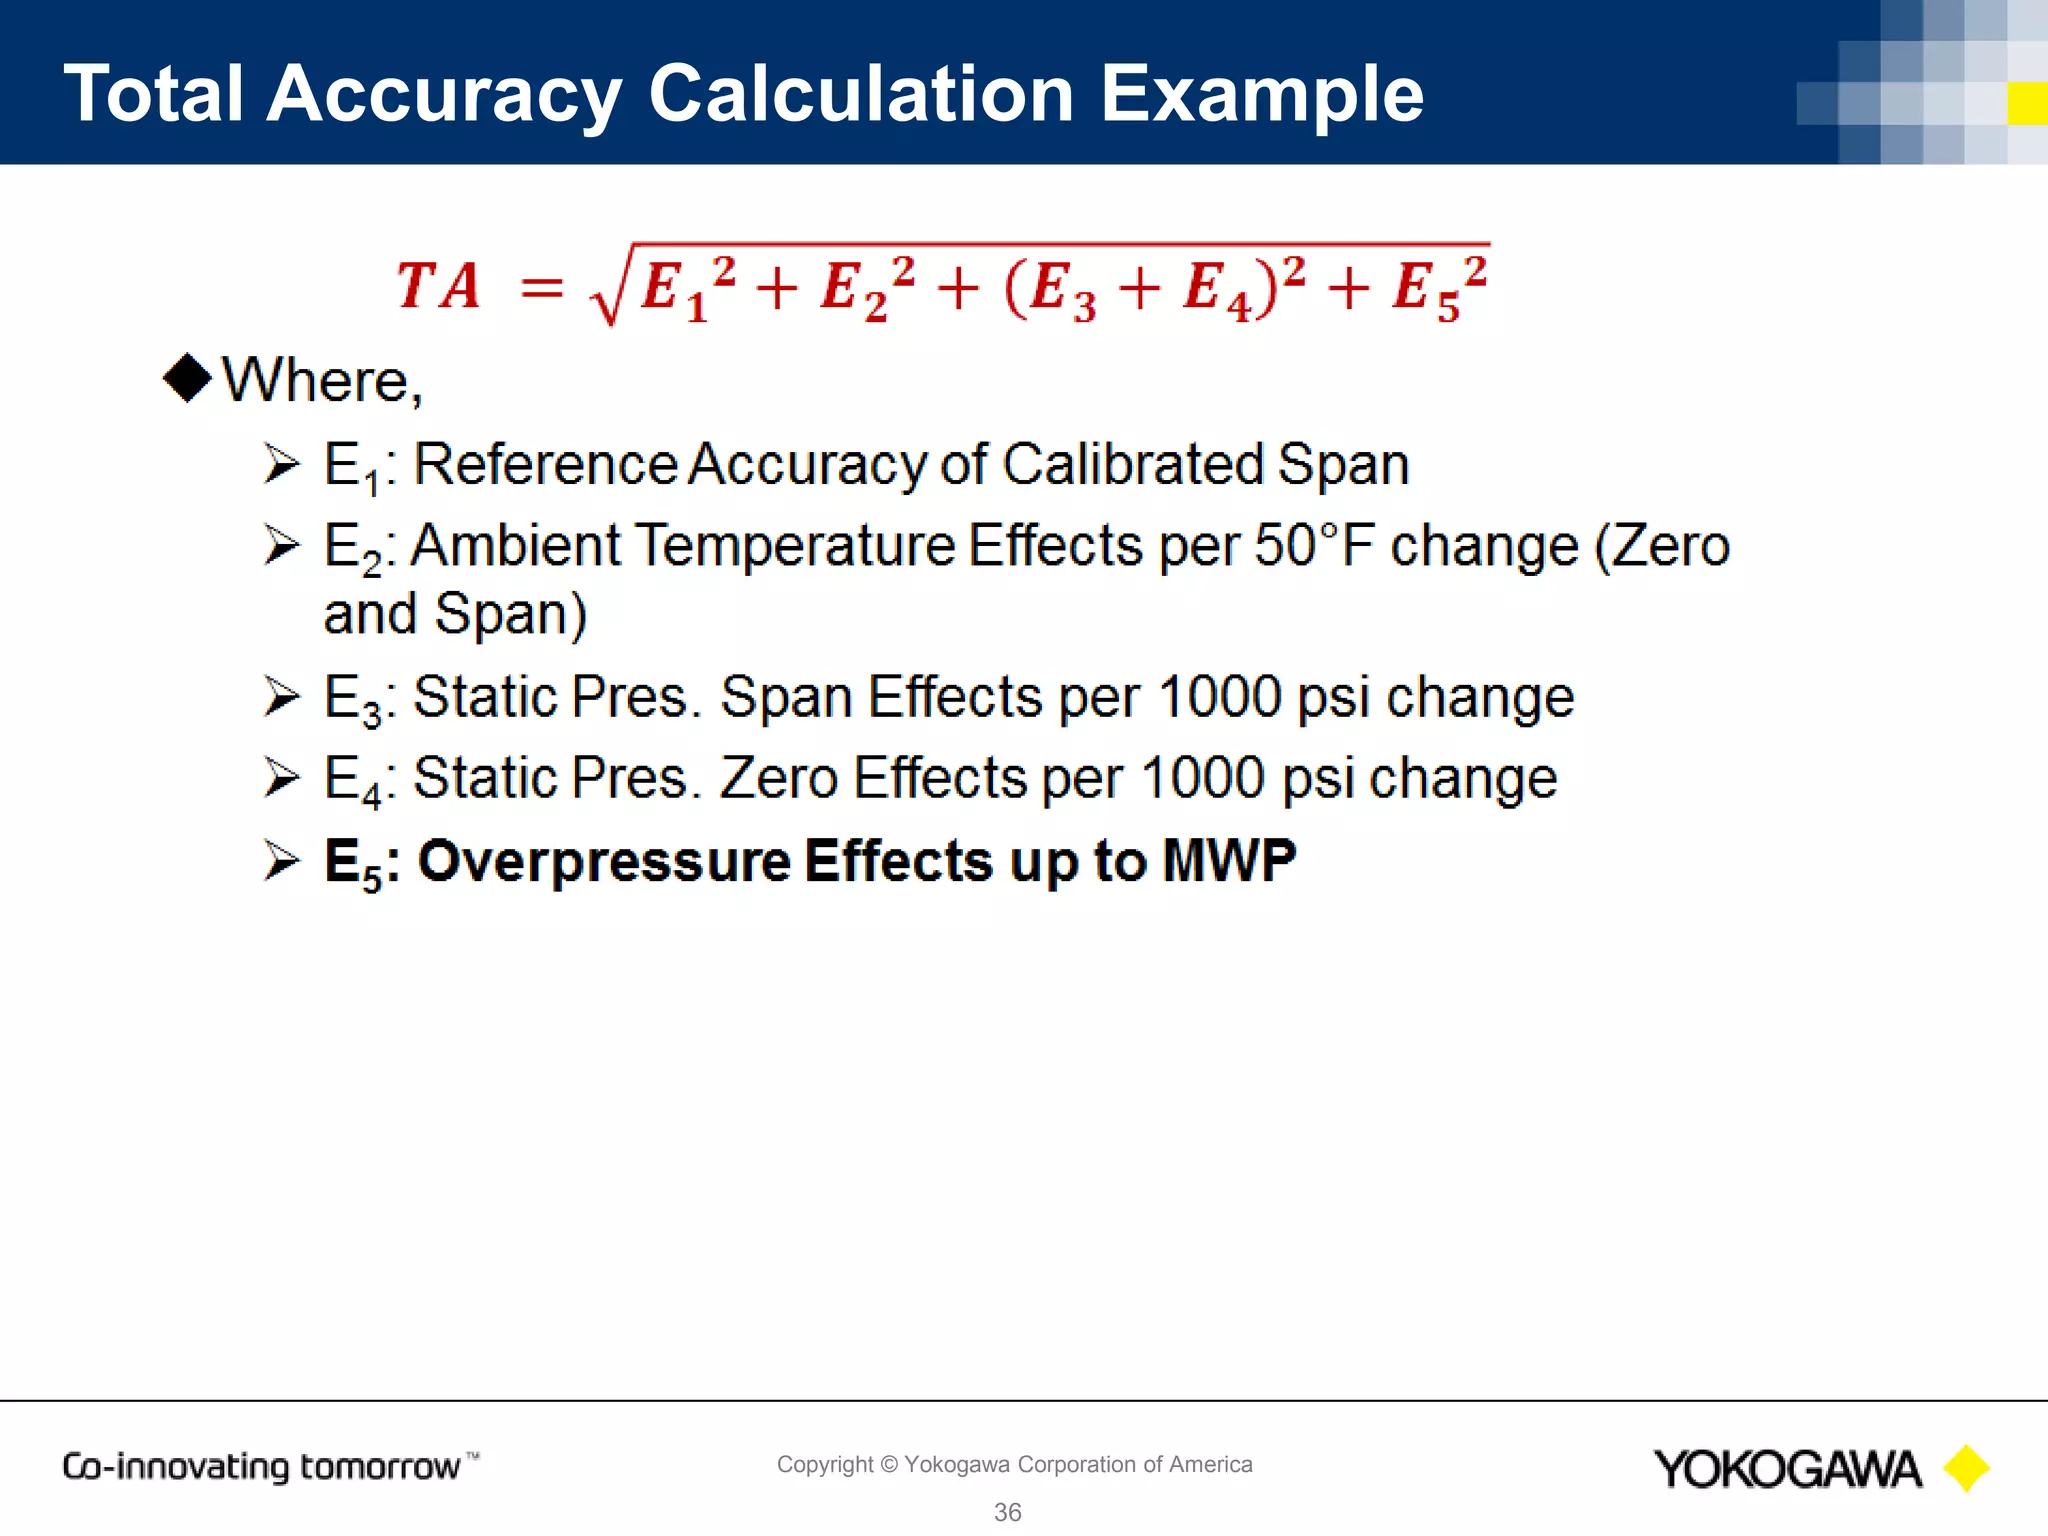
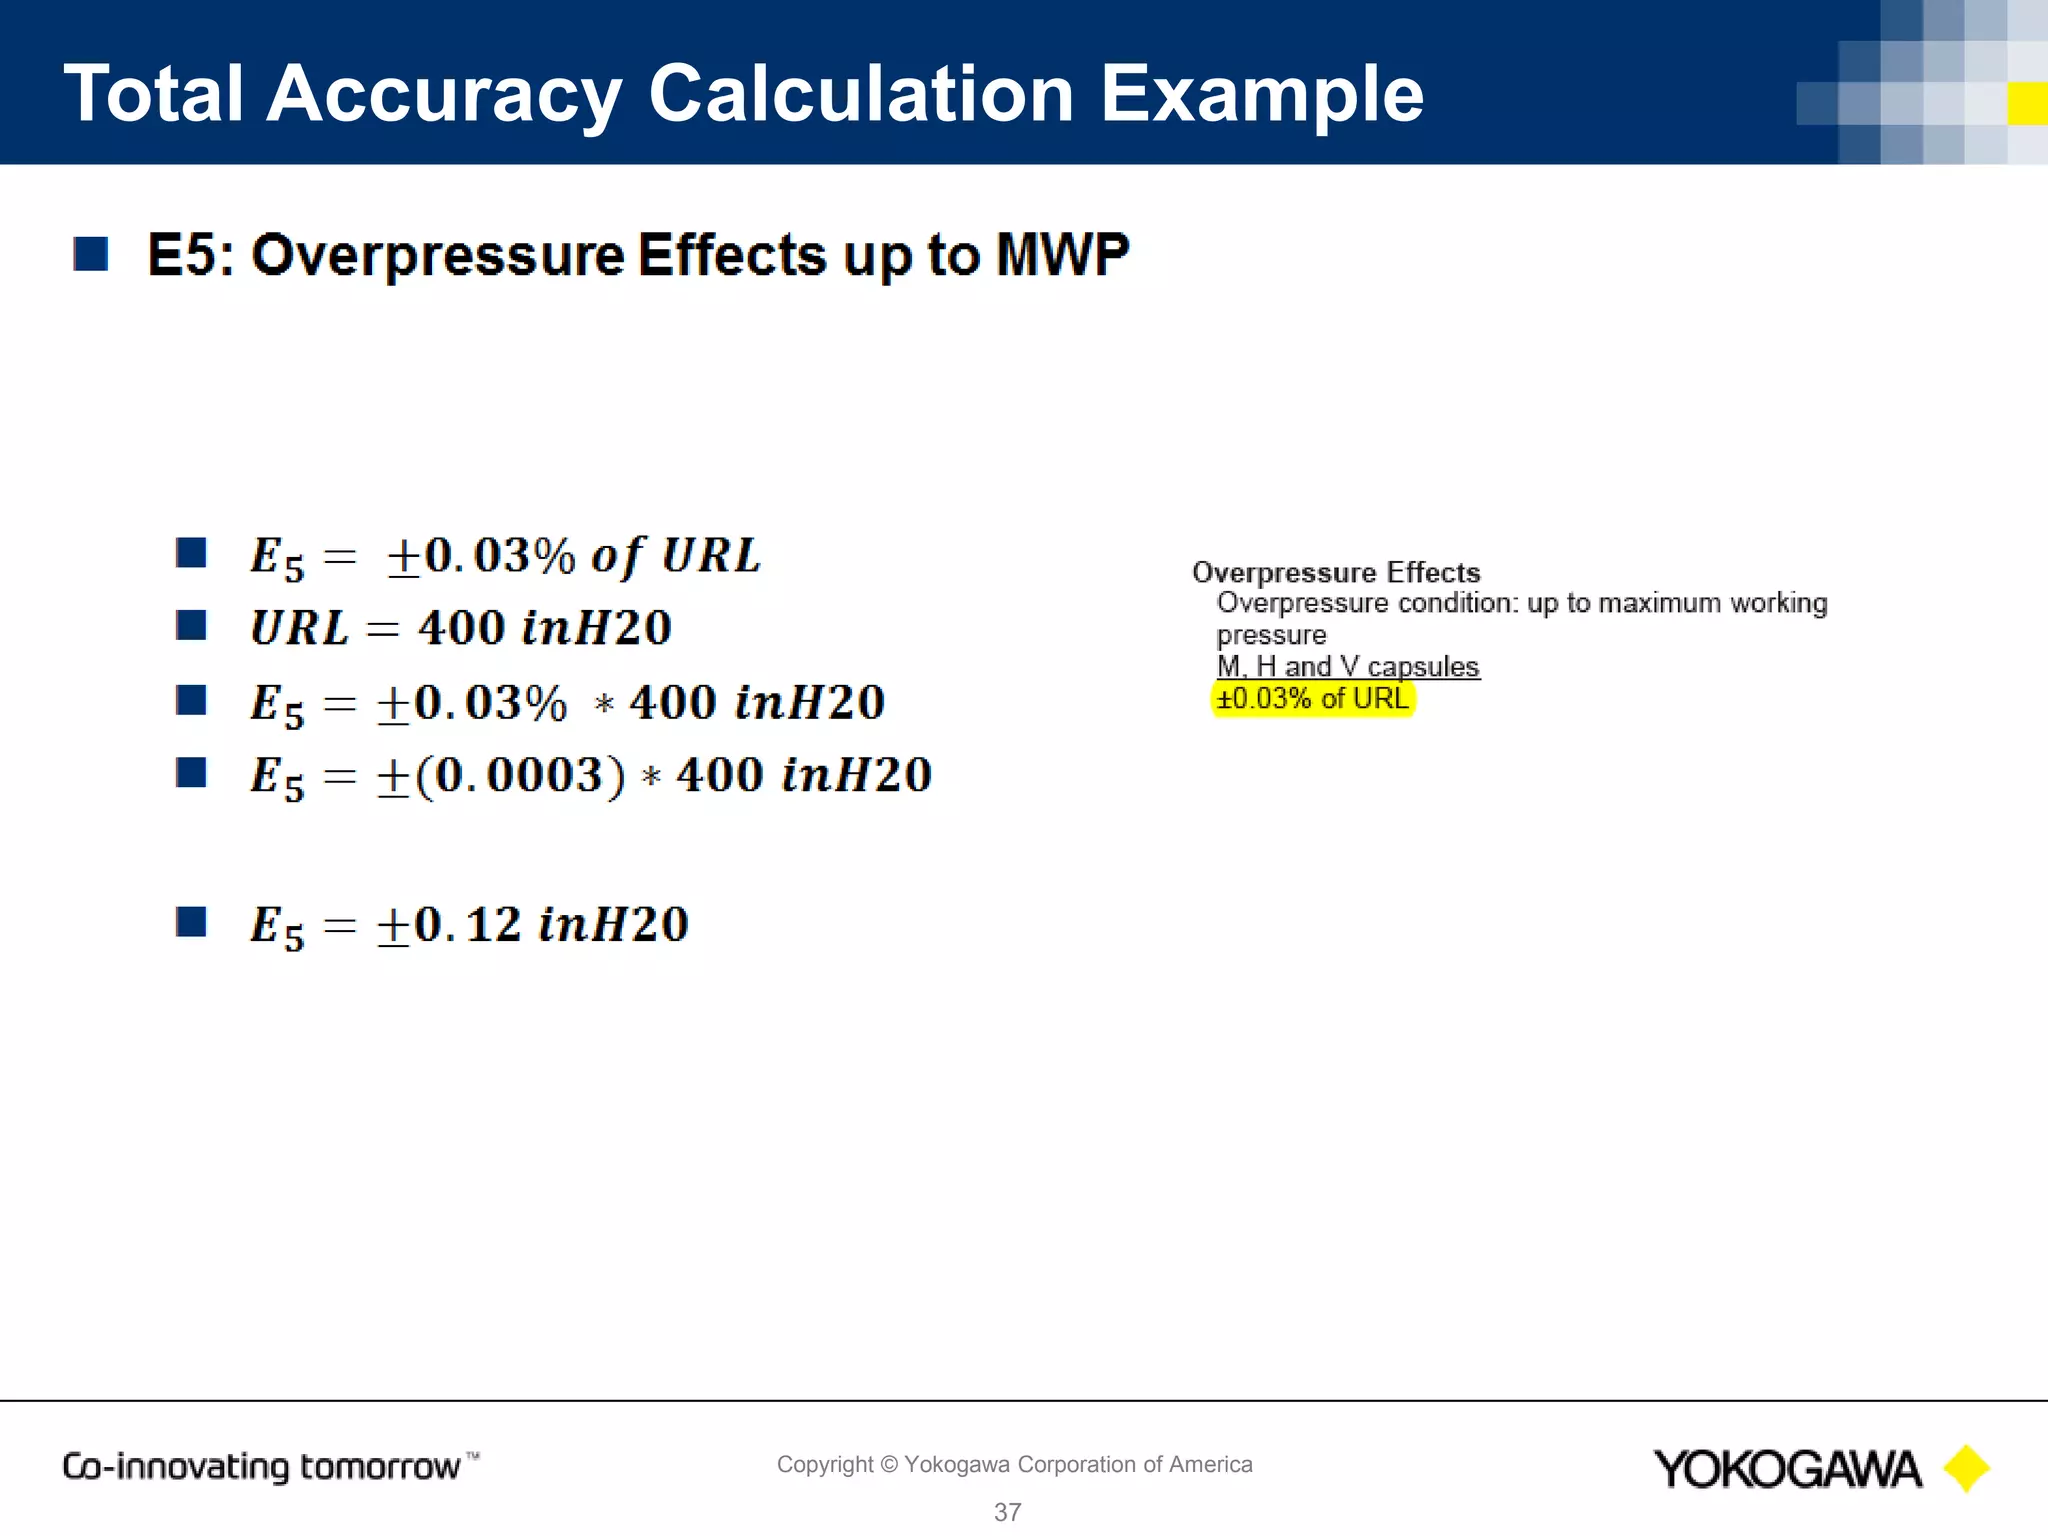
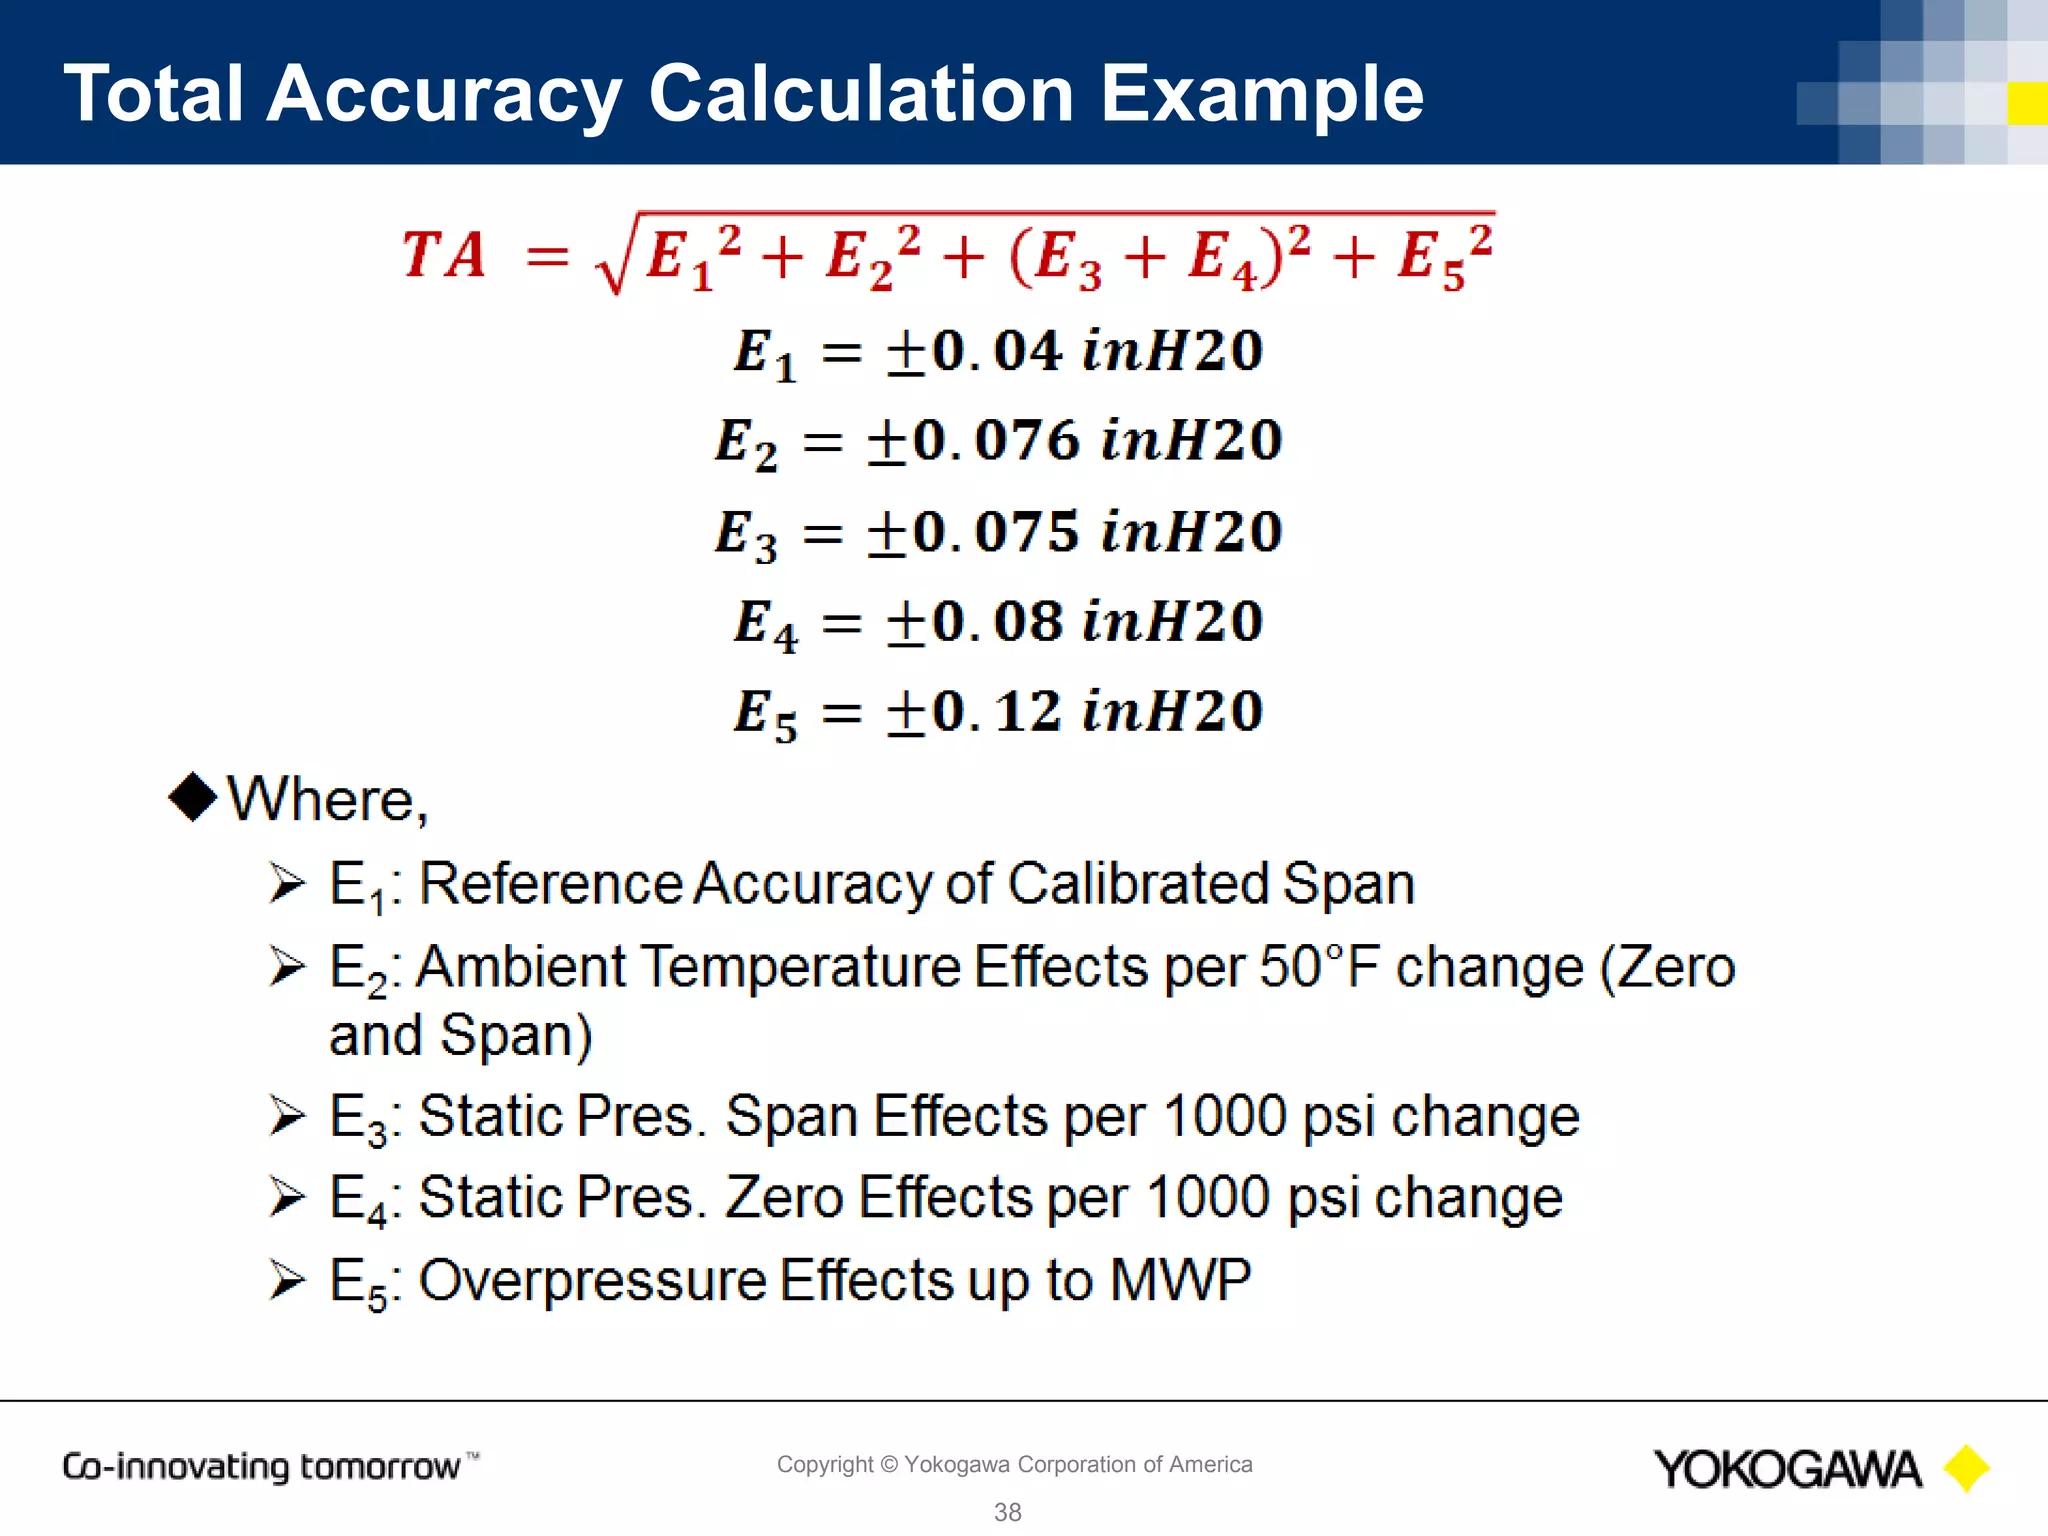
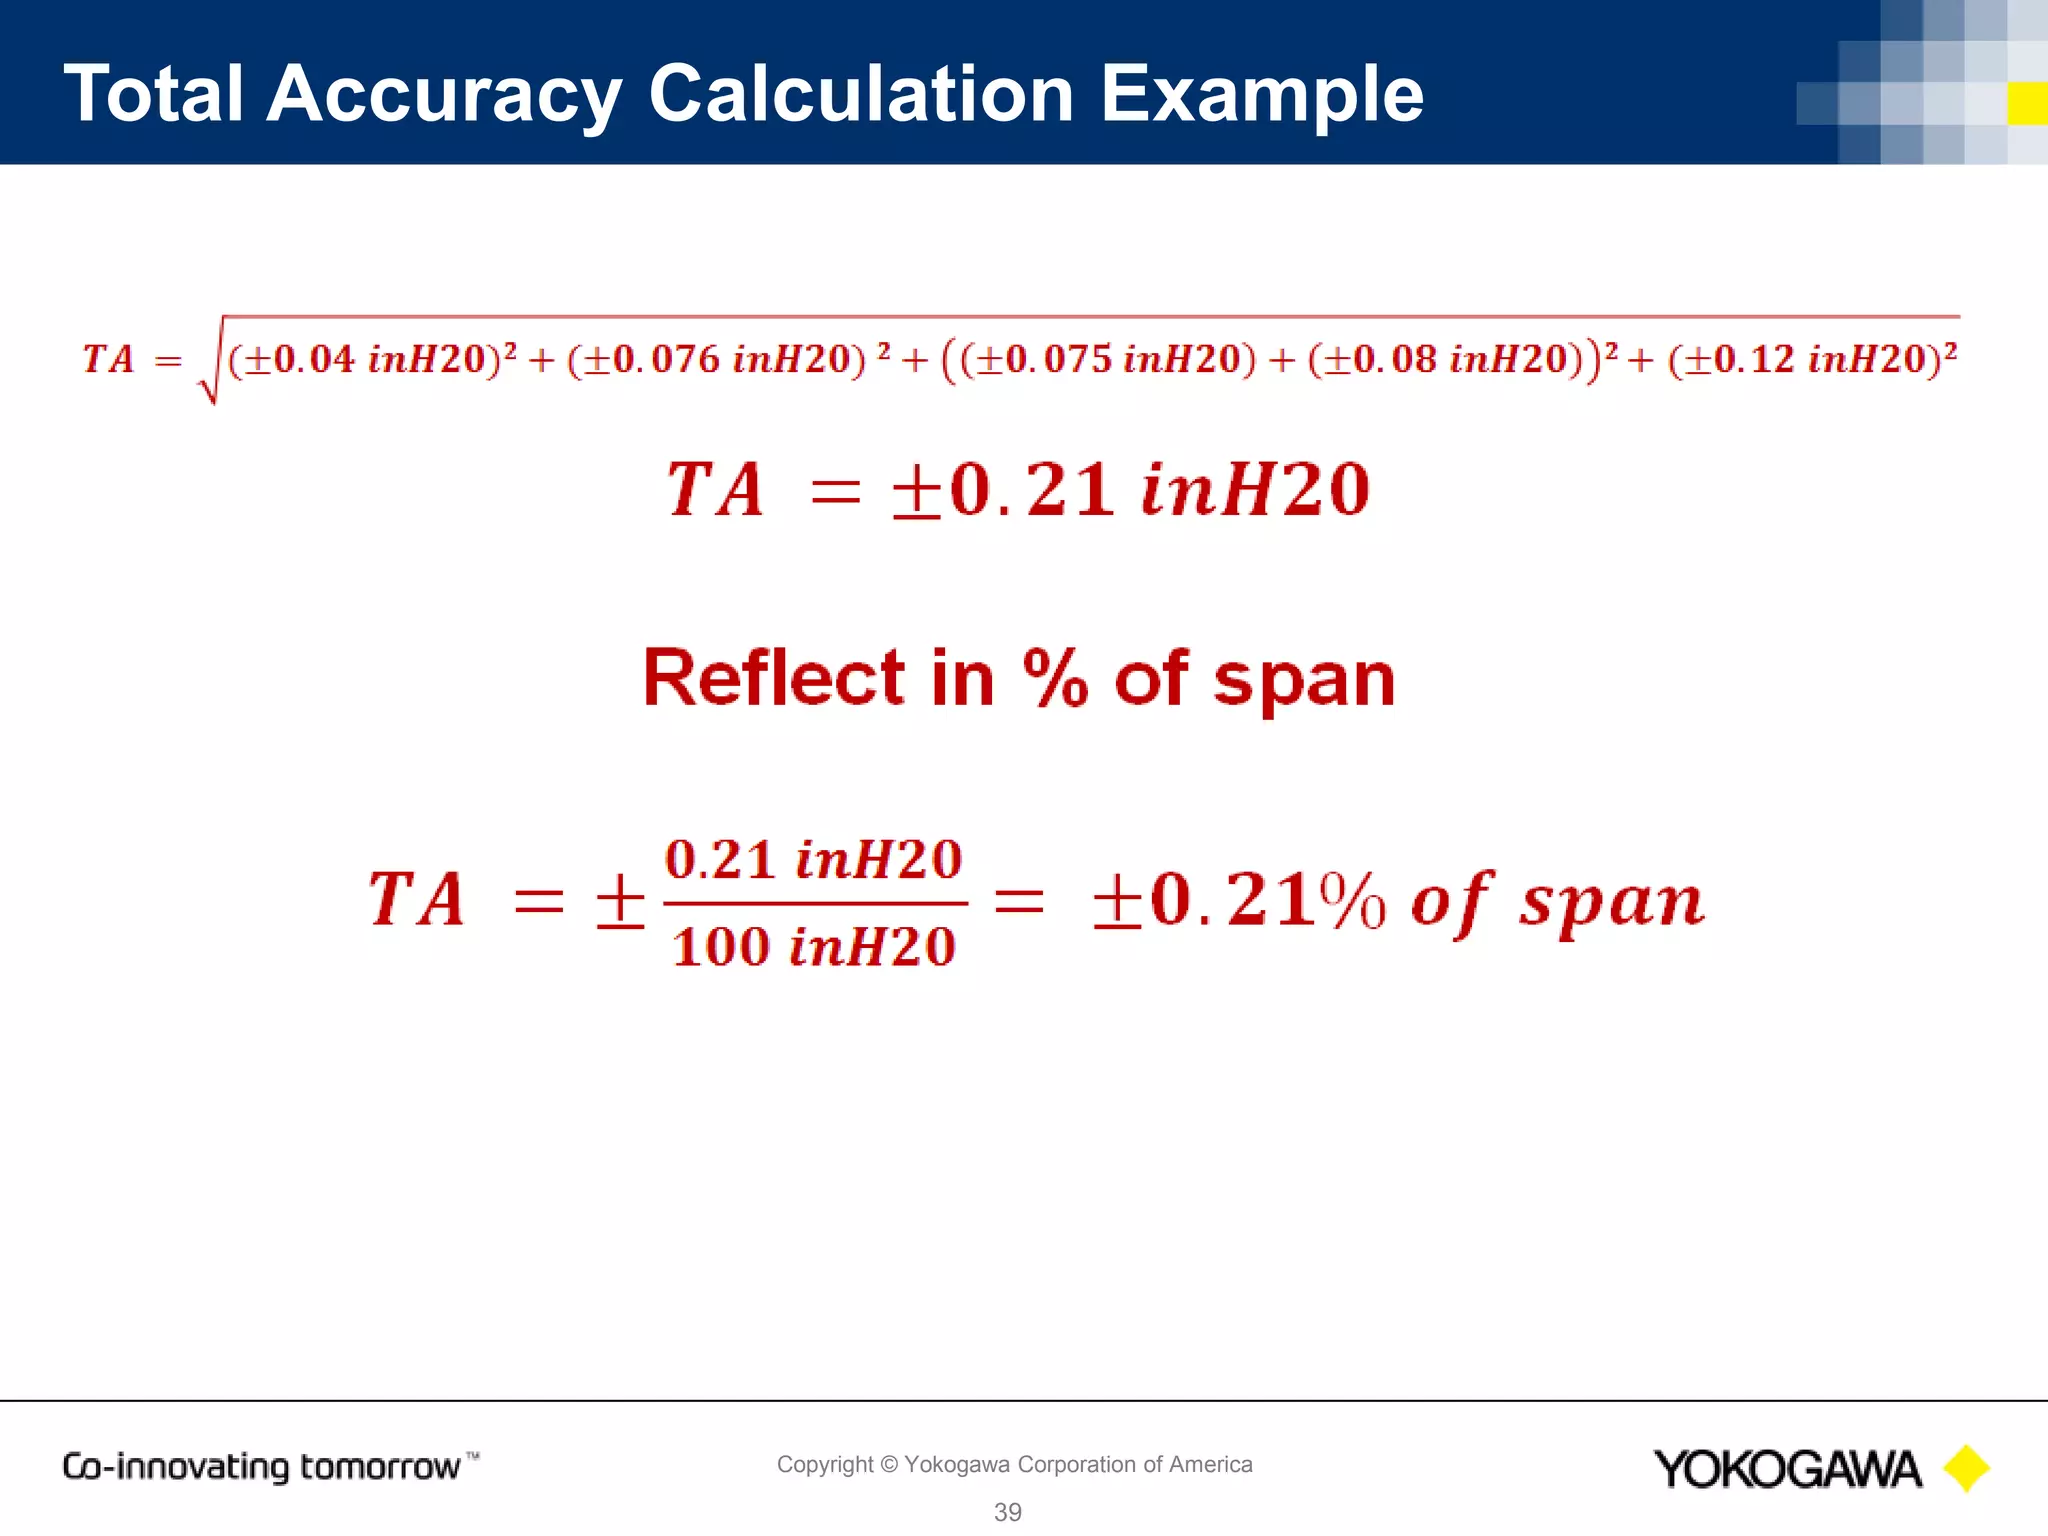
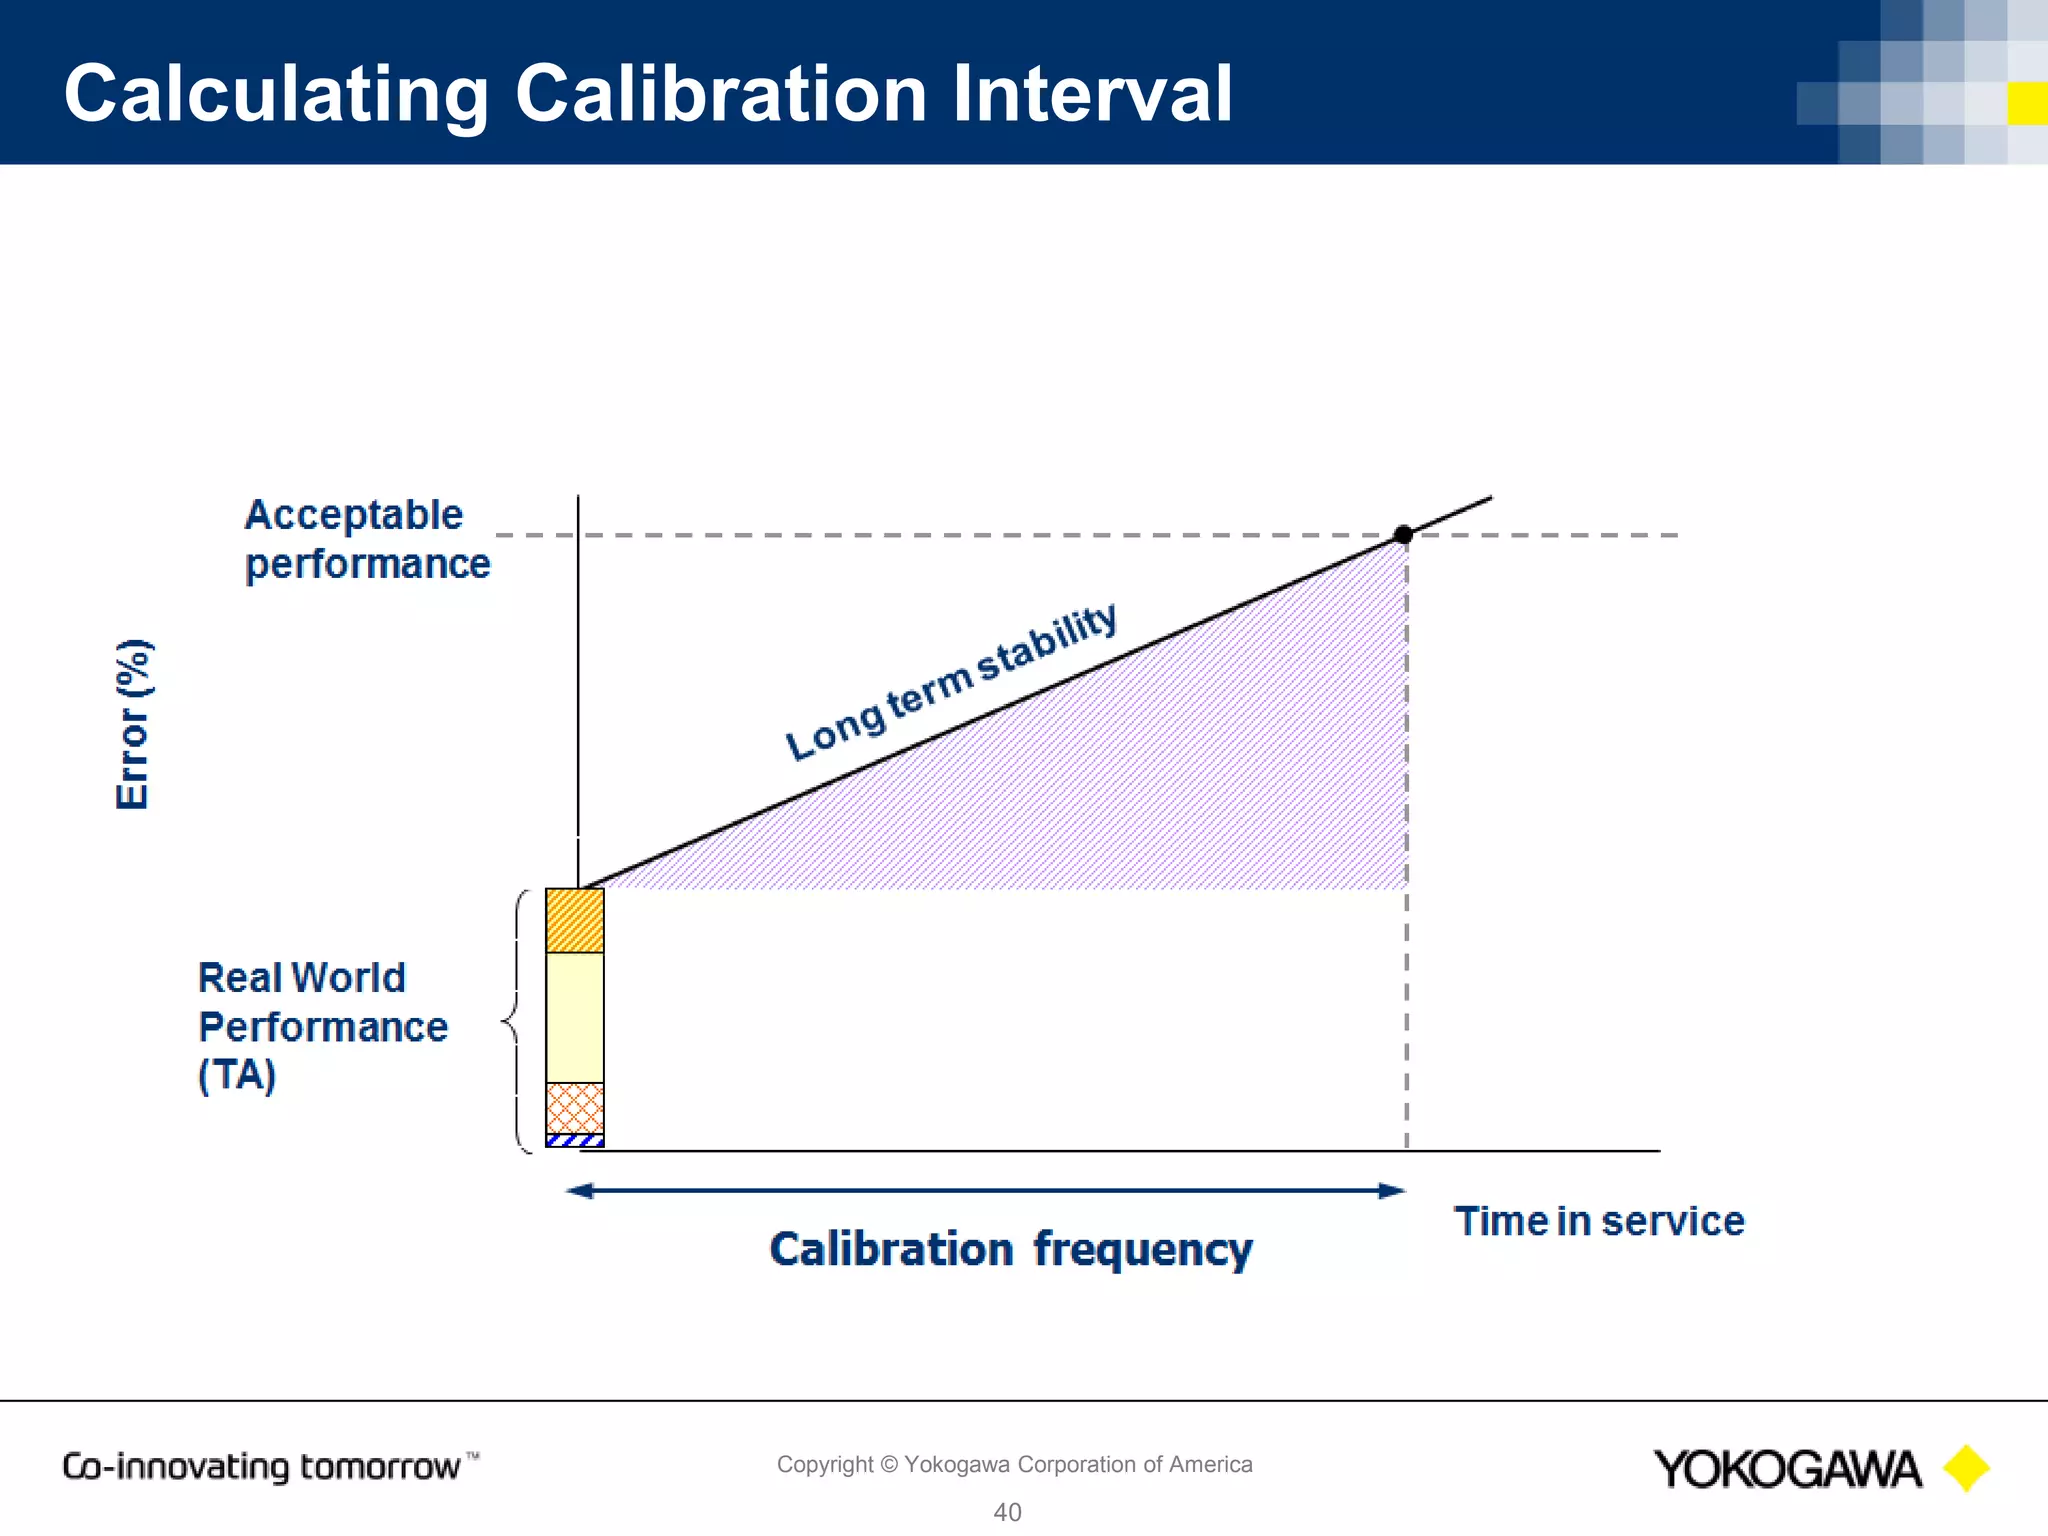
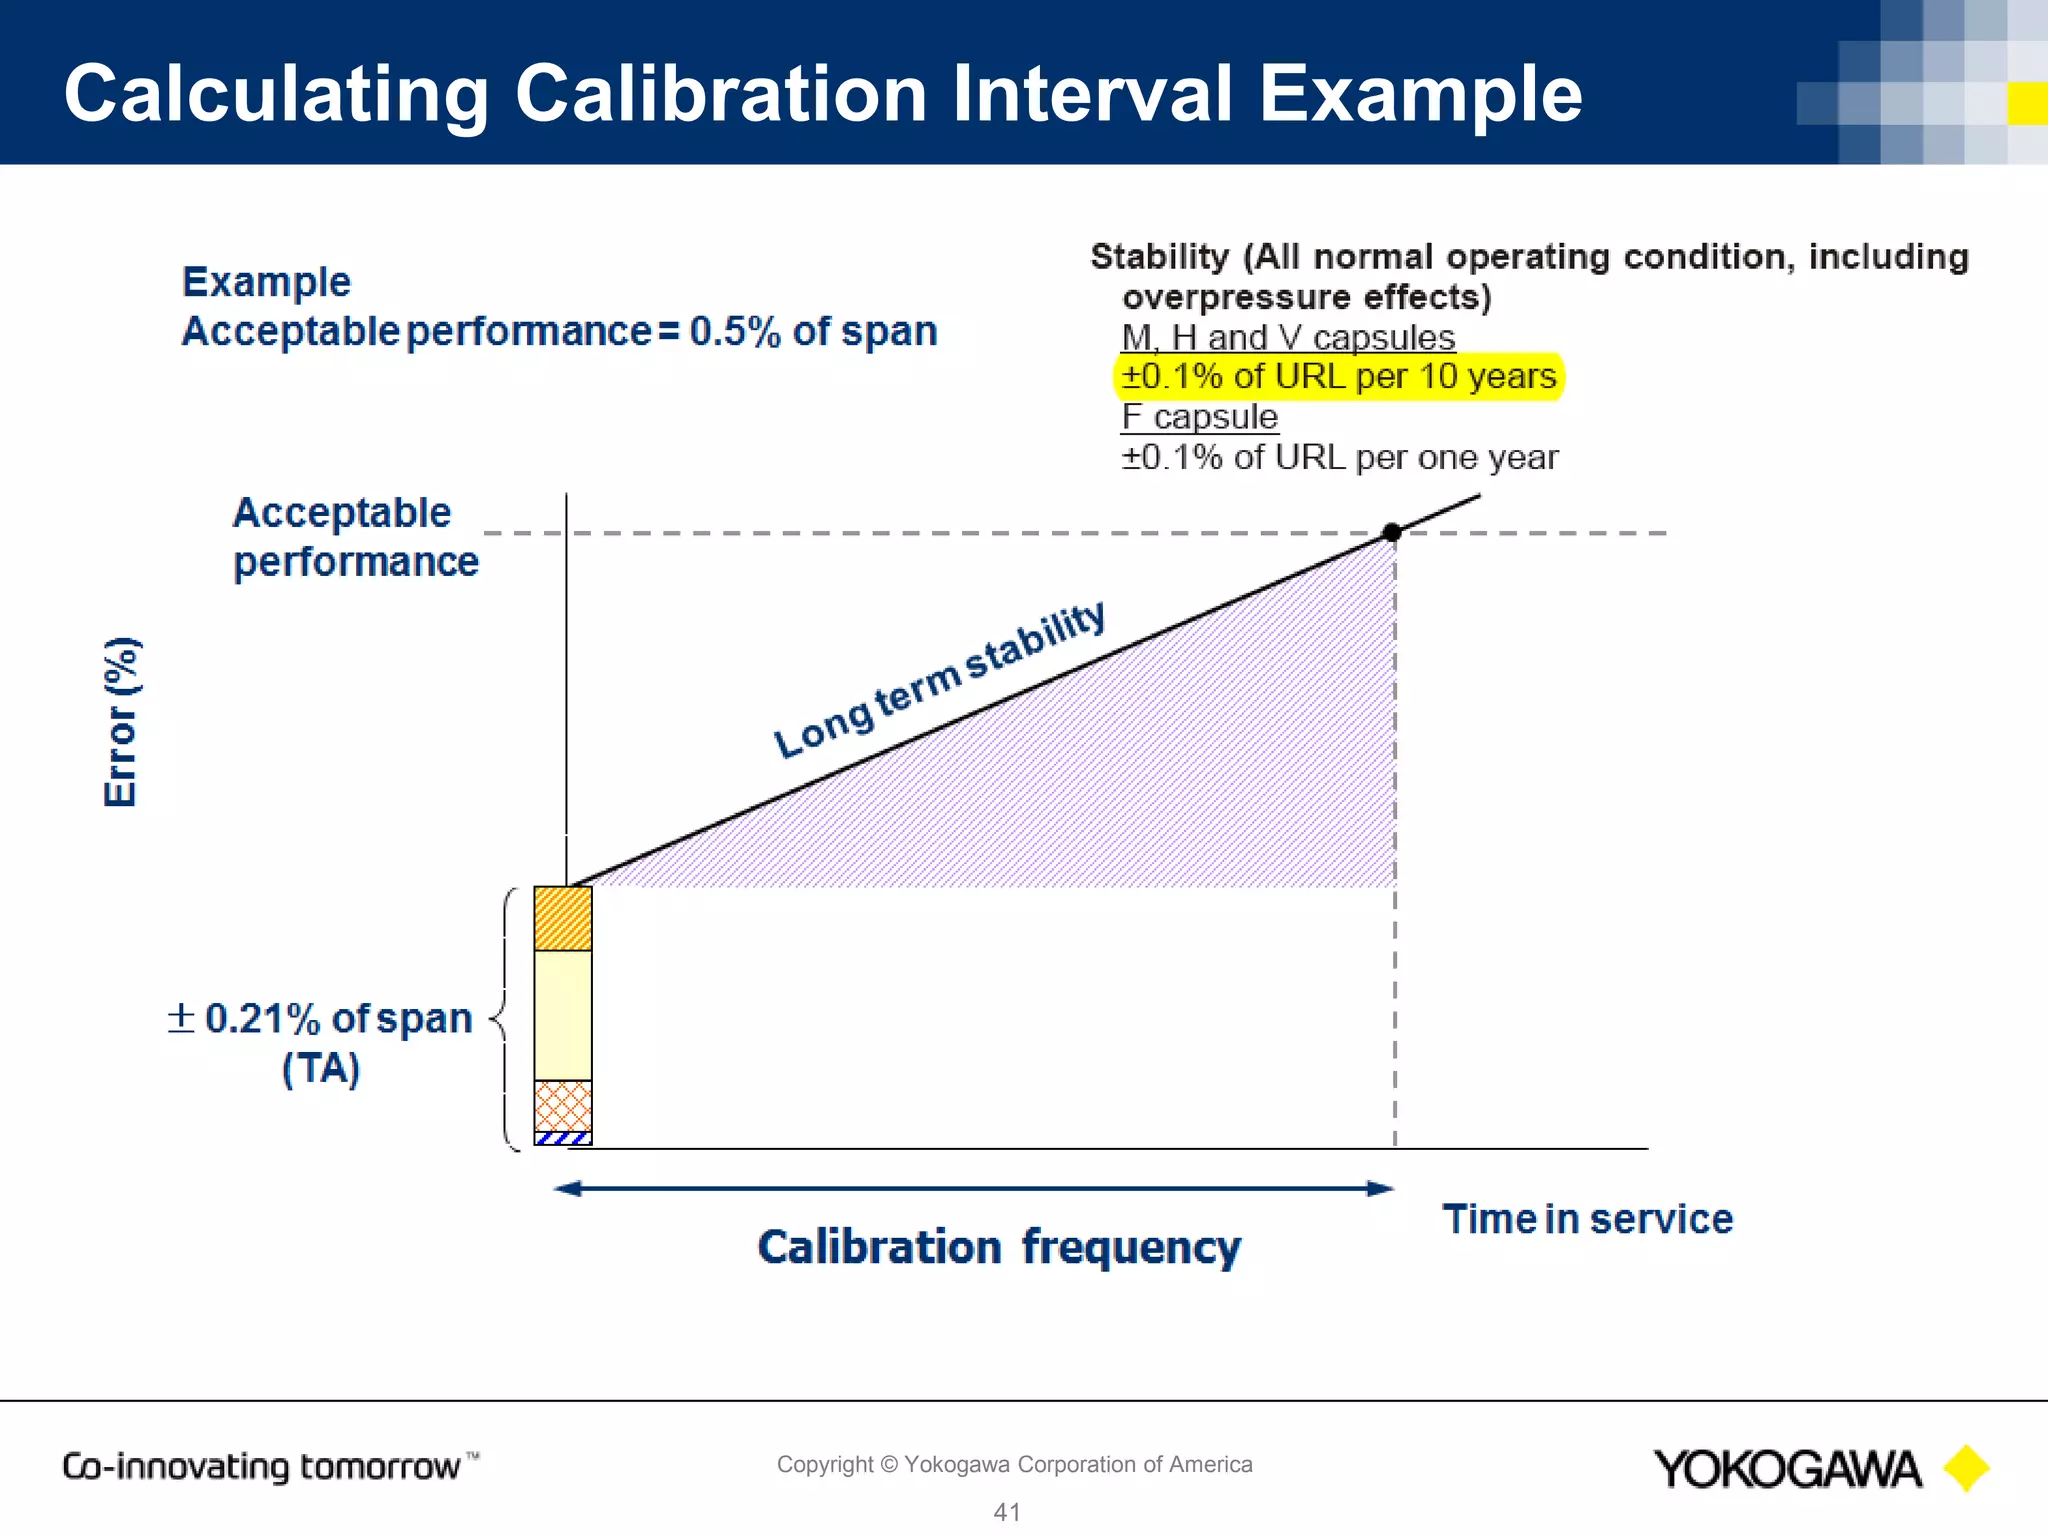
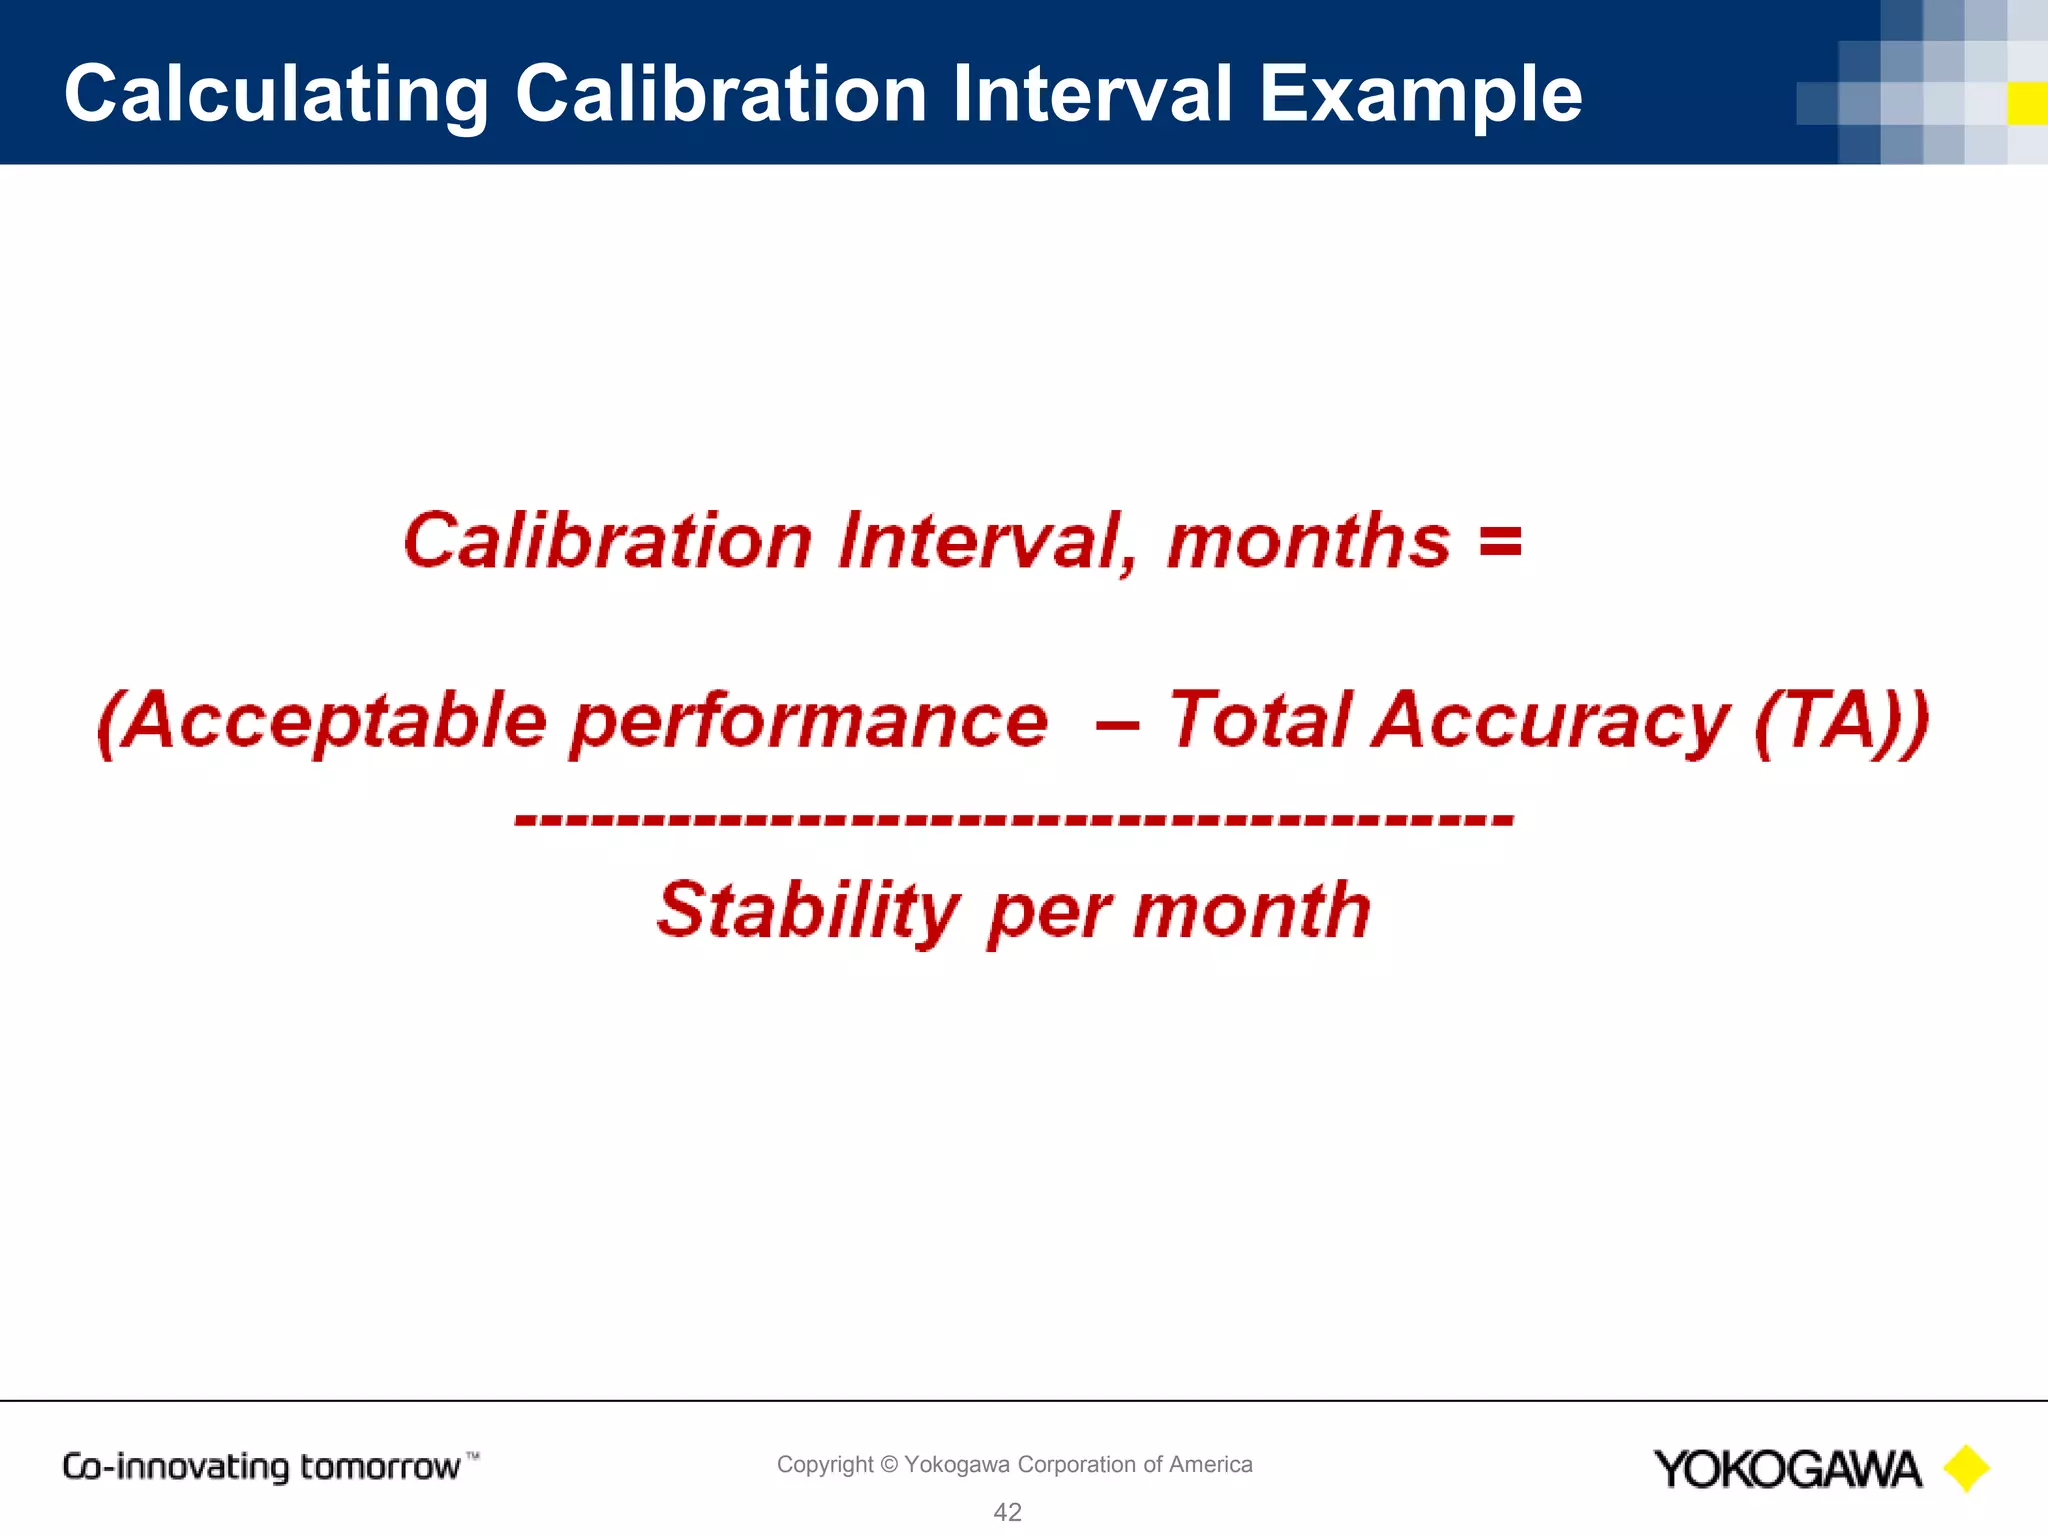
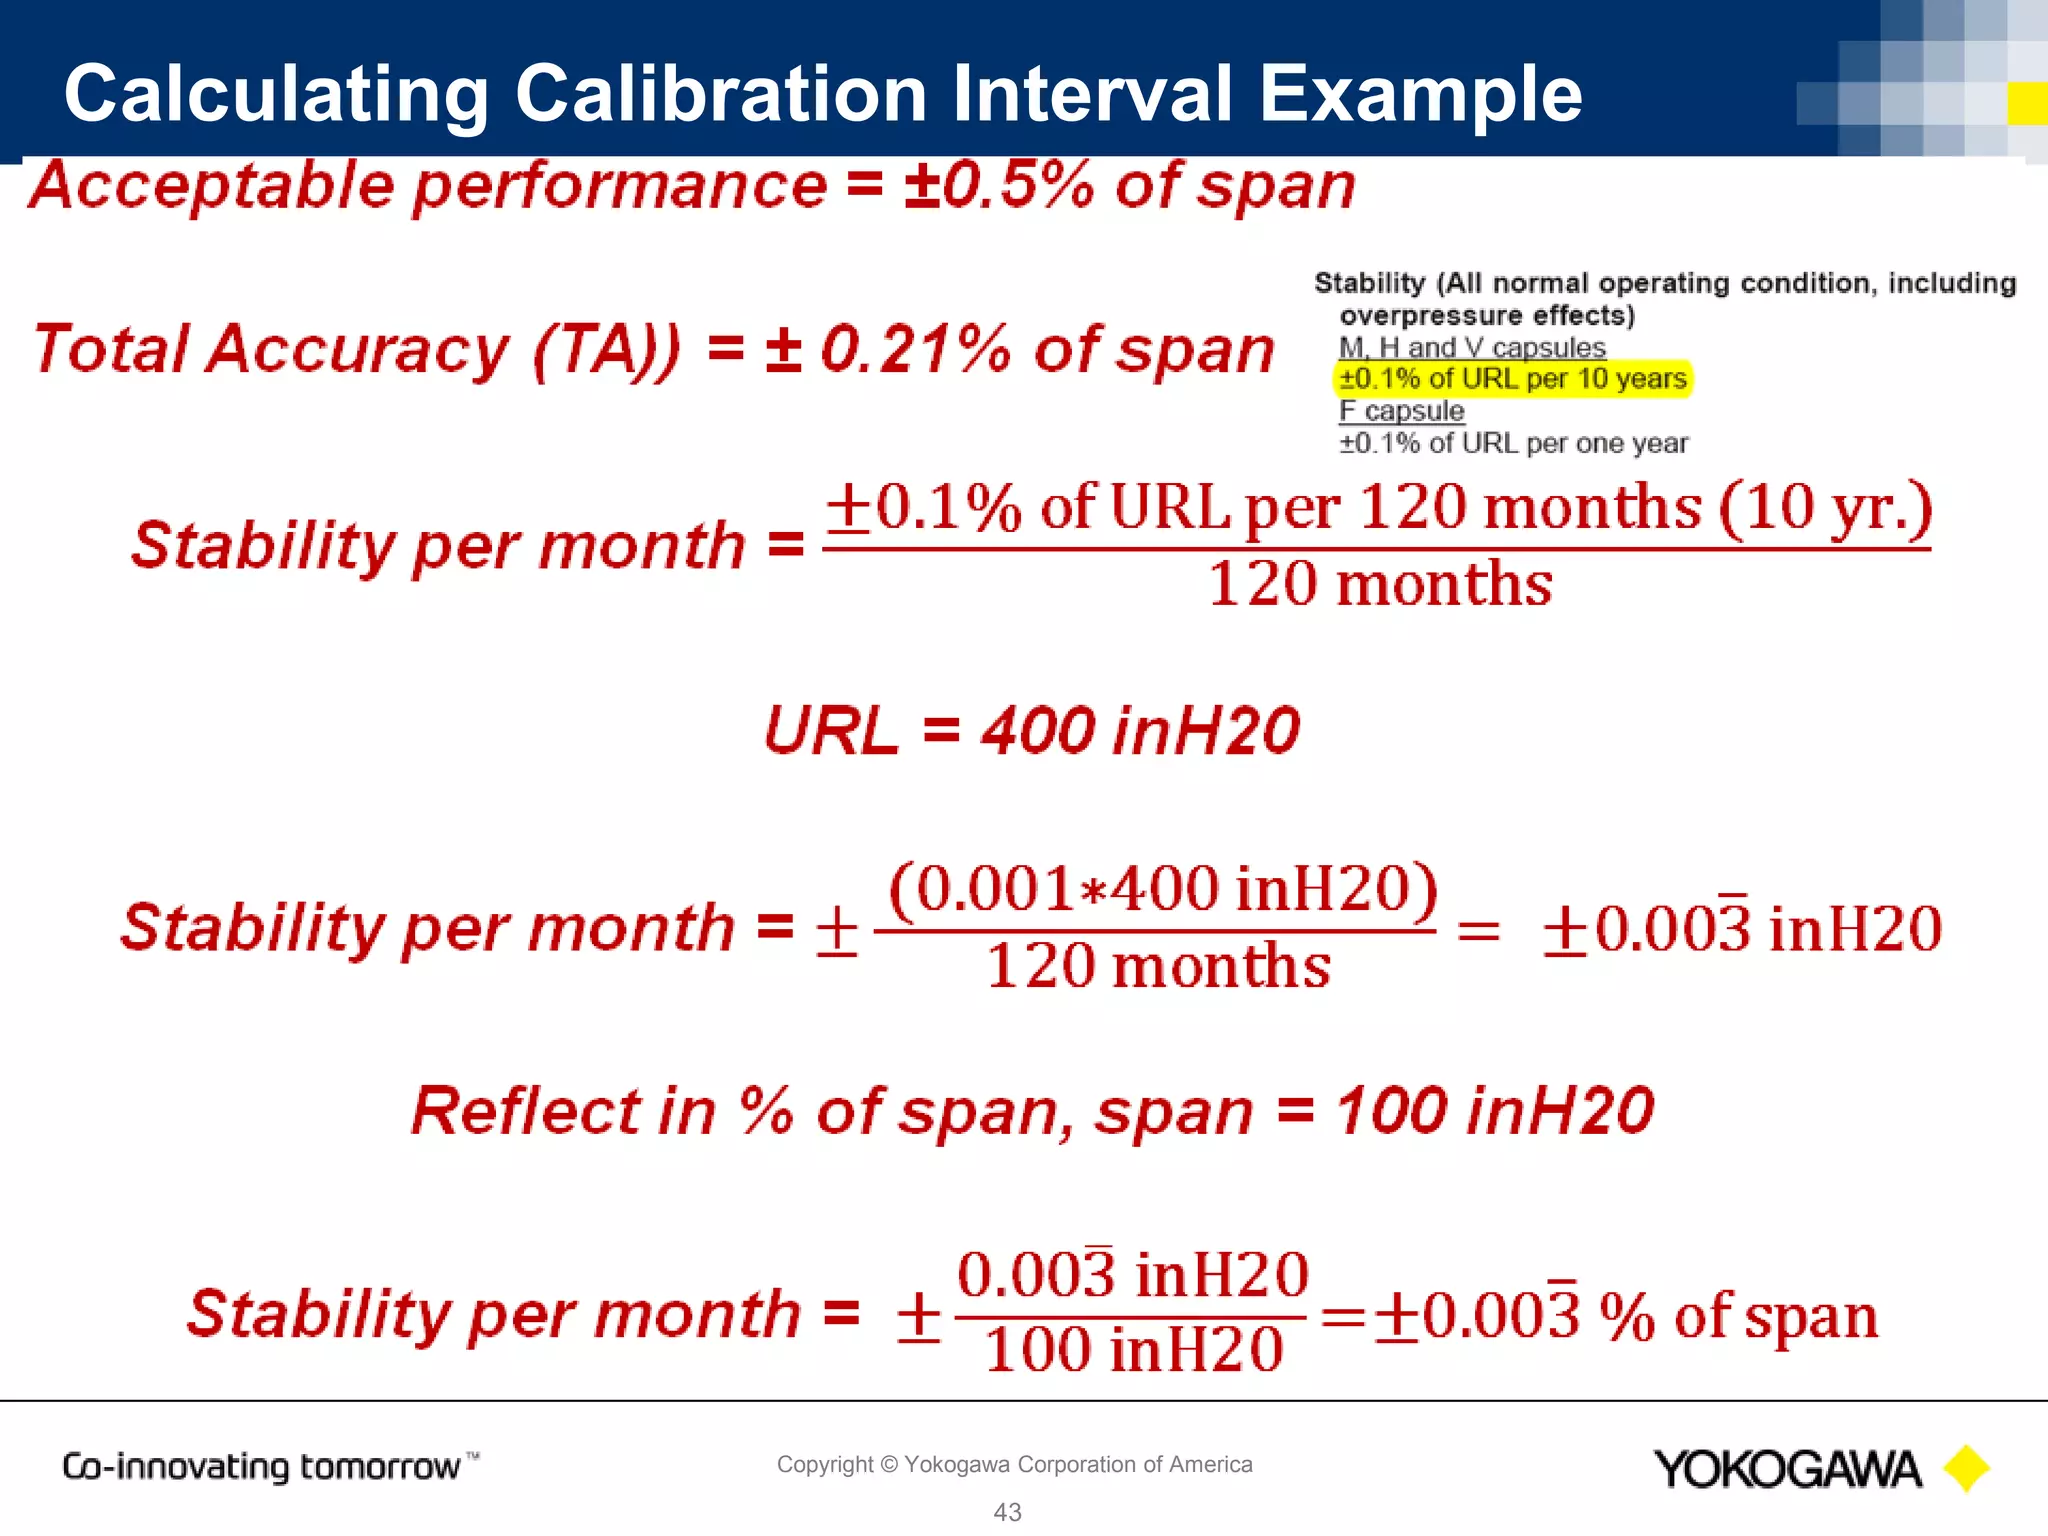
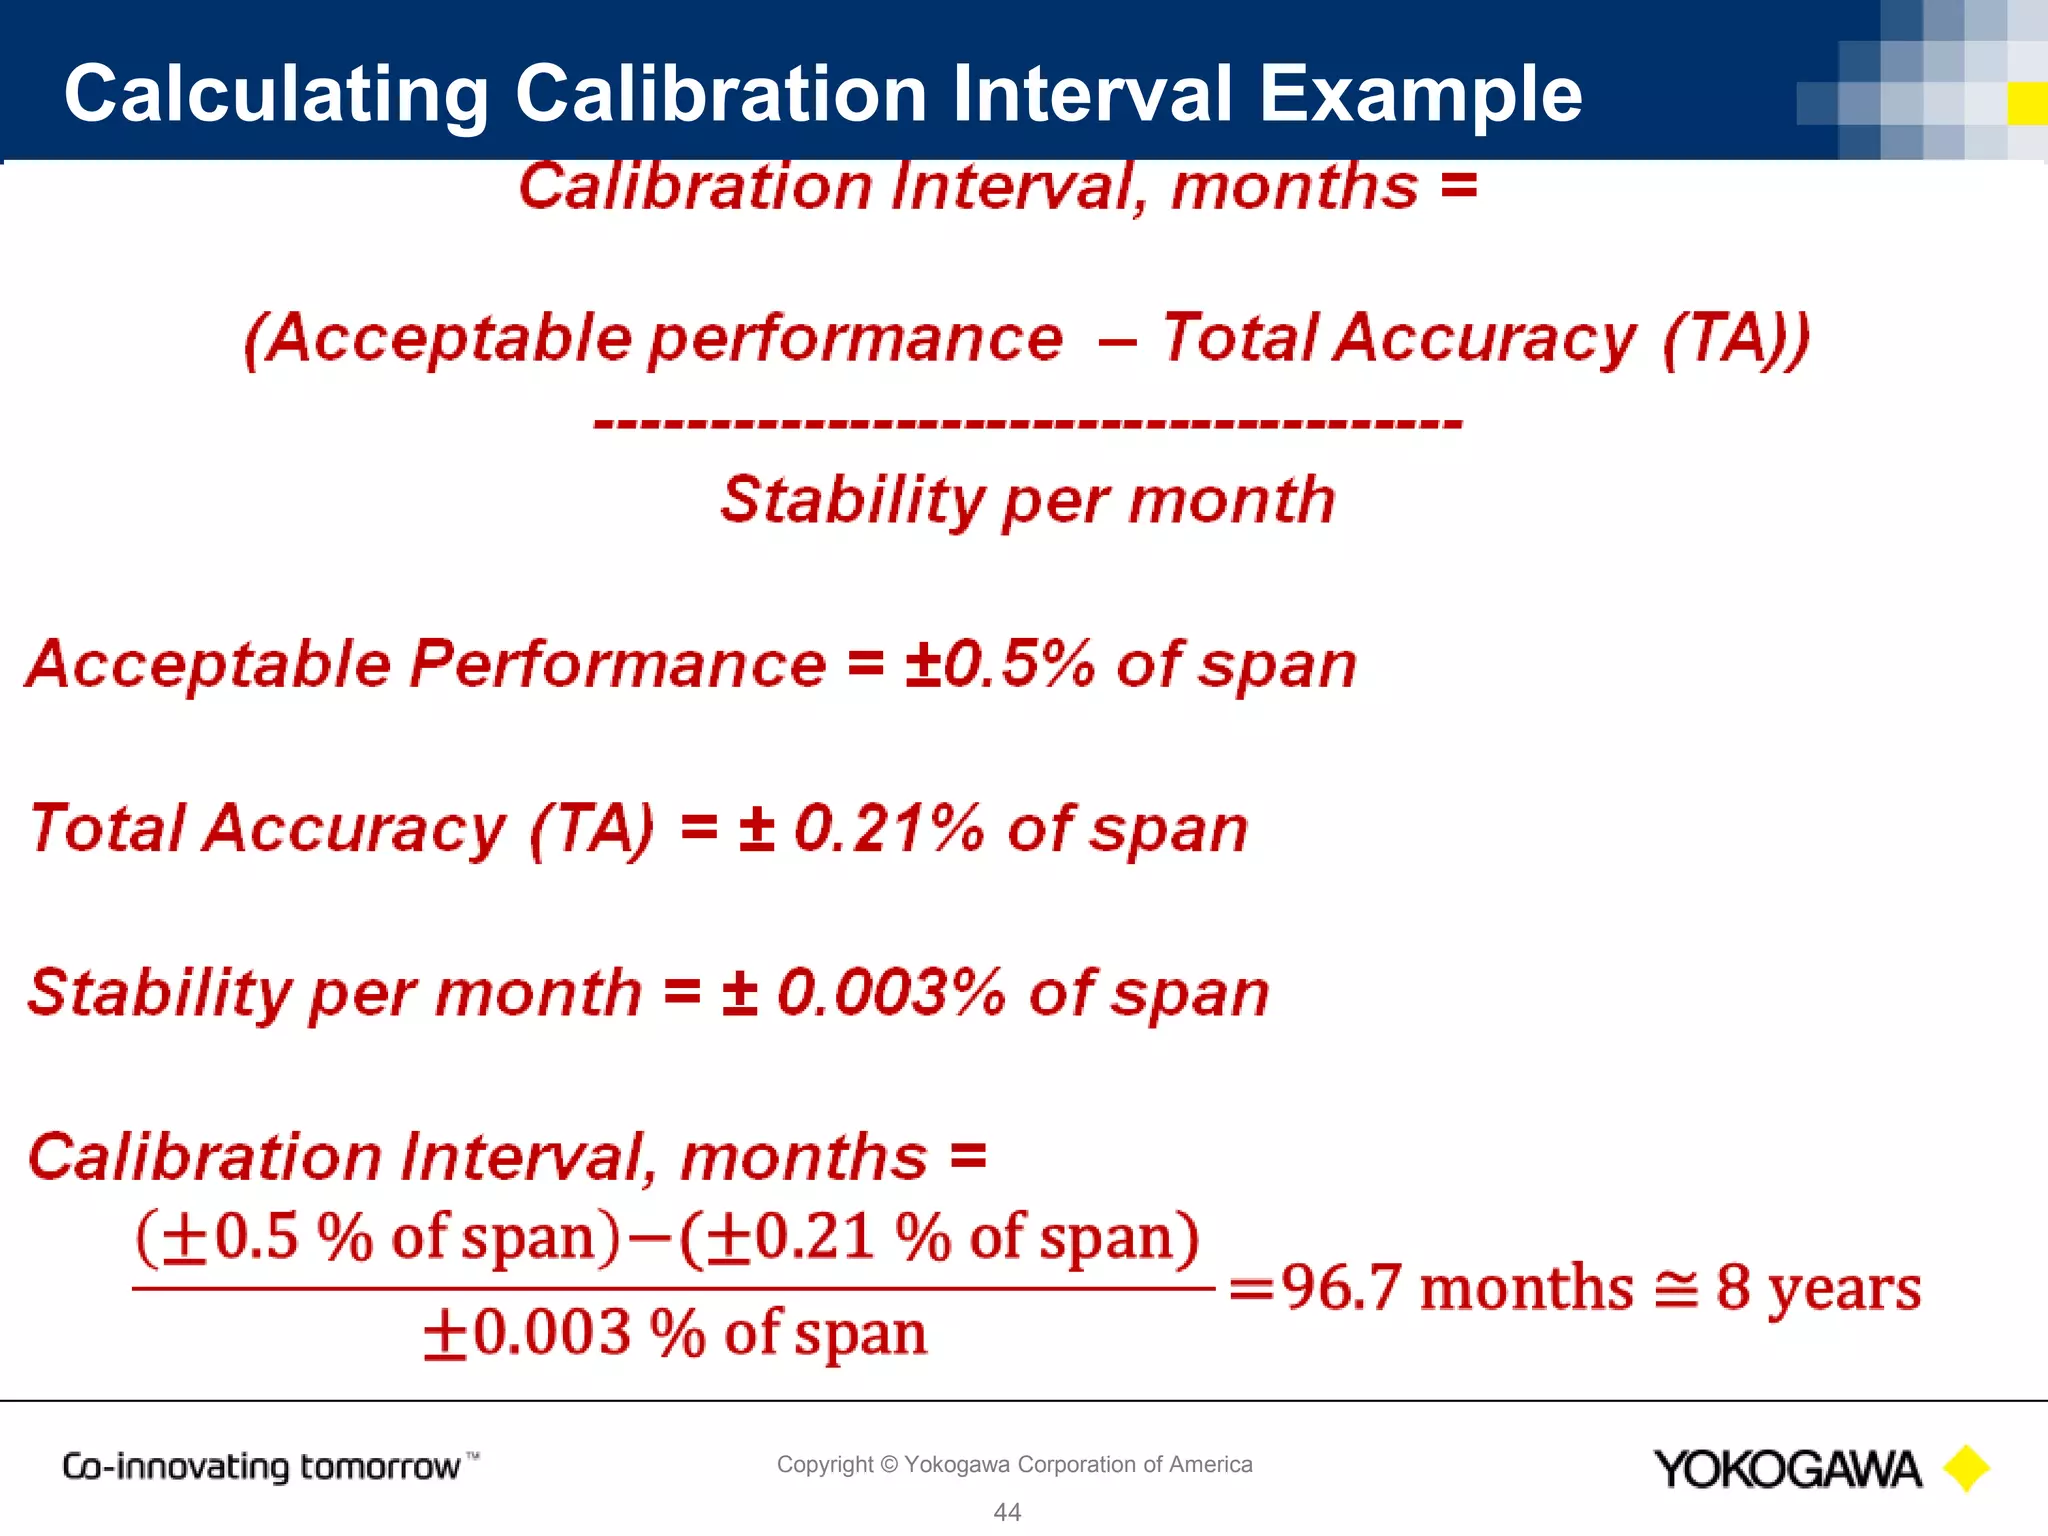
Copyright © Yokogawa Corporation of America
1
Calibration Intervals
Best Practices in
Maintaining Pressure
Transmitters
Michael Keller
Product Manager – Temperature and
Multivariable Transmitters
May 24, 2016
Copyright © Yokogawa Corporation of America
2
Why?
Copyright © Yokogawa Corporation of America
3
Agenda
Copyright © Yokogawa Corporation of America
4
Pressure Basics
Copyright © Yokogawa Corporation of America
5
Pressure Definitions
Copyright © Yokogawa Corporation of America
6
Reference Accuracy
Copyright © Yokogawa Corporation of America
7
Zero Point Errors
Copyright © Yokogawa Corporation of America
8
Zero Point Errors Adjusted
Copyright © Yokogawa Corporation of America
9
Full Scale Errors
Copyright © Yokogawa Corporation of America
10
Full Scale Errors Adjusted
Copyright © Yokogawa Corporation of America
11
Linearity
Copyright © Yokogawa Corporation of America
12
Repeatability
Copyright © Yokogawa Corporation of America
13
Hysteresis
Copyright © Yokogawa Corporation of America
14
±3  Specification Conformance
Copyright © Yokogawa Corporation of America
15
What is Real World Performance?
Copyright © Yokogawa Corporation of America
16
Real World Performance = Total Probable Error (TPE)
Copyright © Yokogawa Corporation of America
17
Real World Performance = Total Accuracy (TA)
Copyright © Yokogawa Corporation of America
18
Overpressure Effect
Copyright © Yokogawa Corporation of America
19
Total Accuracy Calculation Example
Copyright © Yokogawa Corporation of America
20
Total Accuracy Calculation Example
Copyright © Yokogawa Corporation of America
21
Total Accuracy Calculation Example
Copyright © Yokogawa Corporation of America
22
Total Accuracy Calculation Example
Copyright © Yokogawa Corporation of America
23
Total Accuracy Calculation Example
Copyright © Yokogawa Corporation of America
24
Total Accuracy Calculation Example
Copyright © Yokogawa Corporation of America
25
Total Accuracy Calculation Example
Copyright © Yokogawa Corporation of America
26
Total Accuracy Calculation Example
Copyright © Yokogawa Corporation of America
27
Total Accuracy Calculation Example
Copyright © Yokogawa Corporation of America
28
Total Accuracy Calculation Example
Copyright © Yokogawa Corporation of America
29
Total Accuracy Calculation Example
Copyright © Yokogawa Corporation of America
30
Total Accuracy Calculation Example
Copyright © Yokogawa Corporation of America
31
Total Accuracy Calculation Example
Copyright © Yokogawa Corporation of America
32
Total Accuracy Calculation Example
Copyright © Yokogawa Corporation of America
33
Total Accuracy Calculation Example
Copyright © Yokogawa Corporation of America
34
Total Accuracy Calculation Example
Copyright © Yokogawa Corporation of America
35
Total Accuracy Calculation Example
Copyright © Yokogawa Corporation of America
36
Total Accuracy Calculation Example
Copyright © Yokogawa Corporation of America
37
Calculating Calibration Interval
Copyright © Yokogawa Corporation of America
38
Calculating Calibration Interval Example
Copyright © Yokogawa Corporation of America
39
Calculating Calibration Interval Example
Copyright © Yokogawa Corporation of America
40
Calculating Calibration Interval Example
Copyright © Yokogawa Corporation of America
41
Calculating Calibration Interval Example
Copyright © Yokogawa Corporation of America
42
Calibration Interval Calculator
 http://www.dpharp.com/index.php/performance-
calculator
Copyright © Yokogawa Corporation of America
43
Calibration Interval Takeaway
Copyright © Yokogawa Corporation of America
44
Thank you very much
Questions?

Calibration Intervals - Best Practices in Maintaining Pressure Transmitters

Editor's Notes

  • #3 Pressure thermometer Pressure transmitters in almost any industry Industrial plants need to ensure that all of their instrumentation is measuring accurately within a certain tolerance. Poor performance from instruments  can cause problems concerning safety, production downtime and issues with quality.
  • #5 P = f/a , psi , lbs typically expressed as a force, mg, square inch (inH20, rho * g * h , rho = m/V = m/h^3 , -> f/a) Abs – not affected by atm pressure changed, barometer if left open
  • #6  Capsule for various pressure ranges
  • #7 Need to define before we talk about real world performance The reference accuracy guaranteed on specification sheets is just an accuracy based on laboratory conditions. Typical/common reference conditions might be: - Temperature: 25 o C or 77 o F - Static Pressure: Zero psi - Relative Humidity: 10 to 55% Manufacturing – characteristic (calibration) curve, raw sensor has unique output, characterization curve created and tested, optimized, turn characterization curve to ideal is goal, always some error out of scale % of span typically IEC 61298-2 – not defined standard for pressure transmitter accuracy, but defines factors that make up accuracy - must include effects of linearity, repeatabilty and hysteresis We define reference accuracy as the maximum deviation from an ideal characteristic line including the effects of zero point errors, full scale errors, linearity, repeatability, and hysteresis; expressed in % of span.
  • #11 Assuming characteristic curve is linear, transition to linearity
  • #12 How close characteristic curve is to a straight line IEC does not define how quantified Terminal based – straight line through actual zero point and full scale values, it is max deviation of characteristic curve Best fit straight line – straight line to limit max deviation, generally = ½ * TB Terminal based more conservative,, be aware
  • #13 Repeatability – Change in output (characteristic lines) when same pressure is applied consecutively, same conditions, same direction Repeatable not necessarily accurate But if very accurate, are some what repeatable
  • #14 Not understandable from name, Disease cured in the 1950s Hysteresis- difference in output (characteristic lines) increasing pressure vs decreasing pressure from full span pressure cycle. 5/9 point calibration Again, zero point errors, full scale errors, linearity, repeatability, and hysteresis all are used to compose reference accuracy. Value for each, % of span Errors cannot be added, some errors will affect others, visa versa, errors are compounded, root sum square common, IEC does not define
  • #15 So, manufactures who claim 3 sigma specification conformance, means 99.7 % of devices are manufactured to meet specifications.
  • #16 The reference accuracy guaranteed on specification sheets is just an accuracy based on laboratory conditions. Temp ambient and process – zero and span SP- changing process conditions – zero and span
  • #17 This calculation OMITS Static Pressure Zero Effects and is therefore not correct. Zero trim at line pressure cannot eliminate SP-Zero effect, since the line pressure is changing constantly in the process Root sum squared for compounding of errors
  • #18 Root sum squared for compounding of errors
  • #19 Overpressure another measurement error, mainly for DP transmitters Surge pressure can be generated by water hammer action (start up, shut down), caused by wrong sequencing of three-valve manifold, opening the vent/drain plug of D/P Tx, process upsets. Not always noticeable
  • #38 Stability – drift, degradation of components and sensor over time,
  • #39 All operating conditions