Business Insurance: 100 Largest Brokers of U.S. Businesses
•
2 likes•2,467 views

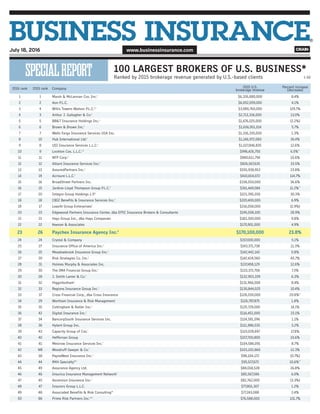
In 2016, Paychex Insurance Agency ranked #23 on Business Insurance magazine's annual list of Top 100 brokers of U.S. businesses.

Recommended
More Related Content
What's hot
What's hot (20)
Similar to Business Insurance: 100 Largest Brokers of U.S. Businesses
Similar to Business Insurance: 100 Largest Brokers of U.S. Businesses (20)
More from Paychex
More from Paychex (20)
Business Insurance: 100 Largest Brokers of U.S. Businesses
- 1. ® July 18, 2016 2016 rank 2015 rank Company 2015 U.S. brokerage revenue Percent increase (decrease) 1 1 Marsh & McLennan Cos. Inc.1 $6,326,880,000 8.4% 2 2 Aon P.L.C. $6,052,059,000 4.1% 3 4 Willis Towers Watson P.L.C.1,2 $3,980,760,000 129.7% 4 3 Arthur J. Gallagher & Co.1 $2,713,336,000 13.0% 5 5 BB&T Insurance Holdings Inc.1 $1,676,025,000 (2.2%) 6 6 Brown & Brown Inc.1 $1,656,951,014 5.7% 7 7 Wells Fargo Insurance Services USA Inc. $1,316,335,000 1.3% 8 10 Hub International Ltd.1 $1,146,972,060 26.4% 9 8 USI Insurance Services L.L.C.1 $1,027,846,835 12.6% 10 9 Lockton Cos. L.L.C.1,3 $996,426,750 6.5%** 11 11 NFP Corp.4 $880,611,794 10.6% 12 12 Alliant Insurance Services Inc.1 $826,567,635 33.5% 13 13 AssuredPartners Inc.1 $555,938,953 23.8% 14 19 Acrisure L.L.C.1 $410,654,072 114.7% 15 16 BroadStreet Partners Inc. $336,550,000 36.6% 16 15 Jardine Lloyd Thompson Group P.L.C.5 $261,469,584 11.2%** 17 20 Integro Group Holdings L.P.1 $221,395,200 30.3% 18 18 CBIZ Benefits & Insurance Services Inc.1 $220,400,000 6.9% 19 17 Leavitt Group Enterprises1 $216,058,000 (2.9%) 20 23 Edgewood Partners Insurance Center, dba EPIC Insurance Brokers & Consultants $195,558,100 28.9% 21 21 Hays Group Inc., dba Hays Companies $183,300,000 9.8% 22 22 Keenan & Associates $170,901,000 4.9% 23 26 Paychex Insurance Agency Inc.6 $170,100,000 23.8% 24 24 Crystal & Company $157,000,000 5.1% 25 27 Insurance Office of America Inc.1 $143,371,738 11.3% 26 25 Meadowbrook Insurance Group Inc.1 $142,442,142 0.8% 27 39 Risk Strategies Co. Inc.1 $142,424,560 45.7% 28 31 Holmes Murphy & Associates Inc. $137,458,129 12.6% 29 30 The IMA Financial Group Inc.1 $133,372,706 7.3% 30 28 J. Smith Lanier & Co.1 $132,903,339 6.3% 31 32 Higginbotham1 $131,966,000 8.4% 32 33 Regions Insurance Group Inc.1 $130,844,025 10.4% 33 37 Cross Financial Corp., dba Cross Insurance $128,200,000 20.8%** 34 29 Wortham Insurance & Risk Management $126,787,875 1.8% 35 35 Cottingham & Butler Inc.1 $125,729,000 14.1% 36 42 Digital Insurance Inc.1 $116,451,000 23.1% 37 34 BancorpSouth Insurance Services Inc. $114,581,596 1.1% 38 36 Hylant Group Inc. $111,986,535 3.2% 39 43 Capacity Group of Cos.1 $110,028,697 17.8% 40 40 Heffernan Group $107,700,800 10.6% 41 41 Mesirow Insurance Services Inc.7 $104,586,091 8.7% 42 NR Woodruff-Sawyer & Co.1 $103,102,860 12.3% 43 38 PayneWest Insurance Inc.1 $98,104,172 (0.7%) 44 44 RKH Specialty8,9 $95,527,672 10.6%** 45 49 Assurance Agency Ltd. $88,018,528 16.8% 46 46 Insurica Insurance Management Network1 $85,567,586 6.0% 47 45 Ascension Insurance Inc.1 $82,762,000 (3.3%) 48 47 Insurors Group L.L.C. $77,801,307 1.2% 49 48 Associated Benefits & Risk Consulting10 $77,243,088 2.4% 50 86 Prime Risk Partners Inc.1,11 $76,588,000 131.7% SPECIALREPORT 100 LARGEST BROKERS OF U.S. BUSINESS* Ranked by 2015 brokerage revenue generated by U.S.-based clients 1-50
- 2. The Publisher’s sale of this reprint does not constitute or imply any endorsement or sponsorship of any product, service or organ- ization. Reprinted with permission from Business Insurance. © 2016 Crain Communications Inc. REPRODUCTIONS ARE NOT PERMITTED. Visit www.businessinsurance.com/section/reprints. #16022 *Companies that derive more than 49% of their gross revenue from personal lines are not ranked. **2014 restated. NR=Not ranked in 2015. 1 Reported U.S. acquisitions in 2015. 2 Pro forma to reflect 2016 merger of Willis Group Holdings P.L.C., Towers Watson & Co. and Gras Savoye & Cie. Does not include 2014 preacquisition revenue from other acquired companies. 3 Fiscal year ending April 30. 4 National Financial Partners Corp. renamed NFP Corp. 5 British pound=$1.4746 for 2015, $1.5586 for 2014. 6 Fiscal year ending May 31. 7 Fiscal year ending March 31. 8 Formerly R K Harrison Group Ltd; renamed following Hyperion Group acquisition. British pound=$1.5445 for 2015, $1.5205 for 2014. 9 Fiscal year ending Oct. 31. 10 Formerly Associated Financial Group L.L.C. 11 Includes acquisition of Cook Maran & Associates and ONB Insurance Group Inc., dba Old National Insurance. 12 Fiscal year ending Sept. 30. 13 Fiscal year ending Aug. 31. Source: BI survey 2016 rank 2015 rank Company 2015 U.S. brokerage revenue Percent increase (decrease) 51 53 Frenkel Benefits L.L.C., dba Frenkel & Co.1 $72,553,683 4.3%** 52 51 Eastern Insurance Group L.L.C.1 $70,394,750 5.7% 53 54 Oswald Cos.1 $65,850,840 1.9% 54 52 First Niagara Risk Management Inc. $65,286,400 (0.3%) 55 55 Marshall & Sterling Enterprises Inc.1 $63,853,663 7.0% 56 60 Propel Insurance1 $62,088,000 15.5% 57 57 Lawley Service Inc. $61,968,319 7.6% 58 56 Huntington Insurance Inc. $60,122,700 2.5% 59 59 Horton Group Inc. $59,604,975 9.5% 60 58 Houchens Insurance Group12 $58,227,077 1.1% 61 62 Sterling & Sterling L.L.C., dba SterlingRisk $52,679,000 4.4% 62 61 Bowen, Miclette & Britt Inc. $52,529,205 1.3% 63 64 TrueNorth Cos. L.L.C. $52,477,000 9.1% 64 67 The Graham Co. $50,815,997 12.3% 65 65 Frost Insurance Agency Inc. $50,201,963 7.3% 66 66 M3 Insurance Solutions Inc. $50,025,493 7.8% 67 71 James A. Scott & Son Inc., dba Scott Insurance $49,675,000 12.5% 68 77 Towne Insurance Agency Inc.1 $47,334,527 12.9% 69 68 LMC Insurance & Risk Management Inc. $47,233,550 4.5% 70 69 Poms & Associates Insurance Brokers Inc. $46,170,000 3.1% 71 72 Riggs, Counselman, Michaels & Downes Inc. $45,460,439 3.1% 72 76 Starkweather & Shepley Insurance Brokerage Inc.1 $45,238,000 6.3% 73 75 Parker, Smith & Feek Inc. $44,938,000 5.5% 74 70 The Mahoney Group $43,481,231 (2.4%) 75 73 Moreton & Co. $43,309,000 (1.3%) 76 80 ABD Insurance & Financial Services Inc.1 $42,886,000 16.2% 77 79 Corporate Synergies Group L.L.C. $42,588,000 9.3% 78 81 Bolton & Co. $41,923,200 15.4% 79 74 M&T Insurance Agency Inc. $39,200,000 (8.7%) 80 82 Robertson Ryan & Associates Inc. $36,850,969 2.8% 81 83 Bouchard Insurance Inc., dba Roger Bouchard Insurance Inc. $36,451,063 5.0% 82 85 Gowrie Group $35,986,500 8.5% 83 84 Charles L. Crane Agency Co. $35,029,007 3.2% 84 89 James G. Parker Insurance Associates6 $34,577,000 8.5% 85 93 Armfield, Harrison & Thomas Inc., dba AHT Insurance $33,650,905 12.5% 86 87 The Loomis Co. $32,340,000 1.2% 87 92 Lovitt & Touche Inc. $32,319,557 5.6%** 88 91 SullivanCurtisMonroe Insurance Services L.L.C. $32,100,000 4.6% 89 94 Haylor, Freyer & Coon Inc.13 $31,087,210 4.5% 90 95 Tolman & Wiker Insurance Services L.L.C. $30,884,020 7.7% 91 96 Underwriters Safety & Claims Inc., dba The Underwriters Group $30,124,710 5.8% 92 100 PSA Financial Services Inc.3 $29,553,365 10.9% 93 98 Ansay & Associates L.L.C.1 $29,508,564 7.1% 94 97 Tompkins Insurance Agencies Inc.1 $29,471,000 4.3% 95 101 Rich & Cartmill Inc. $29,316,529 12.9% 96 99 MJ Insurance Inc.13 $28,936,679 7.8% 97 108 R&R Insurance Services Inc. $28,200,000 31.2% 98 NR PacWest Alliance Insurance Services Inc. $27,179,696 11.3% 99 102 Murray Securus12 $26,450,000 3.5% 100 112 Shepherd Insurance L.L.C.1 $26,400,219 34.9% SPECIALREPORT 51-100