
Recommended
More Related Content
What's hot
What's hot (20)
Viewers also liked
Viewers also liked (12)
Similar to Pressure on Short-Term Executive Pay Incentives
Similar to Pressure on Short-Term Executive Pay Incentives (20)
Pressure on Short-Term Executive Pay Incentives
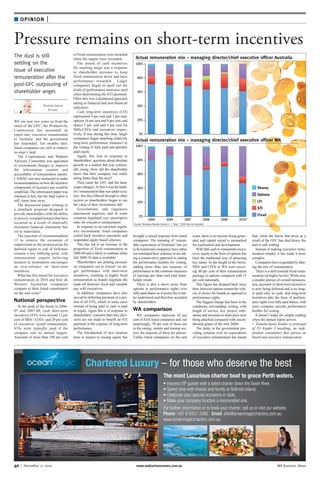
- 1. 40 | December 2, 2010 www.wabusinessnews.com.au WA Business News ■ OPINION | Pamela-Jayne Kinder Pressure remains on short-term incentives The dust is still settling on the issue of executive remuneration after the post-GFC outpouring of shareholder anger. WE are now two years on from the onset of the GFC; the Productivity Commission has presented its report into ‘executive remuneration in Australia’ and the government has responded. Ten months later, listed companies are still in relative no-man’s land. The Corporations and Markets Advisory Committee was appointed to recommend changes to improve the information content and accessibility of remuneration reports. CAMAC was also instructed to make recommendations on how the incentive components of executive pay could be simplified. The information paper was released in July, but the final report is still ‘some time away’. The discussion paper relating to a clawback proposal designed to provide shareholders with the ability to recover overpaid bonuses that have occurred as a result of materially misstated financial statements has yet to materialise. The rejection of recommendation 13 to remove the cessation of employment as the taxation point for deferred equity to risk of forfeiture remains a key lobbying point, with remuneration experts believing taxation at termination encourages an over-reliance on short-term incentives. What has this meant for executive remuneration in 2010 and how do Western Australian companies compare to their listed counterparts on the east coast? National perspective At the peak of the boom in 2006- 07 and 2007-08, cash short-term incentives (STI) were around 12 per cent of MDs’-CEOs’and 20 per cent of executives’ actual remuneration. STIs were typically paid if the company met its annual targets. Amounts of more than 100 per cent of fixed remuneration were awarded when the targets were exceeded. The award of cash incentives for reaching target was a response to shareholder pressure to keep fixed remuneration down and have performance rewarded. Larger companies began to spell out the kinds of performance measures used when determining the STI payment. Often this was a dashboard approach taking in financial and non-financial indicators. Cash long-term incentives (LTI) represented 4 per cent and 3 per cent, options 16 per cent and 9 per cent, and shares 3 per cent and 6 per cent for MDs-CEOs and executives respec- tively. It was during this time, larger companies began attaching relatively long-term performance measures to the vesting of fully paid and partially paid equity. Again, this was in response to shareholders’questions about absolute growth in a market that was continu- ally rising. How did the shareholder know that their company was really doing better than the next? Then came the GFC and the land- scape changed.At first it was the bank- ers’remuneration that was under scru- tiny; this then filtered through to other sectors as shareholders began to see the value of their investments fall. Governments and regulators announced inquiries, and in some countries legislated very prescriptive rules for executive remuneration. In response to an uncertain regula- tory environment, listed companies scaled back incentive payments and suspended equity based schemes. This has led to an increase in the proportion of fixed remuneration in 2008-09 and is likely to continue when full 2009-10 data is available. Shareholders are putting pressure on companies not to reward ‘on tar- get’ performance with short-term incentives, resulting in higher fixed remuneration as boards negotiate the trade-off between fixed and variable pay with executives. In addition, companies have also moved to deferring payment of a por- tion of all STIs, which in some cases instead of being paid in cash is paid in equity. Again this is in response to shareholders’concerns that risky deci- sions are not made to benefit an STI payment at the expense of long-term performance. The introduction of new taxation laws in respect to issuing equity has brought a mixed response from listed companies. The meaning of ‘reason- able expectation of forfeiture’ has yet to be tested and companies have either not reinstated their schemes or are tak- ing a conservative approach in setting the performance hurdles for vesting, adding more than one measure of performance to the common measures of earnings per share and total share- holder return. There is also a move away from options to performance rights over fully paid shares as it seems this is bet- ter understood and therefore accepted by shareholders. WA comparison WA companies represent 30 per cent ofASX-listed companies and, not surprisingly, 70 per cent of those are in the energy, metals and mining sec- tors; the majority of these are juniors. Unlike listed companies on the east coast, there is no income being gener- ated and capital raised is earmarked for exploration and development. With little cash to remunerate execu- tives, equity in the form of options has been the traditional way of attracting key talent. At the height of the boom, MDs and CEOs in WA were receiv- ing 40 per cent of their remuneration package in options compared with 15 per cent nationally. This figure has dropped back since then, however options remain the vehi- cle of choice for boards as opposed to performance rights. The biggest change has been in the conditions surrounding vesting, with length of service, key project mile- stones and increases in share price now being attached compared with uncon- ditional grants of the mid 2000s. The delay in the government pro- viding certainty over its expectations of executive remuneration has meant that, while the furore that arose as a result of the GFC has died down, the dust is still settling. Instead of making executive remu- neration simpler, it has made it more complex. Companies have responded by alter- ing the mix of remuneration. There is a shift towards fixed remu- neration (at higher levels). While now a smaller portion of overall remunera- tion, payment of short-term incentives is now being deferred and is no long- er paid only in cash, and long-term incentives take the form of perform- ance rights over fully paid shares, with more company specific performance hurdles for vesting. It doesn’t make for simple reading when the annual report arrives. • Pamela-Jayne Kinder is principal of PJ Kinder Consulting, an inde- pendent consultancy that advises on board and executive remuneration. Source: Thompson Reuters Connect 4 | Note: *2010 data not complete Actual remuneration mix – managing director/chief executive officer WA 100% – 80% – 60% – 40% – 20% – 0% – 100% – 80% – 60% – 40% – 20% – 0% – 2005 2006 2007 2008 2009 2010* Shares Options LTI STI Fixed Actual remuneration mix – managing director/chief executive officer Australia Chartered Luxury – for those who deserve the best The most Luxurious charter boat to grace Perth waters. • Impress VIP guests with a tailed charter down the Swan River, • Spend time with friends and family at Rottnest Island, • Celebrate your special occasions in style, • Make your company function a memorablel one. For further information or to book your charter, call us or visit our website. Phone: +61 8 9331 2566 Email: info@oceanmagiccharters.com.au www.oceanmagiccharters.com.au