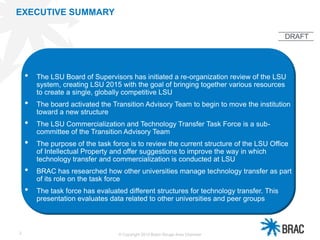
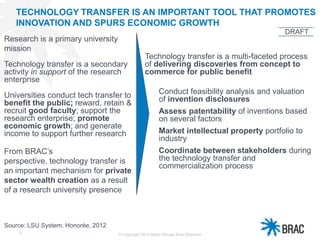
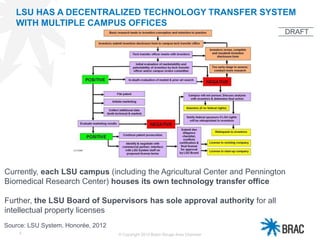
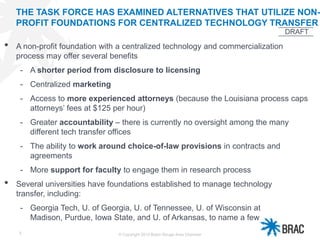
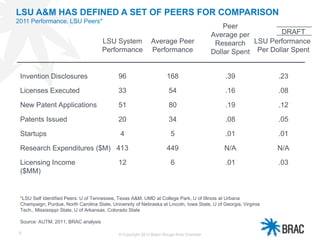
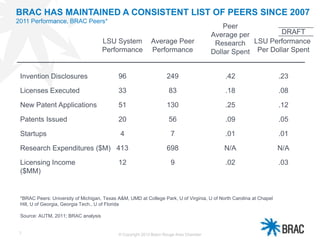
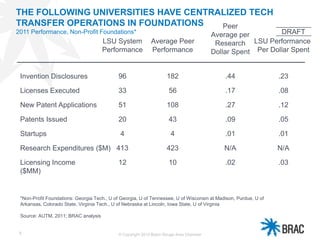
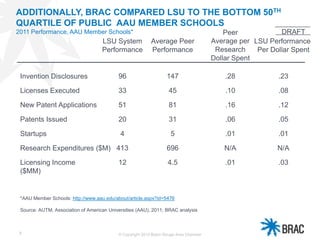
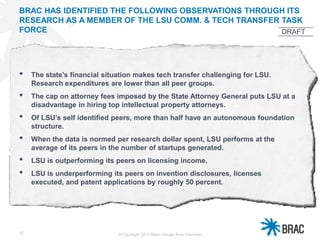
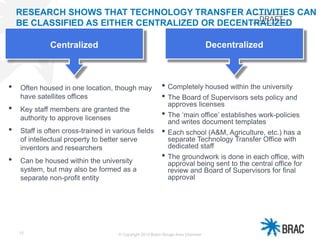
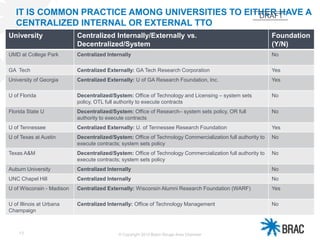
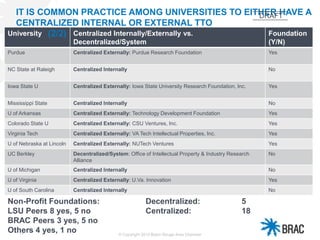
1
BRAC.ORG
Peer Data Review on Technology
Transfer and Commercialization
Presented in draft form to the LSU Commercialization and
Technology Transfer Task Force of The Transition Advisory
Committee
July 11th, 2013
DRAFTDRAFT
2
EXECUTIVE SUMMARY
© Copyright 2013 Baton Rouge Area Chamber
• The LSU Board of Supervisors has initiated a re-organization review of the LSU
system, creating LSU 2015 with the goal of bringing together various resources
to create a single, globally competitive LSU
• The board activated the Transition Advisory Team to begin to move the institution
toward a new structure
• The LSU Commercialization and Technology Transfer Task Force is a sub-
committee of the Transition Advisory Team
• The purpose of the task force is to review the current structure of the LSU Office
of Intellectual Property and offer suggestions to improve the way in which
technology transfer and commercialization is conducted at LSU
• BRAC has researched how other universities manage technology transfer as part
of its role on the task force
• The task force has evaluated different structures for technology transfer. This
presentation evaluates data related to other universities and peer groups
DRAFT
3
TECHNOLOGY TRANSFER IS AN IMPORTANT TOOL THAT PROMOTES
INNOVATION AND SPURS ECONOMIC GROWTH
Technology transfer is a multi-faceted process
of delivering discoveries from concept to
commerce for public benefit
Conduct feasibility analysis and valuation
of invention disclosures
Assess patentability of inventions based
on several factors
Market intellectual property portfolio to
industry
Coordinate between stakeholders during
the technology transfer and
commercialization process
© Copyright 2013 Baton Rouge Area Chamber
Technology transfer is a secondary
activity in support of the research
enterprise
Research is a primary university
mission
Universities conduct tech transfer to
benefit the public; reward, retain &
recruit good faculty; support the
research enterprise; promote
economic growth; and generate
income to support further research
From BRAC’s
perspective, technology transfer is
an important mechanism for private
sector wealth creation as a result
of a research university presence
Source: LSU System, Honorée, 2012
DRAFT
4
LSU HAS A DECENTRALIZED TECHNOLOGY TRANSFER SYSTEM
WITH MULTIPLE CAMPUS OFFICES
© Copyright 2013 Baton Rouge Area Chamber
Currently, each LSU campus (including the Agricultural Center and Pennington
Biomedical Research Center) houses its own technology transfer office
Further, the LSU Board of Supervisors has sole approval authority for all
intellectual property licenses
Source: LSU System, Honorée, 2012
DRAFT
5
THE TASK FORCE HAS EXAMINED ALTERNATIVES THAT UTILIZE NON-
PROFIT FOUNDATIONS FOR CENTRALIZED TECHNOLOGY TRANSFER
• A non-profit foundation with a centralized technology and commercialization
process may offer several benefits
- A shorter period from disclosure to licensing
- Centralized marketing
- Access to more experienced attorneys (because the Louisiana process caps
attorneys’ fees at $125 per hour)
- Greater accountability – there is currently no oversight among the many
different tech transfer offices
- The ability to work around choice-of-law provisions in contracts and
agreements
- More support for faculty to engage them in research process
• Several universities have foundations established to manage technology
transfer, including:
- Georgia Tech, U. of Georgia, U. of Tennessee, U. of Wisconsin at
Madison, Purdue, Iowa State, and U. of Arkansas, to name a few
© Copyright 2013 Baton Rouge Area Chamber
DRAFT
6
LSU A&M HAS DEFINED A SET OF PEERS FOR COMPARISON
2011 Performance, LSU Peers*
© Copyright 2013 Baton Rouge Area Chamber
Research Expenditures ($M)
Invention Disclosures
Licenses Executed
New Patent Applications
Patents Issued
Peer
Average per
Research
Dollar Spent
LSU System
Performance
413
12
96
33
51
20
N/A
.01
.39
.16
.19
.08
LSU Performance
Per Dollar Spent
N/A
.03
.23
.08
.12
.05
Licensing Income
($MM)
Average Peer
Performance
168
54
80
34
449
6
Startups 4 5 .01 .01
*LSU Self Identified Peers: U of Tennessee, Texas A&M, UMD at College Park, U of Illinois at Urbana
Champaign, Purdue, North Carolina State, University of Nebraska at Lincoln, Iowa State, U of Georgia, Virginia
Tech., Mississippi State, U of Arkansas, Colorado State
Source: AUTM, 2011; BRAC analysis
DRAFT
7
BRAC HAS MAINTAINED A CONSISTENT LIST OF PEERS SINCE 2007
2011 Performance, BRAC Peers*
© Copyright 2013 Baton Rouge Area Chamber
Research Expenditures ($M)
Invention Disclosures
Licenses Executed
New Patent Applications
Patents Issued
Peer
Average per
Research
Dollar Spent
LSU System
Performance
413
12
96
33
51
20
N/A
.02
.42
.18
.25
.09
LSU Performance
Per Dollar Spent
N/A
.03
.23
.08
.12
.05
Licensing Income
($MM)
Average Peer
Performance
249
83
130
56
698
9
Startups 4 7 .01 .01
*BRAC Peers: University of Michigan, Texas A&M, UMD at College Park, U of Virginia, U of North Carolina at Chapel
Hill, U of Georgia, Georgia Tech., U of Florida
Source: AUTM, 2011; BRAC analysis
DRAFT
8
THE FOLLOWING UNIVERSITIES HAVE CENTRALIZED TECH
TRANSFER OPERATIONS IN FOUNDATIONS
2011 Performance, Non-Profit Foundations*
© Copyright 2013 Baton Rouge Area Chamber
Research Expenditures ($M)
Invention Disclosures
Licenses Executed
New Patent Applications
Patents Issued
Peer
Average per
Research
Dollar Spent
LSU System
Performance
413
12
96
33
51
20
N/A
.02
.44
.17
.27
.09
LSU Performance
Per Dollar Spent
N/A
.03
.23
.08
.12
.05
Licensing Income
($MM)
Average Peer
Performance
182
56
108
43
423
10
Startups 4 4 .01 .01
*Non-Profit Foundations: Georgia Tech., U of Georgia, U of Tennessee, U of Wisconsin at Madison, Purdue, U of
Arkansas, Colorado State, Virginia Tech., U of Nebraska at Lincoln, Iowa State, U of Virginia
Source: AUTM, 2011; BRAC analysis
DRAFT
9
ADDITIONALLY, BRAC COMPARED LSU TO THE BOTTOM 50TH
QUARTILE OF PUBLIC AAU MEMBER SCHOOLS
2011 Performance, AAU Member Schools*
© Copyright 2013 Baton Rouge Area Chamber
Research Expenditures ($M)
Invention Disclosures
Licenses Executed
New Patent Applications
Patents Issued
Peer
Average per
Research
Dollar Spent
LSU System
Performance
413
12
96
33
51
20
N/A
.01
.28
.10
.16
.06
LSU Performance
Per Dollar Spent
N/A
.03
.23
.08
.12
.05
Licensing Income
($MM)
Average Peer
Performance
147
45
81
31
696
4.5
Startups 4 5 .01 .01
*AAU Member Schools: http://www.aau.edu/about/article.aspx?id=5476
Source: AUTM, Association of American Universities (AAU), 2011; BRAC analysis
DRAFT
10
BRAC HAS IDENTIFIED THE FOLLOWING OBSERVATIONS THROUGH ITS
RESEARCH AS A MEMBER OF THE LSU COMM. & TECH TRANSFER TASK
FORCE
© Copyright 2013 Baton Rouge Area Chamber
• The state’s financial situation makes tech transfer challenging for LSU.
Research expenditures are lower than all peer groups.
• The cap on attorney fees imposed by the State Attorney General puts LSU at a
disadvantage in hiring top intellectual property attorneys.
• Of LSU’s self identified peers, more than half have an autonomous foundation
structure.
• When the data is normed per research dollar spent, LSU performs at the
average of its peers in the number of startups generated.
• LSU is outperforming its peers on licensing income.
• LSU is underperforming its peers on invention disclosures, licenses
executed, and patent applications by roughly 50 percent.
DRAFT
11
Reference Material
© Copyright 2013 Baton Rouge Area Chamber
DRAFT
12
• Often housed in one location, though may
have satellites offices
• Key staff members are granted the
authority to approve licenses
• Staff is often cross-trained in various fields
of intellectual property to better serve
inventors and researchers
• Can be housed within the university
system, but may also be formed as a
separate non-profit entity
• Completely housed within the university
• The Board of Supervisors sets policy and
approves licenses
• The ‘main office’ establishes work-policies
and writes document templates
• Each school (A&M, Agriculture, etc.) has a
separate Technology Transfer Office with
dedicated staff
• The groundwork is done in each office, with
approval being sent to the central office for
review and Board of Supervisors for final
approval
© Copyright 2013 Baton Rouge Area Chamber
RESEARCH SHOWS THAT TECHNOLOGY TRANSFER ACTIVITIES CAN
BE CLASSIFIED AS EITHER CENTRALIZED OR DECENTRALIZED
Centralized Decentralized
DRAFT
13
IT IS COMMON PRACTICE AMONG UNIVERSITIES TO EITHER HAVE A
CENTRALIZED INTERNAL OR EXTERNAL TTO
(1/2)
© Copyright 2013 Baton Rouge Area Chamber
University Centralized Internally/Externally vs.
Decentralized/System
Foundation
(Y/N)
UMD at College Park Centralized Internally No
GA Tech Centralized Externally: GA Tech Research Corporation Yes
University of Georgia Centralized Externally: U of GA Research Foundation, Inc. Yes
U of Florida Decentralized/System: Office of Technology and Licensing – system sets
policy, OTL full authority to execute contracts
No
Florida State U Decentralized/System: Office of Research– system sets policy, OR full
authority to execute contracts
No
U of Tennessee Centralized Externally: U. of Tennessee Research Foundation Yes
U of Texas at Austin Decentralized/System: Office of Technology Commercialization full authority to
execute contracts; system sets policy
No
Texas A&M Decentralized/System: Office of Technology Commercialization full authority to
execute contracts; system sets policy
No
Auburn University Centralized Internally No
UNC Chapel Hill Centralized Internally No
U of Wisconsin - Madison Centralized Externally: Wisconsin Alumni Research Foundation (WARF) Yes
U of Illinois at Urbana
Champaign
Centralized Internally: Office of Technology Management No
DRAFT
14 © Copyright 2013 Baton Rouge Area Chamber
University Centralized Internally/Externally vs.
Decentralized/System
Foundation
(Y/N)
Purdue Centralized Externally: Purdue Research Foundation Yes
NC State at Raleigh Centralized Internally No
Iowa State U Centralized Externally: Iowa State University Research Foundation, Inc. Yes
Mississippi State Centralized Internally No
U of Arkansas Centralized Externally: Technology Development Foundation Yes
Colorado State U Centralized Externally: CSU Ventures, Inc. Yes
Virginia Tech Centralized Externally: VA Tech Intellectual Properties, Inc. Yes
U of Nebraska at Lincoln Centralized Externally: NUTech Ventures Yes
UC Berkley Decentralized/System: Office of Intellectual Property & Industry Research
Alliance
No
U of Michigan Centralized Internally No
U of Virginia Centralized Externally: U.Va. Innovation Yes
U of South Carolina Centralized Internally No
IT IS COMMON PRACTICE AMONG UNIVERSITIES TO EITHER HAVE A
CENTRALIZED INTERNAL OR EXTERNAL TTO
(2/2)
Decentralized: 5
Centralized: 18
Non-Profit Foundations:
LSU Peers 8 yes, 5 no
BRAC Peers 3 yes, 5 no
Others 4 yes, 1 no
DRAFT
15
BRAC.ORG
THANK YOU
Adam Knapp
President and CEO
Baton Rouge Area Chamber
knapp@brac.org
(225) 381-7125

BRAC Technology Transfer Analysis

  • 1.
    1 BRAC.ORG Peer Data Reviewon Technology Transfer and Commercialization Presented in draft form to the LSU Commercialization and Technology Transfer Task Force of The Transition Advisory Committee July 11th, 2013 DRAFTDRAFT
  • 2.
    2 EXECUTIVE SUMMARY © Copyright2013 Baton Rouge Area Chamber • The LSU Board of Supervisors has initiated a re-organization review of the LSU system, creating LSU 2015 with the goal of bringing together various resources to create a single, globally competitive LSU • The board activated the Transition Advisory Team to begin to move the institution toward a new structure • The LSU Commercialization and Technology Transfer Task Force is a sub- committee of the Transition Advisory Team • The purpose of the task force is to review the current structure of the LSU Office of Intellectual Property and offer suggestions to improve the way in which technology transfer and commercialization is conducted at LSU • BRAC has researched how other universities manage technology transfer as part of its role on the task force • The task force has evaluated different structures for technology transfer. This presentation evaluates data related to other universities and peer groups DRAFT
  • 3.
    3 TECHNOLOGY TRANSFER ISAN IMPORTANT TOOL THAT PROMOTES INNOVATION AND SPURS ECONOMIC GROWTH Technology transfer is a multi-faceted process of delivering discoveries from concept to commerce for public benefit Conduct feasibility analysis and valuation of invention disclosures Assess patentability of inventions based on several factors Market intellectual property portfolio to industry Coordinate between stakeholders during the technology transfer and commercialization process © Copyright 2013 Baton Rouge Area Chamber Technology transfer is a secondary activity in support of the research enterprise Research is a primary university mission Universities conduct tech transfer to benefit the public; reward, retain & recruit good faculty; support the research enterprise; promote economic growth; and generate income to support further research From BRAC’s perspective, technology transfer is an important mechanism for private sector wealth creation as a result of a research university presence Source: LSU System, Honorée, 2012 DRAFT
  • 4.
    4 LSU HAS ADECENTRALIZED TECHNOLOGY TRANSFER SYSTEM WITH MULTIPLE CAMPUS OFFICES © Copyright 2013 Baton Rouge Area Chamber Currently, each LSU campus (including the Agricultural Center and Pennington Biomedical Research Center) houses its own technology transfer office Further, the LSU Board of Supervisors has sole approval authority for all intellectual property licenses Source: LSU System, Honorée, 2012 DRAFT
  • 5.
    5 THE TASK FORCEHAS EXAMINED ALTERNATIVES THAT UTILIZE NON- PROFIT FOUNDATIONS FOR CENTRALIZED TECHNOLOGY TRANSFER • A non-profit foundation with a centralized technology and commercialization process may offer several benefits - A shorter period from disclosure to licensing - Centralized marketing - Access to more experienced attorneys (because the Louisiana process caps attorneys’ fees at $125 per hour) - Greater accountability – there is currently no oversight among the many different tech transfer offices - The ability to work around choice-of-law provisions in contracts and agreements - More support for faculty to engage them in research process • Several universities have foundations established to manage technology transfer, including: - Georgia Tech, U. of Georgia, U. of Tennessee, U. of Wisconsin at Madison, Purdue, Iowa State, and U. of Arkansas, to name a few © Copyright 2013 Baton Rouge Area Chamber DRAFT
  • 6.
    6 LSU A&M HASDEFINED A SET OF PEERS FOR COMPARISON 2011 Performance, LSU Peers* © Copyright 2013 Baton Rouge Area Chamber Research Expenditures ($M) Invention Disclosures Licenses Executed New Patent Applications Patents Issued Peer Average per Research Dollar Spent LSU System Performance 413 12 96 33 51 20 N/A .01 .39 .16 .19 .08 LSU Performance Per Dollar Spent N/A .03 .23 .08 .12 .05 Licensing Income ($MM) Average Peer Performance 168 54 80 34 449 6 Startups 4 5 .01 .01 *LSU Self Identified Peers: U of Tennessee, Texas A&M, UMD at College Park, U of Illinois at Urbana Champaign, Purdue, North Carolina State, University of Nebraska at Lincoln, Iowa State, U of Georgia, Virginia Tech., Mississippi State, U of Arkansas, Colorado State Source: AUTM, 2011; BRAC analysis DRAFT
  • 7.
    7 BRAC HAS MAINTAINEDA CONSISTENT LIST OF PEERS SINCE 2007 2011 Performance, BRAC Peers* © Copyright 2013 Baton Rouge Area Chamber Research Expenditures ($M) Invention Disclosures Licenses Executed New Patent Applications Patents Issued Peer Average per Research Dollar Spent LSU System Performance 413 12 96 33 51 20 N/A .02 .42 .18 .25 .09 LSU Performance Per Dollar Spent N/A .03 .23 .08 .12 .05 Licensing Income ($MM) Average Peer Performance 249 83 130 56 698 9 Startups 4 7 .01 .01 *BRAC Peers: University of Michigan, Texas A&M, UMD at College Park, U of Virginia, U of North Carolina at Chapel Hill, U of Georgia, Georgia Tech., U of Florida Source: AUTM, 2011; BRAC analysis DRAFT
  • 8.
    8 THE FOLLOWING UNIVERSITIESHAVE CENTRALIZED TECH TRANSFER OPERATIONS IN FOUNDATIONS 2011 Performance, Non-Profit Foundations* © Copyright 2013 Baton Rouge Area Chamber Research Expenditures ($M) Invention Disclosures Licenses Executed New Patent Applications Patents Issued Peer Average per Research Dollar Spent LSU System Performance 413 12 96 33 51 20 N/A .02 .44 .17 .27 .09 LSU Performance Per Dollar Spent N/A .03 .23 .08 .12 .05 Licensing Income ($MM) Average Peer Performance 182 56 108 43 423 10 Startups 4 4 .01 .01 *Non-Profit Foundations: Georgia Tech., U of Georgia, U of Tennessee, U of Wisconsin at Madison, Purdue, U of Arkansas, Colorado State, Virginia Tech., U of Nebraska at Lincoln, Iowa State, U of Virginia Source: AUTM, 2011; BRAC analysis DRAFT
  • 9.
    9 ADDITIONALLY, BRAC COMPAREDLSU TO THE BOTTOM 50TH QUARTILE OF PUBLIC AAU MEMBER SCHOOLS 2011 Performance, AAU Member Schools* © Copyright 2013 Baton Rouge Area Chamber Research Expenditures ($M) Invention Disclosures Licenses Executed New Patent Applications Patents Issued Peer Average per Research Dollar Spent LSU System Performance 413 12 96 33 51 20 N/A .01 .28 .10 .16 .06 LSU Performance Per Dollar Spent N/A .03 .23 .08 .12 .05 Licensing Income ($MM) Average Peer Performance 147 45 81 31 696 4.5 Startups 4 5 .01 .01 *AAU Member Schools: http://www.aau.edu/about/article.aspx?id=5476 Source: AUTM, Association of American Universities (AAU), 2011; BRAC analysis DRAFT
  • 10.
    10 BRAC HAS IDENTIFIEDTHE FOLLOWING OBSERVATIONS THROUGH ITS RESEARCH AS A MEMBER OF THE LSU COMM. & TECH TRANSFER TASK FORCE © Copyright 2013 Baton Rouge Area Chamber • The state’s financial situation makes tech transfer challenging for LSU. Research expenditures are lower than all peer groups. • The cap on attorney fees imposed by the State Attorney General puts LSU at a disadvantage in hiring top intellectual property attorneys. • Of LSU’s self identified peers, more than half have an autonomous foundation structure. • When the data is normed per research dollar spent, LSU performs at the average of its peers in the number of startups generated. • LSU is outperforming its peers on licensing income. • LSU is underperforming its peers on invention disclosures, licenses executed, and patent applications by roughly 50 percent. DRAFT
  • 11.
    11 Reference Material © Copyright2013 Baton Rouge Area Chamber DRAFT
  • 12.
    12 • Often housedin one location, though may have satellites offices • Key staff members are granted the authority to approve licenses • Staff is often cross-trained in various fields of intellectual property to better serve inventors and researchers • Can be housed within the university system, but may also be formed as a separate non-profit entity • Completely housed within the university • The Board of Supervisors sets policy and approves licenses • The ‘main office’ establishes work-policies and writes document templates • Each school (A&M, Agriculture, etc.) has a separate Technology Transfer Office with dedicated staff • The groundwork is done in each office, with approval being sent to the central office for review and Board of Supervisors for final approval © Copyright 2013 Baton Rouge Area Chamber RESEARCH SHOWS THAT TECHNOLOGY TRANSFER ACTIVITIES CAN BE CLASSIFIED AS EITHER CENTRALIZED OR DECENTRALIZED Centralized Decentralized DRAFT
  • 13.
    13 IT IS COMMONPRACTICE AMONG UNIVERSITIES TO EITHER HAVE A CENTRALIZED INTERNAL OR EXTERNAL TTO (1/2) © Copyright 2013 Baton Rouge Area Chamber University Centralized Internally/Externally vs. Decentralized/System Foundation (Y/N) UMD at College Park Centralized Internally No GA Tech Centralized Externally: GA Tech Research Corporation Yes University of Georgia Centralized Externally: U of GA Research Foundation, Inc. Yes U of Florida Decentralized/System: Office of Technology and Licensing – system sets policy, OTL full authority to execute contracts No Florida State U Decentralized/System: Office of Research– system sets policy, OR full authority to execute contracts No U of Tennessee Centralized Externally: U. of Tennessee Research Foundation Yes U of Texas at Austin Decentralized/System: Office of Technology Commercialization full authority to execute contracts; system sets policy No Texas A&M Decentralized/System: Office of Technology Commercialization full authority to execute contracts; system sets policy No Auburn University Centralized Internally No UNC Chapel Hill Centralized Internally No U of Wisconsin - Madison Centralized Externally: Wisconsin Alumni Research Foundation (WARF) Yes U of Illinois at Urbana Champaign Centralized Internally: Office of Technology Management No DRAFT
  • 14.
    14 © Copyright2013 Baton Rouge Area Chamber University Centralized Internally/Externally vs. Decentralized/System Foundation (Y/N) Purdue Centralized Externally: Purdue Research Foundation Yes NC State at Raleigh Centralized Internally No Iowa State U Centralized Externally: Iowa State University Research Foundation, Inc. Yes Mississippi State Centralized Internally No U of Arkansas Centralized Externally: Technology Development Foundation Yes Colorado State U Centralized Externally: CSU Ventures, Inc. Yes Virginia Tech Centralized Externally: VA Tech Intellectual Properties, Inc. Yes U of Nebraska at Lincoln Centralized Externally: NUTech Ventures Yes UC Berkley Decentralized/System: Office of Intellectual Property & Industry Research Alliance No U of Michigan Centralized Internally No U of Virginia Centralized Externally: U.Va. Innovation Yes U of South Carolina Centralized Internally No IT IS COMMON PRACTICE AMONG UNIVERSITIES TO EITHER HAVE A CENTRALIZED INTERNAL OR EXTERNAL TTO (2/2) Decentralized: 5 Centralized: 18 Non-Profit Foundations: LSU Peers 8 yes, 5 no BRAC Peers 3 yes, 5 no Others 4 yes, 1 no DRAFT
  • 15.
    15 BRAC.ORG THANK YOU Adam Knapp Presidentand CEO Baton Rouge Area Chamber knapp@brac.org (225) 381-7125