Download to read offline

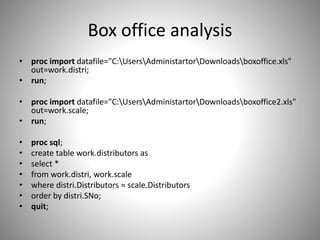
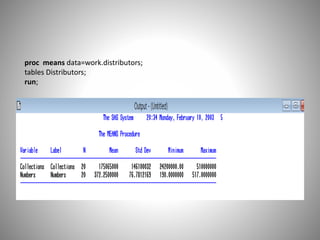
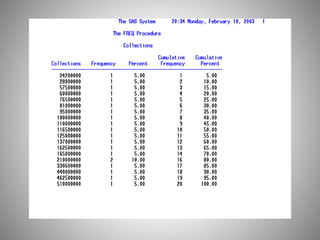
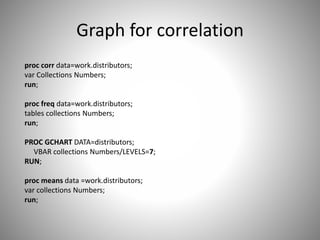
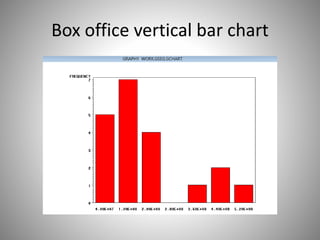
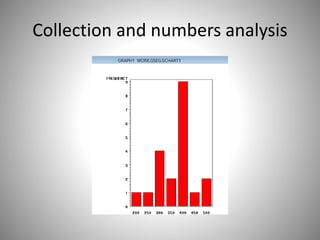

This document discusses analyzing box office data. It imports box office data from two Excel files into SAS tables, merges the tables on distributor, and calculates summary statistics and correlations. Graphs are generated including a vertical bar chart of collections and numbers to visualize the relationship between variables.