Download to read offline
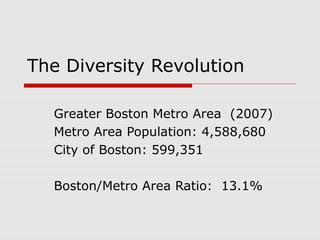
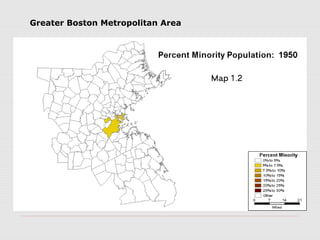
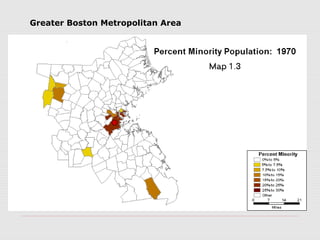
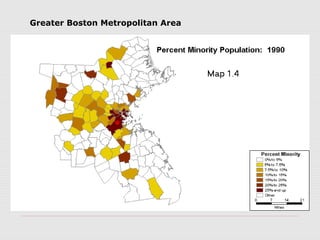

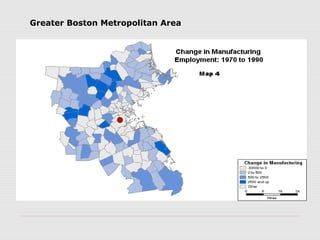
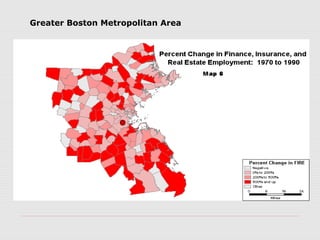
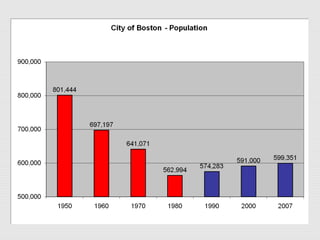
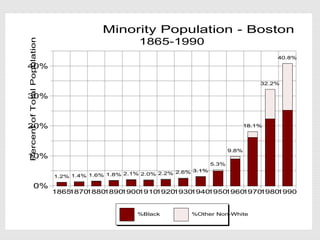
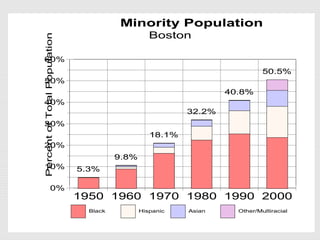
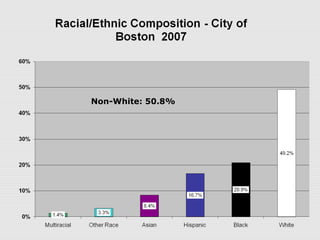
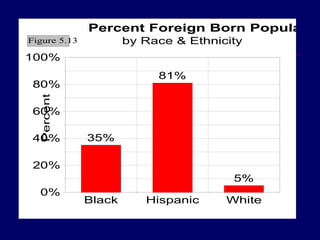
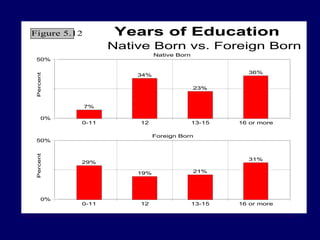

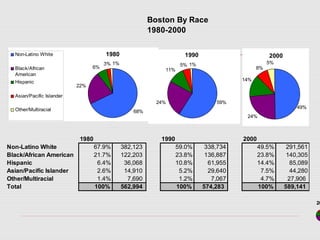

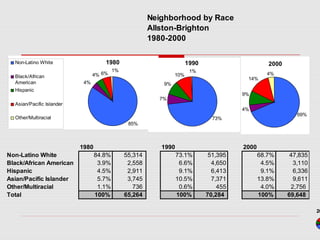
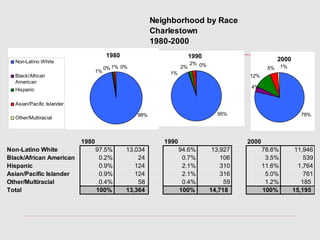

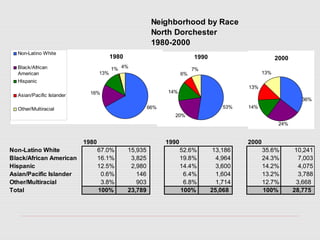

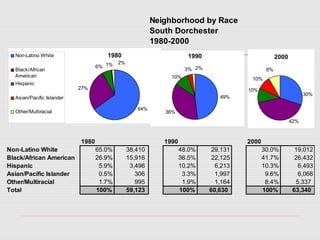
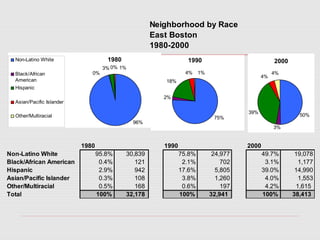
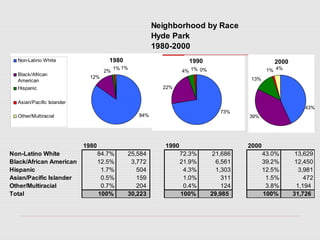

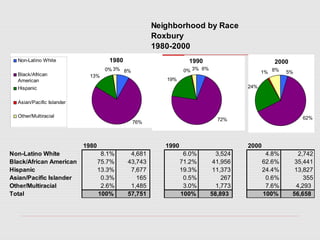
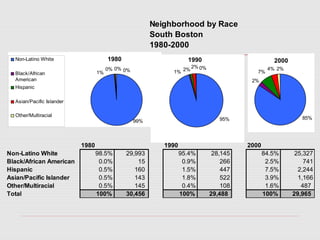

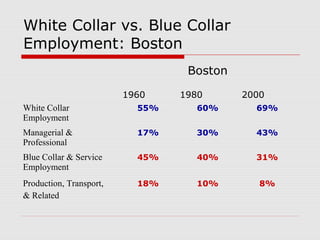
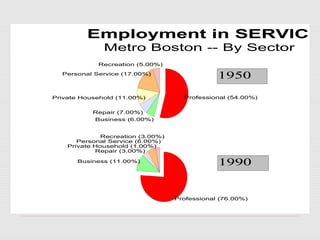


This document summarizes demographic changes in Boston from 1950 to 2007 through statistics and graphs. It shows that: 1) The racial diversity of Boston increased dramatically over this time period, with the percentage of non-white residents growing from 5.3% in 1950 to over 50% in 2000. 2) The foreign-born population also increased substantially, representing over 36% of Boston residents by 2000 compared to just 7% in 1950. 3) The economy shifted from blue-collar industrial jobs to white-collar professional jobs, especially in sectors like higher education, health care, financial services, and high tech.


