1. BERGEN COUNTY, NEW JERSEY
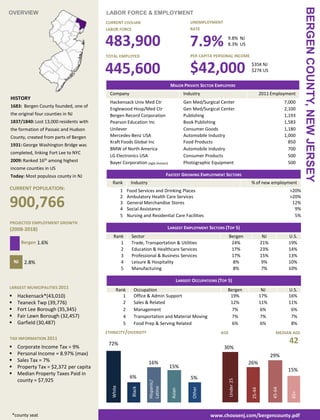
OVERVIEW LABOR FORCE & EMPLOYMENT
CURRENT CIVILIAN UNEMPLOYMENT
LABOR FORCE RATE
483,900 7.9% 9.8% NJ
8.3% US
TOTAL EMPLOYED PER CAPITA PERSONAL INCOME
445,600 $42,000 $35K NJ
$27K US
MAJOR PRIVATE SECTOR EMPLOYERS
Company Industry 2011 Employment
HISTORY
Hackensack Univ Med Ctr Gen Med/Surgical Center 7,000
1683: Bergen County founded, one of
Englewood Hosp/Med Ctr Gen Med/Surgical Center 2,100
the original four counties in NJ Bergen Record Corporation Publishing 1,193
1837/1840: Lost 13,000 residents with Pearson Education Inc Book Publishing 1,583
the formation of Passaic and Hudson Unilever Consumer Goods 1,180
County, created from parts of Bergen Mercedes-Benz USA Automobile Industry 1,000
Kraft Foods Global Inc Food Products 850
1931: George Washington Bridge was
BMW of North America Automobile Industry 700
completed, linking Fort Lee to NYC
LG Electronics USA Consumer Products 500
2009: Ranked 16th among highest Bayer Corporation (Agfa Division) Photographic Equipment 500
income counties in US
Today: Most populous county in NJ FASTEST GROWING EMPLOYMENT SECTORS
Rank Industry % of new employment
CURRENT POPULATION: 1 Food Services and Drinking Places >20%
2 Ambulatory Health Care Services >20%
900,766 3
4
General Merchandise Stores
Social Assistance
12%
9%
5 Nursing and Residential Care Facilities 5%
PROJECTED EMPLOYMENT GROWTH
(2008-2018) LARGEST EMPLOYMENT SECTORS (TOP 5)
Rank Sector Bergen NJ U.S.
Bergen 1.6% 1 Trade, Transportation & Utilities 24% 21% 19%
2 Education & Healthcare Services 17% 23% 14%
3 Professional & Business Services 17% 15% 13%
NJ 2.8% 4 Leisure & Hospitality 8% 9% 10%
5 Manufacturing 8% 7% 10%
LARGEST OCCUPATIONS (TOP 5)
LARGEST MUNICIPALITIES 2011
Rank Occupation Bergen NJ U.S.
Hackensack*(43,010) 1 Office & Admin Support 19% 17% 16%
Teaneck Twp (39,776) 2 Sales & Related 12% 11% 11%
Fort Lee Borough (35,345) 2 Management 7% 6% 6%
Fair Lawn Borough (32,457) 4 Transportation and Material Moving 7% 7% 7%
Garfield (30,487) 5 Food Prep & Serving Related 6% 6% 8%
ETHNICITY/DIVERSITY AGE MEDIAN AGE
TAX INFORMATION 2011
72% 42
Corporate Income Tax = 9% 30%
Personal Income = 8.97% (max) 29%
Sales Tax = 7% 16% 26%
Property Tax = $2,372 per capita 15%
15%
Median Property Taxes Paid in
6% 5%
county = $7,925
Under 25
Hispanic/
White
Latino
Black
Other
45-64
25-44
Asian
65+
*county seat www.choosenj.com/bergencounty.pdf
2. BERGEN COUNTY LABOR FORCE & EMPLOYMENT cont’d TRANSPORTATION/MOBILTY
EDUCATION ATTAINMENT AVG COMMUTE TIME (MINS) AVAIL TRANSPORTATION SYSTEMS
17% 10%
Less than H.S.
H.S. Diploma
29 30 NJ
25 US 247 Buses Routes
(statewide)
Some College CARPOOL
28% 25%
4 Yrs of College
> 4 Yrs of College 8.0% 3 Commuter Rail Lines
21% COUNTY: US: USE PUBLIC TRANSIT
COLLEGE DEGREE
45%
COLLEGE DEGREE
28%
13% 1 Light Rail Line
(Hudson-Bergen)
MILES OF INTERSTATES & KEY ROADS
LARGEST SCHOOL DISTRICTS HIGHWAYS (statewide) Garden State Parkway, NJ
Ridgewood
Grade 12
Enrollment
427
Average Combined
SAT score (US :1509)
1797
38,000 Turnpike, Palisades Interstate
Parkway
Interstates 80, 95, and 287.
Fairlawn 362 1581
Teaneck 357 1396 MILEAGE TO NEAREST AIRPORTS ABOUT LAGUARDIA AIRPORT
24 million passengers (2011)
Ramapo
North Highlands Regional
353
323
1696
1748 15 To LaGuardia
Airport 20th busiest in US
Generates $11 billion in
economic activity for NY/NJ
INSTITUTES OF HIGHER EDUCATION
Institute Type
ENROLLMENT
Under
graduate
Graduate 18 To Newark Int’l
Airport
ABOUT NEWARK INT’L AIRPORT
14th busiest in US (37th worldwide)
34 million passengers (2011)
812,000 short tons of cargo
Bergen County CC 2 Yr 16,469 NA
Ramapo College of NJ 4 Yr 5,776 250 MILEAGE TO NEAREST PORT ABOUT PORT OF NY/NJ
Fairleigh Dickinson Univ.
(Morris)
Stevens Inst of Tech
4 Yr
4 Yr
2,480
2,262
1,025
3,495
18 To Port of
NY/NJ
Busiest port on East Coast
3rd Busiest port in the US
Handled 5.3 million loaded and
Felician College (Hudson) 4 Yr 1,758 355 unloaded 20 ft equiv units
ACCESS TO CUSTOMERS Value of cargo that moved
VOCATIONAL SCHOOLS (MILLIONS) through port exceeds $190 Billion
100
Institute Enrollment Within one
High School Vocational 1,846 day drive
COST OF DOING BUSINESS
UTILITY COSTS 2011 WAGES
Type of Utility Cost/Available Providers Rank Occupation Bergen NJ
Gas $2.63 2nd lowest Bus. & Fin. Operations $89,900 $74,470
Electric 14.8 cents / Deregulated 7th highest Construction and Extraction $63,960 $56,400
Telecom Varies by location NA Food Prep & Serving Related $25,300 $23,650
Waste/Sewer Varies by location NA Healthcare Practitioners $88,200 $83,800
Healthcare Support $28,300 $28,450
Management $147,680 $131,770
Office & Admin Support $39,860 $36,810
KEY RESOURCES & CONTACTS Production $35,100 $35,630
TRACYE MCDANIEL | PRESIDENT AND CHIEF EXECUTIVE OFFICER Protective Services $48,790 $54,750
MICHAEL CHROBAK | CHIEF ECONOMIC DEVELOPMENT OFFICER Sales & Related $54,820 $43,760
Trnsp and Material Moving $40,490 $33,100
EconDev@choosenj.com
609-297-2200 SPACE AVAILABILITY
www.ChooseNJ.com
Type Sq Ft/Acre Occupancy Costs
SOURCES: NJ Department of Labor & US Bureau of Labor Statistics; American Community Land 345 acres $14.12 / sf
Survey, 2005-2009 Estimates,; NJ State Police & FBI, Uniform Crime Report; NJ Monthly
Industrial 13,956,000 sq ft $6.03 / sf
Magazine, 2010; NJ State Department of Education, Spring 2010; Board of Public Utilities;
Tax Foundation; Infoplease.com; Travelmath; CoStar; Hoovers; Institute for Energy Office 8,361,000 sq ft $25.28 / sf
Research; Data current as of May 2012
www.choosenj.com/bergencounty.pdf