This document discusses the basic anatomy and electrophysiology of the heart. It describes the four chambers of the heart - the right and left atria which are the receiving chambers, and the right and left ventricles which are the pumping chambers. It also discusses the sinus node which acts as the pacemaker, generating electrical impulses, and the intraventricular conduction system which allows orderly propagation of impulses from the atria to the ventricles. This includes the bundle of His, bundle branches and Purkinje fibers. Understanding the heart's anatomy and electrical conduction system is fundamental to electrocardiography.


![Acquisitions Editor: Frances Destefano
Managing Editor: Leanne McMillan
Marketing Manager: Kimberly Schonberger
Production Editor: Beth Martz
Design Coordinator: Stephen Druding
Compositor: Aptara, Inc.
Copyright © 2009 Lippincott Williams & Wilkins, a Wolters Kluwer business.
351 West Camden Street 530 Walnut Street
Baltimore, MD 21201 Philadelphia, PA 19106
Printed in China
All rights reserved. This book is protected by copyright. No part of this book may be reproduced or
transmitted in any form or by any means, including as photocopies or scanned-in or other electronic
copies, or utilized by any information storage and retrieval system without written permission from
the copyright owner, except for brief quotations embodied in critical articles and reviews. Materials
appearing in this book prepared by individuals as part of their official duties as U.S. govern-
ment employees are not covered by the above-mentioned copyright. To request permission,
please contact Lippincott Williams & Wilkins at 530 Walnut Street, Philadelphia, PA 19106, via email
at permissions@lww.com, or via website at lww.com (products and services).
9 8 7 6 5 4 3 2 1
Library of Congress Cataloging-in-Publication Data
Baltazar, Romulo F.
Basic and bedside electrocardiography / Romulo F. Baltazar.
p. ; cm.
Includes index.
ISBN-13: 978-0-7817-8804-5
ISBN-10: 0-7817-8804-8
1. Electrocardiography. I. Title.
[DNLM: 1. Electrocardiography. 2. Heart Diseases—diagnosis. 3. Heart
Diseases—therapy. WG 140 B197b 2009]
RC683.5.E5B283 2009
616.1207547—dc22
2008056135
DISCLAIMER
Care has been taken to confirm the accuracy of the information present and to describe gener-
ally accepted practices. However, the authors, editors, and publisher are not responsible for errors or
omissions or for any consequences from application of the information in this book and make no
warranty, expressed or implied, with respect to the currency, completeness, or accuracy of the con-
tents of the publication. Application of this information in a particular situation remains the profes-
sional responsibility of the practitioner; the clinical treatments described and recommended may not
be considered absolute and universal recommendations.
The authors, editors, and publisher have exerted every effort to ensure that drug selection and
dosage set forth in this text are in accordance with the current recommendations and practice at the
time of publication. However, in view of ongoing research, changes in government regulations, and
the constant flow of information relating to drug therapy and drug reactions, the reader is urged to
check the package insert for each drug for any change in indications and dosage and for added warn-
ings and precautions. This is particularly important when the recommended agent is a new or infre-
quently employed drug.
Some drugs and medical devices presented in this publication have Food and Drug Administra-
tion (FDA) clearance for limited use in restricted research settings. It is the responsibility of the health
care provider to ascertain the FDA status of each drug or device planned for use in their clinical
practice.
To purchase additional copies of this book, call our customer service department at (800) 638-3030
or fax orders to (301) 223-2320. International customers should call (301) 223-2300.
Visit Lippincott Williams Wilkins on the Internet: http://www.lww.com. Lippincott Williams
Wilkins customer service representatives are available from 8:30 am to 6:00 pm, EST.
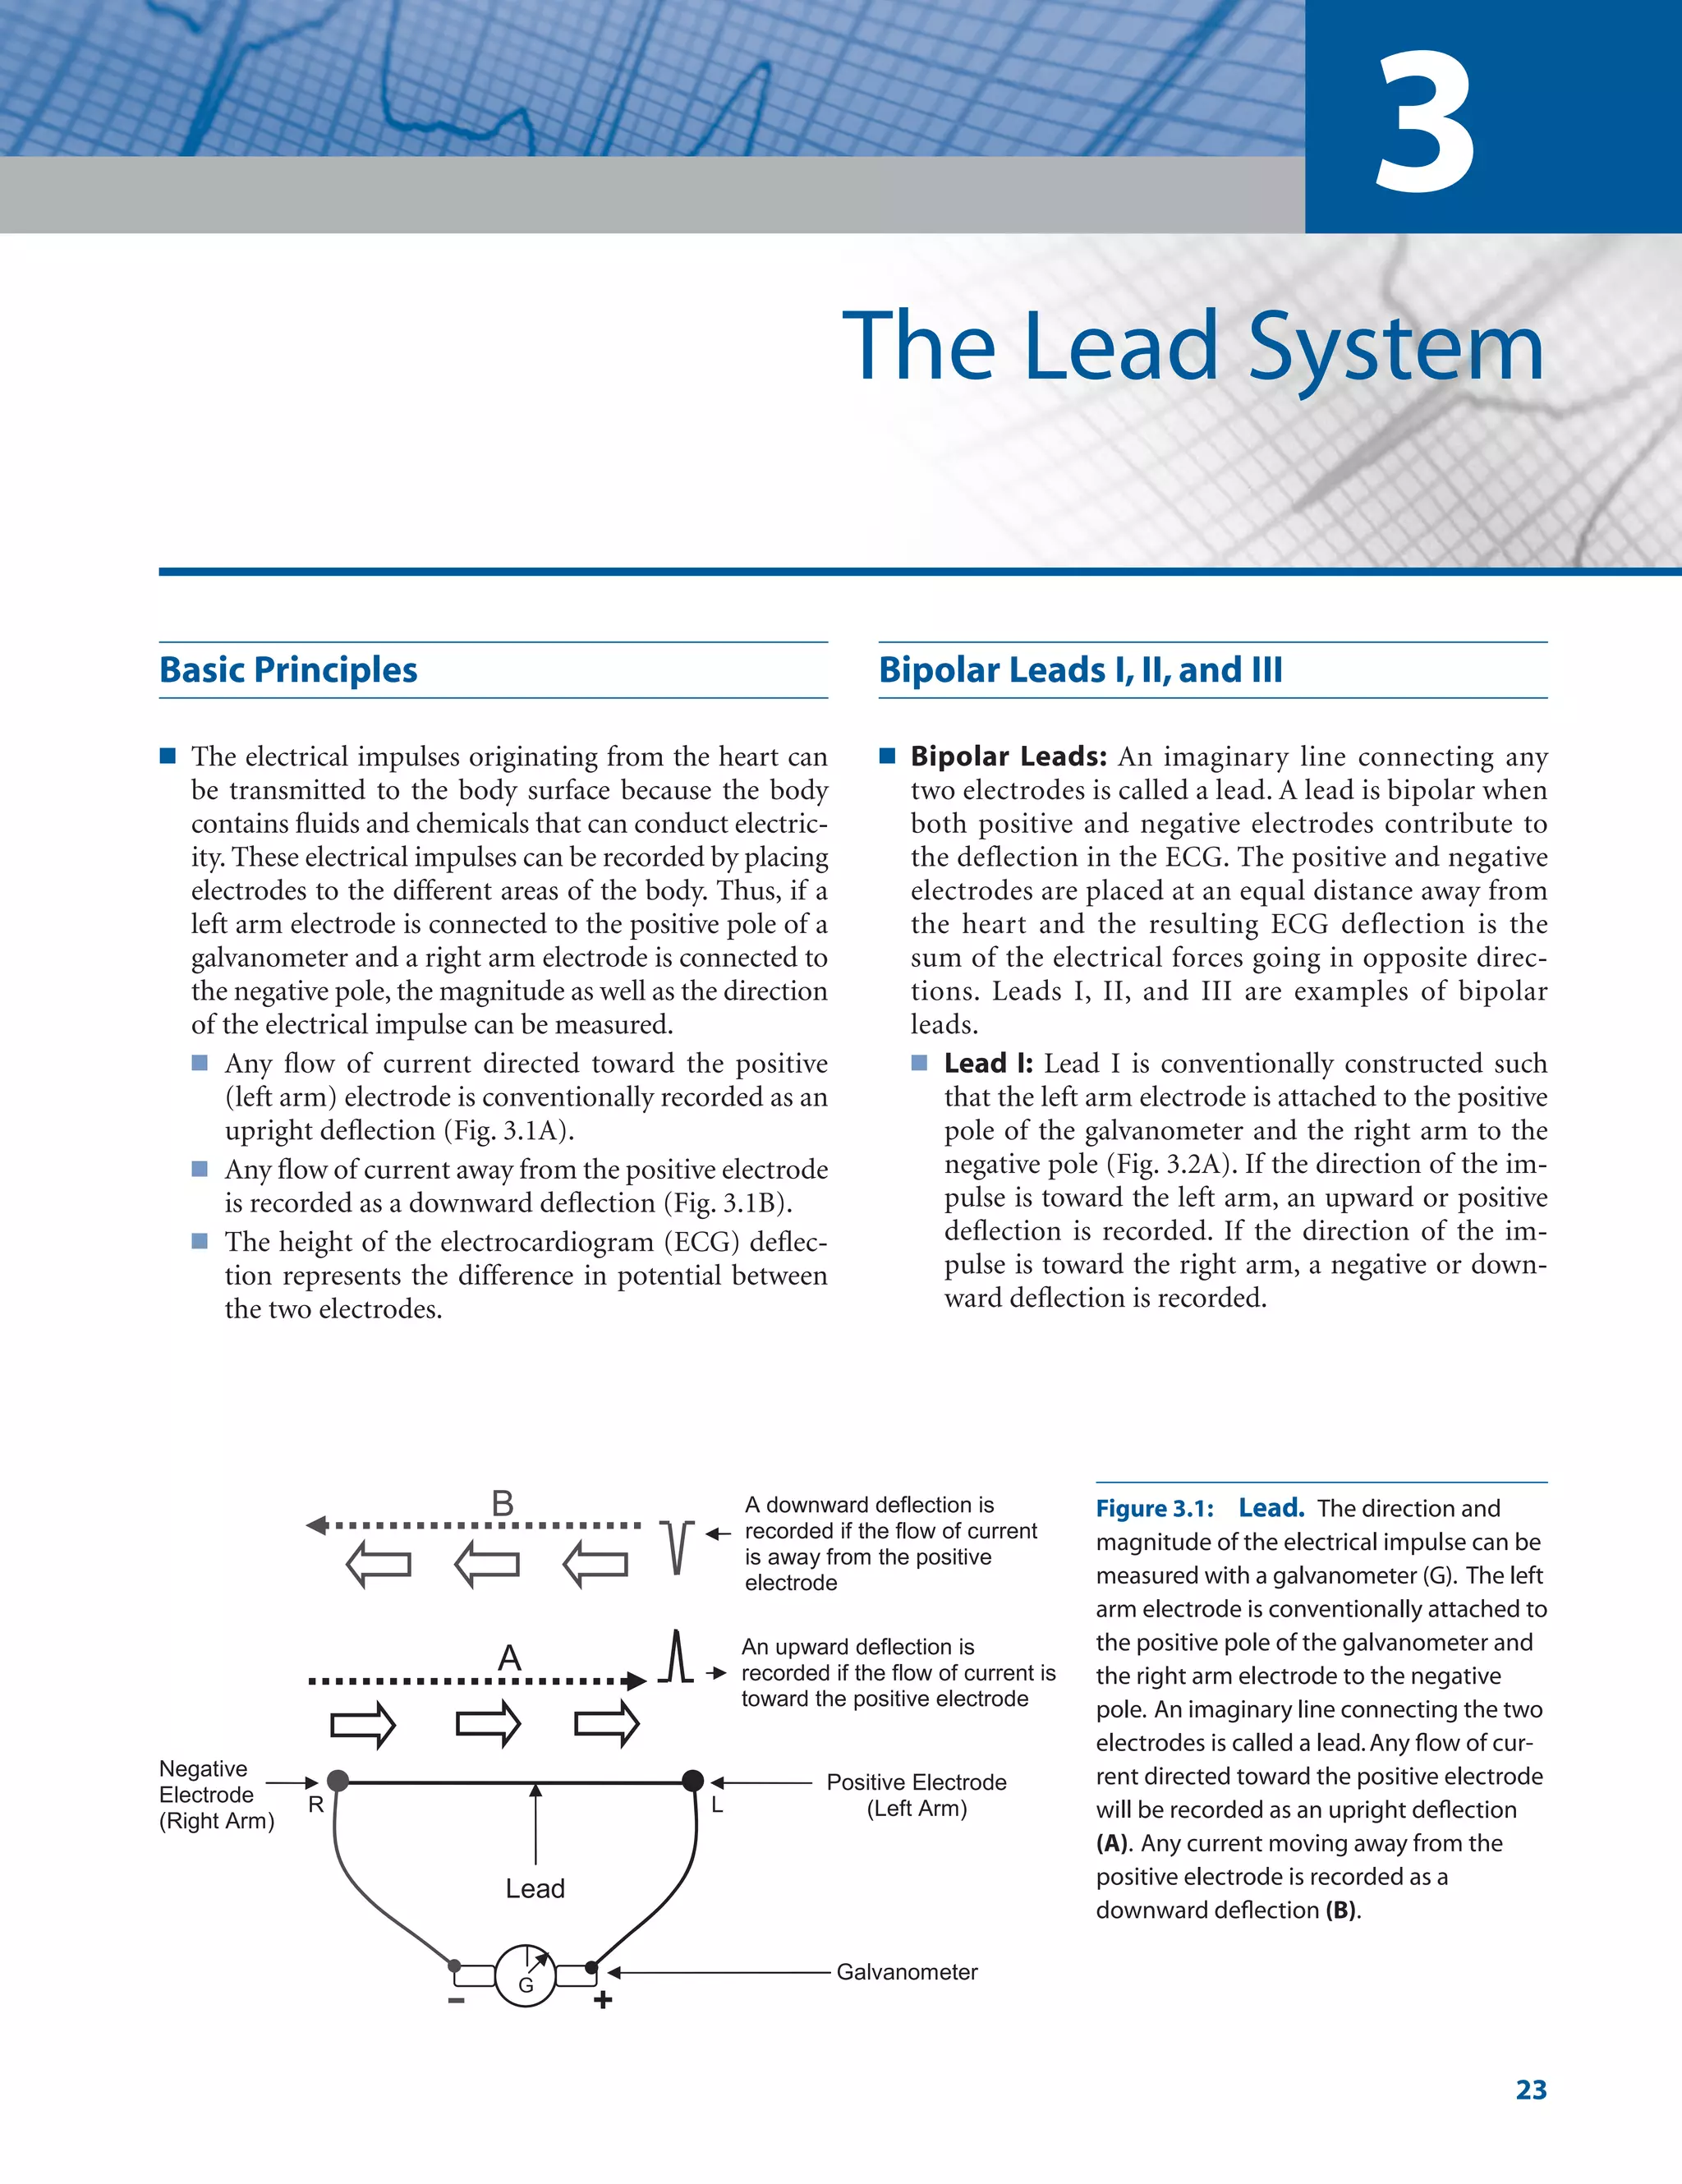
LWBK271-FM_i-x.qxd 1/29/09 1:58 PM Page iv LWBK271-C01_01-08.qxd](https://image.slidesharecdn.com/baltazaarecg-220505195141-84eaf65f/75/baltazaar-ecg-pdf-5-2048.jpg)


![4
The Electrical Axis and
Cardiac Rotation
30
The Frontal and Horizontal Planes
■ Figuring the direction or axis of the QRS complex (or
any wave in the electrocardiogram [ECG]) requires a
thorough understanding of the location of each of the
different leads in the 12-lead ECG. This knowledge is
crucial and provides the basic foundation for under-
standing electrocardiography. Before attempting to
read this chapter, a review of the previous chapter is
mandatory.
■ The ECG mirrors both frontal and horizontal planes of
the body and is thus tridimensional.
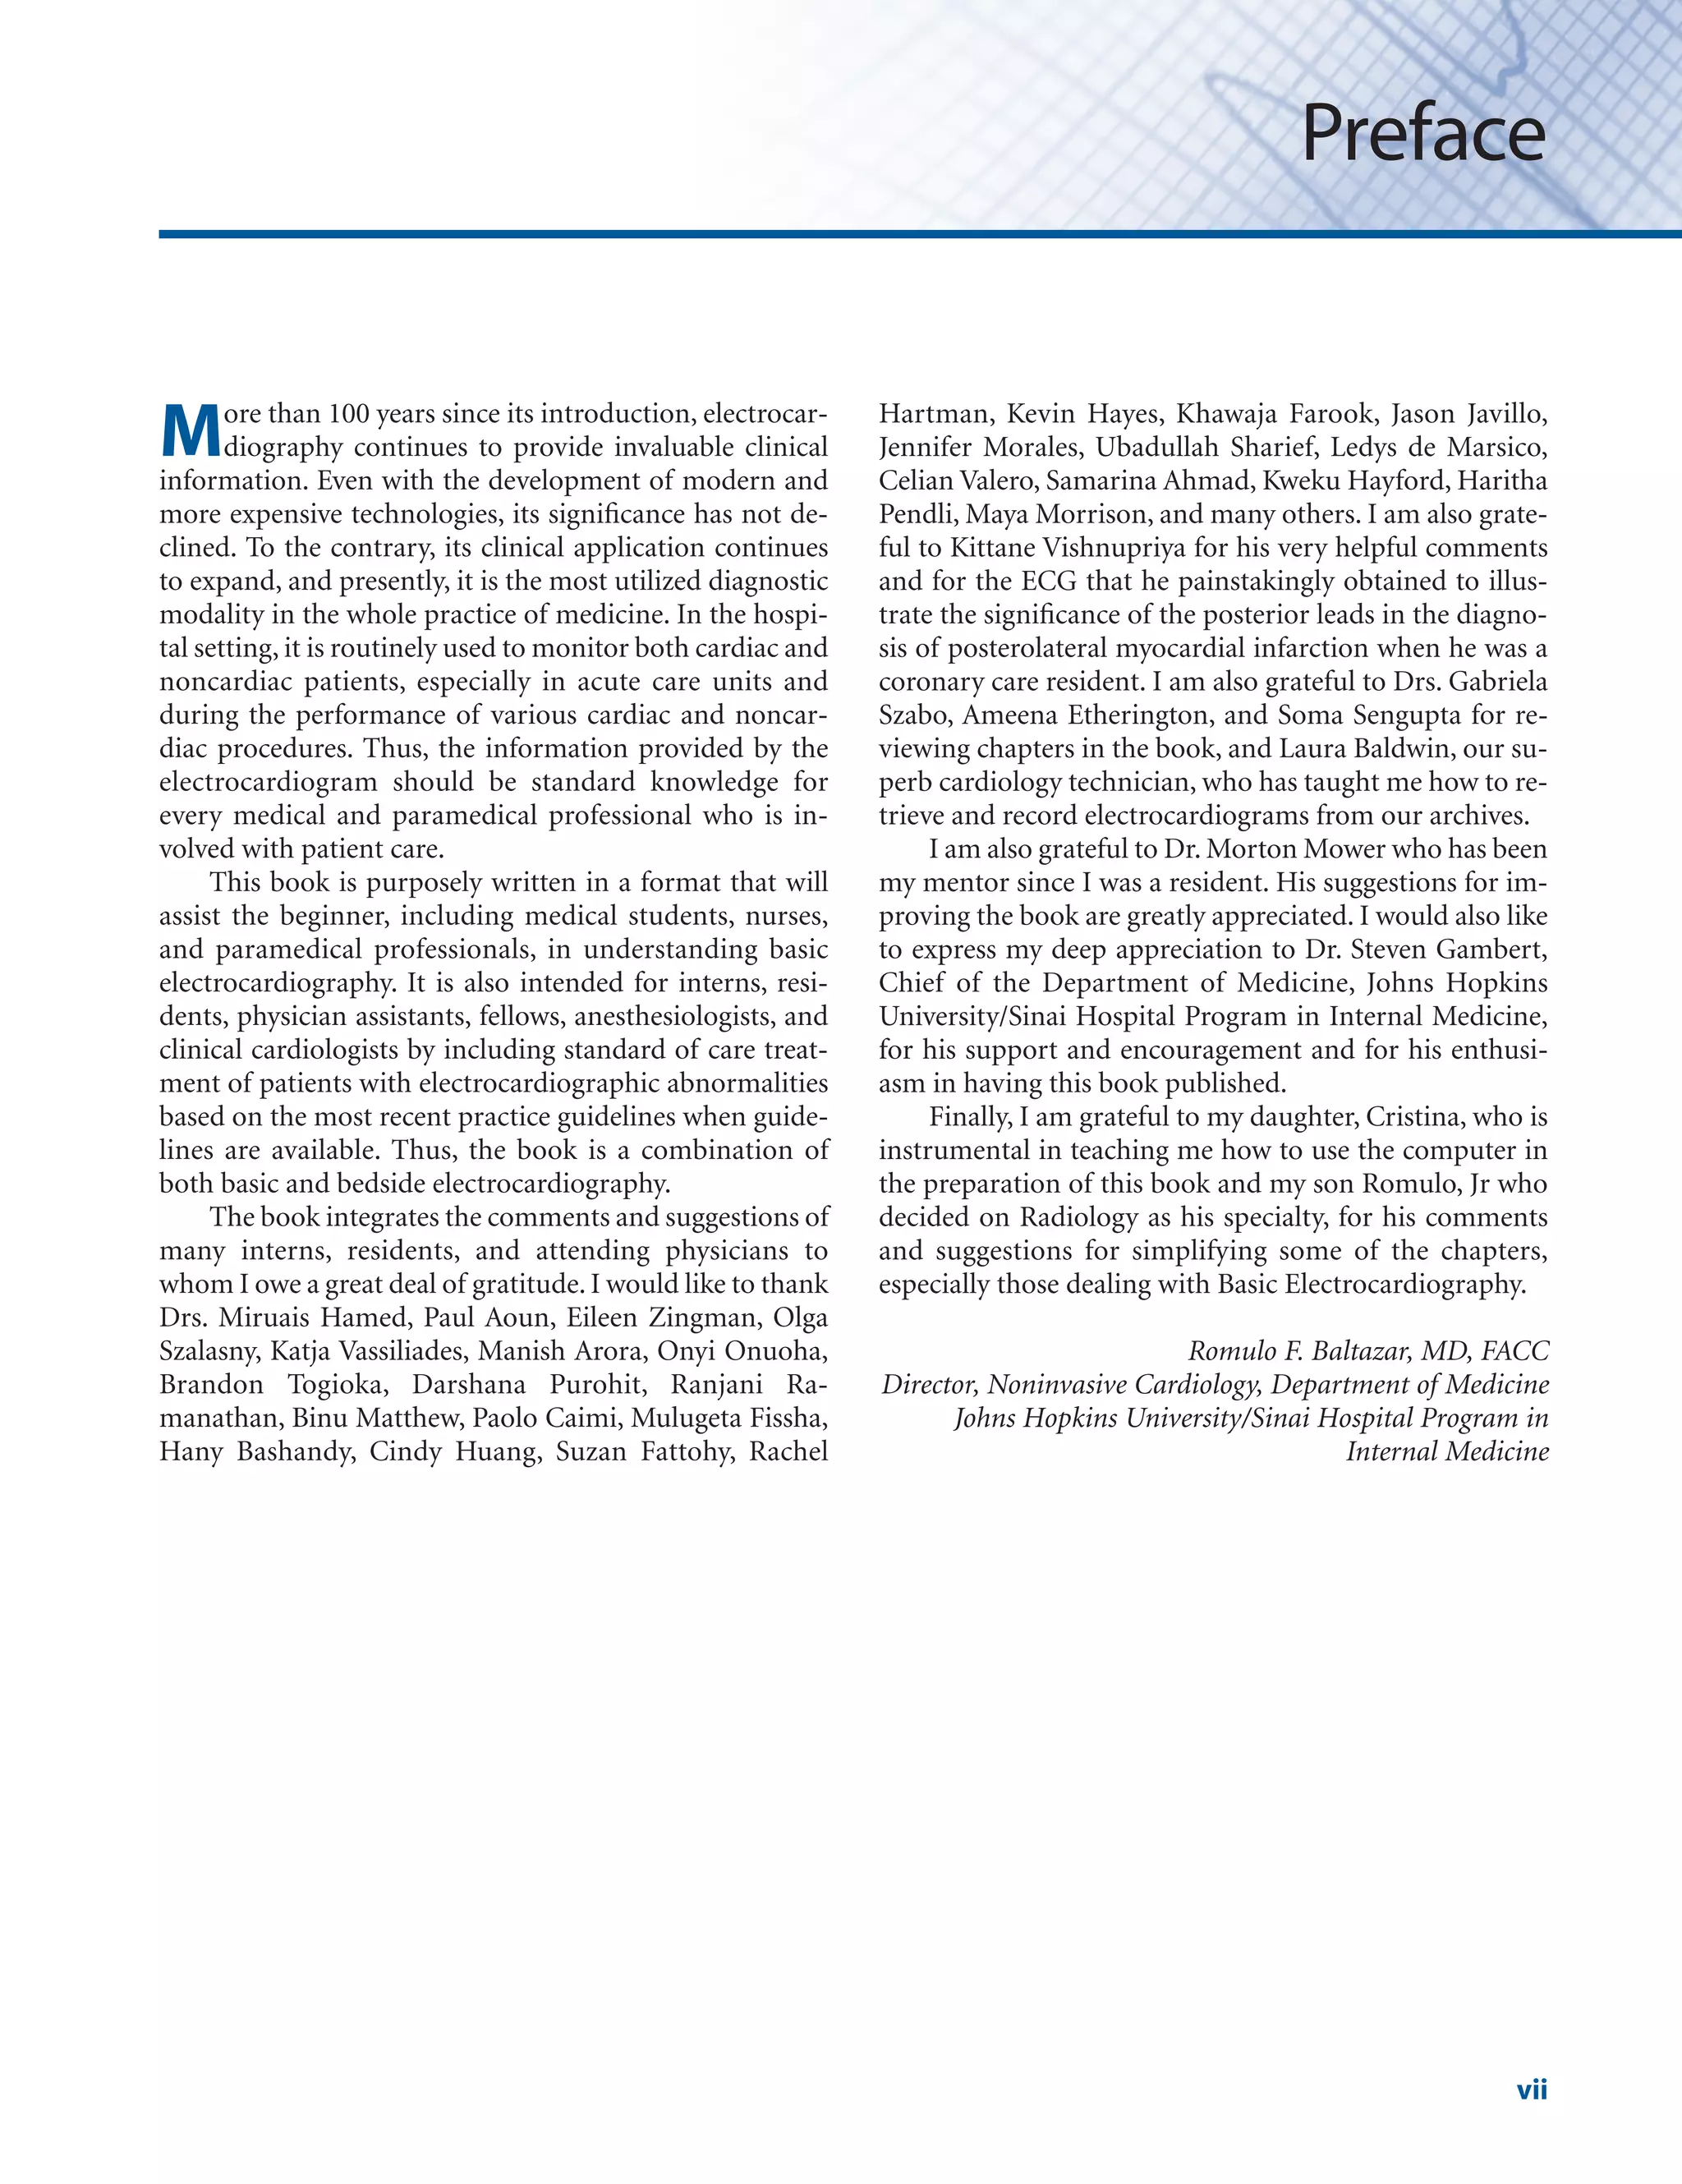
■ Frontal plane: The frontal plane is represented by
leads I, II, III, aVR, aVL, and aVF. It includes the
left/right and superior/inferior orientation of the
body (Fig. 4.1A). The electrical position of the heart
in the frontal plane is described as axis deviation.
Thus, the axis of the QRS complex may be normal
or it may be deviated to the left, to the right or to the
northwest quadrant.
■ Horizontal plane: The horizontal plane is repre-
sented by leads V1 to V6 (Fig. 4.1B). It includes
left/right and anteroposterior orientation of the
body. The position of the heart in the horizontal
plane is described as rotation. Thus, the rotation of
the heart may be normal or it may be rotated clock-
wise or counterclockwise.
The Frontal Plane
■ Frontal plane: Using the hexaxial reference system
(Fig. 4.2), the frontal plane can be divided into four
quadrants.
■ Normal quadrant: The left lower quadrant be-
tween 0 and 90 represents normal quadrant.
■ Left upper quadrant: The left upper quadrant be-
tween 0 and 90 represents left axis deviation.
■ Right lower quadrant: The right lower quadrant
between 90 and 180 represents right axis devi-
ation.
■ Right upper quadrant: The quadrant between
–90 and 180 is either extreme right or extreme
left axis deviation. Often, it is not possible to differ-
entiate whether the axis has deviated extremely to
the right or extremely to the left; thus, this axis is of-
ten called northwest axis.
■ Normal axis:The normal QRS axis depends on the age
of the patient.
V6
V5
V4
V3
V2
V1
Left
Anterior
00
300
600
750
900
1200
Posterior
B
Right
I
+
-
+ 900
- 900
+
aVF
Superior
Left
A
Normal
Axis
Left
Axis
Right
Axis
00
1800
-
Right
Northwest
Axis
Inferior
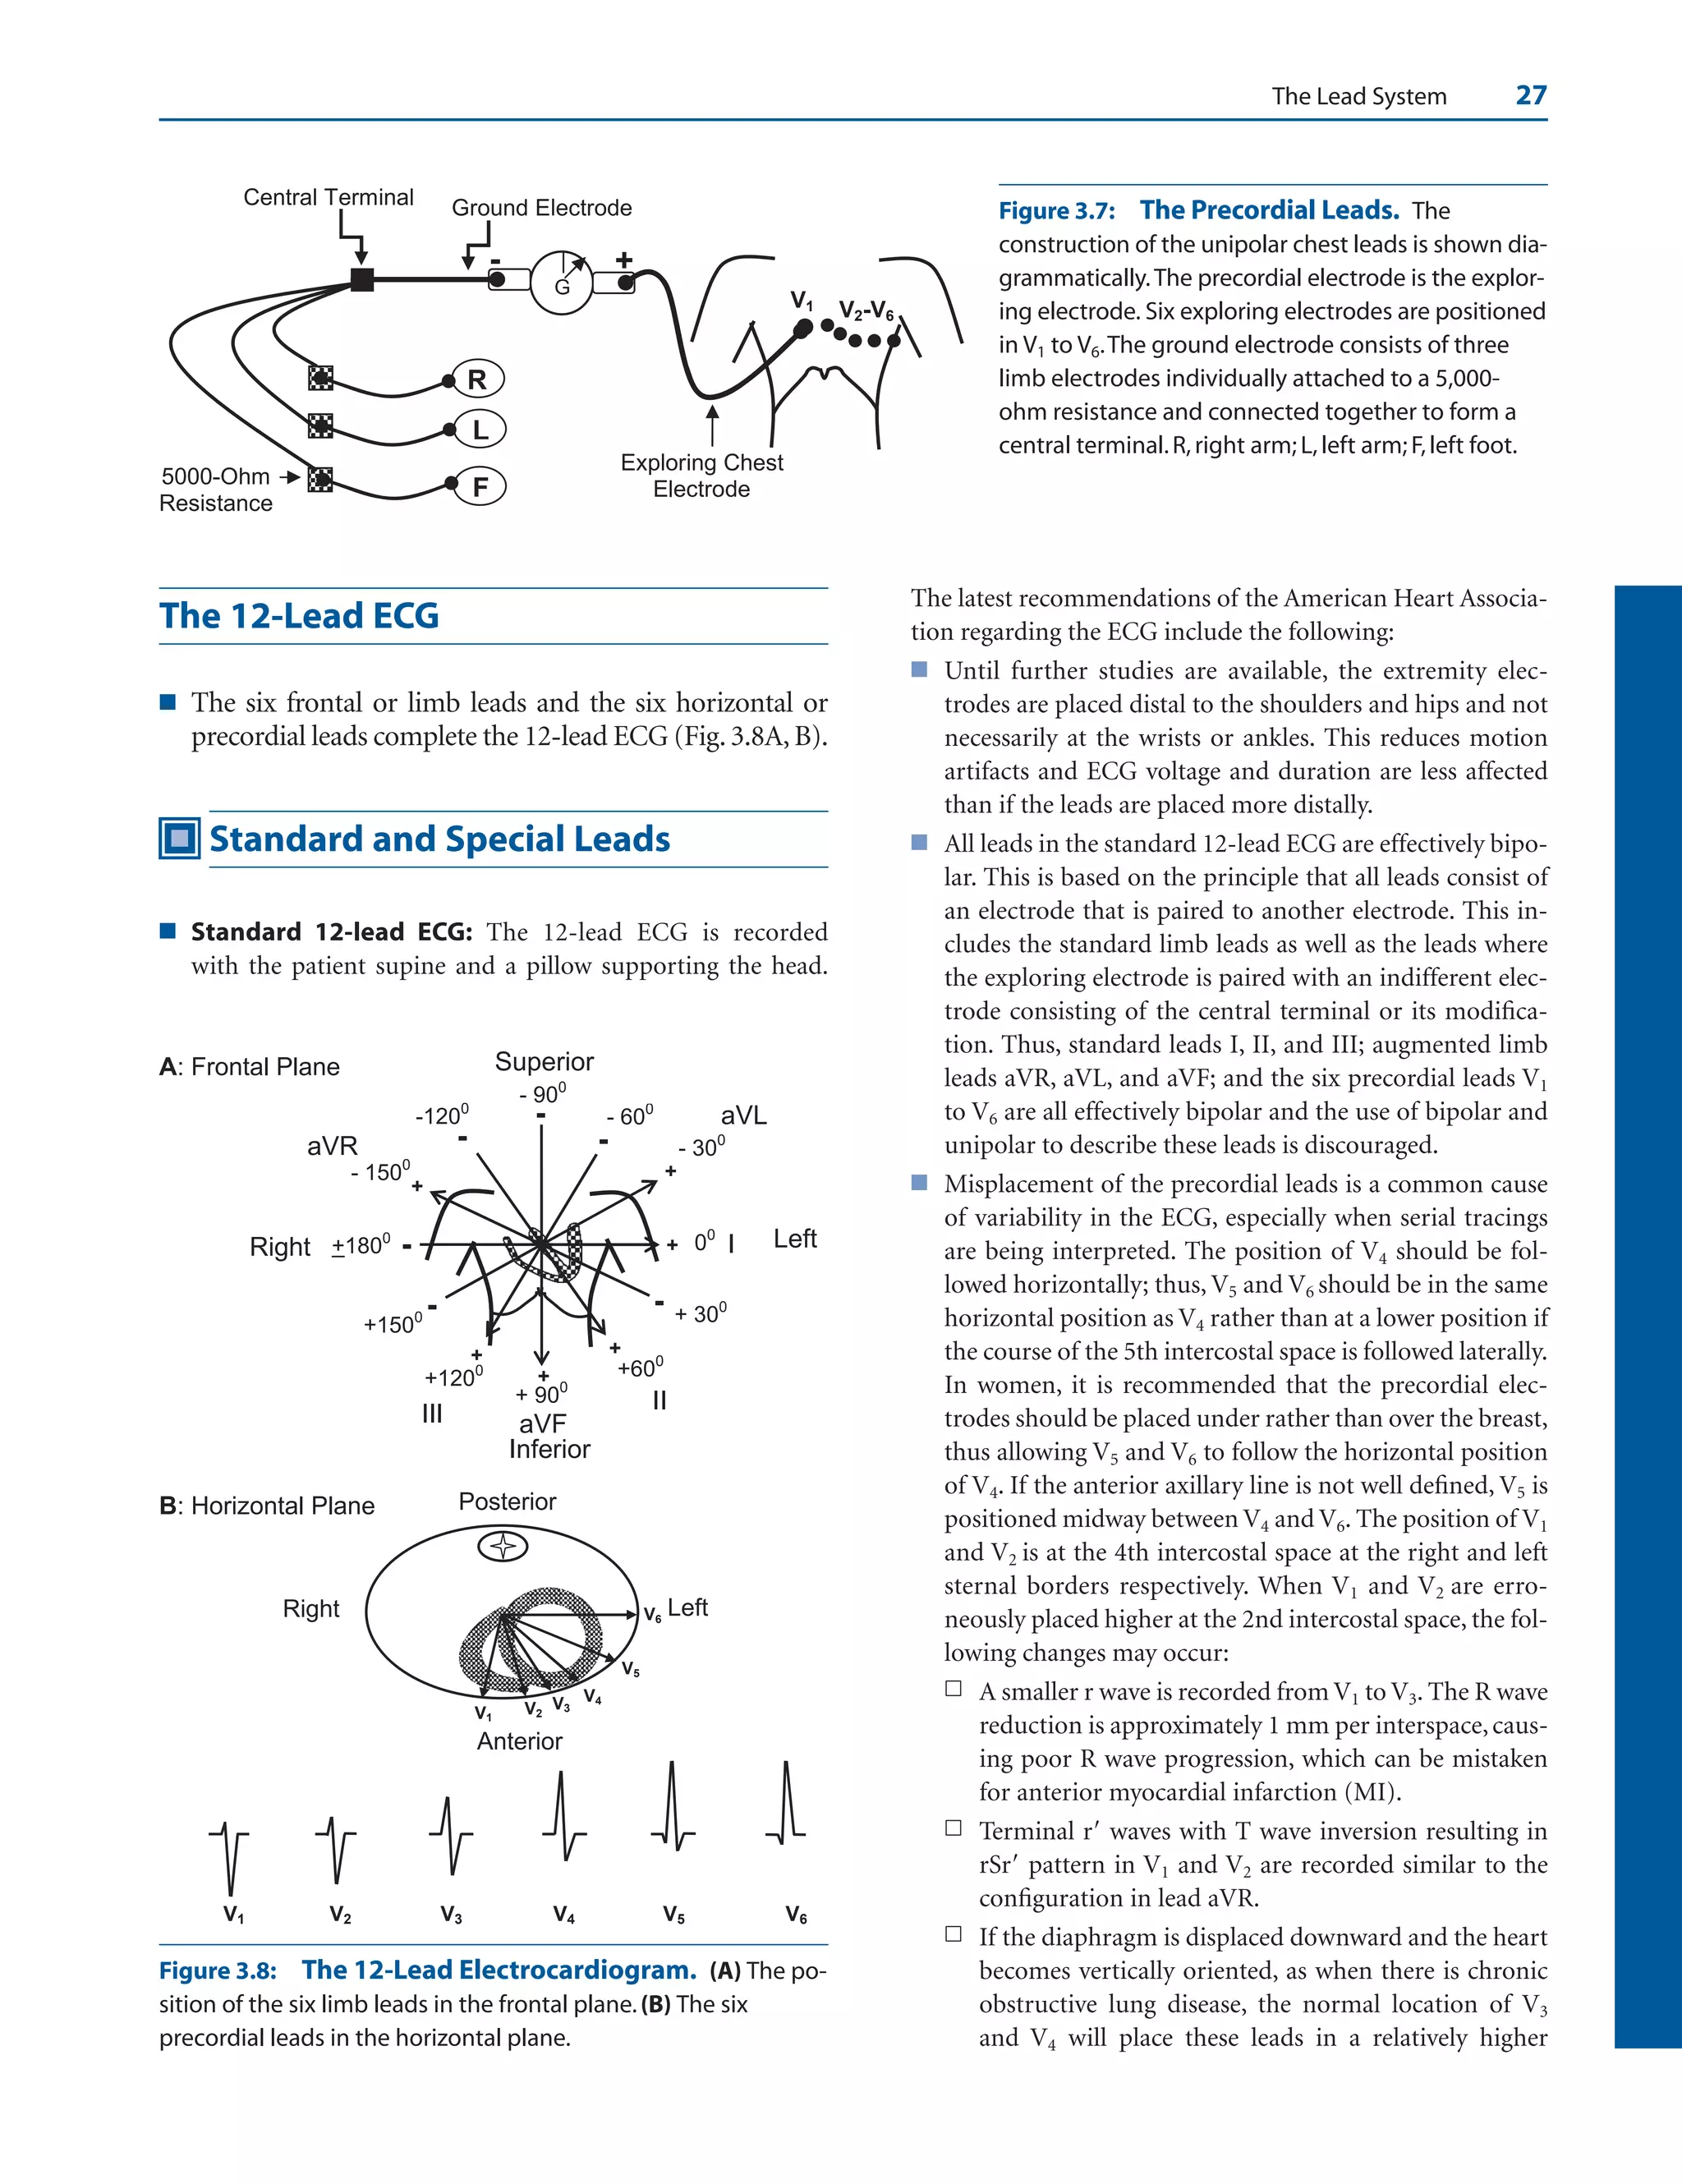
Figure 4.1: The 12-Lead
Electrocardiogram. The lo-
cation of the different leads in
the frontal (A) and horizontal
(B) planes is shown.
LWBK271-C04_30-47.qxd 1/30/09 11:22 AM Page 30 Aptara Inc.](https://image.slidesharecdn.com/baltazaarecg-220505195141-84eaf65f/75/baltazaar-ecg-pdf-41-2048.jpg)


![Sinus Node Dysfunction 165
■ When prolonged asystole occurs during cardiac monitoring
and the patient is still conscious, forceful coughing should be
instituted immediately. Forceful coughing is commonly used
to terminate bradyarrhythmias in patients undergoing coro-
nary angiography but is seldom tried in other clinical settings.
Because it needs the cooperation of a conscious patient, it
should be tried as early as possible. Cough may be able to
maintain the level of consciousness for 90 seconds and can
serve as a self-administered cardiopulmonary resuscitation.
■ When there is symptomatic bradyarrhythmia because of
sinus dysfunction, atropine is the initial drug of choice.
Atropine is given intravenously with an initial dose of 0.5 mg.
The dose can be repeated every 3 to 5 minutes until a total
dose of 0.04 mg/kg or approximately 3 mg is given within
2 to 3 hours. This dose will result in full vagal blockade. If the
bradycardia remains persistent in spite of atropine, transcu-
taneous pacing should be instituted. If a transcutaneous
pacemaker is not effective, is not tolerable, or is not available,
sympathetic agents such as epinephrine, dopamine, isopro-
terenol, or dobutamine may be given until a temporary
transvenous pacemaker can be inserted. The treatment of
symptomatic bradycardia is discussed in more detail in
Chapter 8, Atrioventricular Block.
■ The use of permanent pacemakers is the only effective treat-
ment available but is usually reserved for symptomatic pa-
tients with sick sinus syndrome. The symptoms should be re-
lated to the sinus node dysfunction before a permanent
pacemaker is inserted. In patients with the tachycardia-
bradycardia syndrome, insertion of a permanent pacemaker
is the only therapy that is appropriate, because there is gener-
ally no effective therapy for bradycardia. Furthermore, phar-
macologic treatment to control tachycardia or to control the
ventricular rate in atrial fibrillation will result in further de-
pression of the sinus node, in turn resulting in more pro-
nounced bradycardia when the patient converts to normal si-
nus rhythm. The indications for insertion of permanent
pacemakers in patients with sinus node dysfunction accord-
ing to the ACC/AHA/HRS guidelines on permanent pace-
makers are summarized in Figure 12.38.
■ Sick sinus syndrome from idiopathic degenerative disease is
usually progressive and may involve not only the sinus node,
but also the whole conduction system. Thus, atrial pacing
combined with ventricular pacing should be considered in
these patients.When AV conduction is intact, a single-channel
AAI pacemaker may be sufficient.Dual-chamber programma-
ble pacemaker with automatic mode switching from AAI to
DDD may be more appropriate in anticipation of AV block or
atrial fibrillation that often develops in patients with sick sinus
syndrome (see Chapter 26, The ECG of Cardiac Pacemakers).
■ The use of dual-chamber pacemakers compared with single-
chamber VVI devices may diminish the incidence of atrial
fibrillation in patients with sick sinus syndrome. Mode
switching pacemaker, capable of automatically switching
from DDD to VVI, may be advantageous in patients with in-
termittent atrial fibrillation.
■ Anticoagulation should be given to patients with chronic
atrial fibrillation to prevent thromboembolism. This is one
of the common causes of death in patients with sick sinus
syndrome manifesting with chronic atrial fibrillation (see
Chapter 19, Atrial Fibrillation).
■ In patients with sinus node dysfunction who are completely
asymptomatic, there are no clear-cut indications for insertion
of a permanent pacemaker according to the ACC/AHA/HRS
guidelines.
■ Although there is no effective chronic oral therapy for brady-
cardia associated with sick sinus syndrome, some patients
with sinus pauses 2.5 seconds who are symptomatic but re-
fuse permanent pacemaker insertion, slow-release theo-
phylline, 200 to 400 mg daily given in two divided doses, may
be tried. This is based on the observation that sick sinus syn-
drome is associated with increased sensitivity to adenosine.
Thus, theophylline, which is the antidote to adenosine, may
be able to reverse the bradycardia resulting from sinus
pauses. Hydralazine in small doses of 15 to 100 mg daily in
divided doses has also been tried with varying results.
Prognosis
■ When sinus dysfunction is due to isolated degenerative dis-
ease of the conduction system, the prognosis in these pa-
tients with sick sinus syndrome who receive permanent pace-
makers is good and is similar to patients in the same age
group without sick sinus syndrome.
■ The prognosis of other patients depends on the underlying
disease causing the sick sinus syndrome.
Suggested Readings
2005 American Heart Association guidelines for cardiopul-
monary resuscitation and emergency cardiovascular care:
Part 7.3, Management of symptomatic bradycardia and
tachycardia. Circulation. 2005;112:67–77.
Belic N, Talano JV. Current concepts in sick sinus syndrome II.
ECG manifestation and diagnostic and therapeutic ap-
proaches. Arch Intern Med. 1985;145:722–726.
Blaufuss AH, Brown DC, Jackson B, et al. Does coughing pro-
duce cardiac output during cardiac arrest? [abstract] Circu-
lation. 1978;55–56 (Suppl III):III-68.
Buxton AE, Calkins H, Callans DJ, et al. ACC/AHA/HRS 2006
key data elements and definitions for electrophysiology stud-
ies and procedures: a report of the American College of
Cardiology/American Heart Association Task Force on Clin-
ical Data Standards (ACC/AHA/HRS Writing Committee to
Develop Data Standards on Electrophysiology. J Am Coll
Cardiol. 2006;48:2360–2396.
Criley JM, Blaufuss AH, Kissel GL. Cough-induced cardiac
compression. JAMA. 1976;236:1246–1250.
Ferrer MI. The Sick Sinus Syndrome. Mount Kisco, NY: Futura
Publishing Company; 1974:7–122.
LWBK271-C12_148-166.qxd 29/1/09 9:04 pm Page 165 LWBK270-4119G-C02_073-110.qxd](https://image.slidesharecdn.com/baltazaarecg-220505195141-84eaf65f/75/baltazaar-ecg-pdf-176-2048.jpg)


![212 Chapter 17
n Multifocal atrial tachycardia: The tachycardia is
multifocal if several ectopic foci are present in
the atria.
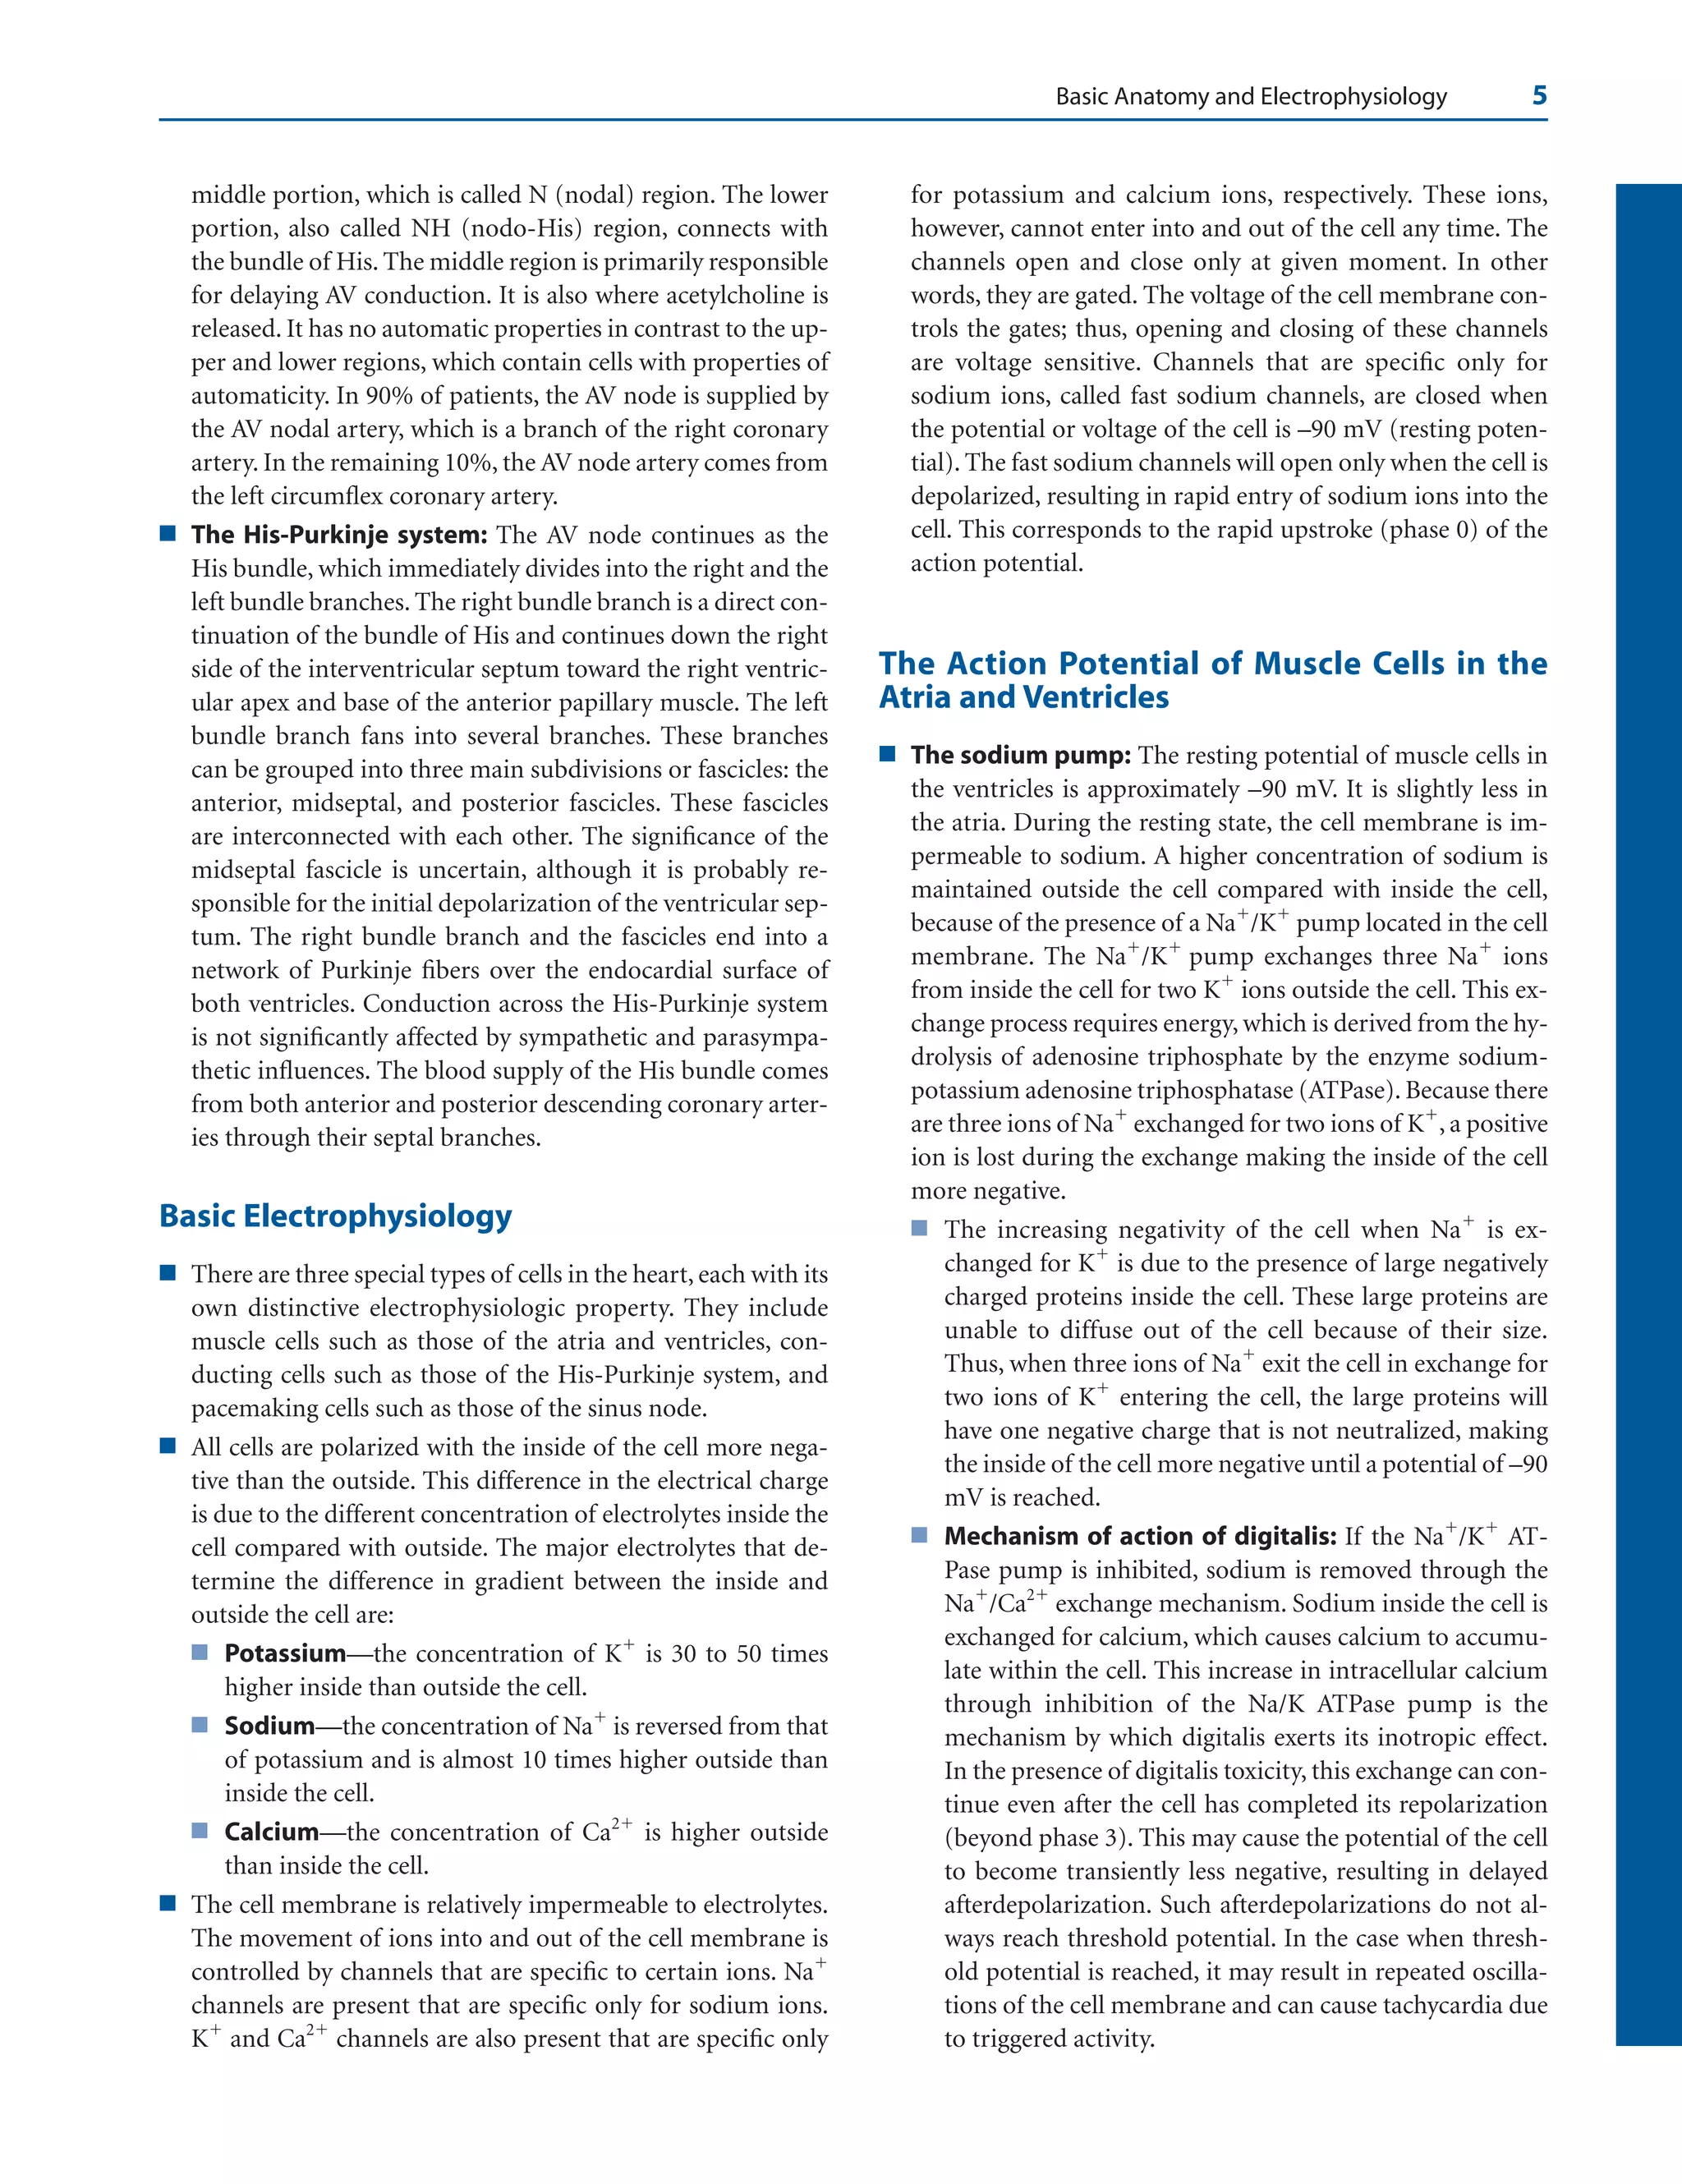
■ AV junctional tachycardia: The tachycardia arises
from the AV junction, which includes the AV node
down to the bifurcation of the bundle of His (Fig.
17.2D). Junctional tachycardia can be paroxysmal or
nonparoxysmal.
n Nonparoxysmal junctional tachycardia: The
tachycardia arises from a focus in the AV junc-
tion and has a relatively slow rate of 70 to 120
beats per minute (bpm).
n Paroxysmal junctional tachycardia: The tachy-
cardia is paroxysmal because it starts abruptly
and terminates suddenly. The tachycardia has a
faster rate varying from 120 to 180 bpm.
Focal Atrial Tachycardia
■ Focal atrial tachycardia: Focal atrial tachycardia im-
plies that the tachycardia arises from a single location in
the atria. The atrial impulse spreads in a circumferential
manner regardless of the mechanism of the tachycardia.
Thus, the tachycardia may be due to enhanced auto-
maticity (automatic atrial tachycardia), intra-atrial
micro-reentry (intraatrial reentrant tachycardia), or
triggered automaticity (atrial tachycardia with 2:1 AV
block). The mechanisms underlying these tachycardias
cannot be differentiated from one another with a 12-
lead electrocardiogram (ECG). Because these tachycar-
dias all look similar, any tachycardia originating from a
single focus in the atria that spreads circumferentially is
focal atrial tachycardia (Figure 17.3).
■ The ECG findings of focal atrial tachycardia include
the following:
■ Presence of a regular narrow complex tachycardia
100 bpm.
■ Ectopic P waves, which are different from sinus P
waves, precede the QRS complexes usually with a PR
interval 0.12 seconds.
■ The P waves are uniform and the atrial rate varies to
as high as 250 bpm. The baseline between the P
waves is usually flat or isoelectric and not wavy or
undulating as in atrial flutter.
■ Second-degree or higher grades of AV block may oc-
cur because the tachycardia is not dependent on the
AV node.
■ The tachycardia terminates with a QRS complex in
contrast to reentrant SVT (atrioventricular nodal
reentrant tachycardia [AVNRT] and atrioventricu-
lar reentrant tachycardia [AVRT]), which usually
terminates with a retrograde P wave (Fig. 17.4).
■ Although nonsustained focal atrial tachycardia is fre-
quently seen during cardiac monitoring in the coro-
nary or intensive care units, sustained focal atrial
tachycardia is rare, occurring in 0.5% of sympto-
matic patients. The sustained form is slightly more
common in children than in adults but is also a rare
clinical entity. The tachycardia can be incessant (per-
sists more than 12 hours per day), which can result in
tachycardia-mediated cardiomyopathy.
■ Focal atrial discharges do not occur randomly. They
frequently cluster in certain areas in the atria such as
the mitral or tricuspid annulus, atrial appendages, os-
tium of the coronary sinus, and along the crista termi-
nalis. Spontaneous focal discharges from the pul-
monary veins are too small to be recorded in the
surface ECG, but have been recorded by intracardiac
techniques. These focal discharges can result in SVT
and have also been implicated as an important cause of
atrial fibrillation.
AV
Junction
A D
B C
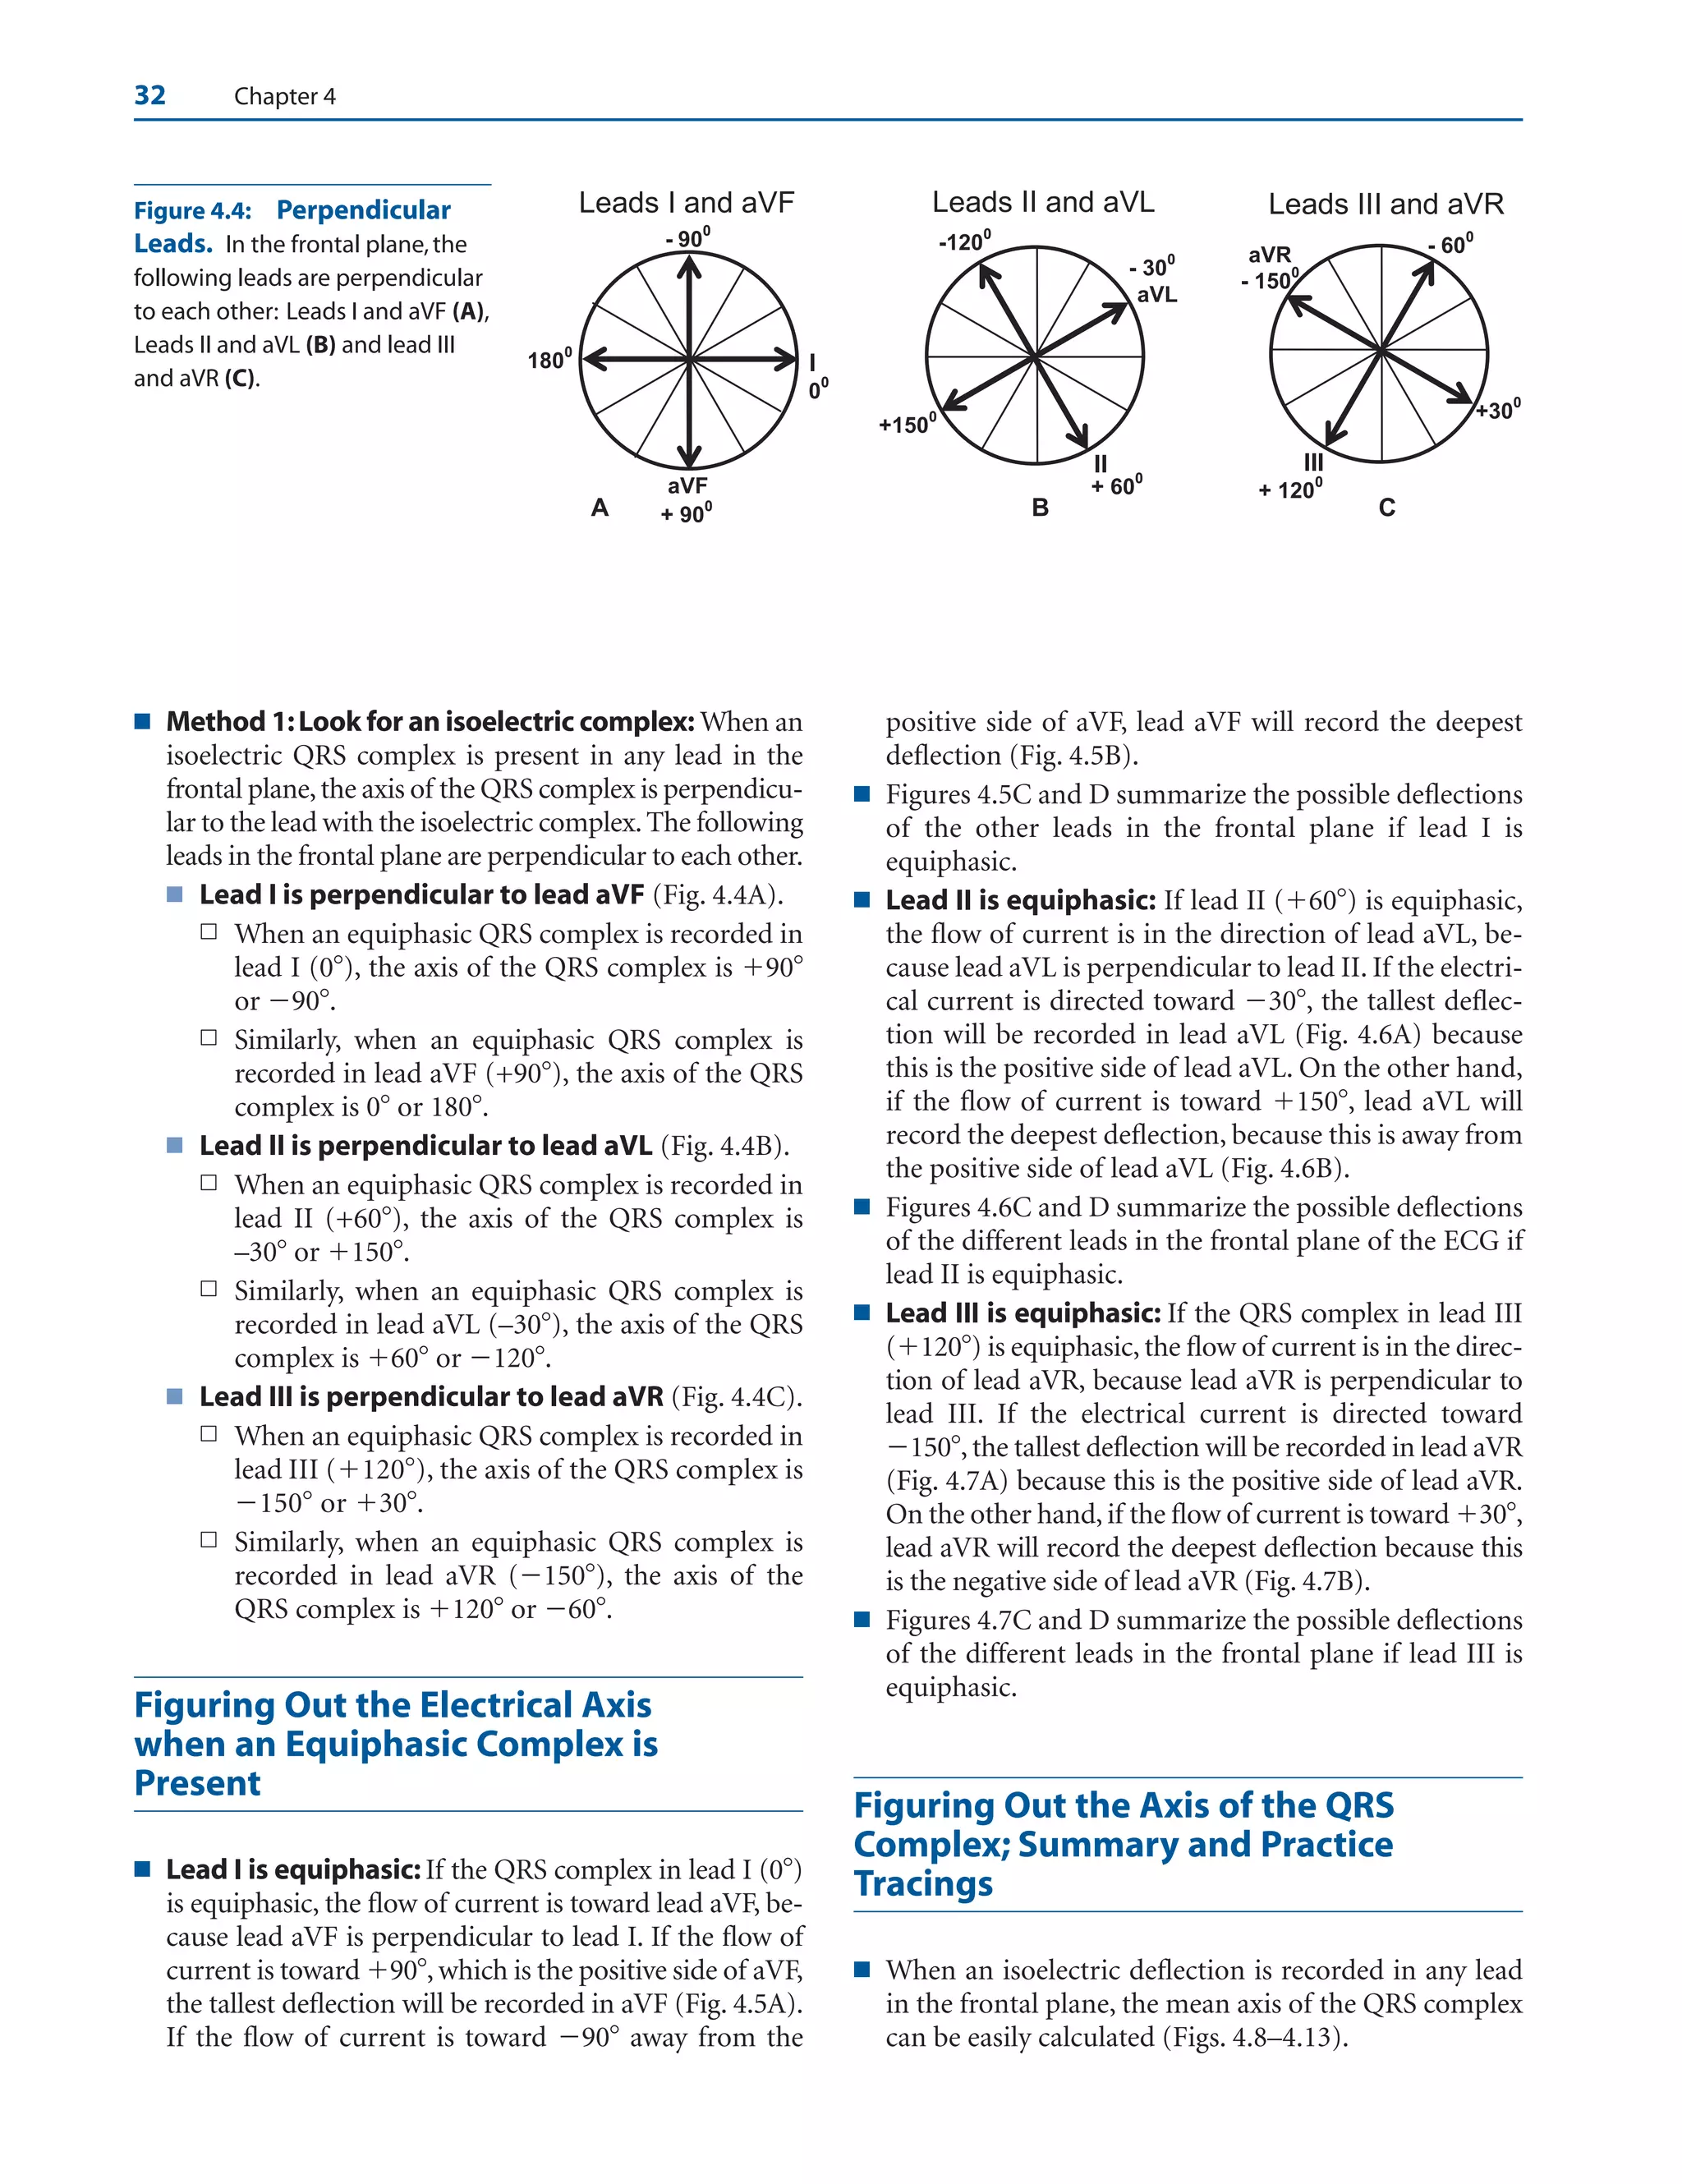
Figure 17.2: Automatic Supraventricular Tachycardia (SVT). Automatic SVT can occur any-
where in the atria or atrioventricular junction.(A) Pathologic or inappropriate sinus tachycardia.(B) Focal
atrial tachycardia arising from a single focus in the atria.(C) Multifocal atria tachycardia showing multi-
ple foci in the atria.(D) Junctional tachycardia,which can be paroxysmal or nonparoxysmal.
LWBK271-C17_211-232.qxd 29/1/09 7:44 pm Page 212 LWBK270-4119G-C02_073-110.qxd](https://image.slidesharecdn.com/baltazaarecg-220505195141-84eaf65f/75/baltazaar-ecg-pdf-223-2048.jpg)


![330 Chapter 22
of automatic implantable defibrillator. Overall prognosis de-
pends on the underlying cardiac disease and severity of left
ventricular dysfunction.
■ If the wide complex tachycardia is due to SVT, prognosis is
the same as for narrow complex SVT.
Suggested Readings
2005 American Heart Association guidelines for cardiopul-
monary resuscitation and emergency cardiovascular care.
Part 7.3: management of symptomatic bradycardia and
tachycardia. Circulation. 2005;112[Suppl]:IV-67–IV-77.
Akhtar M. Electrophysiologic bases for wide complex tachycar-
dia. PACE. 1983;6:81.
Baltazar RF, Javillo JS. Images in cardiology. Ventriculo-atrial
Wenckebach during wide complex tachycardia. Clin Cardiol.
2006;29:513.
Blomstrom-Lundqvist C, Scheinman MM, Aliot EM, et al.
ACC/AHA/ESC Guidelines for the management of patients
with supraventricular arrhythmias—executive summary. A
report of the American College of Cardiology/American
Heart Association Task Force on Practice Guidelines, and the
European Society of Cardiology Committee for Practice
Guidelines (Writing Committee to Develop Guidelines for
the Management of Patients with Supraventricular Arrhyth-
mias) J Am Coll Cardiol. 2003;42:1493–1531.
Brugada P, Brugada J, Mont L, et al. A new approach to the dif-
ferential diagnosis of a regular tachycardia with a wide QRS
complex. Circulation. 1991;83:1649–1659.
Edhouse J, Morris F. ABC of clinical electrocardiography. Broad
complex tachycardia—part I. BMJ. 2002;324:719–722.
Edhouse J, Morris F. ABC of clinical electrocardiography. Broad
complex tachycardia—part II. BMJ. 2002;324:776–779.
Garratt CJ, Griffith MJ, Young G, et al. Value of physical signs in
the diagnosis of ventricular tachycardia. Circulation. 1994;
90:3103–3107.
Gozensky C, Thorne D. Rabbit ears: an aid in distinguishing
ventricular ectopy from aberration. Heart Lung. 1975;3:634.
Griffith MJ, Garratt CJ, Mounsey P, et al.Ventricular tachycardia
as default diagnosis in broad complex tachycardia. Lancet.
1994;343:386–388.
Guidelines 2000 for cardiopulmonary resuscitation and emer-
gency cardiovascular care, an international consensus on sci-
ence. The American Heart Association in Collaboration with
the International Liaison Committee on Resuscitation. 7D:
the tachycardia algorithms. Circulation. 2000;102[Suppl I]:-
I-158–I-165.
Harvey WP, Ronan JA, Jr. Bedside diagnosis of arrhythmias.
Prog Cardiovasc Dis. 1966;8:419–445.
Stewart RB, Bardy GH, Greene HL. Wide complex tachycardia:
misdiagnosis and outcome after emergent therapy. Ann In-
tern Med. 1986;104:766–771.
Surawicz B, Uhley H, Borun R, et al. Task Force I: standardiza-
tion of terminology and interpretation. Am J Cardiol. 1978;
41:130–144.
Tchou P, Young P, Mahmud R, et al. Useful clinical criteria for
the diagnosis of ventricular tachycardia. Am J Med. 1988;84:
53–56.
Wellens HJ. Electrocardiographic diagnosis of arrhythmias. In:
Topol EJ, ed. Textbook of Cardiovascular Disease. 2nd ed.
Philadelphia: Lippincott William Wilkins; 2002:1665–
1683.
Wellens HJJ, Bar FWHM, Lie KI. The value of the electrocardio-
gram in the differential diagnosis of a tachycardia with a
widened QRS complex. Am J Med. 1978;64:27–33.
Wellens HJJ, Conover MB. Wide QRS tachycardia. In: The ECG
in Emergency Decision Making. Philadelphia: WB Saunders
Co; 1992:37–72.
WHO/ISC Task Force. Definition of terms related to cardiac
rhythm. Am Heart J. 1978;95:796–806.
Zipes DP, Camm AJ, Borggrefe M, et al. ACC/AHA/ESC 2006
guidelines for management of patients with ventricular ar-
rhythmias and the prevention of sudden cardiac death: a re-
port of the American College of Cardiology/American Heart
Association Task Force and the European Society of Cardiol-
ogy Committee for Practice Guidelines (Writing Committee
to Develop Guidelines for Management of Patients with Ven-
tricular Arrhythmias and the Prevention of Sudden Cardiac
Death). J Am Coll Cardiol. 2006,48:e247–e346.
LWBK271-C22_310-330.qxd 29/1/09 7:48 pm Page 330 LWBK270-4119G-C02_073-110.qxd](https://image.slidesharecdn.com/baltazaarecg-220505195141-84eaf65f/75/baltazaar-ecg-pdf-341-2048.jpg)


![Cardiccccac Arrhythmias [Autosaved].pptx](https://cdn.slidesharecdn.com/ss_thumbnails/cardiacarrhythmiasautosaved-241108153215-72acce97-thumbnail.jpg?width=640&height=640&fit=bounds)


