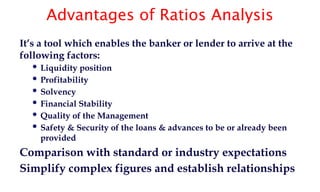
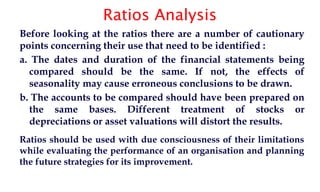
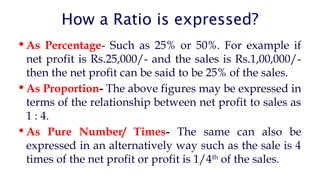
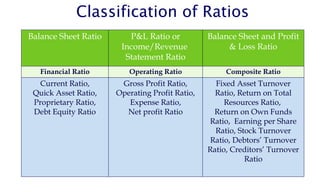
Study, Analysis &
Interpretation of Financial
Statements and
Ratio Analysis
Session objectives
 Familiarizing of Balance Sheet & P&L A/c items
 Construction of Balance Sheet
 Classification of Balance Sheet items
 Financial Statements Analysis
 Understanding Ratios & Interpretation of Ratios
 Exercises BS & RA
 Conclusion- Take Aways
Financial Statements
Balance Sheet
Profit and Loss Account
Funds Flow Statement
Cash Flow Statement
Statement of Changes in Equity/ Capital
Explanatory Notes
Auditors Report
Balance Sheet
 A Balance sheet is a statement of the financial position of a
business which states the assets, liabilities and owner's equity at a
particular point in time.
 Generally prepared at the end of the financial year.
 A Balance sheet is the summary of assets and liabilities of a firm/
company at the end of the year, which have been accumulated over
the years since its inception. A P&L a/c, on the other hand is a
statement of the performance of the firm over the year, ending
with the balance sheet date.
Balance Sheet - Horizontal Form
Mostly used by Proprietorship/ partnership Firms
Liabilities Assets
Share Capital
Reserves & Surplus
Unsecured Loans
Secured Loans
Current Liabilities &
Provisions
Fixed Assets
Investments/ Security
Deposits
Current Assets
Loans & Advances
Miscellaneous Expenditure
Total Total
I. Sources of funds
1.Equity And Liabilities:
(a) Share Capital
(b) Reserves & Surplus
2. Loans
(a) Secured Loans
(b) Unsecured Loans
II. Application of Funds
1. Fixed Assets
2. Investments
3. Net Current Assets = Current Assets, Loans & Advances
Less: Current Liabilities and Provisions
4. Miscellaneous Expenditure
Company BS- New format (Vertical Form)
Balance Sheet: PART-1
Particulars Note
No.
Figures as at the end of
current reporting period
Figures as at the end of the
previous reporting period
I. EQUITY AND LIABILITIES
(1) Shareholders’ funds
(a) Share capital
(b) Reserves and surplus
(c) Money received against share warrants
(2) Share application money pending
allotment
(3) Non-current liabilities
a)Long term borrowings
b)Deferred Tax Liability
c)Other long term liabilities
d)Long term provisions
CURRENT LIABILITES
a) Short term borrowings
b) Trade payables
c) Other current liabilities
d) Short Term Provisions
Name of the Company:……… Balance Sheet as at: ………..
Balance Sheet: PART-1 Cont.
Particulars Note No. Figures as at the end of the Current
reporting period
Figures as at the end of the Previous
reporting period
II. ASSETS
Non-current assets
(1) (a) Fixed assets
(i) Tangible assets
(ii) Intangible assets
(iii) Capital work-in-progress
(iv) Intangible assets under development
(b) Non-current investments
(c) Deferred tax assets (net)
(d) Long-term loans and advances
(e) Other non-current assets
(2) Current assets
(a) Current investments
(b) Inventories
(c) Trade receivables
(d) Cash and cash equivalents
(e) Short-term loans and advances
(f) Other current assets
NEED OF ANALYSIS?
Toknow the Net Worth
Toknow the Sources of Funds/ Liabilities
Toknow the deployment of assets
Toknow the Profit or Loss
Toknow the true & fair view of the affairs of the company
Used by
 Investors /Management
 Employees
 Customers
 Government
 General Public
 Lenders
Fixed Assets
 Land & Building
 Plant & Machinery/ Equipments
 Furniture & Fixtures
 Vehicles
 Generator Set
 Pollution Control & Fire Fighting Equipments
 Capital work in progress
Not convertible into cash in the normal course of business.
Fixed Assets
Capital work in progress:
Represents fixed assets under construction. Various kinds of
Expenses incurred in this connection are generally capitalized
and added to the value of respective capital work in progress.
Any advance paid for future acquisition of capital assets should
not be classified as current assets.
Fixed Assets
Gross Block and Net Block:
•Gross Block represents the original cost of fixed assets
like Land, Building, Plant & Machinery, Vehicles,
Furniture & Fixtures, Generator etc.
•Depreciation is calculated against each category of
fixed assets.
•Net Block = Gross Block– Depreciation
Current Assets
 Cash & Bank Balances
 Inventories (Raw Material, Semi-Finished goods (SIP/ WIP), Finished
goods, Stores & Spares, Consumables, etc.
 Sundry Debtors/ Receivables (Less than 180 days) (Refer Credit Policy)
 Term Deposits with Banks (Refer Credit Policy)
 Advance payment made
 Prepaid Expenses
 Margin deposited against BG for WC purposes etc.
 Expected to be realized in, or intended for sale or consumption in the
normal operating cycle.
 Convertible into cash or Expected to be realized within 12 months.
 Held primarily for the purpose of being traded.
 Cash or cash equivalents unless it is restricted.
Non-Current Assets
 Security Deposits
 Debtors o/s for more than 6 months
 Investments in Shares & Debentures
 Slow moving/ Non-marketable/ Dead stocks
 In Mutual Funds/ Inter Corporate Debts
 Investment in Govt. and other trustee securities.
 Any investment made in subsidiary companies is treated even if the
securities of such subsidiary companies are considered as highly liquid.
 Inter Corporate deposits (ICDs) and Loans irrespective of the tenures
should always be treated as non current assets.
Assets which can not be classified either Fixed Assets
or Current Assets. Not readily convertible into cash.
Current/ Non-Current Assets
Investments
 Investments made in Fixed Deposits with Banks may be treated as current
asset irrespective of the maturity period.
 However if any of these fixed deposits are offered to bank as cash margin
for availing non-fund based credit facilities for project funding or to buy
fixed assets, the character of liquidity is lost and hence cannot be
treated as current assets.
 Deposits held as margin to other types of guarantees (performance
guarantee, stand by LC etc.) be treated as Non current assets
 However, if the margin for LC/Guarantee is for working capital purposes,
then such deposits may be treated as current assets. (Refer Credit Policy)
 Bid money/ tender money deposits, EMD/ Security deposits be treated as
Non current assets.
Current/ Non-Current Assets
 Loans And Advances To Employees– Current Asset
 Advances To Owners Of Business– Non Current Asset
 Loans And Advance To Buy Raw Material/ Stock In Trade– Current
Asset
 Loans And advances To Relative of Owners of Business And
Associate Firms– Non Current Asset
 Advance To Buy A Fixed Asset– Non Current Asset/ Capital Work In
Progress
 Other security deposits (Rent, Electricity deposit etc.)- NCA
 Deposits with Court attachments / Garnishee order- NCA
Current/ Non-Current Assets
 Trade debtors’ holding level– Depending on past trend/ market
constraints– generally maximum period of 6 months
(Exception- post-shipment credit is provided) is treated as
Current asset.
 The balance portion is treated as noncurrent asset. (Refer
Credit Policy)
 Disputed debtors- Take them out of the balance sheet and
reduce the net worth correspondingly.
 Any non-marketable, slow moving and obsolete stock is to be
treated as noncurrent asset.
Intangible Assets
These assets represent monetary values of different rights
enjoyed by the business enterprise but have no physical or
tangible existence.
Nevertheless these assets also contribute to profitability,
growth and maximization of share holder values. But it is quite
difficult to determine fair value of these assets. Also these
assets cannot be easily charged as security, for any
borrowings.
When a company is identified for sale, merger or acquisition,
these assets are evaluated and factored in the price.
Intangible Assets
 Good Will/ Brand Value
 Patents/ Trademarks
 Copyrights
 Intellectual Property Rights (IPR)
 Software
 Research and Development Expenditure.
 P & L Debit Balance (Accumulated Loss)
 Preliminary/ Pre- operative Expenses
Intangible Assets
Preliminary Expenses:
 Expenses in connection with a marketing survey or feasibility study.
 Expenses for formation of a Company and Legal charges paid before incorporation
 Professional and consulting charges paid for the incorporation of the company and
preparation of project report.
 Expenses for drafting & printing of Memorandum and Articles of Association of the
Company and Registration fees of the Company.
 Expenses incurred on Logo Design and Brand.
Pre-operative Expenses:
 Regulatory expenses like Permits, Licenses etc.
 Administrative expenses like Office rental, stationery etc.
 Fees for training programmes, Seminars & other educational services.
 Pre-opening repair works on rented premises.
 Advertisement & Marketing Expenses before starting operations.
Intangible Assets
Preliminary/ Pre-operative Expenditure
 If the amounts are substantial, charging the entire amount to P&L
account in the year of occurrence may result in operational losses.
 The yearly amortization or write offs also get the benefit of tax reliefs.
 A company is allowed to carry forward these expenses / losses over
a period of time and charge to profit and loss account every year.
 The unamortized portion of such expenses figure in the balance
sheet on the asset side. However, these items cannot be regarded as
real assets.
LIABILITIES
Net Worth/Equity/Owned Funds
 Paid up Share Capital (A)
 Reserves & Surplus (B)
• Revenue Reserves - Created out of Profits
• Capital Reserves - Extra Ordinary Gains / Share Premium
• Revaluation Reserves
• Surplus in P & L A/c
Total NET WORTH (A + B)
(-) Intangibles: (C)
TANGIBLE NET WORTH = (A) + (B) – (C)
ATNW- ADJUSTED TANGIBLE NET WORTH
= TNW- Investment in Subsidiaries/ JVs/ Group Concerns
Share Capital
• Authorised Capital: Authorized capital is the maximum value of the shares that a
company is legally authorized to issue to the shareholders. Amendment of AC can be
done by taking the consent of shareholders.
• Issued Capital: When the need comes, a company can issue its shares and generate
capital from shareholders. But the issued capital shall be less than the Authorised
Capital.
• Subscribed Capital: Company can issue its shares in the market, but it is not
necessary that all issued shares will be taken/subscribed by investors. Though for
good companies, issued shares can also get oversubscribed in IPO. So, subscribed
Capital is a portion of issued capital.
• Paid Up Capital: Paid-up capital is the amount that is actually paid by the
shareholders to the company. The shareholders will have to pay to the company in
three steps (a) Upon application, (b) On Allotment, & (c) On Call. Suppose few
subscribers failed to pay the last installments. In this case paid-up capital will be less
than the subscribed capital.
Share Capital
For Good Companies their Issued capital often equals to subscribed
capital & Paid-up Capital.
Term Liabilities
 Unsecured Loans: Loans from Directors, Promoters,
Friends, Relatives and Associate concerns
 Secured Loans: Term Loans from Banks & Financial
Institutions
 Public Deposits: Deposits from Public, Deposits from
dealer, selling agents etc.
 Debentures & Bonds
Generally borrowings are made to improve the liquidity and
repayable over a period of time beyond 1 year. Therefore,
it is normally treated as part of term liability. Any amount
payable in the next 12 months is treated as part of current
liability.
Net Worth/Equity/Owned Funds
Quasi Capital/ Equity-
 Long term loans from Directors/ Promoters/ Friends and
relatives.
 Without interest or Rate of interest is subordinated to
Bank’s rate of interest on credit limits/ loans.
 Can be considered upto the Capital for non-corporate
borrowers and for companies- upto 50% of paid-up capital.
(Refer Credit Policy)
 Undertaking is to be obtained that loans will not be
withdrawn/ paid during the currency of bank loans.
Current Liabilities
Liabilities which are payable within a year.
 Sundry Creditors/ Trade Payables
 Bank’s CC/ OD/ PC/ BD/ BP
 Provision for Taxation
 Proposed Dividend (Declared but not paid)
 Other Statutory Liabilities (due within one year)
 Advances from customers
 Expenses payable
 Term Loan Installments payable within 1 year
Applicable to companies only:
 Redeemable portion of preference share capital and other public debt
 Share application money pending allotment if pending for more than
2 months
Contingent Liabilities
These are Off Balance Sheet Items.
 Disputed Tax Liability
 Whether Tax Demands have been contested and gone for an appeal
 Non-Payment of Taxes or any other Statutory dues, PF etc.
 Claims against the Company not acknowledged as Debt
 Pending /disputed court cases
 Pending insurance claims = contingent assets
 Corporate guarantees on behalf of sister concerns, subsidiaries, SPVs etc
Impact of these contingent liabilities on the Company to be seen & commented.
- Auditors Report for any qualification
- Tax Audit Report in 3CB / 3CD
To make the analysis meaningful, it may be necessary
to :
Include,
Delete or
Reclassify
some items of expenses, assets or liabilities
We may call it:
REGROUPING, RECASTING, RECLASSIFICATION or
RESTRUCTURING OF THE FINANCIAL STATEMENTS.
Balance sheet - Grouping
LIABILITIES ASSETS
NET WORTH/EQUITY/OWNED FUNDS:
Share Capital/Partner’s Capital/Paid up Capital/ Owners
Funds/Contribution
Reserves (General, Capital, Revaluation & Other Reserves)
Credit Balance in P&L A/c
FIXED ASSETS: Land & Building, Plant & Machineries/
Equipments, Furniture & Fixtures, Vehicles
Net Value or Book Value or Written down value (Original
Value Less Depreciation)
LONG TERM LIABILITIES/BORROWED FUNDS:
Term Loans (Banks & Institutions)
Debentures/Bonds, Unsecured Loans, Fixed Deposits,
Other Long Term Liabilities
NON CURRENT ASSETS: Investments in quoted shares
& securities, Long Term Security Deposits, Old stocks or
old/disputed book debts, Other Misc. assets which are not
current or fixed in nature
CURRENT LIABILTIES:
Bank Working Capital Limits such as
CC/OD/PC/Bills/Export Credit
Sundry/ Trade Creditors/Creditors/Bills Payable,
Short duration loans or deposits
Expenses payable & provisions against various items
CURRENT ASSETS: Cash & Bank Balance,
Marketable/quoted Govt. or other securities, Book
Debts/Sundry Debtors, Bills Receivables, Stocks &
inventory (RM,SIP,FG,PM) Stores & Spares, Advance
Payment of Taxes, Prepaid expenses, Loans and Advances
recoverable within 12 months
INTANGIBLE ASSETS: Patent, Goodwill, Trademarks,
Copyrights, Debit balance in P&L A/c, Preliminary or
Preoperative expenses
Net Worth Finances All Assets Partially Or Fully
LONG TERM LOANS
FIXED ASSETS
NET WORTH
NON CURRENT ASSETS &
INTANGIBLES
CURRENT ASSETS
BANK BORROWINGS
OTHER CURRENT
LIABILITIES
Profit & Loss Account
 No prescribed format even under the Companies Act, 1956
 Has to show specific information as required by Schedule
IV
 May be presented in Horizontal Form (account form) or the
Vertical Form (report form)
 All expenses shall have to be provided for
 Deferred revenue expenditure shall have to be amortized
over a period of years
 Depreciation shall have to be provided
• Income Net Sales (Sales minus Excise Duty)
Other Income (Net of other Expenses)
• Expenditure Material & other Expenditure
Interest
Depreciation
• Profit before tax
Provision for Tax
• Profit after Tax [PAT] –
• Profit available for appropriations
Dividend
General Reserve
Surplus carried to B/S.
Format of Profit & Loss Account
Analysis of Financial Statements
Why?
 What is the financial standing of the entity – SOUND?
 How did it perform over a given period?
 Whether my/our interests are safe?
Analysis helps knowing
- Adequacy of Profits
- Solvency Position
- Liquidity Position
- Capital Structure position
- Turnover of Stock
- Turnover of Debtors & Creditors
Analysis of Balance Sheet
Steps
Regrouping of Assets into Current Assets, Non-Current Assets and
Fixed Assets
Regrouping of Liabilities into Current Liabilities, Term Liabilities
and Tangible Net worth (Owners funds, net of intangibles).
Computation of Ratios / Comparison with that of the previous year /
Bench Mark Ratios
Comments on Business Parameters/ Profitability Parameters/
Liquidity/ Solvency
Preparation of Fund Flow Statement
AUDIT OF FINANCIAL STATEMENTS
Compulsory for Limited Companies.
Tax Audit is compulsory if Turnover/ Sales is above
Rs. 1 Crore in case of Business.
Incase of Professional, if total gross receipts exceed
Rs 50 Lakh in the FY.
In Feb-2020 Budget, limit for Tax Audit was
increased to Rs. 5 Cr for those who carry out 95% of
their transactions digitally. Now in Budget of Feb-
2021 this limit is proposed to increase to Rs. 10 Cr.
What constitutes Audit report?
Tax auditor shall furnish his report in a prescribed form which
could be either Form 3CA or Form 3CB where:
Form No. 3CA is furnished when a person carrying on
business or profession is already mandated to get his accounts
audited under any other law.
Form No. 3CB is furnished when a person carrying on
business or profession is not required to get his accounts
audited under any other law.
In case of either of the aforementioned audit reports, tax auditor
must furnish the prescribed particulars in Form No. 3CD, which
forms part of audit report.
EXERCISE-
Construction of Balance Sheet -15mts
 This exercise enables you to group the components of
the Balance sheet in respective heads, sub heads
 Helps in understanding and progressing well in Ratio
Analysis
RATIO ANALYSIS
Objectives of Ratio Analysis
Standardize financial information for comparisons
Evaluate current operations
Compare performance with past performance
Compare performance against other firms or industry
standards
Study the efficiency of operations
Study the risk of operations
Determine the strengths and weaknesses of a firm
Historical performance and current financial condition
Interpretation of Ratios
Ratio-analysis is a concept or technique which is as old as
accounting concept. It has assumed important role as a tool
for appraising the real worth of an enterprise, its
performance during a period of time and its pit falls.
Nowadays the entire lending is need-based and the
emphasis is on the financial viability of a proposal and not
only on security alone.
Ratio analysis and other quantitative techniques facilitate
assessment of the risk.
Ratio analysis provides a summarized and concise form of
fairly good idea about the financial position of a unit.
Advantages of Ratios Analysis
It’s a tool which enables the banker or lender to arrive at the
following factors:
 Liquidity position
 Profitability
 Solvency
 Financial Stability
 Quality of the Management
 Safety & Security of the loans & advances to be or already been
provided
Comparison with standard or industry expectations
Simplify complex figures and establish relationships
Ratios Analysis
Before looking at the ratios there are a number of cautionary
points concerning their use that need to be identified :
a. The dates and duration of the financial statements being
compared should be the same. If not, the effects of
seasonality may cause erroneous conclusions to be drawn.
b. The accounts to be compared should have been prepared on
the same bases. Different treatment of stocks or
depreciations or asset valuations will distort the results.
Ratios should be used with due consciousness of their limitations
while evaluating the performance of an organisation and planning
the future strategies for its improvement.
How a Ratio is expressed?
 As Percentage- Such as 25% or 50%. For example if
net profit is Rs.25,000/- and the sales is Rs.1,00,000/-
then the net profit can be said to be 25% of the sales.
 As Proportion- The above figures may be expressed in
terms of the relationship between net profit to sales as
1 : 4.
 As Pure Number/ Times- The same can also be
expressed in an alternatively way such as the sale is 4
times of the net profit or profit is 1/4th
of the sales.
Classification of Ratios
Balance Sheet Ratio P&L Ratio or
Income/Revenue
Statement Ratio
Balance Sheet and Profit
& Loss Ratio
Financial Ratio Operating Ratio Composite Ratio
Current Ratio,
Quick Asset Ratio,
Proprietary Ratio,
Debt Equity Ratio
Gross Profit Ratio,
Operating Profit Ratio,
Expense Ratio,
Net profit Ratio
Fixed Asset Turnover
Ratio, Return on Total
Resources Ratio,
Return on Own Funds
Ratio, Earning per Share
Ratio, Stock Turnover
Ratio, Debtors’ Turnover
Ratio, Creditors’ Turnover
Ratio
Some important notes
Liabilities have Credit balance and Assets have Debit balance.
Net Worth & Long Term Liabilities are also called Long Term Sources of
Funds.
Current Liabilities are known as Short Term Sources of Funds.
Long Term Liabilities & Short Term Liabilities are also called Outside
Liabilities.
Current Assets are Short Term Use of Funds.
Assets other than Current Assets are Long Term Use of Funds.
Installments of Term Loan Payable in 12 months are to be taken as
Current Liability only for Calculation of Current Ratio & Quick Ratio.
If there is profit it shall become part of Net Worth under the head
Reserves and if there is loss it will become part of Intangible Assets.
1. Current Ratio: It is the relationship between the current assets and
current liabilities of a concern.
Current Ratio = Current Assets / Current Liabilities
If the Current Assets and Current Liabilities of a concern are Rs. 6,00,000
and Rs.4,00,000 respectively, then the Current Ratio will be:
Rs.6,00,000/Rs.4,00,000 = 1.5 : 1
The ideal Current Ratio preferred by Banks is 1.33 : 1
2. Net Working Capital: This is worked out as surplus of Long Term
Sources over Long Tern Uses, alternatively it is the difference of Current
Assets and Current Liabilities.
NWC = Current Assets – Current Liabilities
Current ratio must be at least 1.33 : 1 to ensure minimum margin of
25% of current assets as margin from long term sources.
Current Ratio measures short term liquidity of the concern and its
ability to meet its short term obligations within a time span of a
year.
It shows the liquidity position of the enterprise and its ability to
meet current obligations in time.
Higher ratio may be good from the point of view of creditors. But in
the long run very high current ratio may affect profitability ( e.g.
high inventory carrying cost)
Shows the liquidity at a particular point of time. The position can
change immediately after that date. So trend of the current ratio
over the years to be analyzed.
3. ACID TEST or QUICK RATIO : It is the ratio between Quick Current Assets and
Current Liabilities.
Quick Current Assets : Cash/Bank Balances + Receivables upto 6 months +
Quickly realizable securities such as Govt. Securities or quickly
marketable/quoted shares and Bank Fixed Deposits
Acid Test or Quick Ratio = Quick Current Assets/ Current Liabilities
Example :
Cash 50,000
Debtors 1,00,000
Inventories 1,50,000 Current Liabilities 1,00,000
Total Current Assets 3,00,000
Current Ratio = > 3,00,000/1,00,000 = 3 : 1
Quick Ratio = > 1,50,000/1,00,000 = 1.5 : 1
Leverage Ratios
Leverage refers to the use of Debt Finance in the business.
The Debt-Equity Ratio shows the relative contributions of creditors and
owners. It is defined as
Debt / Equity
Debt comprises of all term liabilities and Equity refers to the owners funds.
General norm is 3 : 1
A low DER indicates a higher stake of the owners and sufficient margin for
the creditors.
Lower the DER , higher the protection enjoyed by the creditors
The firm may find it difficult to borrow additional funds if DER is very
high.
4. DEBT EQUITY RATIO: It is the relationship between borrowed fund (Debt)
and Owner’s Capital (Equity).
Total Outside Liabilities / Tangible Net Worth (TNW)
Long Term + Current Liabilities
Total of Capital and Reserves & Surplus Less Intangible Assets
For instance, if the Firm is having the following :
Capital = Rs. 200 Lacs
Free Reserves & Surplus = Rs. 300 Lacs
Long Term Loans/Liabilities = Rs. 800 Lacs
Debt Equity Ratio will be => 800/500 i.e. 1.6 : 1
DEBT EQUITY RATIO:
TOL/ATNW = Total Outside Liabilities .
Adjusted Tangible Net Worth
TTL/ATNW = Total Term Liabilities .
Adjusted Tangible Net Worth
5. PROPRIETARY RATIO : This ratio indicates the extent
to which Tangible Assets are financed by Owner’s
Fund.
Proprietary Ratio = (Tangible Net Worth/Total
Tangible Assets) x 100
The ratio will be 100% when there is no Borrowing
for purchasing of Assets.
Measure the income or operating efficiency of an enterprise for a
given period of time.
6. GROSS PROFIT RATIO :
By comparing Gross Profit percentage to Net Sales, we can
arrive at the Gross Profit Ratio which indicates the
manufacturing efficiency as well as the pricing policy
of the concern.
Gross Profit Ratio = (Gross Profit / Net Sales ) x 100
Profitability Ratios
7. OPERATING PROFIT RATIO :
It is expressed as => (Operating Profit / Net Sales ) x 100
Higher the ratio indicates operational efficiency
8. NET PROFIT RATIO :
It is expressed as => ( Net Profit / Net Sales ) x 100
It measures overall profitability.
Profitability Ratios
Turnover Ratios
Referred to as activity ratios or asset management ratios.
Measures how efficiently the assets are employed by the
firm.
These ratios are based on the relationship between the level
of activity and the level of various assets.
The important ratios are Inventory turnover ratio, Debtors
turnover ratio, Fixed assets turnover ratio and Total assets
turnover ratio.
9. STOCK/INVENTORY TURNOVER RATIO: It measures how fast the
inventory is moving through the firm and generating sales.
Cost of good sold/ Average inventory
This ratio indicates the number of times the inventory is rotated during
the relevant accounting period.
A Higher ratio indicates faster movement of inventory.
A Lower ratio means inefficiency in controlling inventory level
Inventory Holding Period:
(Average Inventory/ Cost of Goods Sold) x 365 for days
(Average Inventory/ Cost of Goods Sold) x 52 for weeks
(Average Inventory/ Cost of Goods Sold) x 12 for months
Average Inventory or Stocks = (Opening Stock + Closing Stock) /2
10. DEBTORS HOLDING RATIO: This is also called Debtors Velocity Ratio or Average
Collection Period or Period of Credit given.
(Average Debtors/Sales ) x 365 for days
(52 for weeks & 12 for months)
It is an indicator of how fast the debtors are realized. A Lower Holding Period
indicates faster collection of debts.
11. CREDITORS HOLDING RATIO: This is also called Creditors Velocity Ratio, which determines
the creditor payment period.
(Average Creditors/ Purchases) x 365 for days
(52 for weeks & 12 for months)
It is an indicator of timely repayment of creditors. A Lower Holding Period
indicates faster payments of creditors.
12. RETURN ON ASSETS : Net Profit after Taxes / Total Assets
13. RETURN ON CAPITAL EMPLOYED :
(Net Profit before Interest & Tax / Average Capital Employed) x 100
Average Capital Employed is the average of the equity share capital and long
term funds provided by the owners and the creditors of the firm at the
beginning and end of the accounting period.
14. RETURN ON EQUITY CAPITAL (ROE) :
Net Profit after Taxes / Tangible Net Worth
Composite Ratio
15. EARNING PER SHARE: EPS indicates the quantum of net profit of the year
that would be ranking for dividend for each share of the company being held
by the equity share holders.
Net profit after Taxes and Preference Dividend/ No. of Equity Shares
16. PRICE EARNING RATIO : PE Ratio indicates the number of times the Earning
Per Share is covered by its market price.
Market Price Per Equity Share/Earning Per Share
Composite Ratio
These ratios indicate the capability of an enterprise to service the
obligations of payment of interest & installments of principal loan
amounts.
There are two broad categories of coverage ratios:
(1) Interest coverage Ratio
PBT+ Depreciation and other non-cash expenses +interest /Interest
 A comfortable level of ICR, therefore, provides an assurance to the
lending banker that the probability of the credit facility under
consideration turning into an NPA is not high
 Benchmark:-Though different banks prescribe different ranges for
this purpose, an ICR level of 3 and above indicates a good interest
paying capability on the part of the borrower
 Too high ratio indicates unused debt position
Coverage Ratios
2. DEBT SERVICE COVERAGE RATIO : This ratio is one of the most
important one which indicates the ability of an enterprise to meet its
liabilities by way of payment of installments of Term Loans and Interest
thereon, out of the cash accruals and forms the basis for fixation of the
repayment schedule in respect of the Term Loans raised for a project.
(The DSCR in every year should be more than ‘1’ atleast. The Ideal DSCR
Ratio is considered to be ‘2’)
PAT + Dep. + Annual Interest on TL .
Annual Installments payable on TL + Annual interest on TL
( Where PAT is Profit after Tax and Dep. is Depreciation)
Average DSCR is the cumulative numerator divided by cumulative
denominator for the entire period of loan. The ratio shall be minimum 1.5
Coverage Ratios
RBI NOTIFICATIONS NO.- RBI/2020-21/34 dated September 7, 2020 in
annex to circular no.- DOR.No.BP.BC/13/21.04.048/2020-21 as per
recommendations of Expert Committee with Shri K. V. Kamath as the
Chairperson:
 TOL/ATNW- DTL will be part of outside liability. Range
of 3-5.
 Total Debt/EBITDA- 4-6 times, Trade –6 times
 DSCR- 1 and above
 ADSCR- 1.2 and above
 ICR- 1.70 and above
Ratios for resolution framework for covid-19 related-stress
 Taking a view on the overall performance of the company by
undertaking a holistic analysis of all the significant ratios taken
together. So, this may indicate either strong or weak position of
the company.
 Select most relevant ratios and study the behavior of these ratios
for decision making purposes.
 Banks have already standardized the important ratios for the
purpose of analysis and decision making. Ratios are compared
with standardized ratio and a quantitative score is awarded to the
particular ratio.
 By assigning weights to individual ratios and based on the total
scoring decision can be taken.
 Basis of Credit scoring.
Credit Decision on the basis of Ratio Analysis
THANK YOU

Balance Sheet components and Ratio Analysis.pptx

  • 1.
    Study, Analysis & Interpretationof Financial Statements and Ratio Analysis
  • 2.
    Session objectives  Familiarizingof Balance Sheet & P&L A/c items  Construction of Balance Sheet  Classification of Balance Sheet items  Financial Statements Analysis  Understanding Ratios & Interpretation of Ratios  Exercises BS & RA  Conclusion- Take Aways
  • 3.
    Financial Statements Balance Sheet Profitand Loss Account Funds Flow Statement Cash Flow Statement Statement of Changes in Equity/ Capital Explanatory Notes Auditors Report
  • 4.
    Balance Sheet  ABalance sheet is a statement of the financial position of a business which states the assets, liabilities and owner's equity at a particular point in time.  Generally prepared at the end of the financial year.  A Balance sheet is the summary of assets and liabilities of a firm/ company at the end of the year, which have been accumulated over the years since its inception. A P&L a/c, on the other hand is a statement of the performance of the firm over the year, ending with the balance sheet date.
  • 5.
    Balance Sheet -Horizontal Form Mostly used by Proprietorship/ partnership Firms Liabilities Assets Share Capital Reserves & Surplus Unsecured Loans Secured Loans Current Liabilities & Provisions Fixed Assets Investments/ Security Deposits Current Assets Loans & Advances Miscellaneous Expenditure Total Total
  • 6.
    I. Sources offunds 1.Equity And Liabilities: (a) Share Capital (b) Reserves & Surplus 2. Loans (a) Secured Loans (b) Unsecured Loans II. Application of Funds 1. Fixed Assets 2. Investments 3. Net Current Assets = Current Assets, Loans & Advances Less: Current Liabilities and Provisions 4. Miscellaneous Expenditure Company BS- New format (Vertical Form)
  • 7.
    Balance Sheet: PART-1 ParticularsNote No. Figures as at the end of current reporting period Figures as at the end of the previous reporting period I. EQUITY AND LIABILITIES (1) Shareholders’ funds (a) Share capital (b) Reserves and surplus (c) Money received against share warrants (2) Share application money pending allotment (3) Non-current liabilities a)Long term borrowings b)Deferred Tax Liability c)Other long term liabilities d)Long term provisions CURRENT LIABILITES a) Short term borrowings b) Trade payables c) Other current liabilities d) Short Term Provisions Name of the Company:……… Balance Sheet as at: ………..
  • 8.
    Balance Sheet: PART-1Cont. Particulars Note No. Figures as at the end of the Current reporting period Figures as at the end of the Previous reporting period II. ASSETS Non-current assets (1) (a) Fixed assets (i) Tangible assets (ii) Intangible assets (iii) Capital work-in-progress (iv) Intangible assets under development (b) Non-current investments (c) Deferred tax assets (net) (d) Long-term loans and advances (e) Other non-current assets (2) Current assets (a) Current investments (b) Inventories (c) Trade receivables (d) Cash and cash equivalents (e) Short-term loans and advances (f) Other current assets
  • 9.
    NEED OF ANALYSIS? Toknowthe Net Worth Toknow the Sources of Funds/ Liabilities Toknow the deployment of assets Toknow the Profit or Loss Toknow the true & fair view of the affairs of the company Used by  Investors /Management  Employees  Customers  Government  General Public  Lenders
  • 10.
    Fixed Assets  Land& Building  Plant & Machinery/ Equipments  Furniture & Fixtures  Vehicles  Generator Set  Pollution Control & Fire Fighting Equipments  Capital work in progress Not convertible into cash in the normal course of business.
  • 11.
    Fixed Assets Capital workin progress: Represents fixed assets under construction. Various kinds of Expenses incurred in this connection are generally capitalized and added to the value of respective capital work in progress. Any advance paid for future acquisition of capital assets should not be classified as current assets.
  • 12.
    Fixed Assets Gross Blockand Net Block: •Gross Block represents the original cost of fixed assets like Land, Building, Plant & Machinery, Vehicles, Furniture & Fixtures, Generator etc. •Depreciation is calculated against each category of fixed assets. •Net Block = Gross Block– Depreciation
  • 13.
    Current Assets  Cash& Bank Balances  Inventories (Raw Material, Semi-Finished goods (SIP/ WIP), Finished goods, Stores & Spares, Consumables, etc.  Sundry Debtors/ Receivables (Less than 180 days) (Refer Credit Policy)  Term Deposits with Banks (Refer Credit Policy)  Advance payment made  Prepaid Expenses  Margin deposited against BG for WC purposes etc.  Expected to be realized in, or intended for sale or consumption in the normal operating cycle.  Convertible into cash or Expected to be realized within 12 months.  Held primarily for the purpose of being traded.  Cash or cash equivalents unless it is restricted.
  • 14.
    Non-Current Assets  SecurityDeposits  Debtors o/s for more than 6 months  Investments in Shares & Debentures  Slow moving/ Non-marketable/ Dead stocks  In Mutual Funds/ Inter Corporate Debts  Investment in Govt. and other trustee securities.  Any investment made in subsidiary companies is treated even if the securities of such subsidiary companies are considered as highly liquid.  Inter Corporate deposits (ICDs) and Loans irrespective of the tenures should always be treated as non current assets. Assets which can not be classified either Fixed Assets or Current Assets. Not readily convertible into cash.
  • 15.
    Current/ Non-Current Assets Investments Investments made in Fixed Deposits with Banks may be treated as current asset irrespective of the maturity period.  However if any of these fixed deposits are offered to bank as cash margin for availing non-fund based credit facilities for project funding or to buy fixed assets, the character of liquidity is lost and hence cannot be treated as current assets.  Deposits held as margin to other types of guarantees (performance guarantee, stand by LC etc.) be treated as Non current assets  However, if the margin for LC/Guarantee is for working capital purposes, then such deposits may be treated as current assets. (Refer Credit Policy)  Bid money/ tender money deposits, EMD/ Security deposits be treated as Non current assets.
  • 16.
    Current/ Non-Current Assets Loans And Advances To Employees– Current Asset  Advances To Owners Of Business– Non Current Asset  Loans And Advance To Buy Raw Material/ Stock In Trade– Current Asset  Loans And advances To Relative of Owners of Business And Associate Firms– Non Current Asset  Advance To Buy A Fixed Asset– Non Current Asset/ Capital Work In Progress  Other security deposits (Rent, Electricity deposit etc.)- NCA  Deposits with Court attachments / Garnishee order- NCA
  • 17.
    Current/ Non-Current Assets Trade debtors’ holding level– Depending on past trend/ market constraints– generally maximum period of 6 months (Exception- post-shipment credit is provided) is treated as Current asset.  The balance portion is treated as noncurrent asset. (Refer Credit Policy)  Disputed debtors- Take them out of the balance sheet and reduce the net worth correspondingly.  Any non-marketable, slow moving and obsolete stock is to be treated as noncurrent asset.
  • 18.
    Intangible Assets These assetsrepresent monetary values of different rights enjoyed by the business enterprise but have no physical or tangible existence. Nevertheless these assets also contribute to profitability, growth and maximization of share holder values. But it is quite difficult to determine fair value of these assets. Also these assets cannot be easily charged as security, for any borrowings. When a company is identified for sale, merger or acquisition, these assets are evaluated and factored in the price.
  • 19.
    Intangible Assets  GoodWill/ Brand Value  Patents/ Trademarks  Copyrights  Intellectual Property Rights (IPR)  Software  Research and Development Expenditure.  P & L Debit Balance (Accumulated Loss)  Preliminary/ Pre- operative Expenses
  • 20.
    Intangible Assets Preliminary Expenses: Expenses in connection with a marketing survey or feasibility study.  Expenses for formation of a Company and Legal charges paid before incorporation  Professional and consulting charges paid for the incorporation of the company and preparation of project report.  Expenses for drafting & printing of Memorandum and Articles of Association of the Company and Registration fees of the Company.  Expenses incurred on Logo Design and Brand. Pre-operative Expenses:  Regulatory expenses like Permits, Licenses etc.  Administrative expenses like Office rental, stationery etc.  Fees for training programmes, Seminars & other educational services.  Pre-opening repair works on rented premises.  Advertisement & Marketing Expenses before starting operations.
  • 21.
    Intangible Assets Preliminary/ Pre-operativeExpenditure  If the amounts are substantial, charging the entire amount to P&L account in the year of occurrence may result in operational losses.  The yearly amortization or write offs also get the benefit of tax reliefs.  A company is allowed to carry forward these expenses / losses over a period of time and charge to profit and loss account every year.  The unamortized portion of such expenses figure in the balance sheet on the asset side. However, these items cannot be regarded as real assets.
  • 22.
  • 23.
    Net Worth/Equity/Owned Funds Paid up Share Capital (A)  Reserves & Surplus (B) • Revenue Reserves - Created out of Profits • Capital Reserves - Extra Ordinary Gains / Share Premium • Revaluation Reserves • Surplus in P & L A/c Total NET WORTH (A + B) (-) Intangibles: (C) TANGIBLE NET WORTH = (A) + (B) – (C) ATNW- ADJUSTED TANGIBLE NET WORTH = TNW- Investment in Subsidiaries/ JVs/ Group Concerns
  • 24.
    Share Capital • AuthorisedCapital: Authorized capital is the maximum value of the shares that a company is legally authorized to issue to the shareholders. Amendment of AC can be done by taking the consent of shareholders. • Issued Capital: When the need comes, a company can issue its shares and generate capital from shareholders. But the issued capital shall be less than the Authorised Capital. • Subscribed Capital: Company can issue its shares in the market, but it is not necessary that all issued shares will be taken/subscribed by investors. Though for good companies, issued shares can also get oversubscribed in IPO. So, subscribed Capital is a portion of issued capital. • Paid Up Capital: Paid-up capital is the amount that is actually paid by the shareholders to the company. The shareholders will have to pay to the company in three steps (a) Upon application, (b) On Allotment, & (c) On Call. Suppose few subscribers failed to pay the last installments. In this case paid-up capital will be less than the subscribed capital.
  • 25.
    Share Capital For GoodCompanies their Issued capital often equals to subscribed capital & Paid-up Capital.
  • 26.
    Term Liabilities  UnsecuredLoans: Loans from Directors, Promoters, Friends, Relatives and Associate concerns  Secured Loans: Term Loans from Banks & Financial Institutions  Public Deposits: Deposits from Public, Deposits from dealer, selling agents etc.  Debentures & Bonds Generally borrowings are made to improve the liquidity and repayable over a period of time beyond 1 year. Therefore, it is normally treated as part of term liability. Any amount payable in the next 12 months is treated as part of current liability.
  • 27.
    Net Worth/Equity/Owned Funds QuasiCapital/ Equity-  Long term loans from Directors/ Promoters/ Friends and relatives.  Without interest or Rate of interest is subordinated to Bank’s rate of interest on credit limits/ loans.  Can be considered upto the Capital for non-corporate borrowers and for companies- upto 50% of paid-up capital. (Refer Credit Policy)  Undertaking is to be obtained that loans will not be withdrawn/ paid during the currency of bank loans.
  • 28.
    Current Liabilities Liabilities whichare payable within a year.  Sundry Creditors/ Trade Payables  Bank’s CC/ OD/ PC/ BD/ BP  Provision for Taxation  Proposed Dividend (Declared but not paid)  Other Statutory Liabilities (due within one year)  Advances from customers  Expenses payable  Term Loan Installments payable within 1 year Applicable to companies only:  Redeemable portion of preference share capital and other public debt  Share application money pending allotment if pending for more than 2 months
  • 29.
    Contingent Liabilities These areOff Balance Sheet Items.  Disputed Tax Liability  Whether Tax Demands have been contested and gone for an appeal  Non-Payment of Taxes or any other Statutory dues, PF etc.  Claims against the Company not acknowledged as Debt  Pending /disputed court cases  Pending insurance claims = contingent assets  Corporate guarantees on behalf of sister concerns, subsidiaries, SPVs etc Impact of these contingent liabilities on the Company to be seen & commented. - Auditors Report for any qualification - Tax Audit Report in 3CB / 3CD
  • 30.
    To make theanalysis meaningful, it may be necessary to : Include, Delete or Reclassify some items of expenses, assets or liabilities We may call it: REGROUPING, RECASTING, RECLASSIFICATION or RESTRUCTURING OF THE FINANCIAL STATEMENTS.
  • 31.
    Balance sheet -Grouping LIABILITIES ASSETS NET WORTH/EQUITY/OWNED FUNDS: Share Capital/Partner’s Capital/Paid up Capital/ Owners Funds/Contribution Reserves (General, Capital, Revaluation & Other Reserves) Credit Balance in P&L A/c FIXED ASSETS: Land & Building, Plant & Machineries/ Equipments, Furniture & Fixtures, Vehicles Net Value or Book Value or Written down value (Original Value Less Depreciation) LONG TERM LIABILITIES/BORROWED FUNDS: Term Loans (Banks & Institutions) Debentures/Bonds, Unsecured Loans, Fixed Deposits, Other Long Term Liabilities NON CURRENT ASSETS: Investments in quoted shares & securities, Long Term Security Deposits, Old stocks or old/disputed book debts, Other Misc. assets which are not current or fixed in nature CURRENT LIABILTIES: Bank Working Capital Limits such as CC/OD/PC/Bills/Export Credit Sundry/ Trade Creditors/Creditors/Bills Payable, Short duration loans or deposits Expenses payable & provisions against various items CURRENT ASSETS: Cash & Bank Balance, Marketable/quoted Govt. or other securities, Book Debts/Sundry Debtors, Bills Receivables, Stocks & inventory (RM,SIP,FG,PM) Stores & Spares, Advance Payment of Taxes, Prepaid expenses, Loans and Advances recoverable within 12 months INTANGIBLE ASSETS: Patent, Goodwill, Trademarks, Copyrights, Debit balance in P&L A/c, Preliminary or Preoperative expenses
  • 32.
    Net Worth FinancesAll Assets Partially Or Fully LONG TERM LOANS FIXED ASSETS NET WORTH NON CURRENT ASSETS & INTANGIBLES CURRENT ASSETS BANK BORROWINGS OTHER CURRENT LIABILITIES
  • 33.
    Profit & LossAccount  No prescribed format even under the Companies Act, 1956  Has to show specific information as required by Schedule IV  May be presented in Horizontal Form (account form) or the Vertical Form (report form)  All expenses shall have to be provided for  Deferred revenue expenditure shall have to be amortized over a period of years  Depreciation shall have to be provided
  • 34.
    • Income NetSales (Sales minus Excise Duty) Other Income (Net of other Expenses) • Expenditure Material & other Expenditure Interest Depreciation • Profit before tax Provision for Tax • Profit after Tax [PAT] – • Profit available for appropriations Dividend General Reserve Surplus carried to B/S. Format of Profit & Loss Account
  • 35.
    Analysis of FinancialStatements Why?  What is the financial standing of the entity – SOUND?  How did it perform over a given period?  Whether my/our interests are safe? Analysis helps knowing - Adequacy of Profits - Solvency Position - Liquidity Position - Capital Structure position - Turnover of Stock - Turnover of Debtors & Creditors
  • 36.
    Analysis of BalanceSheet Steps Regrouping of Assets into Current Assets, Non-Current Assets and Fixed Assets Regrouping of Liabilities into Current Liabilities, Term Liabilities and Tangible Net worth (Owners funds, net of intangibles). Computation of Ratios / Comparison with that of the previous year / Bench Mark Ratios Comments on Business Parameters/ Profitability Parameters/ Liquidity/ Solvency Preparation of Fund Flow Statement
  • 37.
    AUDIT OF FINANCIALSTATEMENTS Compulsory for Limited Companies. Tax Audit is compulsory if Turnover/ Sales is above Rs. 1 Crore in case of Business. Incase of Professional, if total gross receipts exceed Rs 50 Lakh in the FY. In Feb-2020 Budget, limit for Tax Audit was increased to Rs. 5 Cr for those who carry out 95% of their transactions digitally. Now in Budget of Feb- 2021 this limit is proposed to increase to Rs. 10 Cr.
  • 38.
    What constitutes Auditreport? Tax auditor shall furnish his report in a prescribed form which could be either Form 3CA or Form 3CB where: Form No. 3CA is furnished when a person carrying on business or profession is already mandated to get his accounts audited under any other law. Form No. 3CB is furnished when a person carrying on business or profession is not required to get his accounts audited under any other law. In case of either of the aforementioned audit reports, tax auditor must furnish the prescribed particulars in Form No. 3CD, which forms part of audit report.
  • 39.
    EXERCISE- Construction of BalanceSheet -15mts  This exercise enables you to group the components of the Balance sheet in respective heads, sub heads  Helps in understanding and progressing well in Ratio Analysis
  • 40.
  • 41.
    Objectives of RatioAnalysis Standardize financial information for comparisons Evaluate current operations Compare performance with past performance Compare performance against other firms or industry standards Study the efficiency of operations Study the risk of operations Determine the strengths and weaknesses of a firm Historical performance and current financial condition
  • 42.
    Interpretation of Ratios Ratio-analysisis a concept or technique which is as old as accounting concept. It has assumed important role as a tool for appraising the real worth of an enterprise, its performance during a period of time and its pit falls. Nowadays the entire lending is need-based and the emphasis is on the financial viability of a proposal and not only on security alone. Ratio analysis and other quantitative techniques facilitate assessment of the risk. Ratio analysis provides a summarized and concise form of fairly good idea about the financial position of a unit.
  • 43.
    Advantages of RatiosAnalysis It’s a tool which enables the banker or lender to arrive at the following factors:  Liquidity position  Profitability  Solvency  Financial Stability  Quality of the Management  Safety & Security of the loans & advances to be or already been provided Comparison with standard or industry expectations Simplify complex figures and establish relationships
  • 44.
    Ratios Analysis Before lookingat the ratios there are a number of cautionary points concerning their use that need to be identified : a. The dates and duration of the financial statements being compared should be the same. If not, the effects of seasonality may cause erroneous conclusions to be drawn. b. The accounts to be compared should have been prepared on the same bases. Different treatment of stocks or depreciations or asset valuations will distort the results. Ratios should be used with due consciousness of their limitations while evaluating the performance of an organisation and planning the future strategies for its improvement.
  • 45.
    How a Ratiois expressed?  As Percentage- Such as 25% or 50%. For example if net profit is Rs.25,000/- and the sales is Rs.1,00,000/- then the net profit can be said to be 25% of the sales.  As Proportion- The above figures may be expressed in terms of the relationship between net profit to sales as 1 : 4.  As Pure Number/ Times- The same can also be expressed in an alternatively way such as the sale is 4 times of the net profit or profit is 1/4th of the sales.
  • 46.
    Classification of Ratios BalanceSheet Ratio P&L Ratio or Income/Revenue Statement Ratio Balance Sheet and Profit & Loss Ratio Financial Ratio Operating Ratio Composite Ratio Current Ratio, Quick Asset Ratio, Proprietary Ratio, Debt Equity Ratio Gross Profit Ratio, Operating Profit Ratio, Expense Ratio, Net profit Ratio Fixed Asset Turnover Ratio, Return on Total Resources Ratio, Return on Own Funds Ratio, Earning per Share Ratio, Stock Turnover Ratio, Debtors’ Turnover Ratio, Creditors’ Turnover Ratio
  • 47.
    Some important notes Liabilitieshave Credit balance and Assets have Debit balance. Net Worth & Long Term Liabilities are also called Long Term Sources of Funds. Current Liabilities are known as Short Term Sources of Funds. Long Term Liabilities & Short Term Liabilities are also called Outside Liabilities. Current Assets are Short Term Use of Funds. Assets other than Current Assets are Long Term Use of Funds. Installments of Term Loan Payable in 12 months are to be taken as Current Liability only for Calculation of Current Ratio & Quick Ratio. If there is profit it shall become part of Net Worth under the head Reserves and if there is loss it will become part of Intangible Assets.
  • 48.
    1. Current Ratio:It is the relationship between the current assets and current liabilities of a concern. Current Ratio = Current Assets / Current Liabilities If the Current Assets and Current Liabilities of a concern are Rs. 6,00,000 and Rs.4,00,000 respectively, then the Current Ratio will be: Rs.6,00,000/Rs.4,00,000 = 1.5 : 1 The ideal Current Ratio preferred by Banks is 1.33 : 1 2. Net Working Capital: This is worked out as surplus of Long Term Sources over Long Tern Uses, alternatively it is the difference of Current Assets and Current Liabilities. NWC = Current Assets – Current Liabilities
  • 49.
    Current ratio mustbe at least 1.33 : 1 to ensure minimum margin of 25% of current assets as margin from long term sources. Current Ratio measures short term liquidity of the concern and its ability to meet its short term obligations within a time span of a year. It shows the liquidity position of the enterprise and its ability to meet current obligations in time. Higher ratio may be good from the point of view of creditors. But in the long run very high current ratio may affect profitability ( e.g. high inventory carrying cost) Shows the liquidity at a particular point of time. The position can change immediately after that date. So trend of the current ratio over the years to be analyzed.
  • 51.
    3. ACID TESTor QUICK RATIO : It is the ratio between Quick Current Assets and Current Liabilities. Quick Current Assets : Cash/Bank Balances + Receivables upto 6 months + Quickly realizable securities such as Govt. Securities or quickly marketable/quoted shares and Bank Fixed Deposits Acid Test or Quick Ratio = Quick Current Assets/ Current Liabilities Example : Cash 50,000 Debtors 1,00,000 Inventories 1,50,000 Current Liabilities 1,00,000 Total Current Assets 3,00,000 Current Ratio = > 3,00,000/1,00,000 = 3 : 1 Quick Ratio = > 1,50,000/1,00,000 = 1.5 : 1
  • 52.
    Leverage Ratios Leverage refersto the use of Debt Finance in the business. The Debt-Equity Ratio shows the relative contributions of creditors and owners. It is defined as Debt / Equity Debt comprises of all term liabilities and Equity refers to the owners funds. General norm is 3 : 1 A low DER indicates a higher stake of the owners and sufficient margin for the creditors. Lower the DER , higher the protection enjoyed by the creditors The firm may find it difficult to borrow additional funds if DER is very high.
  • 53.
    4. DEBT EQUITYRATIO: It is the relationship between borrowed fund (Debt) and Owner’s Capital (Equity). Total Outside Liabilities / Tangible Net Worth (TNW) Long Term + Current Liabilities Total of Capital and Reserves & Surplus Less Intangible Assets For instance, if the Firm is having the following : Capital = Rs. 200 Lacs Free Reserves & Surplus = Rs. 300 Lacs Long Term Loans/Liabilities = Rs. 800 Lacs Debt Equity Ratio will be => 800/500 i.e. 1.6 : 1
  • 54.
    DEBT EQUITY RATIO: TOL/ATNW= Total Outside Liabilities . Adjusted Tangible Net Worth TTL/ATNW = Total Term Liabilities . Adjusted Tangible Net Worth
  • 56.
    5. PROPRIETARY RATIO: This ratio indicates the extent to which Tangible Assets are financed by Owner’s Fund. Proprietary Ratio = (Tangible Net Worth/Total Tangible Assets) x 100 The ratio will be 100% when there is no Borrowing for purchasing of Assets.
  • 57.
    Measure the incomeor operating efficiency of an enterprise for a given period of time. 6. GROSS PROFIT RATIO : By comparing Gross Profit percentage to Net Sales, we can arrive at the Gross Profit Ratio which indicates the manufacturing efficiency as well as the pricing policy of the concern. Gross Profit Ratio = (Gross Profit / Net Sales ) x 100 Profitability Ratios
  • 58.
    7. OPERATING PROFITRATIO : It is expressed as => (Operating Profit / Net Sales ) x 100 Higher the ratio indicates operational efficiency 8. NET PROFIT RATIO : It is expressed as => ( Net Profit / Net Sales ) x 100 It measures overall profitability. Profitability Ratios
  • 59.
    Turnover Ratios Referred toas activity ratios or asset management ratios. Measures how efficiently the assets are employed by the firm. These ratios are based on the relationship between the level of activity and the level of various assets. The important ratios are Inventory turnover ratio, Debtors turnover ratio, Fixed assets turnover ratio and Total assets turnover ratio.
  • 61.
    9. STOCK/INVENTORY TURNOVERRATIO: It measures how fast the inventory is moving through the firm and generating sales. Cost of good sold/ Average inventory This ratio indicates the number of times the inventory is rotated during the relevant accounting period. A Higher ratio indicates faster movement of inventory. A Lower ratio means inefficiency in controlling inventory level Inventory Holding Period: (Average Inventory/ Cost of Goods Sold) x 365 for days (Average Inventory/ Cost of Goods Sold) x 52 for weeks (Average Inventory/ Cost of Goods Sold) x 12 for months Average Inventory or Stocks = (Opening Stock + Closing Stock) /2
  • 62.
    10. DEBTORS HOLDINGRATIO: This is also called Debtors Velocity Ratio or Average Collection Period or Period of Credit given. (Average Debtors/Sales ) x 365 for days (52 for weeks & 12 for months) It is an indicator of how fast the debtors are realized. A Lower Holding Period indicates faster collection of debts. 11. CREDITORS HOLDING RATIO: This is also called Creditors Velocity Ratio, which determines the creditor payment period. (Average Creditors/ Purchases) x 365 for days (52 for weeks & 12 for months) It is an indicator of timely repayment of creditors. A Lower Holding Period indicates faster payments of creditors.
  • 63.
    12. RETURN ONASSETS : Net Profit after Taxes / Total Assets 13. RETURN ON CAPITAL EMPLOYED : (Net Profit before Interest & Tax / Average Capital Employed) x 100 Average Capital Employed is the average of the equity share capital and long term funds provided by the owners and the creditors of the firm at the beginning and end of the accounting period. 14. RETURN ON EQUITY CAPITAL (ROE) : Net Profit after Taxes / Tangible Net Worth Composite Ratio
  • 64.
    15. EARNING PERSHARE: EPS indicates the quantum of net profit of the year that would be ranking for dividend for each share of the company being held by the equity share holders. Net profit after Taxes and Preference Dividend/ No. of Equity Shares 16. PRICE EARNING RATIO : PE Ratio indicates the number of times the Earning Per Share is covered by its market price. Market Price Per Equity Share/Earning Per Share Composite Ratio
  • 65.
    These ratios indicatethe capability of an enterprise to service the obligations of payment of interest & installments of principal loan amounts. There are two broad categories of coverage ratios: (1) Interest coverage Ratio PBT+ Depreciation and other non-cash expenses +interest /Interest  A comfortable level of ICR, therefore, provides an assurance to the lending banker that the probability of the credit facility under consideration turning into an NPA is not high  Benchmark:-Though different banks prescribe different ranges for this purpose, an ICR level of 3 and above indicates a good interest paying capability on the part of the borrower  Too high ratio indicates unused debt position Coverage Ratios
  • 66.
    2. DEBT SERVICECOVERAGE RATIO : This ratio is one of the most important one which indicates the ability of an enterprise to meet its liabilities by way of payment of installments of Term Loans and Interest thereon, out of the cash accruals and forms the basis for fixation of the repayment schedule in respect of the Term Loans raised for a project. (The DSCR in every year should be more than ‘1’ atleast. The Ideal DSCR Ratio is considered to be ‘2’) PAT + Dep. + Annual Interest on TL . Annual Installments payable on TL + Annual interest on TL ( Where PAT is Profit after Tax and Dep. is Depreciation) Average DSCR is the cumulative numerator divided by cumulative denominator for the entire period of loan. The ratio shall be minimum 1.5 Coverage Ratios
  • 68.
    RBI NOTIFICATIONS NO.-RBI/2020-21/34 dated September 7, 2020 in annex to circular no.- DOR.No.BP.BC/13/21.04.048/2020-21 as per recommendations of Expert Committee with Shri K. V. Kamath as the Chairperson:  TOL/ATNW- DTL will be part of outside liability. Range of 3-5.  Total Debt/EBITDA- 4-6 times, Trade –6 times  DSCR- 1 and above  ADSCR- 1.2 and above  ICR- 1.70 and above Ratios for resolution framework for covid-19 related-stress
  • 69.
     Taking aview on the overall performance of the company by undertaking a holistic analysis of all the significant ratios taken together. So, this may indicate either strong or weak position of the company.  Select most relevant ratios and study the behavior of these ratios for decision making purposes.  Banks have already standardized the important ratios for the purpose of analysis and decision making. Ratios are compared with standardized ratio and a quantitative score is awarded to the particular ratio.  By assigning weights to individual ratios and based on the total scoring decision can be taken.  Basis of Credit scoring. Credit Decision on the basis of Ratio Analysis
  • 70.

Editor's Notes

  • #41 Uses 1.      Managers – to help analyze, control, improve a firm’s operations 2.      Credit analysts – to help ascertain a company’s ability to pay its debts 3.      Stock analysts – to determine a company’s efficiency, risk and growth potential
  • #42 Uses 1.      Managers – to help analyze, control, improve a firm’s operations 2.      Credit analysts – to help ascertain a company’s ability to pay its debts 3.      Stock analysts – to determine a company’s efficiency, risk and growth potential
  • #43 Uses 1.      Managers – to help analyze, control, improve a firm’s operations 2.      Credit analysts – to help ascertain a company’s ability to pay its debts 3.      Stock analysts – to determine a company’s efficiency, risk and growth potential
  • #44 Uses 1.      Managers – to help analyze, control, improve a firm’s operations 2.      Credit analysts – to help ascertain a company’s ability to pay its debts 3.      Stock analysts – to determine a company’s efficiency, risk and growth potential
  • #47 Investments in Govt. Securities to be treated current only if these are marketable and due. Investments in other securities are to be treated Current if they are quoted. Investments in allied/associate/sister units or firms to be treated as Non-current. Bonus Shares as issued by capitalization of General reserves and as such do not affect the Net Worth. With Rights Issue, change takes place in Net Worth and Current Ratio.