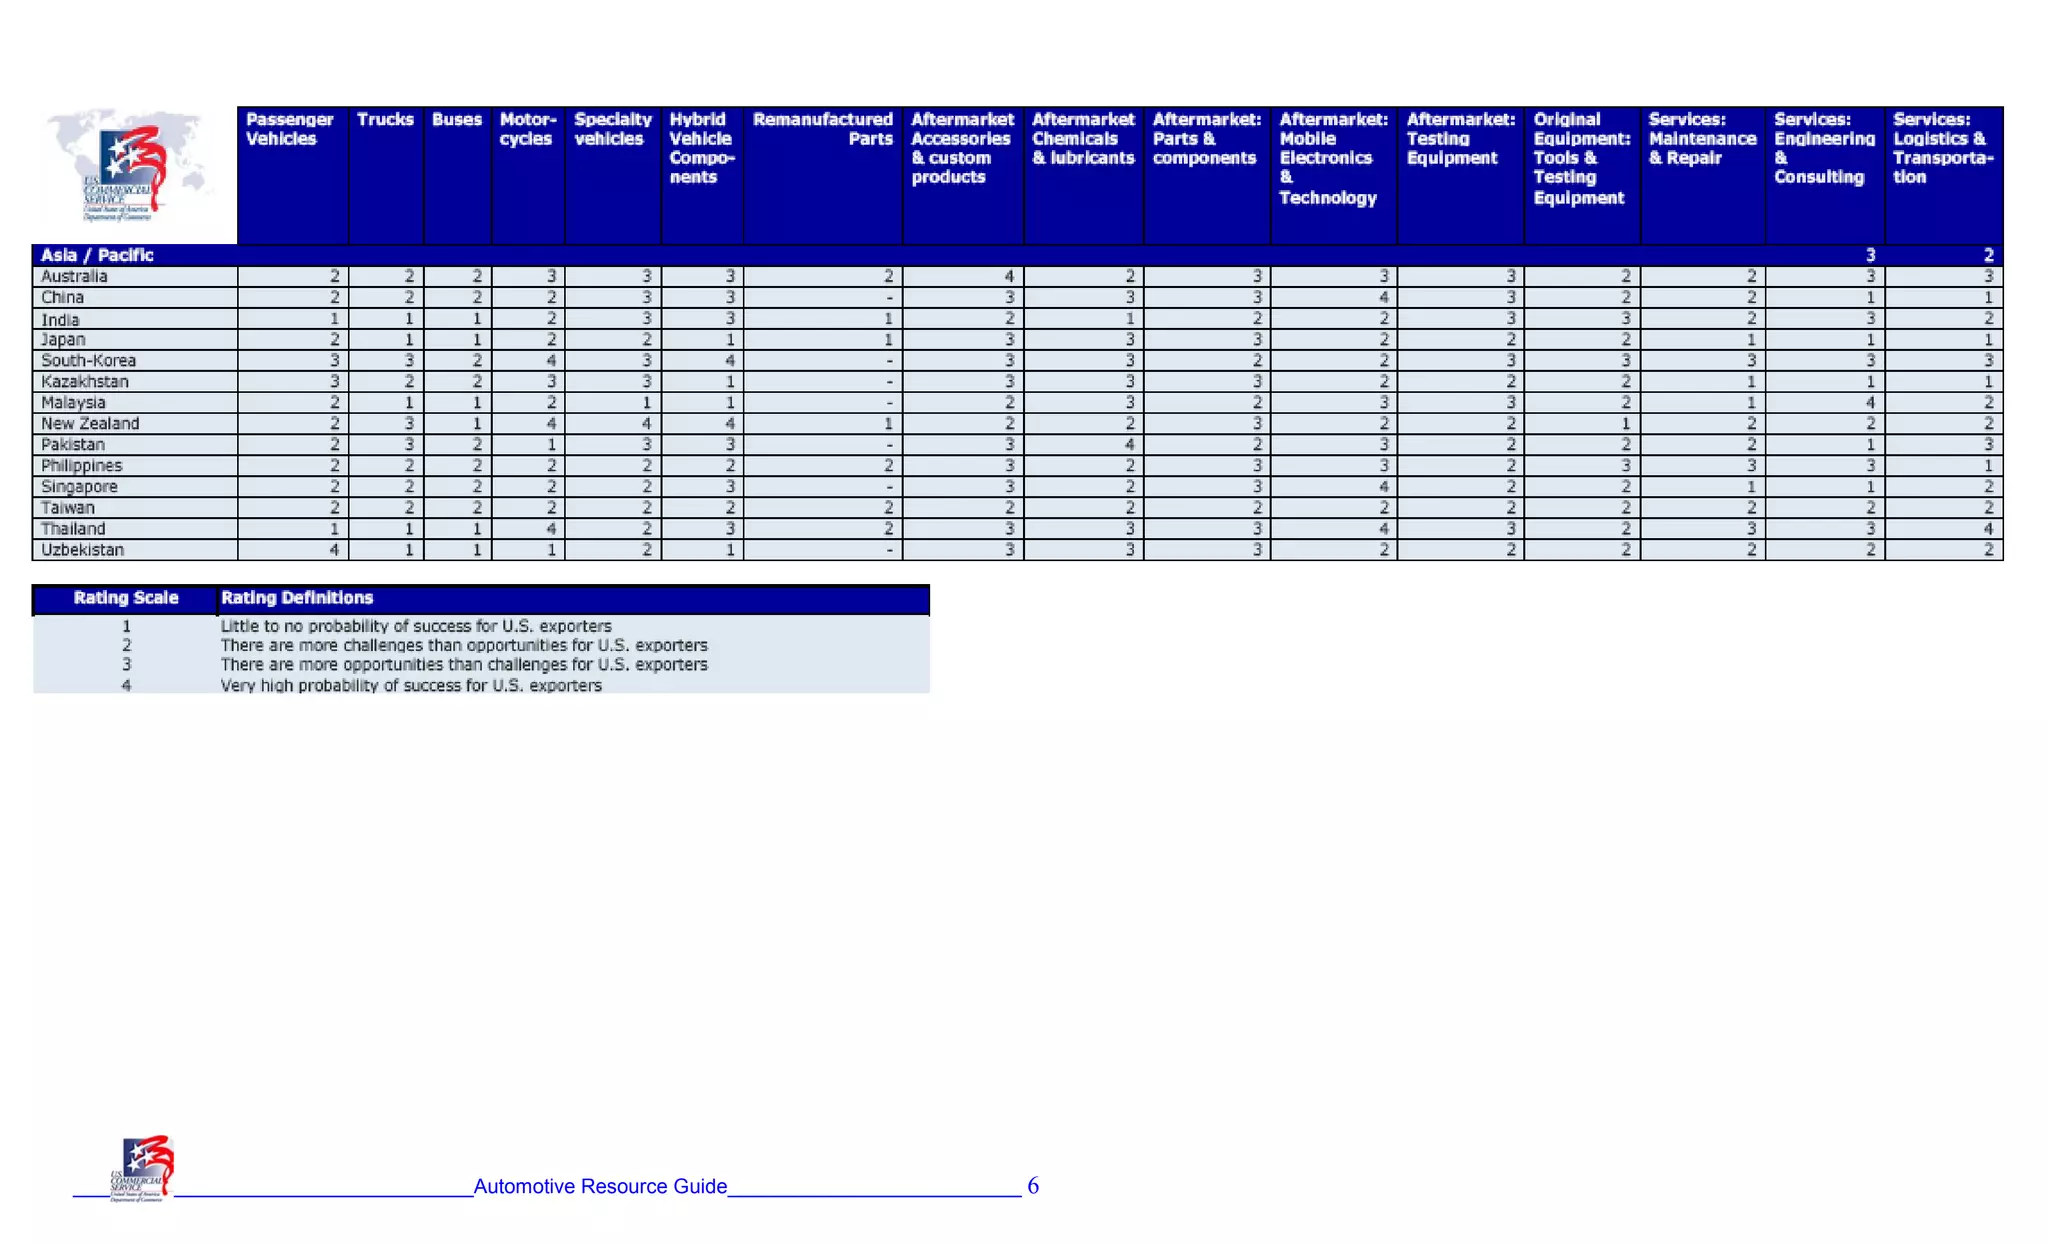
The automotive aftermarket in Australia has averaged over 5% growth in the past decade, with the United States being the leading supplier at 20% market share. Opportunities exist for U.S. exporters across many automotive subsectors due to the U.S.-Australia Free Trade Agreement which eliminated tariffs on 99% of U.S. exports. While the U.S. market share is decreasing, performance parts, specialty equipment, SUV/truck parts, and motorcycle parts are promising areas of growth. The main barriers are meeting Australian Design Rules for vehicle safety and emissions standards.
2. ACKNOWLEDGEMENT
The Automotive Resource Guide was made possible by:
Natasha Keylard, U.S. Commercial Service The Hague, the Netherlands
Eduard Roytberg, U.S. Export Assistance Center Ontario, CA
Joel Reynoso, U.S. Export Assistance Center Newark, NJ
For concept development & overall coordination.
The U.S. Commercial Service international staff worldwide
For their country assessments.
_____ ___________________________Automotive Resource Guide__________________________
3. Table of Contents
______________________________________________________________________________________________________
Introduction ………………………………………………………………………. 2
What can the Global Automotive Team do for you? …………………………….……. 3
How to use this guide ………………………………..………………………………………. 4
Sub-sector Matrix ………………………………..………………………………………. 5
Australia ………………………………………………………….……………. 7
Austria ………………………………………………………….……………. 9
Belgium ………………………………………………………….……………. 11
Brazil …………………………………………………………………….…. 13
Bulgaria ………………………………………………………………………. 16
Canada ………………………………………………………………………. 18
China ………………………………………………………………………. 21
Columbia ………………………………………………………………………. 23
Costa Rica ………………………………………………………………………. 26
Croatia ………………………………………………………………………. 28
Czech Republic ………………………………………………………………………. 29
Denmark ………………………………………………………………………. 31
Dominican Republic ………………………………………………………………………. 33
Ecuador ………………………………………………………………………. 35
El Salvador ………………………………………………………………………. 36
Finland ………………………………………………………………………. 38
France ………………………………………………………………………. 40
Germany ………………………………………………………………………. 42
Honduras ………………………………………………………………………. 50
Hungary ………………………………………………………………………. 53
India ………………………………………………………………………. 55
Israel ………………………………………………………………………. 57
Japan ………………………………………………………………………. 59
Jordan ………………………………………………………………………. 61
Kazakhstan ………………………………………………………………………. 64
South Korea ………………………………………………………………………. 66
_____ ___________________________Automotive Resource Guide__________________________
4. Table of Contents
_____________________________________________________________________________________________________________
Kuwait ……………………………………………………………………. 68
Lebanon ……………………………………………………………………. 70
Malaysia ……………………………………………………………………. 71
Mexico ……………………………………………………………………. 72
Morocco ……………………………………………………………………. 75
Netherlands, The ……………………………………………………………………. 76
New Zealand ……………………………………………………………………. 78
Nigeria ……………………………………………………………………. 80
Pakistan ……………………………………………………………………. 82
Panama ……………………………………………………………………. 85
Philippines ……………………………………………………………………. 87
Poland ……………………………………………………………………. 90
Romania …………………………………………………………………….. 93
Russia …………………………………………………………………….. 95
Singapore …………………………………………………………………….. 98
Slovakia ………………………………..…………………………………… 101
South Africa ………………………………..…………………………………... 103
Spain …………………………………..………………………………...105
Sweden ……………………………………..……………………………...106
Switzerland ………………………………………..……………………………108
Taiwan ………………………………………..……………………………110
Thailand ………………………………………..……………………………111
Turkey ………………………………………..……………………………113
United Arab Emirates ………………………………………..……………………………116
United Kingdom ………………………………………..……………………………118
Uzbekistan ………………………………………..……………………………120
Venezuela ………………………………………..……………………………120
West Bank and Gaza ………………………………………..……………………………123
……
Key e-Resources ………………………..….…….…….……………………………124
_____ ___________________________Automotive Resource Guide__________________________
5. Introduction
_______________________________________________________________________________________________________________
For quite a number of years, we have witnessed U.S. companies struggle with the identification of
promising export markets. It was difficult to determine which country may have potential for your product
or service. In fact, exporters were spending valuable company resources assessing markets that held
little promise. As a result, my colleagues and I worked together to create a solution – the Automotive
Resource Guide. We are proud to offer you the second edition of the Automotive Resource Guide, which
identifies markets where U.S. automotive products or services are likely to succeed. The guide offers
foreign market information and additional resources to help increase your international sales.
The Automotive Resource Guide was developed by the Global Automotive Team, a vital part of the
International Trade Administration's U.S. Commercial Service. We are dedicated to serving you, the U.S.
automotive industry. The Global Automotive Team is comprised of a network of domestic and
international automotive specialists, whose primary objective is to help both large and small automotive
firms expand into foreign markets. Our Team members are located in 102 offices throughout the United
States and in U.S. Embassies and Consulates in more than 80 countries across the globe.
Our goal is to promote U.S exports in projects that transcend geographical lines. We focus on the
changing world economy in an effort to get you involved in international opportunities before the
competition. We are well-connected and have the ability to open doors, as demonstrated by our ability to
get U.S. companies involvement in projects with major foreign OEMs, such as Renault-Nissan, Hyundai-
Kia and Volkswagen.
We do not play down the challenges facing the U.S. motor vehicle industry, the largest manufacturing
industry in the United States. We consciously focus on areas where we can make a meaningful
contribution because we view the industry as being dynamic and tremendously successful.
As we move forward, your feedback will become an important barometer for shaping our activities. If the
Automotive Resource Guide is useful to you, please share your experience with us and help us identify
areas of improvement by emailing us directly at Eduard.Roytberg@trade.gov or
Natasha.Keylard@trade.gov. As a government resource for U.S. companies, our team relies on your
comments and needs to hear whether we are serving you well.
We look forward to opening up markets on your behalf and delivering opportunities to your doorstep.
Sincerely,
Eduard Roytberg Natasha Keylard
Global Automotive Team Leader 2010-2011 Global Automotive Team Leader 2008-2009
_____ ___________________________Automotive Resource Guide__________________________
6. What Can The Global Automotive Team Do For You?
______________________________________________________________________________________________________________
Members of the Global Automotive Team are your
primary export resource and should be your first
point of contact when you plan to expand Export Success Stories
internationally. Why should you work with the
Global Automotive Team? Gold Eagle Company, a
manufacturer and distributor of
aftermarket fluids was put in
Our Team of international trade specialists contact with a Dominican
provide export assistance by helping you distributor of engine lubricating oils
identify markets of opportunity and connecting when the foreign buyer required
you with qualified distributors and partners in our assistance in identifying U.S.
suppliers. This match was realized
foreign markets through domestic team member
Robin Mugford out of our office in
We provide up-to-date market research Libertyville, Illinois, and our
produced by our overseas specialists on market international team member Isolde
conditions, industry-specific information, areas Frias out of our office in Santo
Domingo. The effort resulted in a
of growth and opportunity, local competition, sale worth over $48,000.
distribution channels, and more.
A manufacturer of windshield wiper
We disseminate trade leads at the request of systems and fractional horsepower
foreign buyers motors, used CS support to
expand their international sales
and marketing plans. Gail Snyder,
We are present at a most large international our domestic Automotive Team
trade shows across the globe in an effort to member out of our office in
maximize your time at these events through Portland, Oregon, counseled
matchmaking and pre-show promotional company representatives on
Commercial Services programs,
campaigns to foreign buyers provided market research, and
gave them access to educational
We offer market and issue-specific webinars programs. Company
with industry experts that you can participate in representatives attended an Export
without leaving your desk Strategies Seminar, which covered
marketing, distribution, finance,
and documentation to expand their
We organize trade missions to markets that knowledge base. Trade Specialist
hold great opportunities Snyder also set up consultation
appointments for the manufacturer
We maintain and build partnerships with to meet with staff in our offices in
Guadalajara. The company is now
industry associations to jointly promote your actively exporting to Mexico, a
interests value to date of approximately
$24,000. This client has since
broadened its S. America plans by
starting additional Commercial
Service programs.
www.USAutoTeam.org
_____ ___________________________Automotive Resource Guide__________________________
7. How to Use This Guide
______________________________________________________________________________________________________________
While our economy may be taking a downturn, exports are booming. Many U.S. automotive firms, both
small and large, have been able to continue their success by looking at foreign buyers and overseas
partners. Through this Resource Guide, the U.S. Commercial Service is encouraging more U.S. firms to
take advantage of a weak dollar and a global demand for American expertise in the automotive sector to
explore foreign markets.
The Resource Guide is divided into main two sections, an automotive sub-sector matrix and a market
research section for each country. In the back of this book you will find a reference section that is
designed to provide additional sources of information for exporting generally.
The matrix provides ratings for countries in each of 15 automotive sub-sectors. It is intended to provide
the reader with a quick reference in understanding which of 15 automotive sub-sectors have the most
potential for success in a given market. Each sub-sector and market has a 1-4 rating according to the
opinion of our automotive commercial specialist. The numbers refer to the following.
1 A U.S. exporter has little or no probability of success in this market
2 There are more challenges than opportunities for a U.S. exporter in this market
3 There are more opportunities than challenges for a U.S. exporter in this market
4 A U.S. exporter has a very high probability of success in this market
A short market research section follows, authored by each automotive commercial specialist that further
explains opportunities or barriers within the markets indicated in the matrix.
The ratings in the sub-sector matrix and the market research represent the opinions of the commercial
specialists responsible for the automotive sector at U.S. embassies and consulates worldwide. You will
notice that the sub-sector categories are still quite broad and may not be applicable to specific products
within those sub-sectors. We encourage you to do further research to confirm that there is a market for
your product or service. There may be additional barriers to entry once a market is further explored,
such as political turmoil or a change in import duties since the date of this publication. While we
encourage you to use our expertise and services, there are other sources of information to help decide
if you are prepared to enter a foreign market. See our reference section for more information.
The U.S. Commercial Service is present in 80 countries; however we are not in all markets. Not all
countries are represented in the matrix or the market research section. Therefore, you should not
assume that there is no market for U.S. automotive products in countries not included in this guide. If
you are interested in a market that is not represented in the Resource Guide, contact the nearest local
U.S. trade specialist in one of our 102 offices in the U.S.
Disclaimer: The information provided in this report is intended to be of assistance to U.S. exporters. While we make every
effort to ensure its accuracy, neither the United States government nor any of its employees make any representation as to the
accuracy or completeness of information in this or any other United States government document. Readers are advised to
independently verify any information prior to reliance thereon. The information provided in this report does not constitute
legal advice. International copyright, U.S. Department of Commerce, 2009. All rights reserved outside of the United States.
_____ ___________________________Automotive Resource Guide__________________________
10. Australia
Capital: Canberra
Population: 22 million
GDP*: $795 billion
Currency: Australian dollar
Language: English
Summary
Growth in Australia’s aftermarket has averaged in excess of 5% over the past ten years. According to the World
Trade Atlas 2008, the United States is the leading supplier, accounting for 20% of imports ($328 million), while
Japan is the second most important supplier; 17% market share ($290 million). Excellent opportunities exist in
Australia for U.S. exporters in the Automotive Industry.
Market Entry
The U.S.-Australia Free Trade Agreement (FTA) eliminated tariffs on 99% of U.S.
exports to Australia, which have increased 10.4% since the FTA entered into effect in
2005. Providing the products can be classified as automotive items of minimum 51%
U.S. content, they will not be subject to any customs tariffs under the Australia-U.S.
Free Trade Agreement. Documentation stating the Rules of Origin, however, should
accompany the shipment of goods.
Current Market Trends
The United States is currently the leading supplier of automotive products to Australia with $1.6 billion exported
from the United States to Australia in 2008. This represents 20% of the market. Market share is decreasing for
the United States, however, while increasing significantly for China, a popular trend experienced across the
developed world.
8708 Parts & Access For Motor Vehicles (Head 8701-8705)
U.S. Millions % Share % Change
Rank Country 2006 2007 2008 2006 2007 2008 - 08/07 -
--The World-- 1435.1 1548.8 1670.7 100 100 100 n/a
1 United States 326.2 366.2 328.5 23 24 20 -10
2 Japan 311.7 305.6 290.2 22 20 17 -5
3 China 103.6 140.0 176.6 7 9 11 26
4 Germany 139.6 137.3 146.5 10 9 9 7
5 Thailand 73.2 110.7 124.1 5 7 7 12
The economic crisis positively affects the Australian Automotive Aftermarket Industry as consumers opt to service
and improve their current motor vehicles.
Main Competitors
There are three automotive vehicle manufacturers that dominate the Australian automotive industry market share;
Toyota (20.7%), GM Holden (12.5%), and Ford (10.3%). All three companies have manufacturing facilities in
Australia. The Federal Chamber of Automotive Industries (FCAI) advises that the year-to-date 2009 market of
350,376 vehicles is behind the same period in 2008 by 19.2% or 83,778 vehicle sales.
Current Demand
Traditionally, replacement parts were a prominent part of the industry, and while they still remain a necessity,
replacement parts are continuing to be less important to the industry. The best prospects are in the specialty
equipment market and the performance sector for passenger vehicles. Additionally, the motorcycle market,
trucking industry and SUV market all offer fantastic opportunities for U.S. exporters.
The performance market in Australia is a niche; however, performance, racing and tuning businesses turnover
$390 million annually. This comprises 10% of the total independent automotive aftermarket, which is in turn a part
of Australia’s $5.3 billion accessories and parts industry.
_____ ___________________________Automotive Resource Guide__________________________ 7
11. The best prospects are engine modifications, turbos, superchargers, and brake and clutch improvements. An
interesting emerging market is the ‘green’ performance area, where customers buy products that enhance fuel
economy, while also improving performance. Parts and accessories for the SUV market, the trucking industry,
and motorcycles are proving increasingly popular. Research group IBIS has predicted that the motorcycle
industry will show some of the strongest growth in the automotive industry and grow by 8.9 percent to achieve
total revenue of $3.6 billion in 2010-2011.
In general, Australians always seek quality, unique, innovative, and/or environmentally-friendly products for the
automotive Industry.
Barriers
The Department of Infrastructure, Transport, Regional Development and Local
Government (www.infrastructure.gov.au) governs the Australian Design Rules
(ADRs). The ADRs are national standards for vehicle safety, anti-theft and emissions.
The ADRs are generally performance based and cover issues such as occupant
protection, structures, lighting, noise, engine exhaust emissions, braking and a range
of miscellaneous items. The current standards, the Third Edition ADRs, are
administered by the Australian Government under the Motor Vehicle Standards Act
1989. The Act requires all road vehicles, whether they are newly manufactured in
Australia or are imported as new or second hand vehicles, to comply with the relevant ADRs at the time of
manufacture and supply to the Australian market.
A Goods and Services Tax (GST, similar to VAT) of 10% is applied to all products and services sold in Australia.
The 10% GST is applicable to the entire landed cost of the goods,
i.e.- including insurance, shipping, etc. While the responsibility to pay GST to the Australian Taxation Office lies
with the supplier, the consumer ultimately bears the GST cost. The importer will pay the GST to the Australian
Customs Service (www.customs.gov.au).
Standards Australia (www.standards.org.au) is the nation’s peak non-government standards organization. The
Commonwealth Government put this organization in place to meet Australia’s need for contemporary,
internationally-aligned standards and related services.
Trade Events
AAAE
Melbourne, May 12-14, 2011
This will be the Inaugural Year for the USA Pavilion at this newly Certified Trade Fair. Registration for the USA
Pavilion ends on February 28th, 2011. For more information: http://www.buyusa.gov/auto/aaae.html
Available Market Research
Australia: Performance and Racing Equipment (June 2009)
U.S. Commercial Service Contact Information
Name: Melanie Heskin
Position: Commercial Specialist - Automotive
Email: melanie.heskin@trade.gov
Phone: +61 39 526 5924
_____ ___________________________Automotive Resource Guide__________________________ 8
12. Austria
Capital: Vienna
Population: 8.2 million
GDP*: $373.9 billion
Currency: Euro
Language: German
Summary
Austria, with a population of 8.2 million, is one of the most densely motorized countries in the world: In the year
2009, 6.6 million motor vehicles were registered, of which over 4.4 million were passenger cars, 387.972 were
commercial vehicles and 9,599 were buses.
There are two important characteristics to note about the Austrian fleet: 1) diesel engines dominate the market,
powering around 75% of the passenger vehicles, and 2) there are very few U.S. vehicles on the road here; less
than two percent.
The average age of an Austrian car is 8.9 years, a figure that has been rising in recent years. The average
lifespan of an Austrian passenger vehicle is 12 to 15 years. The average distance driven per vehicle and year is
estimated at around 13.500 kilometers, a figure which has been falling over the past years.
Market Entry
We at CS Vienna can help you enter the Austrian market. Here are our tips:
1. Price. With the Euro still high against the Dollar; your prices might be hard for European manufacturers to
beat. Investigate current price points before moving forward.
2. Fit. Make sure that your products make sense for the cars that are on the road in Austria, and that you have
taken care of all the necessary safety and marking requirements.
3. The right partner. Find a reliable local distributor who serves your target customer base, and make sure that
communications, orders, and deliveries are trouble-free.
Current Market Trends
Current market trends in the commercial vehicle sector are centered on saving fuel and making the best possible
use of time and vehicle capacity. Some of the best prospects in this sector are plastic bumpers and cabin parts,
aluminium wheels, aerodynamic body parts and spoilers, fuel-saving tires, brake and transmission parts, and on-
board electronics.
Market trends in the passenger vehicle sector are more difficult to pinpoint, but also tend toward smaller, lighter
vehicles and increasing fuel efficiency. Best prospects include aluminium wheels, fuel-saving tires, brake and
transmission parts, and on-board electronics, including navigation, theft, and entertainment systems.
Main Competitors
Most of the vehicles on the road in Austria are European. Market leaders in the private passenger vehicle sector
are VW, Ford (Germany), and Opel. Market leaders in the heavy duty sector are MAN, Mercedes and Volvo.
European (and especially German) producers hold the lion’s share of the Austrian automotive aftermarket. Here
is a list of some of the most successful companies according to product; the production location is in parenthesis:
1. Brakes, servo breaks and parts: TRW (USA), Honeywell (Germany), Brembo (Italy)
2. Gear boxes: ZF Friedrichshafen AG (Germany)
3. Clutches: Sachs (Germany), LUK (Germany)
4. Shock absorbers: Monroe (Belgium) [part of Tenneco], Sachs (Germany), Bilstein (Germany)
5. Mufflers & Exhaust Pipes: Woka (Belgium) [part of Tenneco) Bosal (Holland)
6. Body Parts: Vanwezel (Belgium)
7. Drive axles: GKN-Spidan (U.K.)
_____ ___________________________Automotive Resource Guide__________________________ 9
13. Current Demand
Demand for new automobiles has been stagnating over the past several years, culminating in a dramatic fall in
the last quarter of 2008. The rebate for retiring older vehicles offered by the government has worked to revive
new car registration numbers. However, the global recession is taking its toll on the Austrian automotive sector.
The fact that older cars are remaining in use even longer has certain positive implications for the aftermarket,
including boosting demand for brake and steering parts, as well as transmission parts and tires.
Barriers
The two most important market access issues for U.S. products have nothing to do with customs or duties or
taxes, but with marking and safety testing requirements, and the Austrian vehicle code. The question of marking
and safety testing is a complex one. In a nutshell, there are three categories of
products: 1) those for which a European law or directive has established a
harmonized minimum standard, 2) those for which there is no European standard and
thus by default the national standards apply, and 3) those for which no European or
national minimum requirements apply at all. For the supplier, the trick is figuring out
which category his product falls into. Products that do not fall within the scope of a
European standard must meet Austrian national standards. As a general rule,
Austrian standards are higher than European standards. This category of product is
the most difficult to get certified, partly because the most difficult to standardize
products are “left over” and have not yet been harmonized, and partly because the
Austrian bureaucracy is characterized by a frustrating lack of transparency.
Trade Events
Name of event: Autozum
Location: Salzburg
English language website: http://www.autozum.at/en/index.html
Description: Autozum is Austria’s only significant automotive aftermarket trade event, taking place every second
year in Salzburg. The next show is planned for January 2011.
Available Market Research
Commercial and Heavy Duty Vehicles (2008)
U.S. Commercial Service Contact Information
Name: Marta Haustein
Position: Commercial Specialist
Email: marta.haustein@trade.gov
Phone: +43-131-339-2205
_____ ___________________________Automotive Resource Guide__________________________ 10
14. Belgium
Capital: Brussels (Bruxelles, Brussel)
Population: 10.3 million
GDP per capita: $36,265
Currency: Euro since January 1999
Languages: Dutch/French/German
Summary
The Belgian car industry has always been one of the main drivers of the national economy. While more than six
million vehicles (roughly one car for every two Belgians) are registered in Belgium with more than 500,000 new
registrations every year, Belgium represents a small market relative to the US. The most important consideration
for American exporters to keep in mind in creating auto-related goods for the European market is that the design
must fit European specifications and style.
Consideration must also be given to the size and structure of vendors in the market. Sales volumes and freight
terms often required by American suppliers can be obstacles to entering the Belgian market.
Belgium is often considered the home base of assemblers, manufacturers and importers of vehicles. Thanks to its
“open economy,” almost all foreign car makers are represented in Belgium. On an annual basis, about one million
cars and 90,000 commercial vehicles, buses and coaches are assembled in Belgium. The country’s assembly
industry includes Ford, Opel, Volvo and Audi and employs 60,000 direct employees. This production is valued at
$14.1 billion. In addition, more than 260 automotive suppliers employ 25,000 people. These companies are
active in industrial production, logistics, engineering, R&D, ICT, services, etc.
Current Market Trends
The Belgian car market has grown at a steady rate in the past 10 years. According to the Belgian Federal
Government there were 5.16 million cars in 2009, compared to 5.06 million the year before. This is an increase of
1.8%; 2006 saw an increase of 1.44 percent. Households average two-three cars each and family members are
spending more time in their cars, between commuting and vacationing, amounting to about one hour per day.
Overwhelmingly, Belgians prefer manual transmissions, which account for more than 90% of cars sold. Belgians
also prefer engines that have a lower consumption rate. Higher fuel efficiency of diesel engines and the lower
cost of diesel fuel drive demand for diesel engines. Diesels now represent more than 60% of all vehicles in
Belgium.
The size of cars being purchased is diversifying. Small family cars remain the most popular type of car in Belgium
(24%), followed by station wagons (14.3%), and small urban cars (10.4%).
There are only a few late model U.S. vehicles on the roads in Belgium. This is due mainly to the high fuel
consumption of most American models and the lack of diesel versions. In some cases, professional car dealers,
as well as individuals, travel to the U.S. to buy sport utility vehicles (SUV’s) or pick-up trucks because of their
typical American look. However, those numbers are still marginal.
Main Competitors
Auto-related imports to Belgium come from Germany (42%), France (30%), and the United Kingdom (1%).
Because of import duties ranging between 5-10%, European manufacturers have a price advantage over U.S.-
based manufacturers.
There are few large Belgian brand names in the auto accessory market, but there are strong European players.
Belgians are more familiar with European brands, due to their historical presence. However, American brands
have a positive image in Belgium and representatives in the industry believe that American products can sell well,
and should be better represented.
Current Demand
Despite the economic crisis, the interest or willingness to buy new and innovative products is still present
although less important. The key to successful accessory sales is an understanding of the style and needs of the
European driver. The young drivers’ market, as well as the two-wheeled motor vehicle market, appears to have
the greatest potential for growth in accessories. In addition, demand for security systems is also high and
evolving.
_____ ___________________________Automotive Resource Guide__________________________ 11
15. Barriers
In order to sell products in the Belgian market, U.S. exporters must meet the CE mark requirements applicable to
their goods. The CE mark certifies that the products have met the EU health, safety, and environmental
requirements. Once a manufacturer has earned a CE mark (some can self-certify, others require certifying
agents), it may affix the CE mark to its product. The product may then be marketed throughout the EU. See
http://www.export.gov/cemark/doc_ce_mark_main.asp for more information.
Packaging must be translated into French, Dutch and German. Non-metric measuring units, poor translations
and/or graphics often insufficiently address European cultural differences. Typically, U.S. exporters can entirely
miss the point by using Canadian French translations for material used in France and Belgium. Therefore, both
the advertising material and the retail packaging should always be the responsibility of the local importer.
Trade Events
AUTOTECHNICA SHOW
Next event: May 2012
Blvd. de la Woluwe 46, Box 9
B-1200 Brussels, Belgium
Contact: Mr. Klaus Van Cauwenberghe
Tel. 32/2/778-6200
Fax. 32/2/778-6222
http://www.autotechnica.be
Tools Equipment Show
January 30-31, 2011
Contact: Mr. Klaus Van Cauwenberghe
Tel. 32/2/778-6200
Fax. 32/2/778-6222
http://www.tools-tools.be
This is the only show in Belgium for automotive parts, accessories and repair equipment.
Available Market Research
None currently available.
U.S. Commercial Service Contact Information
Name: Mr. Stephane P. Croigny
Position: Commercial Specialist
Email: stephane.croigny@trade.gov
Phone: +32 2 811 5086
_____ ___________________________Automotive Resource Guide__________________________ 12
16. Brazil
Capital: Brasília
Population: 191 million
GDP: 4.8%
Currency: Real
Language: Portuguese
Summary
For the Brazilian automotive industry, 2007 was a record-breaking year. The industry set an all-time high of 2.97
million cars, vans, buses, and trucks manufactured. Comprising 18 percent of the country's industrial production
and five percent of GDP, the growth in the auto industry contributed to Brazil's higher than expected GDP growth
of 5.4 percent last year. Local automakers predict production in 2008 will top 3.25 million vehicles and are
ramping up investments and hiring more workers to increase capacity.
Flex-fuel vehicles, which run on any combination of gasoline and ethanol, also broke records. Today, almost nine
out of ten new cars sold in the Brazilian market have flex-fuel engines. Brazil's stable macroeconomic picture,
higher household incomes, and readily available credit have stimulated domestic sales. However, Brazil's high
tax rate and rising wages for workers, as well as an appreciating currency, are areas of potential concern for the
industry.
Market Entry
The Brazilian government's five-year plan in 1956 to promote the country's industrialization led to the creation of
Brazil's modern auto industry. Fifty years later, Brazil is the world's seventh largest automobile manufacturer and
eighth largest consumer base for automobiles. The auto industry comprises approximately 18 percent of Brazil's
industrial output and accounts for five percent of GDP. Industry analysts expect Brazil this year to surpass
French production and the consumption levels of Great Britain and France.
Today, the Brazilian auto industry is a major driver of economic growth. Brazil is becoming an emerging market
leader for technology development because of its highly skilled and qualified engineers and relatively low labor
costs compared to developed countries. Brazil has the largest number of car assembly plants in the world,
manufacturing more than 30 brands. The auto sector has invested approximately $27.5 billion since 1994 to
expand plant and component manufacturing capacity and in new technology for developing new models.
Brazilian exports rose in value from $4 billion in 2002 to $13.2 billion in 2007. Globalization also has pushed the
industry to restructure its supply chain and product design processes. Innovative organizational designs, novel
production facility layouts, and efficient supply chain management make Brazil one of the most dynamic
automotive industries. General Motors (GM), Ford, Volkswagen, and Fiat all have flex-fuel development and
engineering facilities in Brazil. The Ford plant in Bahia and the GM plant in Rio Grande do Sul are considered the
most modern assembly plants in the world.
Current Market Trends
Sales of flex-fuel vehicles, which run on any combination of gasoline and ethanol, accounted for 85.6 percent of
new cars, or two million cars. In addition to flex-fuel vehicles, the GOB's policy of mandatory blending of gasoline
with 20 to 25 percent ethanol is also driving the success of Brazil's ethanol program. GM's Government Relations
Manager Pedro Bentancourt told Economic Officer that, as of March, 26 percent of the country's light vehicle fleet
is flex-fuel. This figure is expected to reach 50 percent by 2015 as heavy investments from the auto industry
have driven down the price of flex-fuel technology enabling manufacturers to offer these models at the same price
as gasoline-powered vehicles. Similarly, by mid-2008, the state of Sao Paulo expects to launch approximately 20
flex-fuel buses as an environmentally friendly pilot project.
Main Competitors
An increase in available credit, lower interest rates, and extended car loan maturities up to six years all
contributed to the boom in auto sales. Pablo Teruel from the Department of Statistics of the Brazilian Motor
Vehicle Manufacturers Association (ANFAVEA) told Economic officer that Brazil's rising employment and income
were partly responsible for sales expansion. Teruel also told Economic officer that he did not foresee any
changes for the sector from the Central Bank's capital requirements on leasing put in place in January because
auto companies finance their own leasing operations and therefore are not subject to the new reserve rules.
ANFAVEA is confident that auto sales will continue to grow. A major part of the nearly 86 percent growth in
_____ ___________________________Automotive Resource Guide__________________________ 13
17. leasing in 2007 went to the auto sector, and traditional financing for vehicles was also up 29 percent.ANFAVEA
reported that motor vehicle production (autos, trucks, and buses) and domestic and international sales all hit
record highs in 2007. Last year, the industry assembled 2.97 million cars, up 13.9 percent over 2006. Domestic
sales including imported vehicles climbed 27.8 percent, totaling 2.46 million. Imported vehicles accounted for
10.9 percent of total domestic sales. Fiat led Brazilian domestic market sales in 2007 with 523,180 cars, followed
by Volkswagen with 491,790, and GM with 444,904. At the end of 2007, the Brazilian automotive industry
employed 120,245 people, up 13.1 percent from 2006.
These upward trends have continued in early 2008. According to ANFAVEA's data for the first quarter of 2008,
total vehicle production was 783,000 cars, up 19.3 percent from the same period a year ago. Vehicle sales
reached 648,000, up 31.4 percent. At the end of March, the industry employed 124,200 people. According to a
recent local TV newscast, ANFAVEA President Jackson Schneider said that Brazil's auto industry is estimating
an output of approximately 3.2 million cars in 2008, up 8.9 percent from 2007.
Current Demand
Skyrocketing auto sales have left automakers unable to meet demand. Between February 2007 and March 2008,
auto companies were only able to meet 91.5 percent of demand. Schneider said at a press conference that the
wait for a new car is at least three months for some models, and as long as nine months for trucks. As a result,
automakers in Brazil have announced plans to invest USD 4.9 billion in 2008, more than double what they
invested in 2007 and also the largest amount they have ever allocated in one year. Brazilian subsidiaries of Fiat
and Ford have announced investments of USD 2.9 billion and USD 1.5 billion, respectively, through 2011.
Volkswagen's truck manufacturing division also confirmed USD 600 million in investments to expand production.
Most investments will be channeled to increase production capacity from 3.5 to 3.85 million cars this year and to
four million cars in 2009. Including Brazil's auto parts industry, total investments are expected to reach USD 20
billion by 2010.
The four largest auto manufacturers in Brazil, Fiat, Volkswagen, GM, and Ford, are hiring more workers to try to
meet the growing demand for new cars. GM has 22 percent of the Brazilian market and plans to hire 1,500
workers for its biggest plant in Sao Paulo, Brazil. GM Vice President in Brazil Jose Carlos Pinheiro Neto told the
press that first quarter sales exceeded expectations, climbing 30 percent to 117,687 cars. He said that the GM
plant in the Sao Paulo industrial region now has a total of 11,000 workers, which should help increase production
to 250,000 cars. GM also may invest USD one billion in Brazil and Argentina to introduce a new compact car.
Currently, Ford enjoys a stable market share of 12.5 percent and is ranked fourth in Brazilian auto sales. In the
first quarter of this year, Ford manufactured 37,854 cars, down 8.5 percent from the same period in 2007. Unlike
Ford Motor Company's global operations, Ford's Brazilian operations had registered profits until this year.
Barriers
Despite the booming domestic market, the appreciation of the Brazilian currency has reduced the auto industry's
global competitiveness. While the Brazilian auto industry broke records in 2007, total cars exported were down
6.6 percent from 2006. Pablo Teruel said that ANFAVEA does not anticipate export revenues this year to
surpass 2007. Nonetheless, export earnings in the first quarter of this year totaled USD 3.24 billion, up 13.1
percent compared to the same period a year ago. Although the Brazilian auto market is expected to set new
production and sales records this year, industry analysts point to Brazil's high tax burden, inadequate
infrastructure, and cumbersome bureaucracy, combined with the appreciation of the Brazilian currency, as
making Brazilian vehicles less competitive internationally. Several auto industry interlocutors told Economic
Officer that production costs in Argentina are lower and that Argentina is becoming an attractive alternative for
auto makers, especially given the duty-free access to the Brazilian market afforded to Mercosul countries.
Despite Argentina's current energy crisis, several automakers have announced investments in Argentina. For
example, Honda plans to invest USD 100 million to construct its first assembly plant in Argentina, both for the
Argentine market and as a platform to Brazil and Mexico. Fiat also announced plans to reactivate a plant in
Argentina that it had shut down in 2002. Renault also is examining the possibility of transferring production of its
low-end models to Argentina.
_____ ___________________________Automotive Resource Guide__________________________ 14
18. Trade Events
2010
RECAUFAIR TIRE SHOW - TIRE AND EQUIPMENT INTERNATIONAL FAIR AND CONVENTION
Expo Center Norte – Sao Paulo
http://www.recaufairpneushow.com.br
Available Market Research
South America Trade Show (2009)
U.S. Commercial Service Contact Information
Name: Teresa Wagner – Commercial Specialist in Sao Paulo
Position: U.S. Commercial Service Sao Paulo, Brazil
Email: teresa.wagner@trade.gov
Phone: 55/11/5186-7177
Name: Genard Burity – Commercial Specialist in Rio de Janeiro
Position: U.S. Commercial Service in Rio de Janeiro
Email: genard.burity@trade.gov
Phone: 55/21/3823-2401
Name: Mauricio Vasconcelos, Commercial Specialist in Belo Horizonte
Position: U.S. Commercial Service in Belo Horizonte
Email: mauricio.vasconcelos@trade.gov
Phone: 55/31/3213-1573
_____ ___________________________Automotive Resource Guide__________________________ 15
19. Bulgaria
Capital: Sofia
Population: 7.6 million
GDP*: 49.8 billion
Currency: Euro
Language: Bulgarian
Summary
In 2007, Bulgaria entered into the European Union and into the U.S. - EU trading relationship. The signing of the
U.S. - Bulgarian Defense Cooperation Agreement provided further evidence of the deepening of the strategic
political and military partnership between Bulgaria and the United States. Ratification of the Double Taxation
Treaty and introduction of flat 10% tax in 2008 contributed to further optimism in the future bilateral business
relations between both countries.
Current Market Trends
The new cars market in Bulgaria until 2009 demonstrated stable upward trend as of 1996.
In 2009 as in many other countries, the financial crisis hit badly this market. The number of new cars sold in 2009
declined to 26 813 which is almost 53.7% compared to the new cars sold in 2008 amounting to 57 927.
The market leader in 2009 was Toyota with 2820 cars sold which is 44.5% decline compared to 2008, followed by
Peugeot with 2263 new cars sold, 8.80% market share and decline of 45.4%. Third in ranking was VW with 2251
new cars sold, 8.76% market share and 52.5% decline. Fourth was Opel with 2191 new cars sold, 8.52% market
share and 59.9% decline. The only car brand with positive upward trend in sales was
Land Rover ,which sold 231 cars which was a 29.8% increase compared to the sales
in 2008.
Most seriously affected was the market for heavy duty and professional vehicles,
busses and vans. In 2009 this market declined by 73% compared to 2008. The
leader in this market segment for 2008 and 2009 remained Mercedes with total
number of sales 479 and the decline was 66.8%. The least shrinking market segment
in Bulgaria in 2009 was the motorcycles and ATV market, which declined only by 25.9% and amounts to 488 pcs.
For the first half of 2010 Toyota remained the top selling brand with 893 vehicles sold, which comprised 10.38%
of the total vehicles market share in Bulgaria. Next in the ranking list are Ford with 857 cars sold with 9.96%
market share, Peugeot with 788 cars sold with 9,16% market share and VW with 736 cars sold with 8.55%
market share. The last on the 10-companies’ list of best-selling car brands in 2010 is Opel with 476 cars sold and
5.53% market share. The market for heavy duty and professional vehicles in 2010 declined by another 29%
compared to 2009 amounting to 351 vs. 498 for the same period in 2009. The motorcycles market declined by
27.6% compared to 2009.
Almost 18% of the cars registered in Bulgaria are older than 10 years. Since 2000 Bulgarian families prefer to buy
cars not older than 10 years. Now almost 70% of Bulgarian families own a car and almost 80% of the firms with
business activities have motor pools, which depending on their activities, consists of cars, vans, minibuses, jeeps
and light trucks.
The automotive aftermarket and collision repair car business is one of the fastest growing in Bulgaria. The growth
in numbers of European cars will lead to a need for more sophisticated service and car body repair equipment,
both mechanical and electronic, paint products and application methods at an affordable price. The official
distributors of all new car models maintain warranty service and repair stations within their company structures.
The new, sophisticated electronic car equipment requires special analyzers, testers and experts to deal with it.
Best sales prospects include consumables, including oil and air filters, wiper blades, rubber blades, hoses,
gaskets and rings, engine parts, brake parts, exhaust system parts, car body parts, accessories such as wheel
covers, car/truck bed covers, car batteries, exterior accessory lights, auto security products such as alarms,
steering wheel locks, service equipment for electronic diagnosis, monitoring, testing and analyzing, wheel
balancing, tire changing, oil changing, battery chargers, quick repair kits, tools, paints and auto cosmetics.
_____ ___________________________Automotive Resource Guide__________________________ 16
20. Available Market Research
None currently available.
U.S. Commercial Service Contact Information
Name: Uliana Kanelli,
Position: Commercial Specialist
Phone: 359-2-939-5706
Email: uliana.kanelli@trade.gov
_____ ___________________________Automotive Resource Guide__________________________ 17
21. Canada
Capital: Ottawa
Population: 33.5 million (2009 estimate)
GDP*: $1.279 trillion (2009 estimate)
Currency: Canadian
Languages: English, French
Summary
Canada Motor Vehicle Sales 2008/2009 (Units)
2008 2009
Passenger vehicles* 894,506 747,671
Trucks* 779,639 737,185
Motorcycles** 89,390 64,087
Total Canadian Sales 1,763,535 1,548,943
* Source: Statistics Canada
** Source: Motorcycle and Moped Industry Council
Market Entry
Source: U.S. Census Bureau – U.S. International Trade Statistics
Exports to Canada Canada’s % of January 2008/2009 Change
for January 2009 World Totals (US (%)
($1,000) Exports)
Automobiles and Light Duty
Motor Vehicles, including
Chassis 287,035 21% -72%
Heavy Duty Trucks and Chassis 301,145 57% -40%
Motor Vehicle Parts 426,561 42% -46%
Motor Vehicle Gasoline Engines
and Engine Parts 158,940 61% -55%
Motor Vehicle Electric and
Electronic Equipment 73,706 33% -42%
Motor Vehicle Steering and
Suspension Components 26,950 55% -50%
Motor Vehicle Brake Systems 50,632 50% -38%
Motor Vehicle Transmissions
and Power Train Parts 124,580 57% -60%
Motorcycles, Bicycles, and Parts 32,471 22% -6%
After the United States, Canada represents the second largest automotive market in North America with more
than 1.64 million units sold in 2008. The inextricable relationship Canadian and U.S. production facilities have
forged over the years also makes Canada the largest industry trading partner for the United States. Despite the
North American automotive industry’s sharp decline in recent months, sales of new motor vehicles in Canada
rose 6.3 percent in March 2009 to 122,194 units: the largest monthly growth since January 2008. Further, the
number of new motor vehicles sold in March 2009 rose in all provinces with the most growth in Quebec, whose
sales rose 10.4 percent. For the month of March 2009, the U.S. Census Bureau calculated that roughly $660
_____ ___________________________Automotive Resource Guide__________________________ 18
22. million in automobile and light duty motor vehicles were exported to the Canadian market, representing 30
percent of total U.S. exports.
Main Competitors
While American automotive imports retain a majority in Canada, market trends indicate significant inroads for
Asian manufacturers – including aftermarket and component parts, in addition to passenger vehicles and trucks.
Current Demand
For the first quarter of 2009, monthly sales of new passenger vehicles in Canada indicate that the United States
lost approximately four percent of its market share to foreign competitors. Despite increased competition in the
passenger vehicle sector, the United States continued to maintain its dominance within the light and heavy-duty
truck market, retaining 85 percent of the Canadian market share.
Given the 50 million cars on Canada’s road and the maintenance they require, the best prospects in the
automotive sector for U.S. companies are in the aftermarket. In other words, while the auto sales market has
declined rapidly, the demand for maintenance continues to expand. Thus, the current slowdown in the auto sector
will not likely catch up to the aftermarket for a few years. Until then there will still be a strong demand for
aftermarket products and services.
On average, each car 12 years or older requires a minimum of $1000 in maintenance per year. This figure is
important because 43 percent of cars on Canadian roads are on average 15
years old. Much of the market is still in mechanically installed (MI) parts, but also
we are seeing a large increase in the Do-It-Yourself (DIY) purchases and
repairs.
The automotive aftermarket sector is the largest retail sector in Canada ahead of
clothing, food, furniture and pharmaceuticals. The sector encompasses
production, re-manufacturing, distribution and retailing of replacement parts,
tools, equipment, accessories, chemicals and production for fixing used cars.
The sector is estimated at over $19.35 billion.
The sector has been growing at a steady rate of 2-3 percent over the past four
years. This growth is expected to continue for a few more years despite the slowdown in the automotive market.
The Canadian market offers U.S. suppliers the best opportunities in this sector because of a strong trade
relationship and the largest market other than its own.
Trade Events
AutoMechanika Canada
Toronto
http://www.automechanikacanada.com
Automechanika is the only Canadian trade show showcasing North American aftermarket suppliers and retailers
(Automechanika replaced the Automotive Industries Association of Canada trade show).
Truck World: Canada’s National Truck Show
International Center, Toronto
www.truckworld.ca
Truck World is the annual meeting place for Canada’s truck industry. The show attracts new products, new ideas,
and new solutions within its 300,000 square feet of trucks, equipment and technology.
Ontario Transport Expo
Toronto
www.ote.ca
The Ontario Transport Expo is a trade show and conference that brings together buyers and sellers from the bus
transportation industry to facilitate the exploration of more efficient ways in which they can service their
transportation customers in the future.
Available Market Research
Automotive Aftermarket Parts and Accessories/Service Equipment (2008)
_____ ___________________________Automotive Resource Guide__________________________ 19
23. U.S. Commercial Service Contact Information
Name: Madellon Lopes
Position: Senior Commercial Specialist
Email : madellon.lopes@trade.gov
Phone: + 1-416-595-5412 x227
_____ ___________________________Automotive Resource Guide__________________________ 20
24. China
Capital: Beijing
Population: 1.336.580.459 (by Sep. 2 ,2010 )
GDP*: $5,263 billion (2010 estimate)
Currency: Yuan
Language: Mandarin
Summary
China is now the second largest automotive market in the world, trailing only the United States and Europe.
China has about 6000 automotive enterprises, which are scattered in five sectors: motor vehicle manufacturing,
vehicle refitting, motorcycle production, auto engine production, and auto parts manufacturing. This includes
approximately 100 OEMs, with 40 producing passenger vehicles, and over 4000 registered auto
parts/accessories companies. All tiers of the industry are being driven by the booming sales of the OEM sector.
Nearly 80% of the revenue for the auto parts and accessories market is through new vehicle sales. However,
revenue from after market is increasing rapidly.
Current Market Trends
Statistics shows that China manufactures 13.791 million vehicles in 2010, 48.30% increased from last year
and became the number one in the world regarding the volume in number. It is forecasted that this number
will reach 16.00 million in 2010.
Importation for parts and components recovered quickly from 2008 when this industry was really down. The
importation volume for the first half year of 2010 is USD 12.72 billion, 90.65% increase compared with same
period of last year. Among this, imported engine was 487,400 valued 1.3 billion, with 88.24% increase in
dollar; parts, components and frame was USD10.4 billion with 90.32% increase; tiers for car and motorcycle
is 0.185 billion with 62.79% increase; all the rest was 0.813 billion with 110% increase.
Market Entry
China’s fulfillment of WTO requirements has helped drive new vehicle sales. As of July 1, 2006, China fulfilled its
WTO requirements by lowering import tariffs for auto parts and accessories to 10% and import tariffs for new
automobiles to 25%. The reduction of tariffs on automotive parts and China’s agreement to eliminate local
content requirements after WTO entry has placed domestic automotive parts manufacturers in direct competition
with their international counterparts.
Shanghai and its surrounding provinces (Zhejiang, Jiangsu, and Anhui) are the centers for component
manufacturing, representing around 44% of national production. Shanghai is home to Shanghai General Motors,
Delphi, Visteon, and other notable American automotive companies and, as such, provides a good starting point
for U.S. automotive component exporters to begin to explore the Chinese market. Other major automotive
centers in China include Guangzhou (South China), Chongqing (West China), and Changchun (North China).
Current Demand
The main goals for automotive components, parts, and accessories manufacturers are to improve technology and
quality and to develop design capability. Most of the domestic automotive parts manufacturers’ R&D capabilities
are limited due to the small scale of
their operations and a shortage of capital as compared to international companies. In the next five years, the
Chinese Government will continue to encourage foreign investment in automotive component development and
manufacturing. In the meantime, there is a growing market for imports and American products are generally
highly regarded by Chinese customers.
_____ ___________________________Automotive Resource Guide__________________________ 21
25. Best prospects:
• Engines for motor vehicles and motorcycles;
• Auto and motorcycle casting blanks;
• Key automotive parts and components including disc-type breaking
assembly, drive axle assembly, automatic transmission box,, engine
admission supercharger, engine displacement control device, electric
servo steering system, viscous continuous shaft device (for four-
wheel drive), air shock absorber, air suspension frame, hydraulic
tappet, and compound meter;
• Auto electronic devices and instruments (including control systems
for engine, chassis and vehicle body);
• Fuel cell technology;
• Automotive accessories;
• After market products
The reductions in automobile tariffs will make it much more cost effective for U.S. firms to export finished vehicles
to China and reduced tariffs on parts will allow companies to import essential components that cannot currently
be found domestically. Additionally, as China’s restrictions on trading and distribution are reduced, American
companies are gaining the right to distribute most products, including automobiles and related parts, in any part of
China. Previously, foreign companies could only distribute parts to one interior destination in China and could not
ship or distribute products between cities without employing a Chinese freight company.
The Chinese government has launched the “National Projects of Electric Vehicles,” that encourages the
development of environmentally friendly automobiles. So a U.S. company possessing clean energy parts and
technologies will have more opportunities in the Chinese market.
Available Market Research
China: Auto Aftermarket (2009)
U.S. Commercial Service Contact Information
Name: Qiurong Zhang
Position: Commercial Assistant
Email: Qiurong.Zhang@trade.gov
Phone: +86-10+8529-6655
_____ ___________________________Automotive Resource Guide__________________________ 22
26. Colombia
Capital: Bogotá., D.C.
Population: 48.7 Million (e)
GDP*: $241,300 million
Currency: Peso, Colombiano
Language: Spanish
Summary
The automotive sector is the fourth most important industry in Colombia. The United States has traditionally been
Colombia’s major supplier of vehicles, automotive parts and accessories. This sector represented 8% of all
Colombian imports for the first semester of 2009. Colombia imported from the United States $11.3 billion
products in 2008.
After a sustained growth of 20% per year since 2001, the Colombian automotive sector has experienced a
significant setback in 2008. According to the Colombian Ministry of Commerce, Industry and Tourism, total sales
of this sector (local market and exports) dropped by 41% with a 40% drop for utility vehicles and trucks.
Domestic demand reduction and restrictions on Colombian exports to Venezuela and Equator were the major
factors.
In 2008, the Colombian local market experienced a 15% overall reduction. The Colombian ministry of
transportation imposed a reduction on truck licensing and a program to discard trucks over 20 years old until
2010. The output of this sector in the national industry lost 5%, from 41.5% in 2007 to 40% in 2008. A significant
factor was Venezuelan restrictions on imports from Colombia, reducing national exports to Venezuela by 64%,
which greatly affected the Colombian automotive industrial production and national employment rate.
In 2009, it was projected that sales of imported of vehicles would drop by 18% from 2008, from 139,554 units sold
in 2008 to 114,480 units in 2009. During the first quarter of 2009, the market remained stagnant, only tackling
large dealer inventories. The automotive sector is gaining pace and reacting more dynamically in the second
quarter of 2009, boosted by new production and assembly lines and a stronger demand for auto parts.
Market Entry
The following guidelines are recommended for Market Entry:
• Secure an agent, representative, or distributor in Colombia, which requires a contract that meets the
provisions of the Colombian Commercial Code.
• Focus on formality, personal relationships and trust when negotiating agreements and contracts.
• Perform direct marketing and personal visits to potential buyers supported by Internet communications,
printing and distribution of materials to prospective customers, which are essential.
• Keep good after-sales service arrangements, which are important in Colombia, not only in the original
buying decision, but also in maintaining the sales relationship.
• Consider the product’s quality, financing, and price, supported by extensive advertising campaigns, which
play an important role in a Colombians’ buying decision.
Current Market Trends
According to a 2009 market forecast by Econometria S.A., the Colombian market will sell 180,000 units in 2009,
or 18% below 2008 sales. On top of export restrictions to Venezuela, exports to Ecuador will basically be banned
as a result of Ecuadorian policies over politics with the Colombian Government. Venezuela and Ecuador are the
main destinations for Colombian automotive industry exports. This loss should affect the Colombian
unemployment rate as the sector generated 2.5% employment in 2008 and 2.6% of the industrial output.
Econometria S.A. concluded that production in 2009 would experience a 38% reduction from 2008. By May
2009, 14,146 new vehicles were sold against 14,500 units sold on average during the past six months, confirming
a downward trend in the market. The first quarter of 2009 showed a significant change in trends among imported
vehicles, local production (47%), and cars and utility vehicles (68%) breakdown compared to the respective
breakdown (46% and 69%) in 2008. Taxis, vans, and commercial vehicle sales were stable. In contrast,
merchandise vehicles sales dropped significantly during this time frame. During the first semester of 2009, 1,200
_____ ___________________________Automotive Resource Guide__________________________ 23
27. pick-ups and 600 freight vehicles were sold from 1,600 pick-ups and 1,000 freight vehicles sold during the second
quarter of 2008.
Main Competitors
Approximately 49 brands and some 249 models are found in the market. In 2008, the following motor vehicle
brands competed very actively in the Colombian import market: Chevrolet, Hyundai, Ford, Nissan, Skoda,
Mitsubishi, Volkswagen, Kia, Toyota, Peugeot, Renault, Daihatsu, Honda, Citroen, Dacia, International,BMW,
Mercedes-Benz, Dina, Renault, Kenworth, Mack, Dodge, Freightliner, Petteril, Audi, Agrale, Daihatsu, Samsung,
Subaru, Nissan, Isuzu, Hino and Volvo.
Current Demand
In general, the Colombian automotive parts and accessories sector reflects the economic state of the nation as
well as the motor vehicles manufacturing/assembly sector. About 38% of all Colombia’s exports feed the U.S.
market. Because of the 2008 global economic crisis and lower import demand from the United States,
Colombia’s economy has stalled in 2008 and during the first quarter of 2009. However, analysts expect an
improvement due to President Uribe’s economic policy, a stronger demand in China and Brazil for Colombian
products and services, higher raw materials value, and a favorable U.S. Colombian pesos exchange rate.
Barriers
Since 1990, Colombia has lowered and simplified its import tariffs. Import duties are quoted ad-valorem on the
Cost Insurance Freight value of shipments. All duties (with few exceptions) have been consolidated into four tariff
levels: a) 5 percent for raw materials, intermediate and capital goods not produced in Colombia, b) 10 percent
and 15 percent for goods in the above categories but produced and registered in Colombia, c) 20 percent for
finished consumer goods, and d) the exceptions, such as import duties for motor vehicles which remain at 35
percent, and some agricultural products which fall under a variable import duty system (price band).
These tariff levels are in line with Decision 370 of the Andean Community (formerly “Andean Pact”) Agreement,
which the governments of Bolivia, Colombia, Ecuador, Peru, and Venezuela approved in 1994. This Decision,
known as the Common External Tariff (CET), was adopted by Colombia in 1995 through Decree 205. Under
Decision 370, Andean Community countries assign a CET for imports coming from third countries, and while
gradually eliminating duties on products manufactured and imported from within the region. Venezuela left the
Andean Community in 2006, but indicated in 2007 that it may rejoin the Andean Community in the near future.
Trade Events
Name of event: Expopartes Trade Show
Location: Bogota, Colombia
English language website: N/A – Spanish Site http://www.asopartes.com/web/directorio/expopartes/
Description: This is an event that takes place every two years in Bogota, Colombia. This year it took place in June
2009; this is retail aftermarket source for parts, accessories and service equipment. Special show sections
include Machine Shop; Paint, Body & Equipment; Tool & Equipment; Medium & Heavy Duty Truck; SUV and
Vehicle Technology.
_____ ___________________________Automotive Resource Guide__________________________ 24
28. Available Market Research
Colombia Automotive Sector Overview (2009)
U.S. Commercial Service Contact Information
Name: Ricardo Roldan
Position: Commercial Assistant
Email: Ricardo.Roldan@trade.gov
Phone: 571-383-2731
_____ ___________________________Automotive Resource Guide__________________________ 25
29. Costa Rica
Capital: San José
Population: 4,509,290 (2009, CR Census Bureau)
GDP (PPP): $48 billion (2009 estimate)
Currency: Costa Rican colón (Exch. Rate 500-600 per 1 USD)
Language: Spanish
Summary
Total Market Size Total Local Productions Total Exports Total Imports Imports from the U.S.
(2009) (2009) (2009) (2009) (2009)
144.5 40 35.7 140.2 37.4
Data provided in US$ millions. The above statistics are based upon industry sources and are unofficial estimates.
https://www.hacienda.go.cr/msib21.
Local production is limited to small electrical and metal parts, batteries, electrical copper cable, hydraulic seals,
filters (air/gasoline), steel leaf springs, aluminium and steel wheels, windshields, carpets, hoses, mufflers, bus
bodies, and tires.
Total imports in this sector are expected to increase in 2010 by 2 percent over the previous year to about US$143
million.
Current Market Trends
The consensus within the local automotive parts industry is that despite the economic crisis that affected Costa Rica
during 2009, the sector is expected to grow at an annual rate of 2-4 percent from 2010-2012. The surge in imports of
used, low-cost vehicles from Asian countries during the last four years led to an increase in auto parts imports from
China and Korea, which reduced U.S. market share. As a result, industry sources indicate that the U.S. share of the
import market is expected to improve only slightly from 2010-2012. The U.S. market share for automotive parts for
2009 was estimated at 26.7 percent.
Main Competitors
Major U.S. competitors in this sector are Japan, South Korea, Brazil, Taiwan, and France.
Current Demand
Many of the cars in Costa Rican roads are imported as “used” from the United States, due to high taxes on new
cars. For that reason, Costa Rican importers of automotive parts and accessories purchase their products in the
U.S., although a significant portion of these items is not of U.S. origin.
According to several Costa Rican importers of automotive parts, good sales opportunities continue for virtually all
categories of products in this sector. High quality, durability, availability and an assortment of vehicle parts, fast
delivery, and favorable prices are the main factors for increasing U.S. sales of these products.
Under DR-CAFTA, U.S. suppliers should be well positioned to expand their market share for automotive parts.
CAFTA-DR better positions U.S. exporters to take advantage of this expanding market. Current import taxes for
automotive parts vary from 0 to 14 percent, depending on the product. Most of these import taxes will disappear
immediately with the approval of the CAFTA-DR approval.*
Resources
Costa Rican Association of Importers of Automotive Parts (AIPA): aipacr@racsa.co.cr
Costa Rican Importers of Used Vehicles –CCA: carballomotor@gmail.com
Costa Rican Association of Importers of Vehicles –AIVEMA: aivema@racsa.co.cr
Costa Rican Customs Directorate, Ministry of Finance: https://www.hacienda.go.cr/msib21
*U.S. Commercial Service, Senior Commercial Specialist – Victor.Cambronero@trade.gov
Available Market Research
Automotive: Parts/Accessories/Service, CAFTA-DR (Jul 2007)
_____ ___________________________Automotive Resource Guide__________________________ 26
30. U.S. Commercial Service Contact Information
Name: Roy Fernandez
Position: Commercial Assistant
Email: Roy,Fernandez@trade.gov
Phone: + 506 2519-2000
_____ ___________________________Automotive Resource Guide__________________________ 27
31. Croatia
Capital: Zagreb
Population: 4.43 million
GDP (2008): $69.34 billion
Currency: Croatian kuna
Language: Croatian
Summary
During the first 7 months of 2009, automobile sales in Croatia dropped by more than 48 percent. There were
29,999 newly registered personal vehicles, compared to 58,268 that were registered in the same period last year.
The total number of registered vehicles in Croatia is approximately 2 million, of which 1.5 million are personal
vehicles.
Current Market Trends
Opel is still the most popular car brand in Croatia, with 3,360 vehicles (an 11.2 percent market share) sold during
the first 7 months of 2009. It is followed by Volkswagen and Renault with 2.879 and 2.649 vehicles sold,
th
respectively. Ford is the highest-ranked U.S. car brand (1,326 vehicles sold; the 5 most popular car brand in
Croatia, primarily thanks to the Ford Focus).
The recession has hit the car imports pretty hard, affecting the used cars market as well. The only brands/models
that registered sales growth compared to last year were Lancia, Dacia and Mercedes Smart.
Almost 50 percent of the passenger vehicles registered in Croatia are older than 10 years. There is no data on
the spare parts market in Croatia, but an average private vehicle owner spends approximately $5,500 per year on
car-related expenses, which includes gas for 13,000 kilometers, highway tolls, registration, technical inspection,
maintenance and spares parts.
Trade Events
Zagreb Auto Show
March 18-28, 2010
Venue: Zagreb Fairgrounds
URL: http://www.zv.hr/sajmovi/163/index_en.html
In 2008, the Auto Show hosted 51 automobile brands (348 models) and 35 motorcycle brands
(180 models), with numerous premieres and concepts. It is probably the most popular show in Zagreb.
Available Market Research
2008-2009 Automotive Resource Guide
U.S. Commercial Service Contact Information
Name: Miroslav Nikolac
Position: Trade Specialist
Email: miroslav.nikolac@trade.gov
Phone: +385 1 661 2026
_____ ___________________________Automotive Resource Guide__________________________ 28
32. Czech Republic
Capital: Prague
Population: 10 million
GDP 2009: $180 billion
Currency: Czech Crown (CZK)
Language: Czech
Summary
Due to massive foreign direct investments in the last two decades, the Czech Republic has become the major car
manufacturer in the Central/Eastern European region (CEE). Leading Czech automotive companies are SKODA
AUTO/Volkswagen, Toyota-Peugeot-Citroen (TPCA), Hyundai, Tatra and Avia (trucks), Iveco and SOR (buses),
and Zetor (tractors). While in its entirety CEE’s automotive production has represented roughly 10% of global
personal car production and 5% of utility vehicle production, the Czech vehicle production is as follows below:
Production of Vehicles
2008 2009 1Q 2010
Skoda Auto / Volkswagen 603,981 627,722 165,612
Toyota-Peugeot-Citroen (TPCA) 324,289 331,631 88,963
Hyundai *) 12,050 114,664 41,233
Others 10,232 8,000 1,500
Total 948,128 1,074,017 295,808
Although the financial crisis hit the Czech automotive industry hard at the end of 2008, production of new
passenger cars rose to all-time-record high of 979,085 units in 2009. This is a 4.12 percent increase from 2008.
The Czech automotive industry capitalized on higher demand for cheaper and smaller cars in the European
Union, which car manufacturers in the Czech Republic specialize in. In addition to new car manufacturing,
production of automotive parts and components plays significant role and represents almost 50% of the sector.
This area was hit by the crisis the most and the market has faced severe reductions.
Market Entry
Excellent opportunities exist for U.S. automotive suppliers interested in selling parts to local auto plants or to the
aftermarket. However, tapping into local supply chains can be both a costly and time consuming process.
Finding a good local partner is the key to successful entry into the Czech market. The quickest way into the
market is to find a distributor with an existing distribution network which may welcome a new U.S. product that
supplements an existing line. The best distributors work closely with their foreign suppliers to develop strategies
tailored to the nuances of the local market, drawing on the distributor’s knowledge of local pricing strategies,
promotion techniques, and competition. In most cases, one distributor can provide coverage throughout the
entire country for a related line of products.
Larger U.S. firms might want to consider establishing joint manufacturing facilities in the Czech Republic to
provide Just-In-Time (JIT) inventory to large clients in the Czech Republic, or neighboring Germany, Poland, and
Slovakia.
The U.S. Commercial Service at the U.S. Embassy in Prague helps American companies explore business
opportunities here. Due to the importance of building person-to-person relationships in this market, we
recommend that U.S. executives visit Prague themselves, using the Commercial Service's Gold Key Service or
joining a trade mission. Executives may wish to combine their first visit to Prague with introductory visits to other
nearby countries in the Central European region, such as Slovakia, Poland, or Hungary. Please contact us for
more information.
Current Market Trends / Current Demand
SKODA AUTO’s goals are to produce 1 million cars in 2012 and to double its current production to 1.5 million by
the year 2018. Both TPCA and Hyundai have planned production increases in 2009. However, the ongoing crisis
has put all these plans on hold indefinitely.
_____ ___________________________Automotive Resource Guide__________________________ 29
33. Barriers
There are no trade restrictions on imports of cars and automotive components from the United States, other than
import duties. However, U.S. imports face strong competition from imports from the other European Union
countries since automotive components produced in the EU can be imported into the Czech Republic duty-free.
Import duties on automotive components have been generally low, ranging from 3.0% - 6.3%. Some foreign
auto-parts producers use this advantage and import components into the Czech Republic from their European
production sites.
American exporters must be aware that each new type of imported product is subject to certification for quality
and safety in conformity with the relevant EU regulations. The certification process requires that a sample from
the planned import batch of the product be tested and approved by a notified body anywhere in the EU.
Trade Events
AUTOTEC BRNO - INTERNATIONAL MOTOR SHOW
June 2011, Brno
Web: www.bvv.cz/autosalon, E-mail: autosalon@bvv.cz
Central Europe’s most prestigious automotive event for
years, AUTOTEC 2010, innovations in the production of
trucks and commercial vehicles, trailers, parts and service
technology. It is listed by O.I.C.A (the International
Organization of Car Producers) among major world
exhibitions.
Available Market Research
Automotive Sector Analysis (2010)
U.S. Commercial Service Contact Information
Name: Zdenek Svoboda
Position: Commercial Specialist
Email: Zdenek.Svoboda@trade.gov
Phone: +420 257 022 323
_____ ___________________________Automotive Resource Guide__________________________ 30
34. Denmark
Capital: Copenhagen
Population: 5,263,327 (2009 estimate) 5.5 million
GDP*: $344.49 billion
Currency: Danish Kronor DKK
Language: Danish
Summary
Due to heavy taxation on new vehicles (up to 180%), Denmark has traditionally had an older car fleet compared
to other Western European markets. The economic boom leading up to the financial crisis somewhat altered this
image, but consumers have once again grown reluctant to purchase new vehicles. Sales of new passenger
vehicles, light and heavy trucks have dropped dramatically over the past year by as much as 50-70%.
This pattern of an aging car fleet, however, provides opportunities for exporters of spare parts as well as
aftermarket accessories.
Market Entry
It is recommended that the Danish market be entered through a Danish or Nordic distributor who knows the
business environment and the distribution channels.
Current Market Trends
In April 2007, the Danish government introduced a change in the tariff system for automotives. Tariff rates were
changed in favor of environmentally friendly cars. This has lead to considerate discounts on cars that run more
miles per gallon, increasing the demand for these. Nothing indicates for this trend to lose pace. Diesel cars have,
due to a good mix of fuel efficiency and more powerful engine, become more popular in Denmark.
The industry expects a lot from electric cars, both new and fitted. New legislation is still in the making to make
these cars a real and economically viable option for the masses. However, many eco-friendly consumers will go
to great lengths to get their hands on an electric car, and exporters are trying to feed this demand.
Main Competitors
Denmark enjoys competition from the same brands as present in most of Europe, with brands from Asia, Europe
and the United States.
Within spare parts, OEM producers gain large profits. Aftermarket spare parts are also available and are sold
through some retail channels as well as directly from some repair shops.
American products are generally perceived well, and as they are often competitive they should have a chance on
the market.
Current Demand
Sales of new conventional vehicles are practically at a stand-still. This trend will end with the financial crisis.
The combination of very high disposable income and a very low Dollar rate lead to large imports of classic
American cars, trucks and motorcycles. Due to the current economic climate, there is now a heavy overflow of
these vehicles in the Danish market.
Considering the average age of Danish vehicles and the reluctance to purchase new cars there is an ongoing
demand for aftermarket products and services e.g. spare parts and accessories like ICS solutions.
American automotive products are generally perceived well and there are many opportunities for exporters of
high-quality, innovative and price competitive products and services.
_____ ___________________________Automotive Resource Guide__________________________ 31
35. Barriers
One of the benefits of working with a distributor in Denmark is their guidance through the potential maze of import
regulations. These regulations, whilst not overwhelming, can be a barrier if U.S. companies attempt the direct to
end-user route.
Import duty tariffs for vehicle equipment (not cars) are generally low and in-line with EU averages. Once cleared
by customs, goods may move freely within the EU. In addition to import duty, all goods are subject to a 25
percent VAT (Value Added Tax) calculated on the landed (c.i.f) cost plus the duty. VAT applies on a
nondiscriminatory basis to all goods, whether imported or locally produced.
Trade Events
No major trade shows in 2009. One large show has been cancelled due to current financial climate.
Name of event: Biler I Bella
Location: Copenhagen
English language website: www.bileribella.dk/ (Danish only)
Description: One of Denmark’s only major automotive trade shows. Bi-annual. Next show will be March 21-23
2010.
Available Market Research
No current research available
U.S. Commercial Service Contact Information
Name: Peter Strandby
Position: Commercial Specialist
Email: Peter.Strandby@trade.gov
Phone: (45) 3341 7117
_____ ___________________________Automotive Resource Guide__________________________ 32
36. Dominican Republic
Capital: Santo Domingo
Population: 9.5 million
GDP: $79.65 billion (2009 estimate, CIA World Factbook)
Currency: Dominican Peso
Language: Spanish
Summary
The Dominican Republic (D.R.) is completely dependent on imports of vehicles, automotive spare parts and
accessories. Domestic production of automotive spare parts is limited to batteries and only accounts for two
percent of the total market demand for this product. Japanese vehicles enjoy the most advantageous situation
and dominate the Dominican market in each segment. Financial considerations (price and long-term and low
financing terms), fuel-efficiency, availability of spare parts, quality and a good performance record are the key
factors taken in consideration by Dominicans when purchasing a vehicle.
Market Entry
The best way to introduce a foreign company in the Dominican market is thorough local importers and
distributors. The general import climate in the Dominican Republic is very favorable. The dollar exchange rate is
responsive to market forces and imports can obtain hard currency easily. There are no restrictions for
importation of vehicles and automotive products into the Dominican Republic. However, the law forbids the
importation of used vehicles that are older than five years.
The Dominican Republic - Central American Free Trade Agreement (DR-CAFTA) provides competitive
advantages to American exports to the Dominican Republic because the agreement allows significant reduction
of import duties. As a result of DR-CAFTA, American exports of automotive products to the Dominican Republic
have increased an average of 15 percent.
Main Competitors
Japanese and other Asian products account for most of the imports due to the significant car population
imported from Japan. However, the situation is shifting slowly because of DR-CAFTA. Now that American
vehicles are entering the market duty free, their presence is increasing and the demand for spare parts is also
increasing. Shorter delivery time due to proximity to the U.S. is another advantage for American products in this
market. In addition, the U.S. supplies approximately 75 percent of the total market for large passenger
transportation buses. Also, parts for European and Japanese brands often come through the United States. The
same must be said of the parts for Japanese brands manufactured in the United States.
Current Demand
The market for new automotive spare parts is expected to continue growing over
the next two years due to the DR-CAFTA, especially within the "universal" spare
parts subsector (those that can be used for any car brand: batteries, fuses,
filters, suspension shock absorbers, etc.). This is the best subsector for U.S.
automotive products and one of the best prospects for U.S. goods in the
Dominican market.
Another factor that contributes to a steady increase in the importation of
batteries (especially from U.S.) is their multi-usage. It is estimated that at least
25 percent of the imported batteries are being used in inverters. For years, the
Dominican Republic has suffered severe energy problems that lead to regular
blackouts. Every business has a back-up generator (sometimes two), and 35
percent of the Dominican private residences have an electrical inverter to help them cope with the energy
deficiency. Inverters use from two to twelve batteries depending on their capacity. There is also a significant
market for used automotive spare parts. Of this, 80 percent is dedicated to motor engines and transmissions.
Low incomes of the majority of Dominicans are one of the reasons why most car owners (especially those
dedicated to public transportation) are forced to buy used spare parts.
_____ ___________________________Automotive Resource Guide__________________________ 33
37. U.S. Commercial Service Contact Information
Name: Isolda Frias
Position: Commercial Advisor
Email: Isolda.Frias@trade.gov
Phone: 809 227-2121 ext. 226
_____ ___________________________Automotive Resource Guide__________________________ 34
38. Ecuador
Capital: Quito
Population: 14,257,281 (2010 estimate)
GDP*: $52.5 billion (2009)
GDP/capita: $8,280
Currency: US Dollar
Language: Spanish
Summary
Ecuadorian imports show that the United States continues to be the major source for automotive parts and
accessories in 2009. U.S. market share in the automotive sector has been on average 26% during the last five
years.
Current Market Trends
Imports of parts and accessories have closely followed the growth trends for
the Ecuadorian vehicle fleet over the years. Following this tendency, the
market for parts and accessories is set to grow in the future, and since the
vehicle fleet has an average age of nine years it is probable that parts and
accessories demand will tend to grow faster than the vehicle fleet.
Market Entry
The Ecuadorian market for automotive parts and accessories is complex due to the number and variety of the
participants. The easiest and fastest way U.S. firms can access to the Ecuadorian Market is through local
representatives (agents) or distributors. There are several automotive parts that require a standards certificate
issued by the Ecuadorian Standards Institute (INEN). In some instances it can be difficult to obtain this certificate;
mainly due to different requirements between the standards systems in both countries (i.e. an optional standard in
the U.S. can be mandatory in Ecuador).
Main Competitors
Competitors include Colombia, Brazil, Japan, as well as many Asian countries.
U.S. Commercial Service Contact Information
Name: Andres Gonzalez
Position: Commercial Specialist
Email: Andres.Gonzalez@trade.gov
Phone: +011 (593-2) 398-5000 EXT. 5394
_____ ___________________________Automotive Resource Guide__________________________ 35
39. El Salvador
Capital: San Salvador
Population: 5.8 million
GDP*: $21.1 billion (2009)
Currency: US Dollar
Language: Spanish
Summary
El Salvador is net importer of all type of vehicles and of almost all the related parts and accessories for their
performance/maintenance.
There are approximately 655,000 vehicles registered in the country. 49% of total registered vehicles are
concentrated in the Department of San Salvador.
The market for vehicles decreased by 60% in 2009, compared with 2008. In 2007 16,924 new cars were sold,
when in 2008 that number went down to 14,355, and in 2009 to 6,744. Regardless the fact that vehicle imports
decreased, when comparing total importation of parts from 2007 to 2008 there was a 17% increase in imports. In
2008, 30% of imported parts and accessories were of US origin.
Current Market Trends
The market for auto parts is divided in three: the private sector, the public transportation companies, and the
government. Auto repair shops have an important role in decision making for purchasing parts and accessories
for their clients in any of the above three categories of end users.
The private sector includes all the consumers that provide maintenance to their vehicles as well as private
companies that need their fleet working in the best shape possible. The public transportation companies own
6,680 buses, from which 1,604 have more than 15 years of intense public transportation service. Buses are old
and require repair in order to continue providing the much-needed service. All parts to keep the public
transportation fleet working are imported. According to the Vice Minister of Transportation, 80% of the Salvadoran
population uses this public transportation service.
For accessories “Tuning” is always on fashion and tuning followers exhibit their vehicles in San Salvador as well
as in the rest of country, by organizing tours to different cities called “Speedfests”. Additionally, the annual local
trade show called Auto Expo, to be held this year on November 2010, puts together all vehicle related sectors
and auto fanatics and presents to the general public the new auto trends and fashions. U.S. companies exhibit at
Auto Expo through their local authorized representative.
Another reason why this sector is an excellent business opportunity is that Salvadoran vehicles deteriorate faster
and need more parts in order to maintain active use. This is due to poor maintenance of streets, increasing traffic,
disorganized public transportation, use of old vehicles, and importation of used vehicles. Currently, 90% of used
vehicles purchased in El Salvador are imported from the United States and are bought directly from salvaged car
auctions to be repaired locally and then sold. These cars require continuous maintenance and replacement
services. Mechanic and repair shops purchase parts and accessories from local automobile parts importers, as
well as automotive equipment usually imported directly for use in their shops. In comparison to 2008, the demand
for used imported vehicles has decreased by 60%, mainly as a result of the current economic crisis.
There are four associations that represent the interests of the automotive sector: 1- Salvadoran Association of
Auto Parts Importers, 2- the Salvadoran Association of Distributors of Vehicles, 3- the Salvadoran Association of
Importers of Used Vehicles, and 4- Association of Auto Repair Shops.
Market Entry
Importers, distributors, and end users are receptive to U.S. auto parts and accessories due to the products’
quality and warranty, and geographic proximity. Nevertheless, the industry is extremely price oriented and this
means there is strong competition in sales of parts and accessories from other countries like China, Japan,
Taiwan, and Brazil.
Main Competitors
Chinese, Brazilian, Japanese and Korean parts are sold in the country.
_____ ___________________________Automotive Resource Guide__________________________ 36
40. Current Demand
There is no significant automotive parts and accessories production in the
Salvadoran economy and thus, almost all parts are imported. The U.S.
Central America Free Trade Agreement (CAFTA), implemented in El
Salvador on March 1, 2006, provides a broader opportunity for the U.S.
industry, since import tariffs for parts under SAC 8708 were automatically
reduced to zero after CAFTA implementation. For Vehicle Accessories under
SAC 8714, 57% of product categories already had 0% tariff and 14% of
product categories became 0% after having a 5% tariff. The remaining
product categories will be decreasing in tariff rates in the following 9 years. Also, American auto brands have
been steadily increasing their units in the market over the past several years, and spares are needed.
Salvadorans recognize the value of quality parts made in the U.S.
Available Market Research
Country Commercial Guide, Chapter 4: Leading Sectors for U.S. Export and Investment (2010)
U.S. Commercial Service Contact Information
Name: Cecilia Avila
Position: Commercial Assistant
Email: Cecilia.Avila@trade.gov
Phone: +503-2501-3227
_____ ___________________________Automotive Resource Guide__________________________ 37