This document contains information about an autocatalytic reaction presentation including:
1) Names and details of five students attending Sharif College of Engineering and Technology.
2) An introduction to autocatalytic reactions which increase in rate as the product forms until the reactant is consumed.
3) Examples of autocatalytic reactions including fermentation and exothermic combustion reactions.
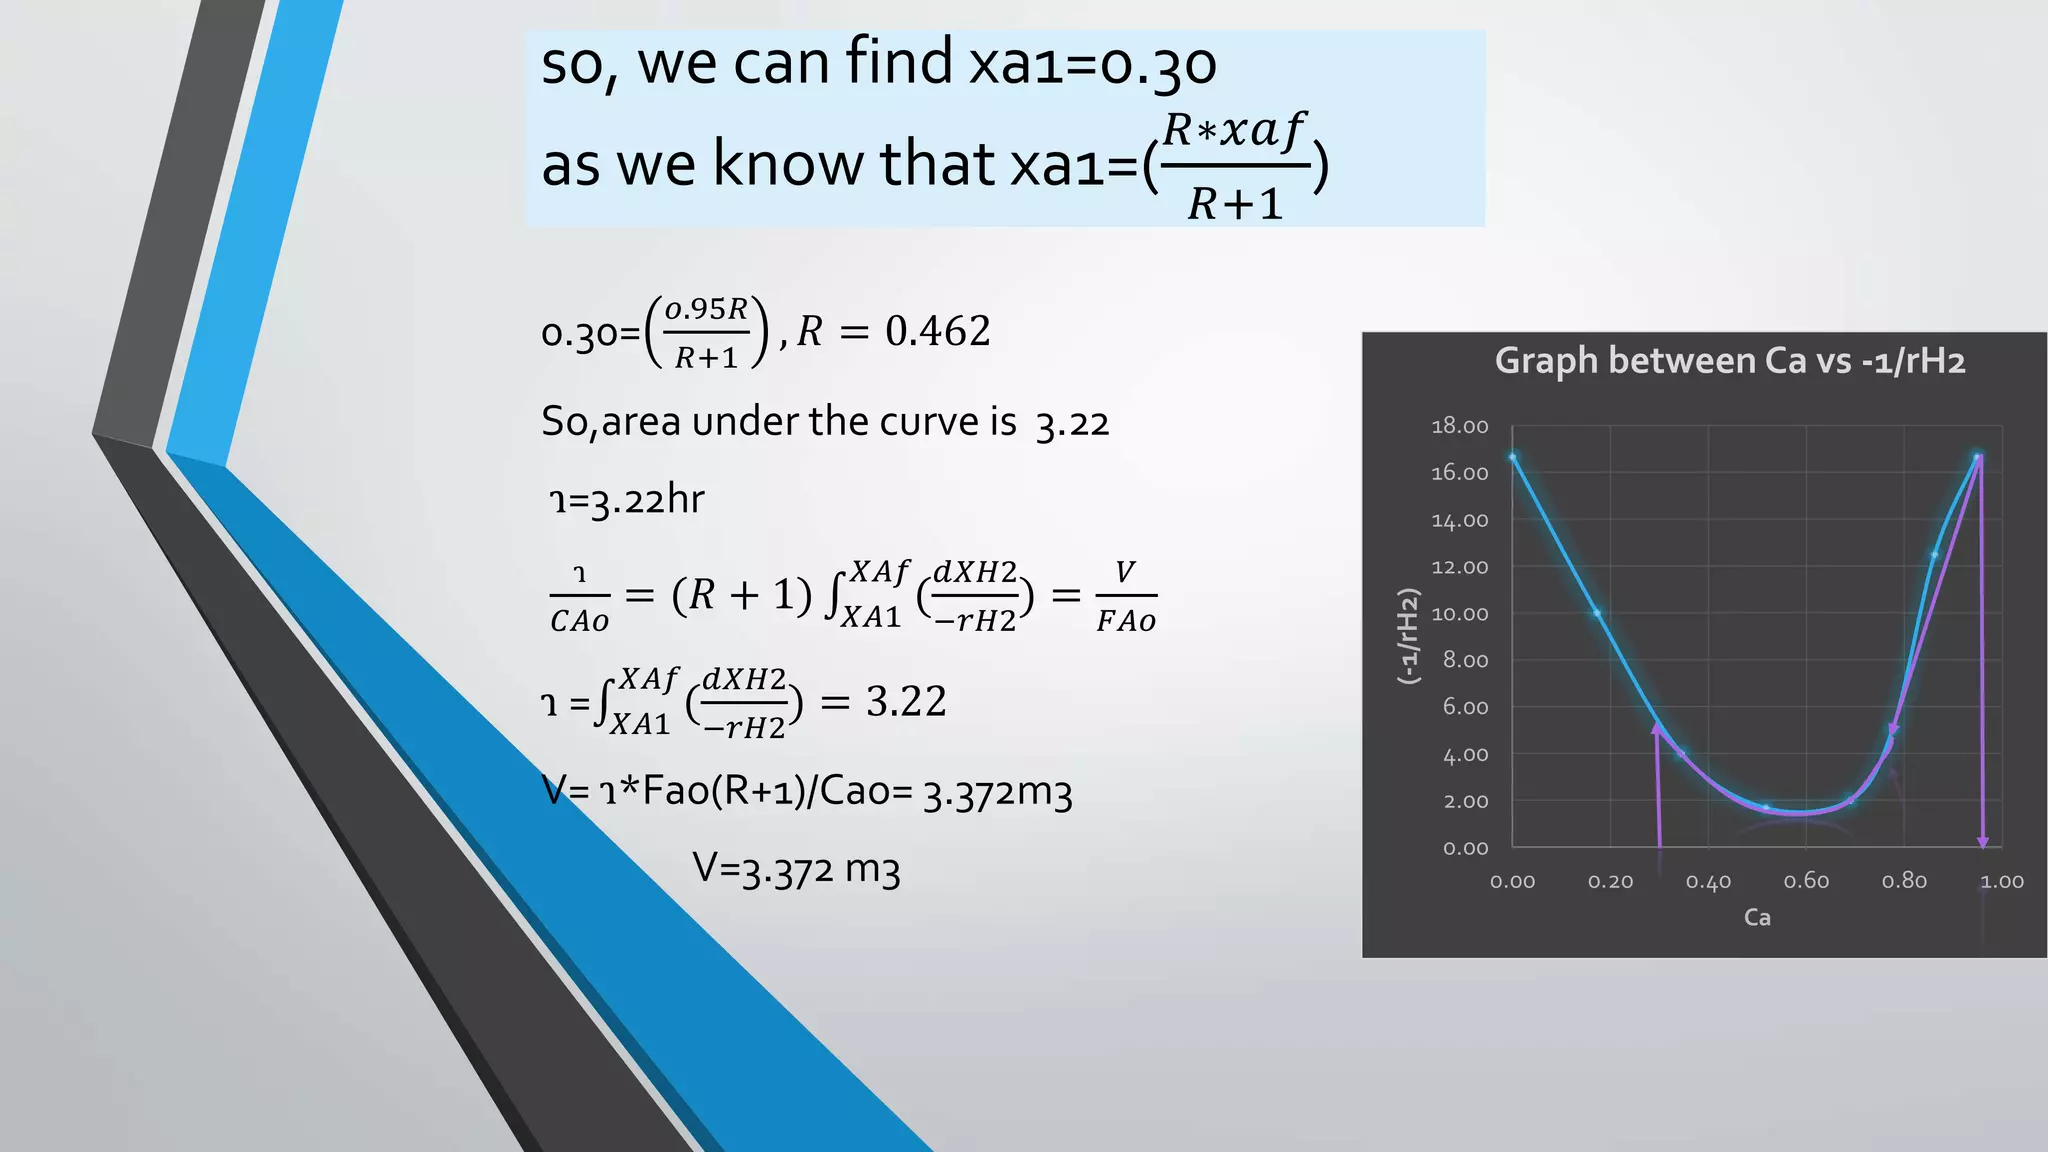
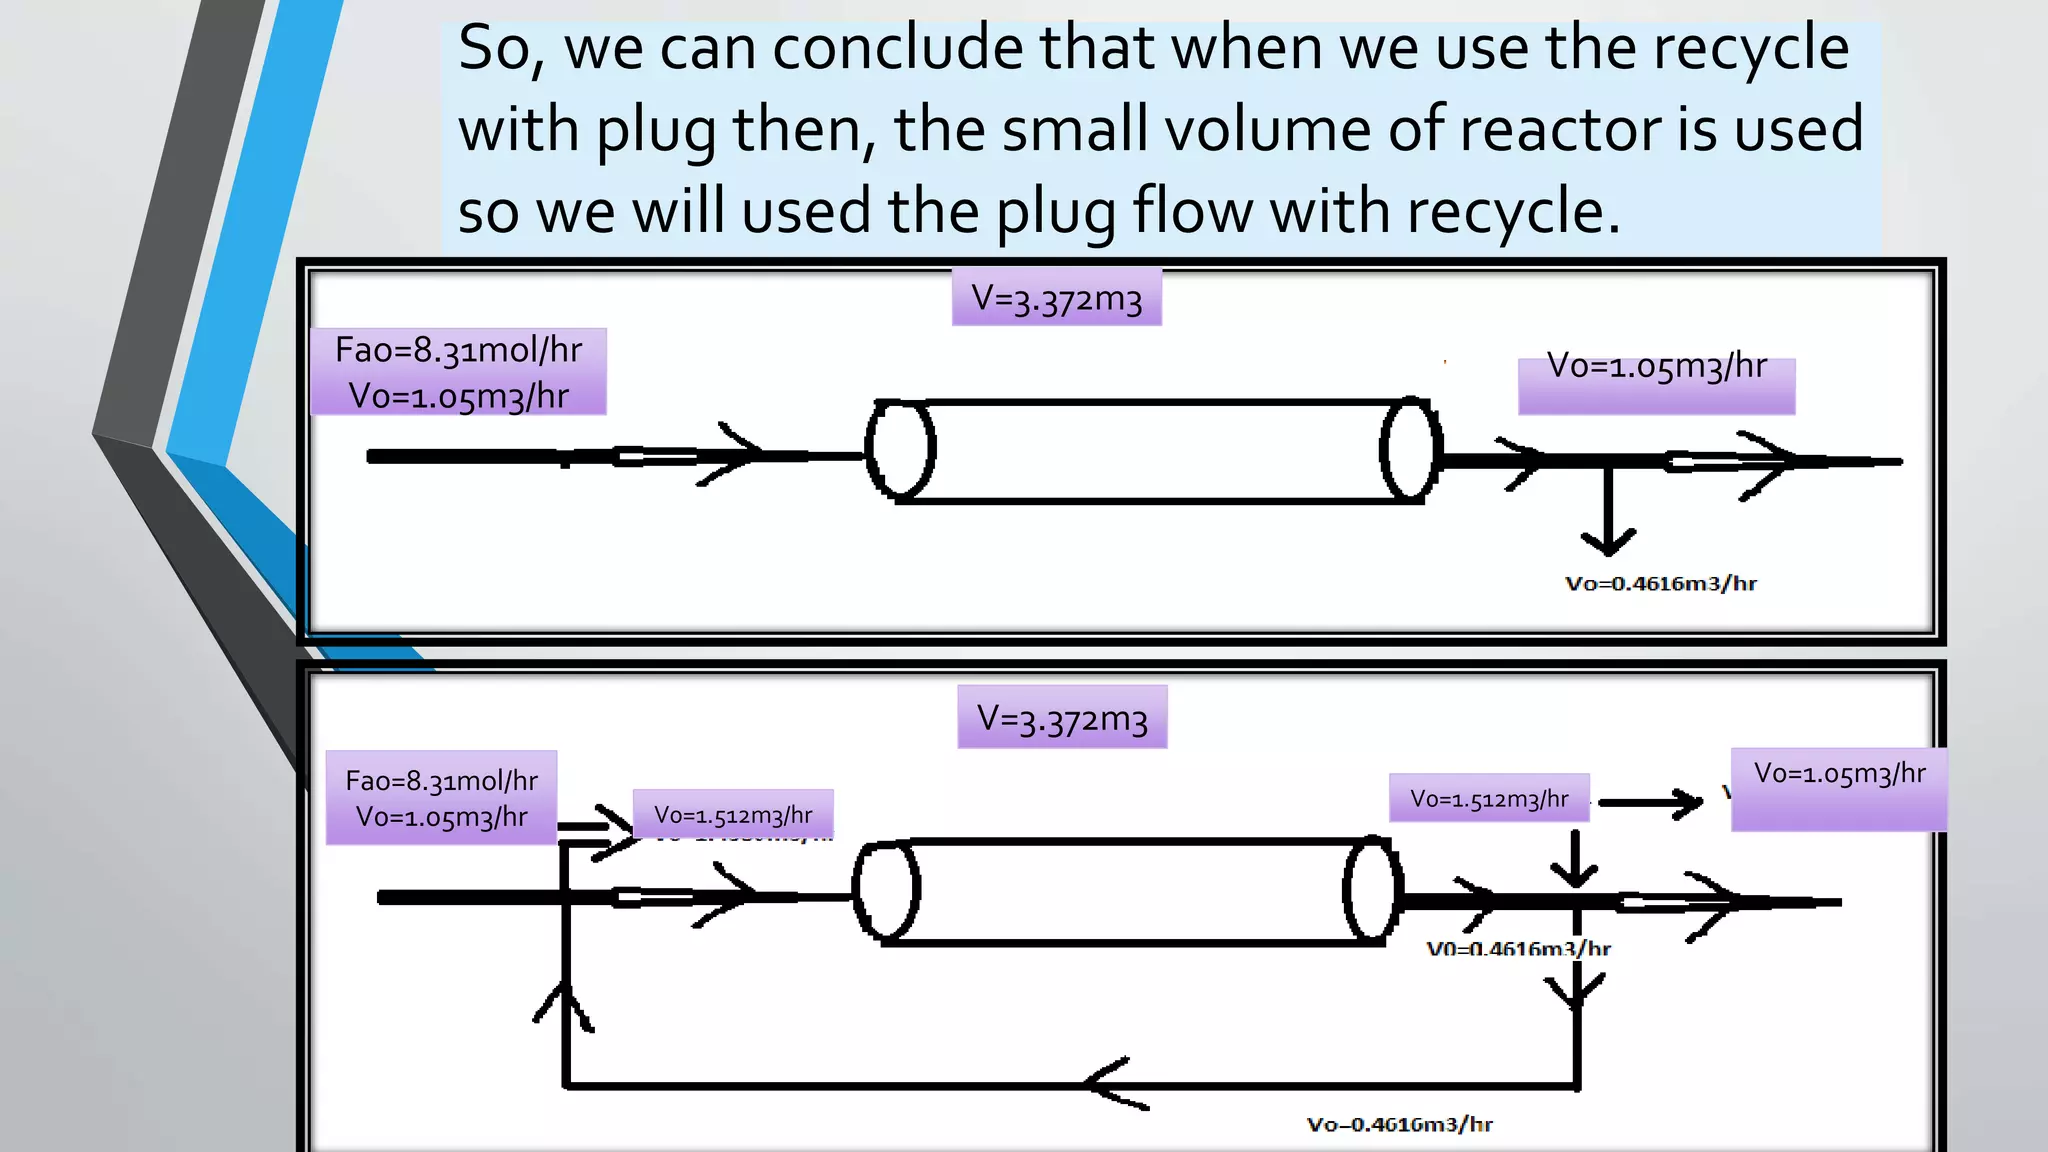
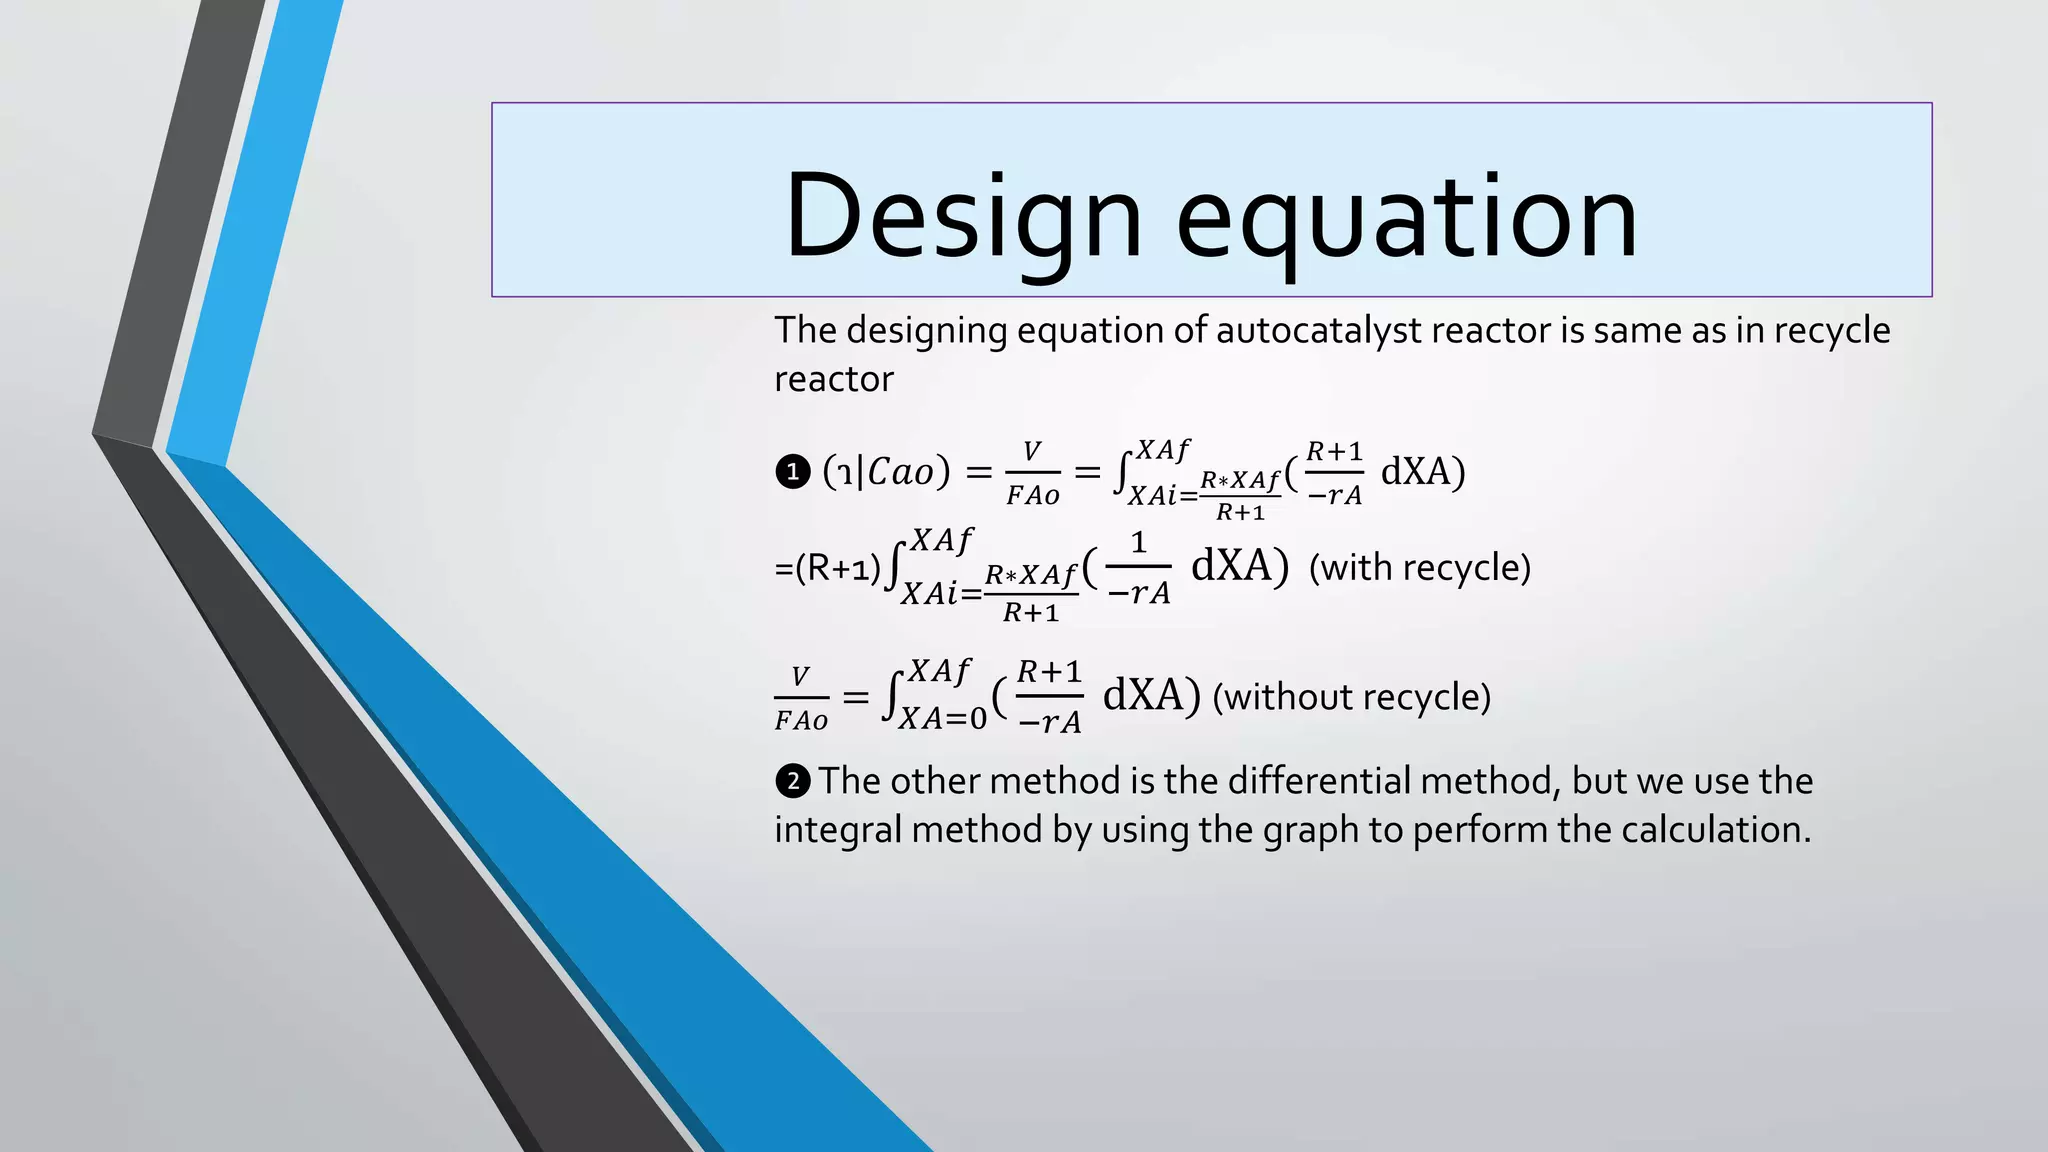
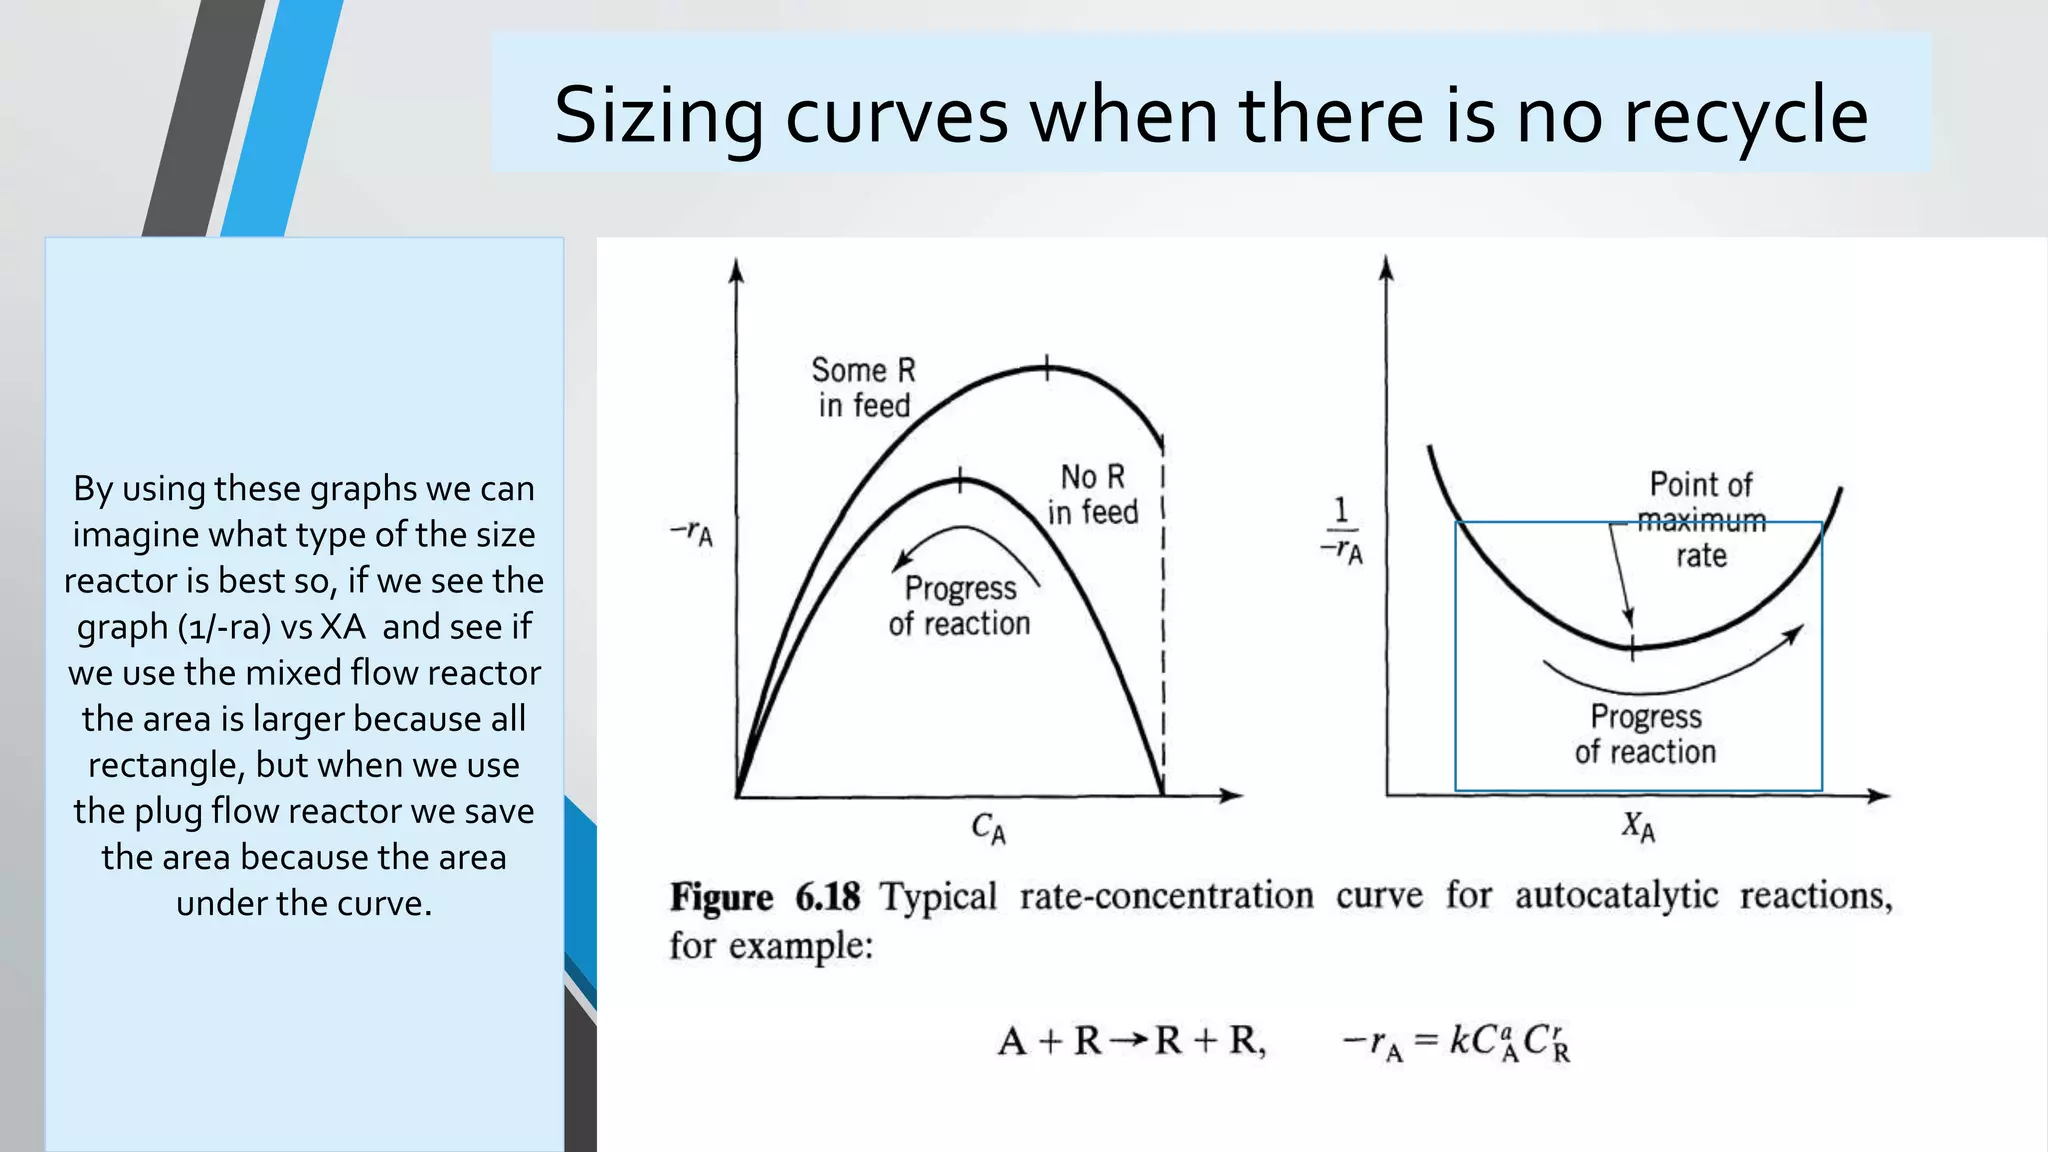
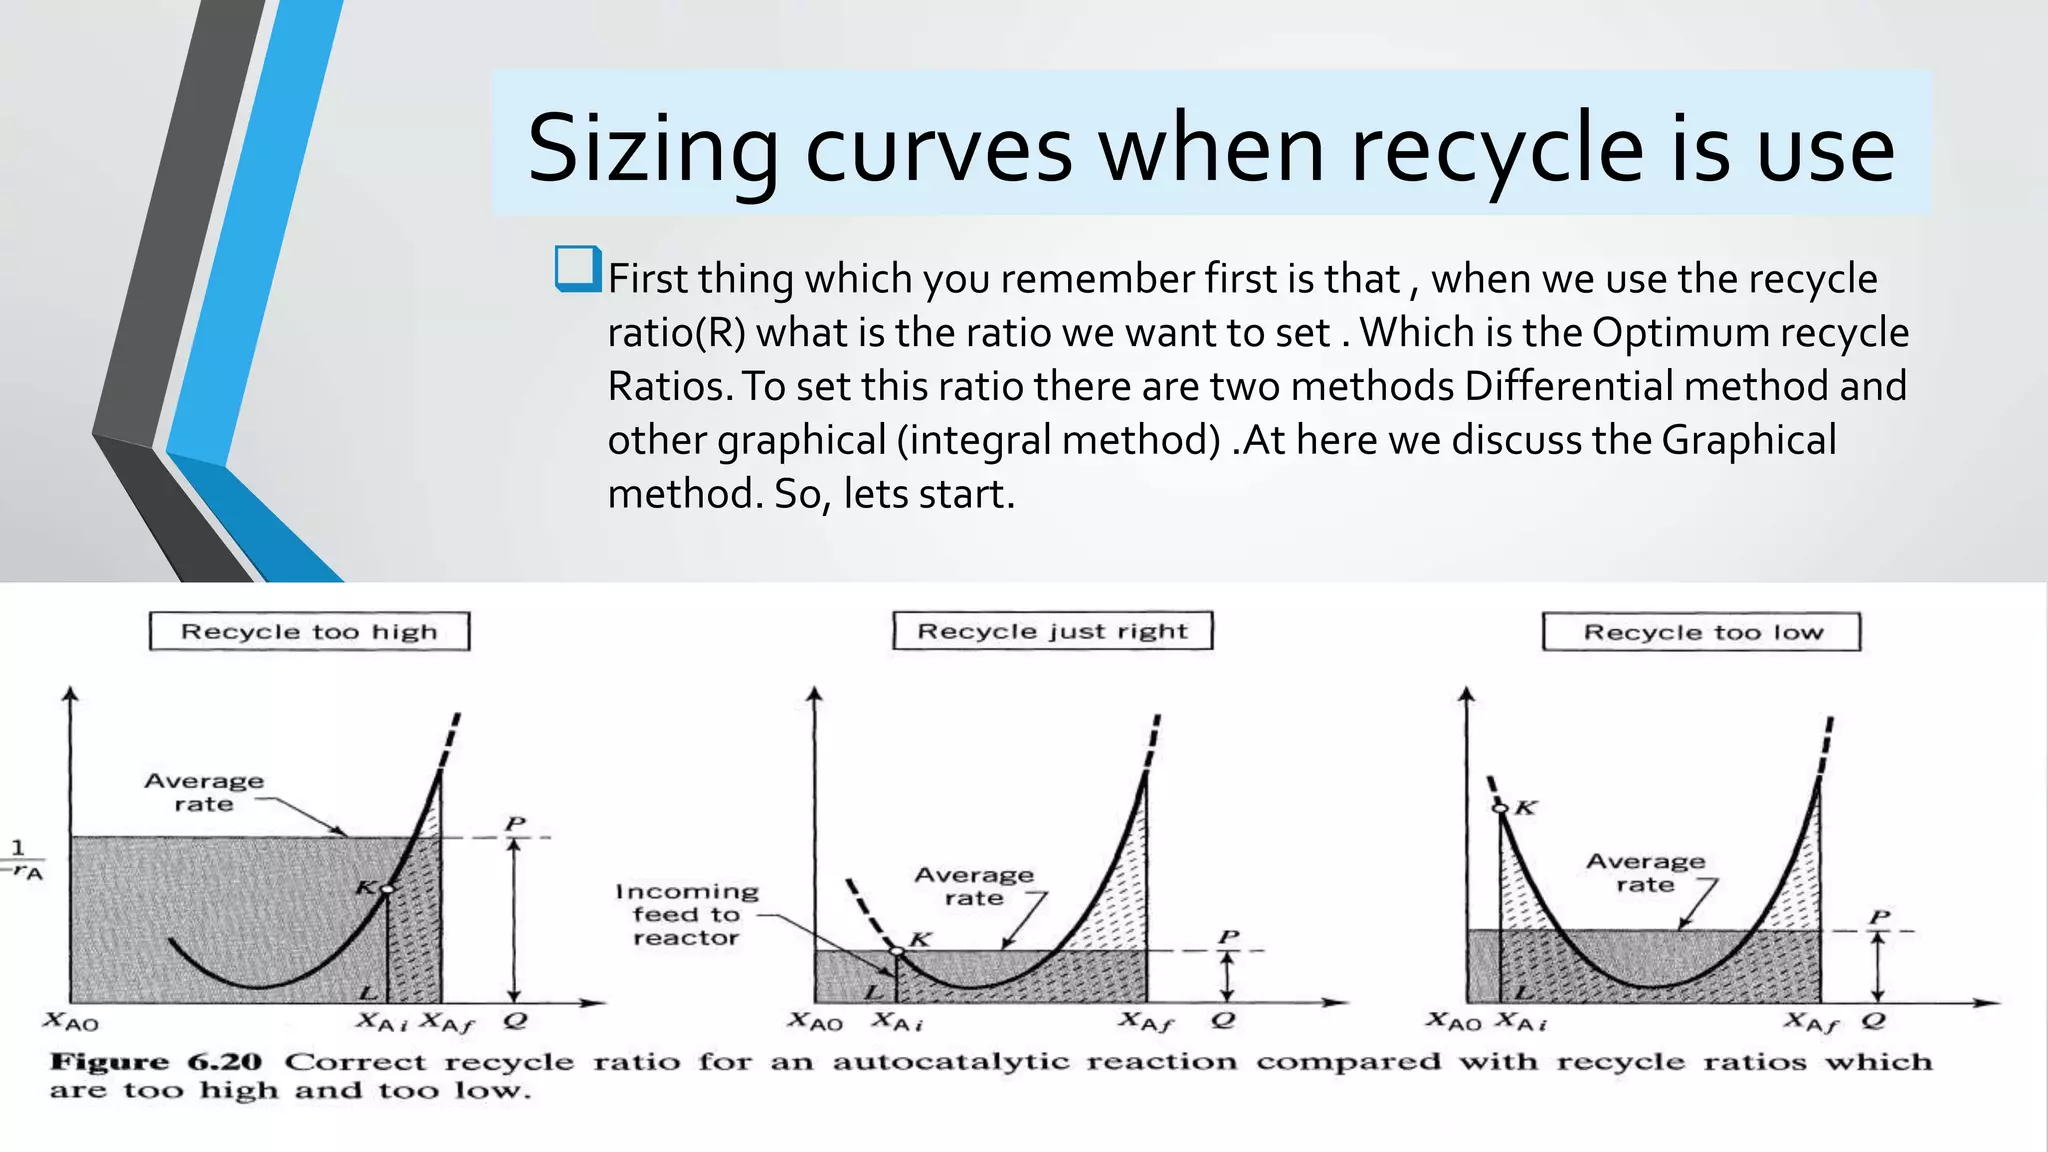
4) Design equations and methods for sizing autocatalytic reactors with and without recycle.


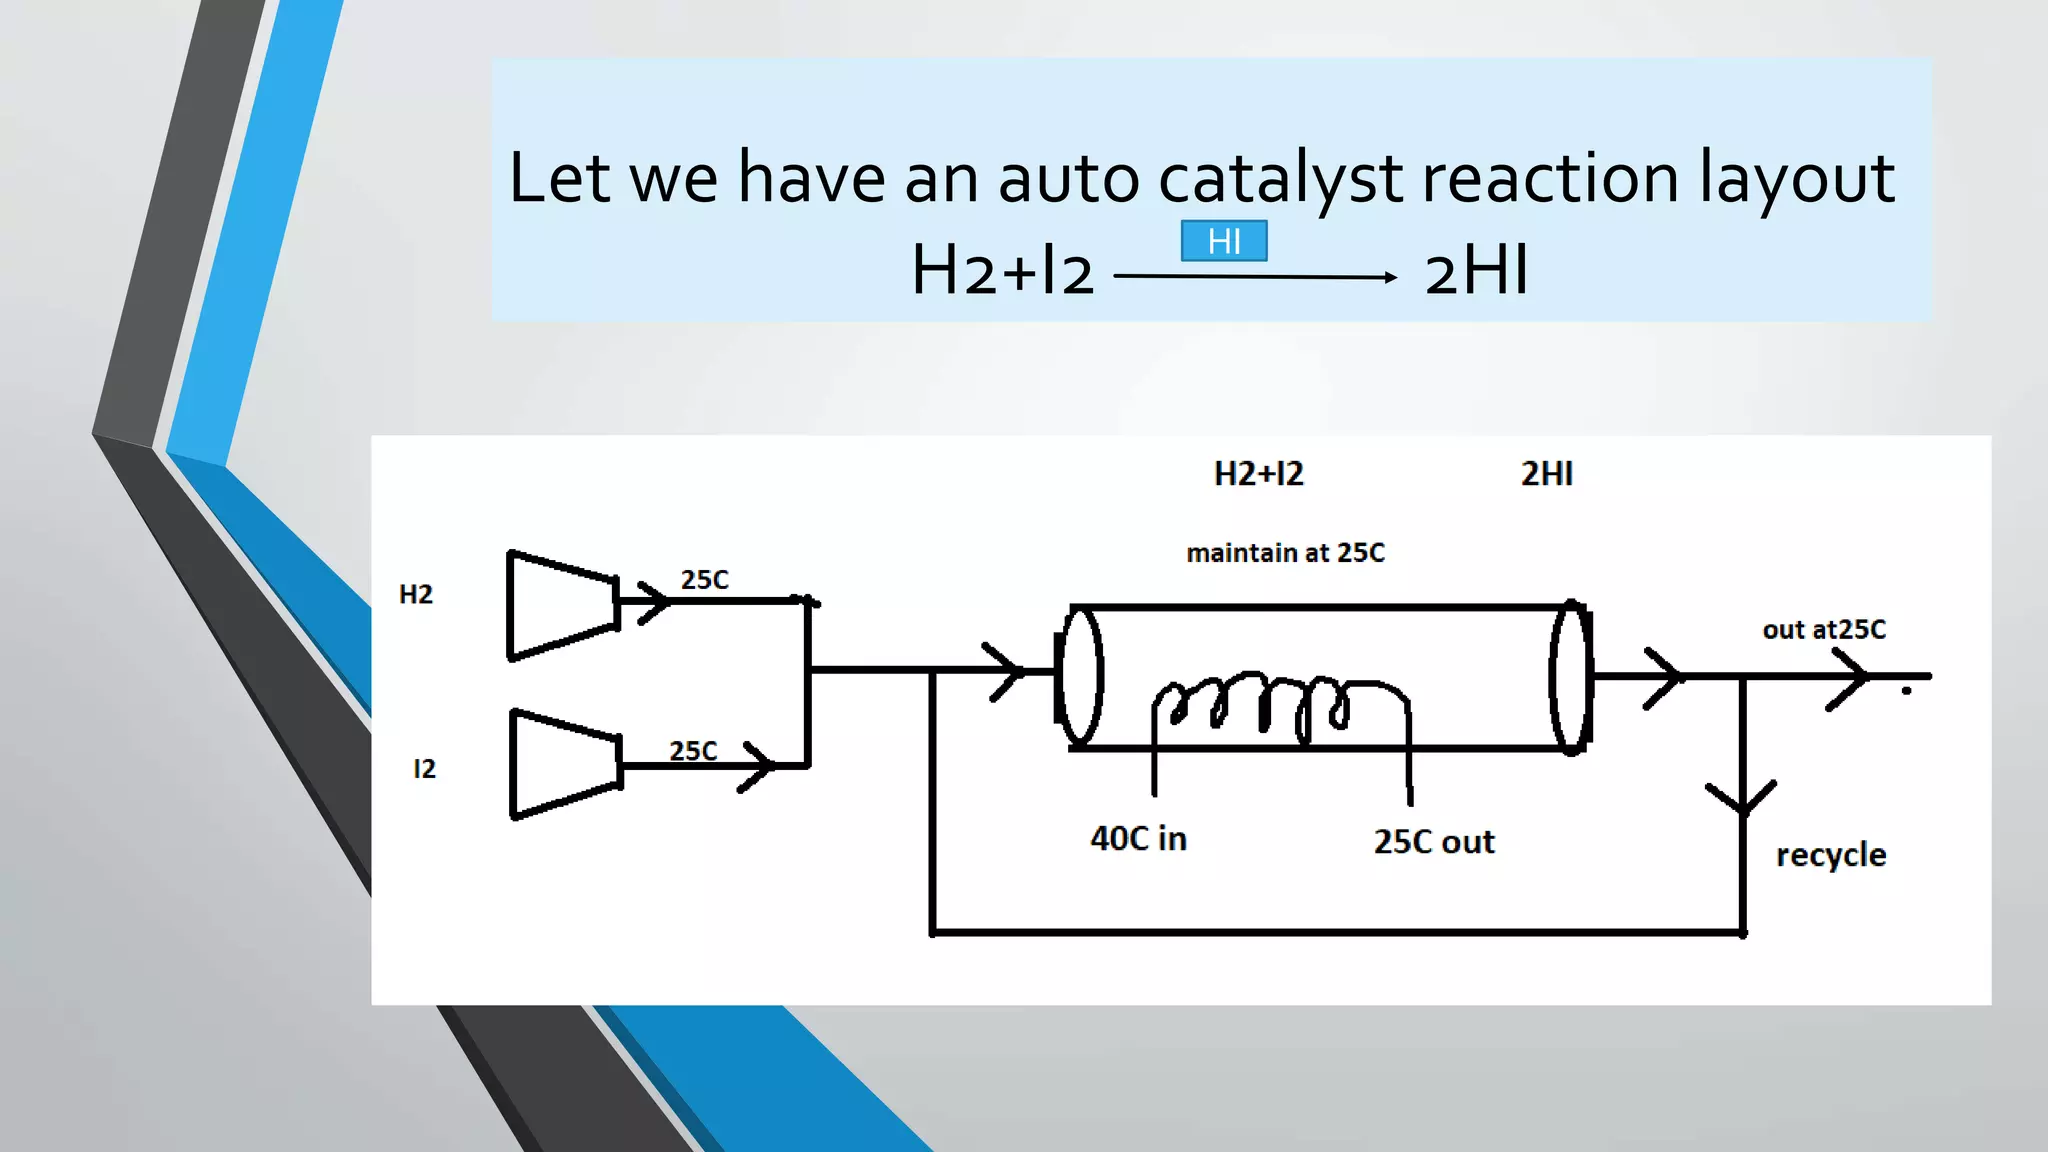
![This is the elementry gas phase autocatalytic
reaction
So we first find the (Ea)
Ea =
𝑃𝑟𝑜𝑑𝑢𝑐𝑡 −𝑟𝑒𝑐𝑡𝑎𝑛𝑡𝑠
𝑟𝑒𝑐𝑡𝑎𝑛𝑡𝑠
=
2−2
1
= 0
Rate if reaction for autocatalytic reaction
-rH2= K[H2]*[I2]*[HI]^2
When we study the kinetics and calculate the values ,so we can see the
value of Ca and rate (-rH2) the table is given below.](https://image.slidesharecdn.com/autocatalyticreactionspresentation-190327122347/75/Auto-catalytic-reactions-presentation-10-2048.jpg)