Download to read offline
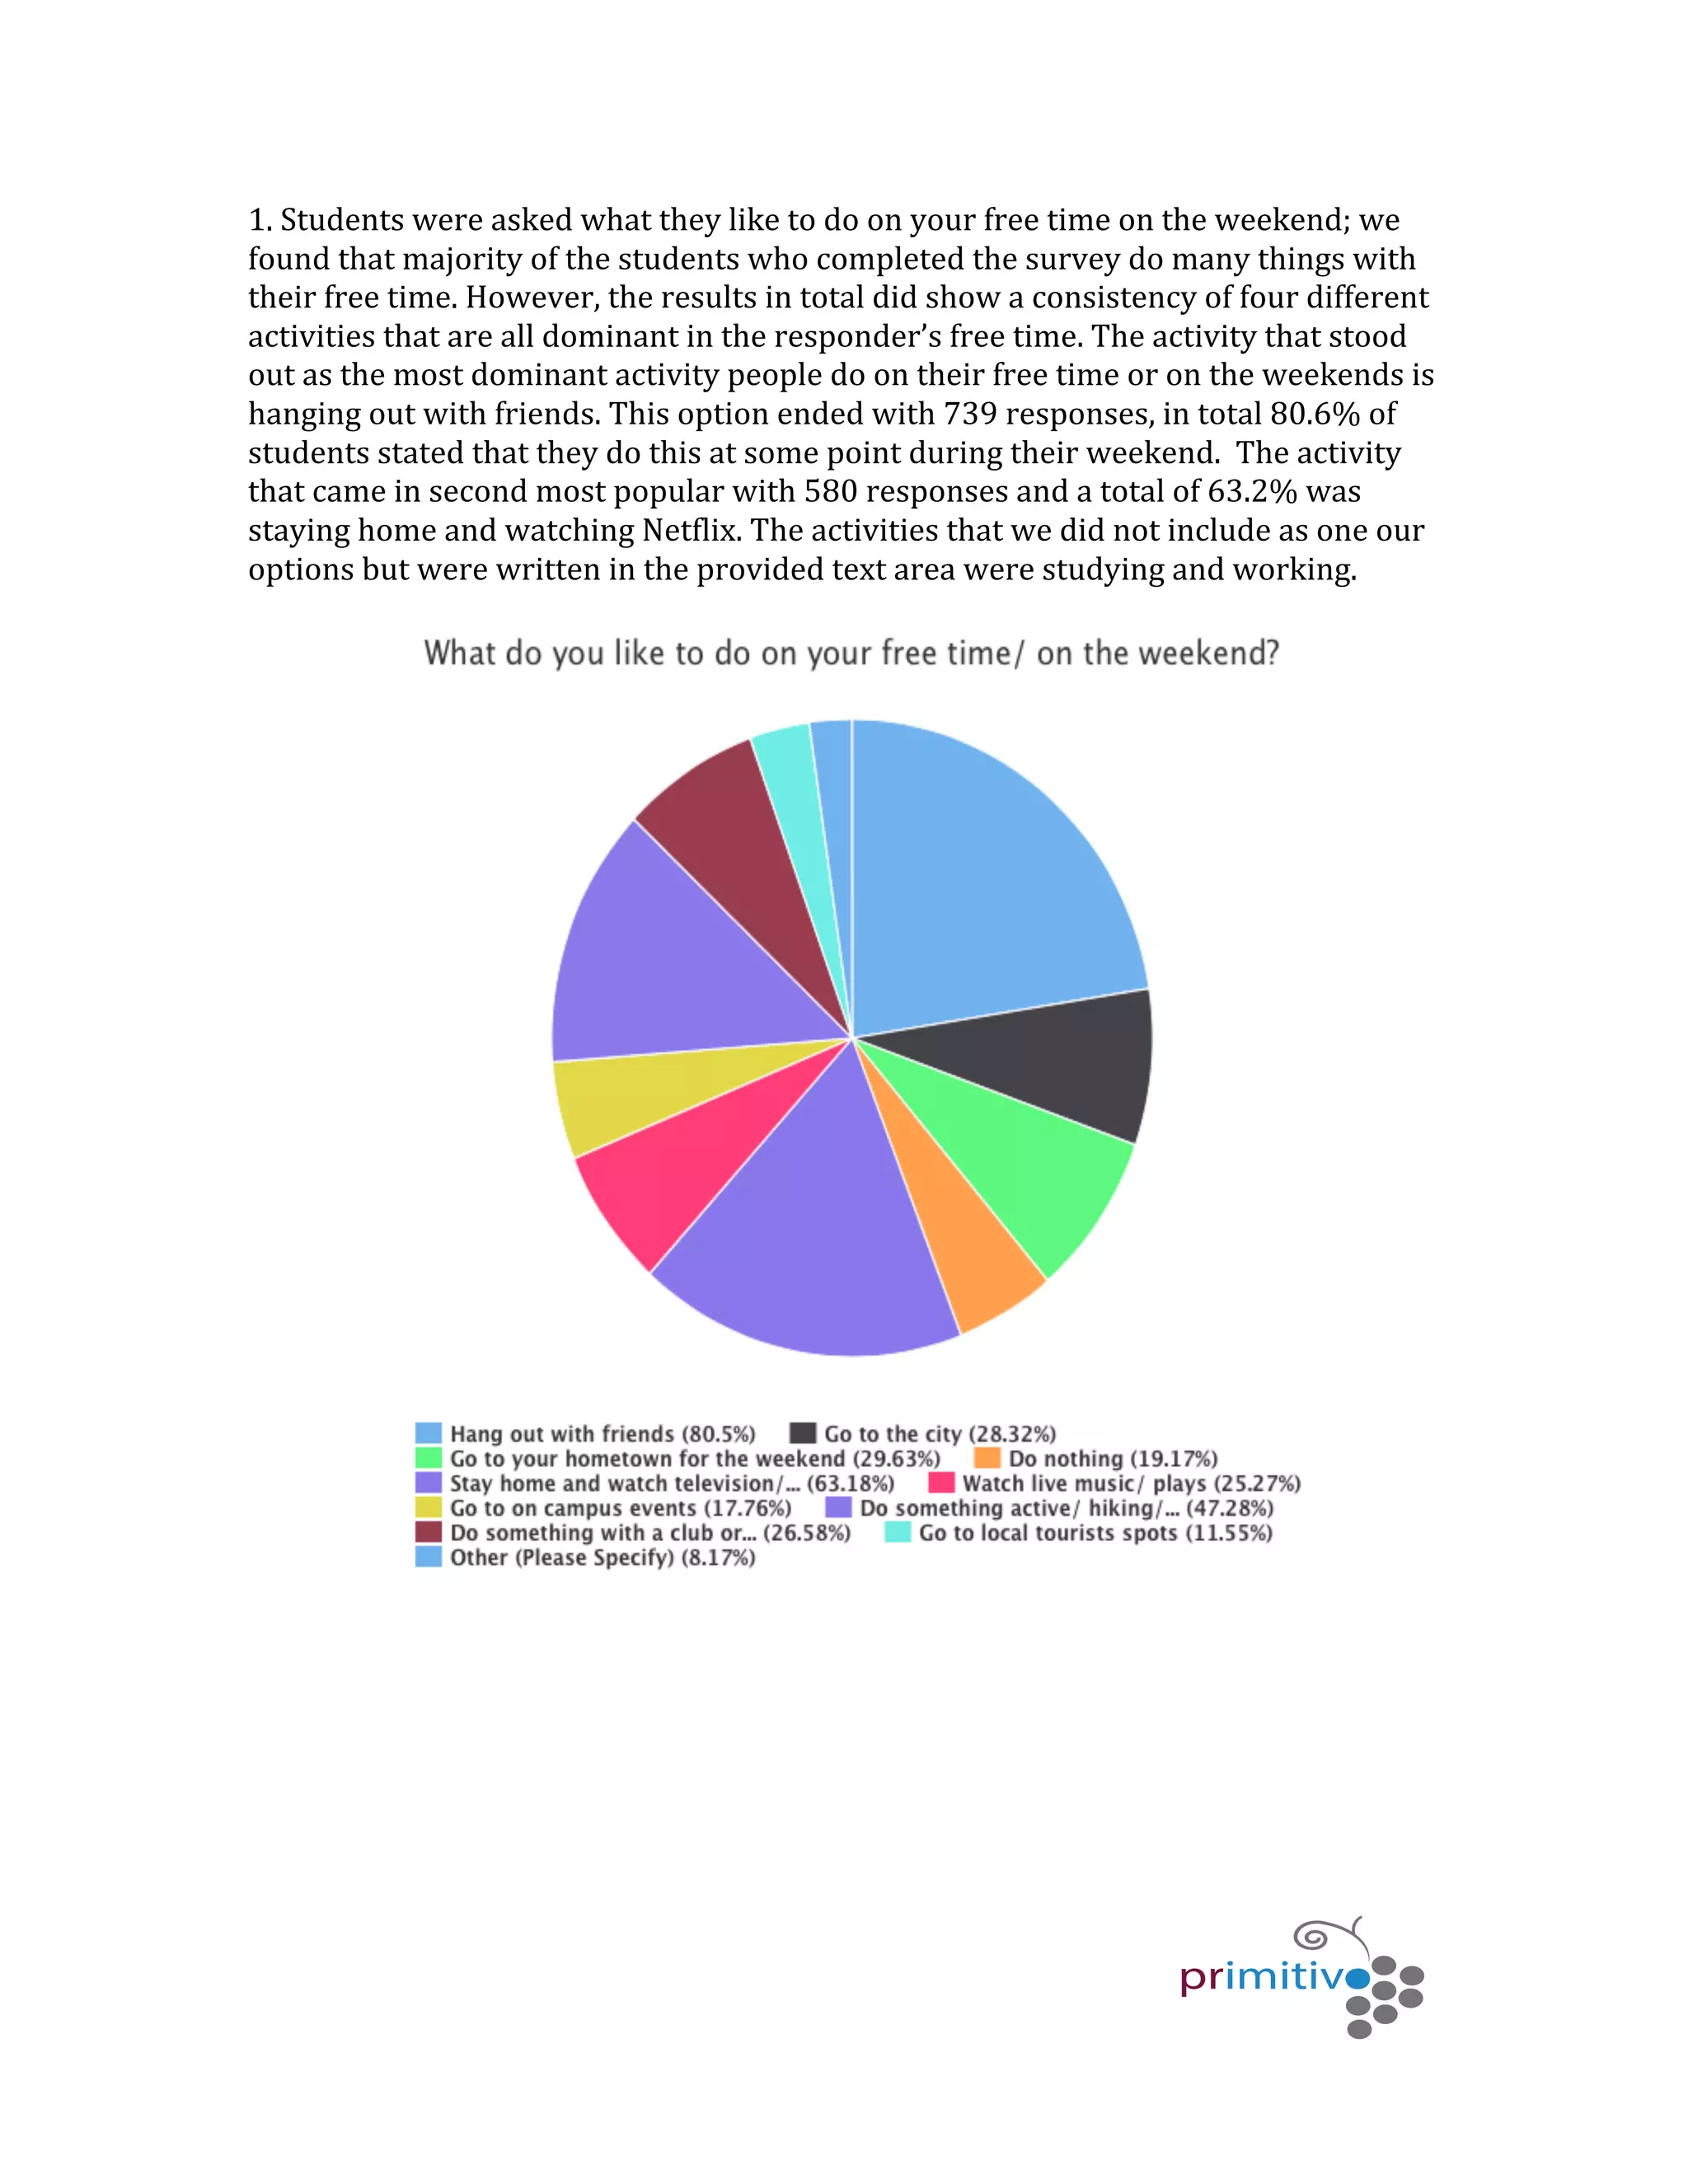

This document summarizes the results of a survey conducted with students at Sonoma State University about their engagement with the Center for Performing and Visual Arts. The survey found that most students spend their free time hanging out with friends or watching Netflix. Over half of students had attended a campus performance before, most commonly a play or dance performance. Students reported attending performances mostly for fun or to earn extra credit. Most students said they would likely attend another performance if they enjoyed the first one. Students expressed interest in performances having more modern themes and offering food, as well as bringing friends who don't attend the university.


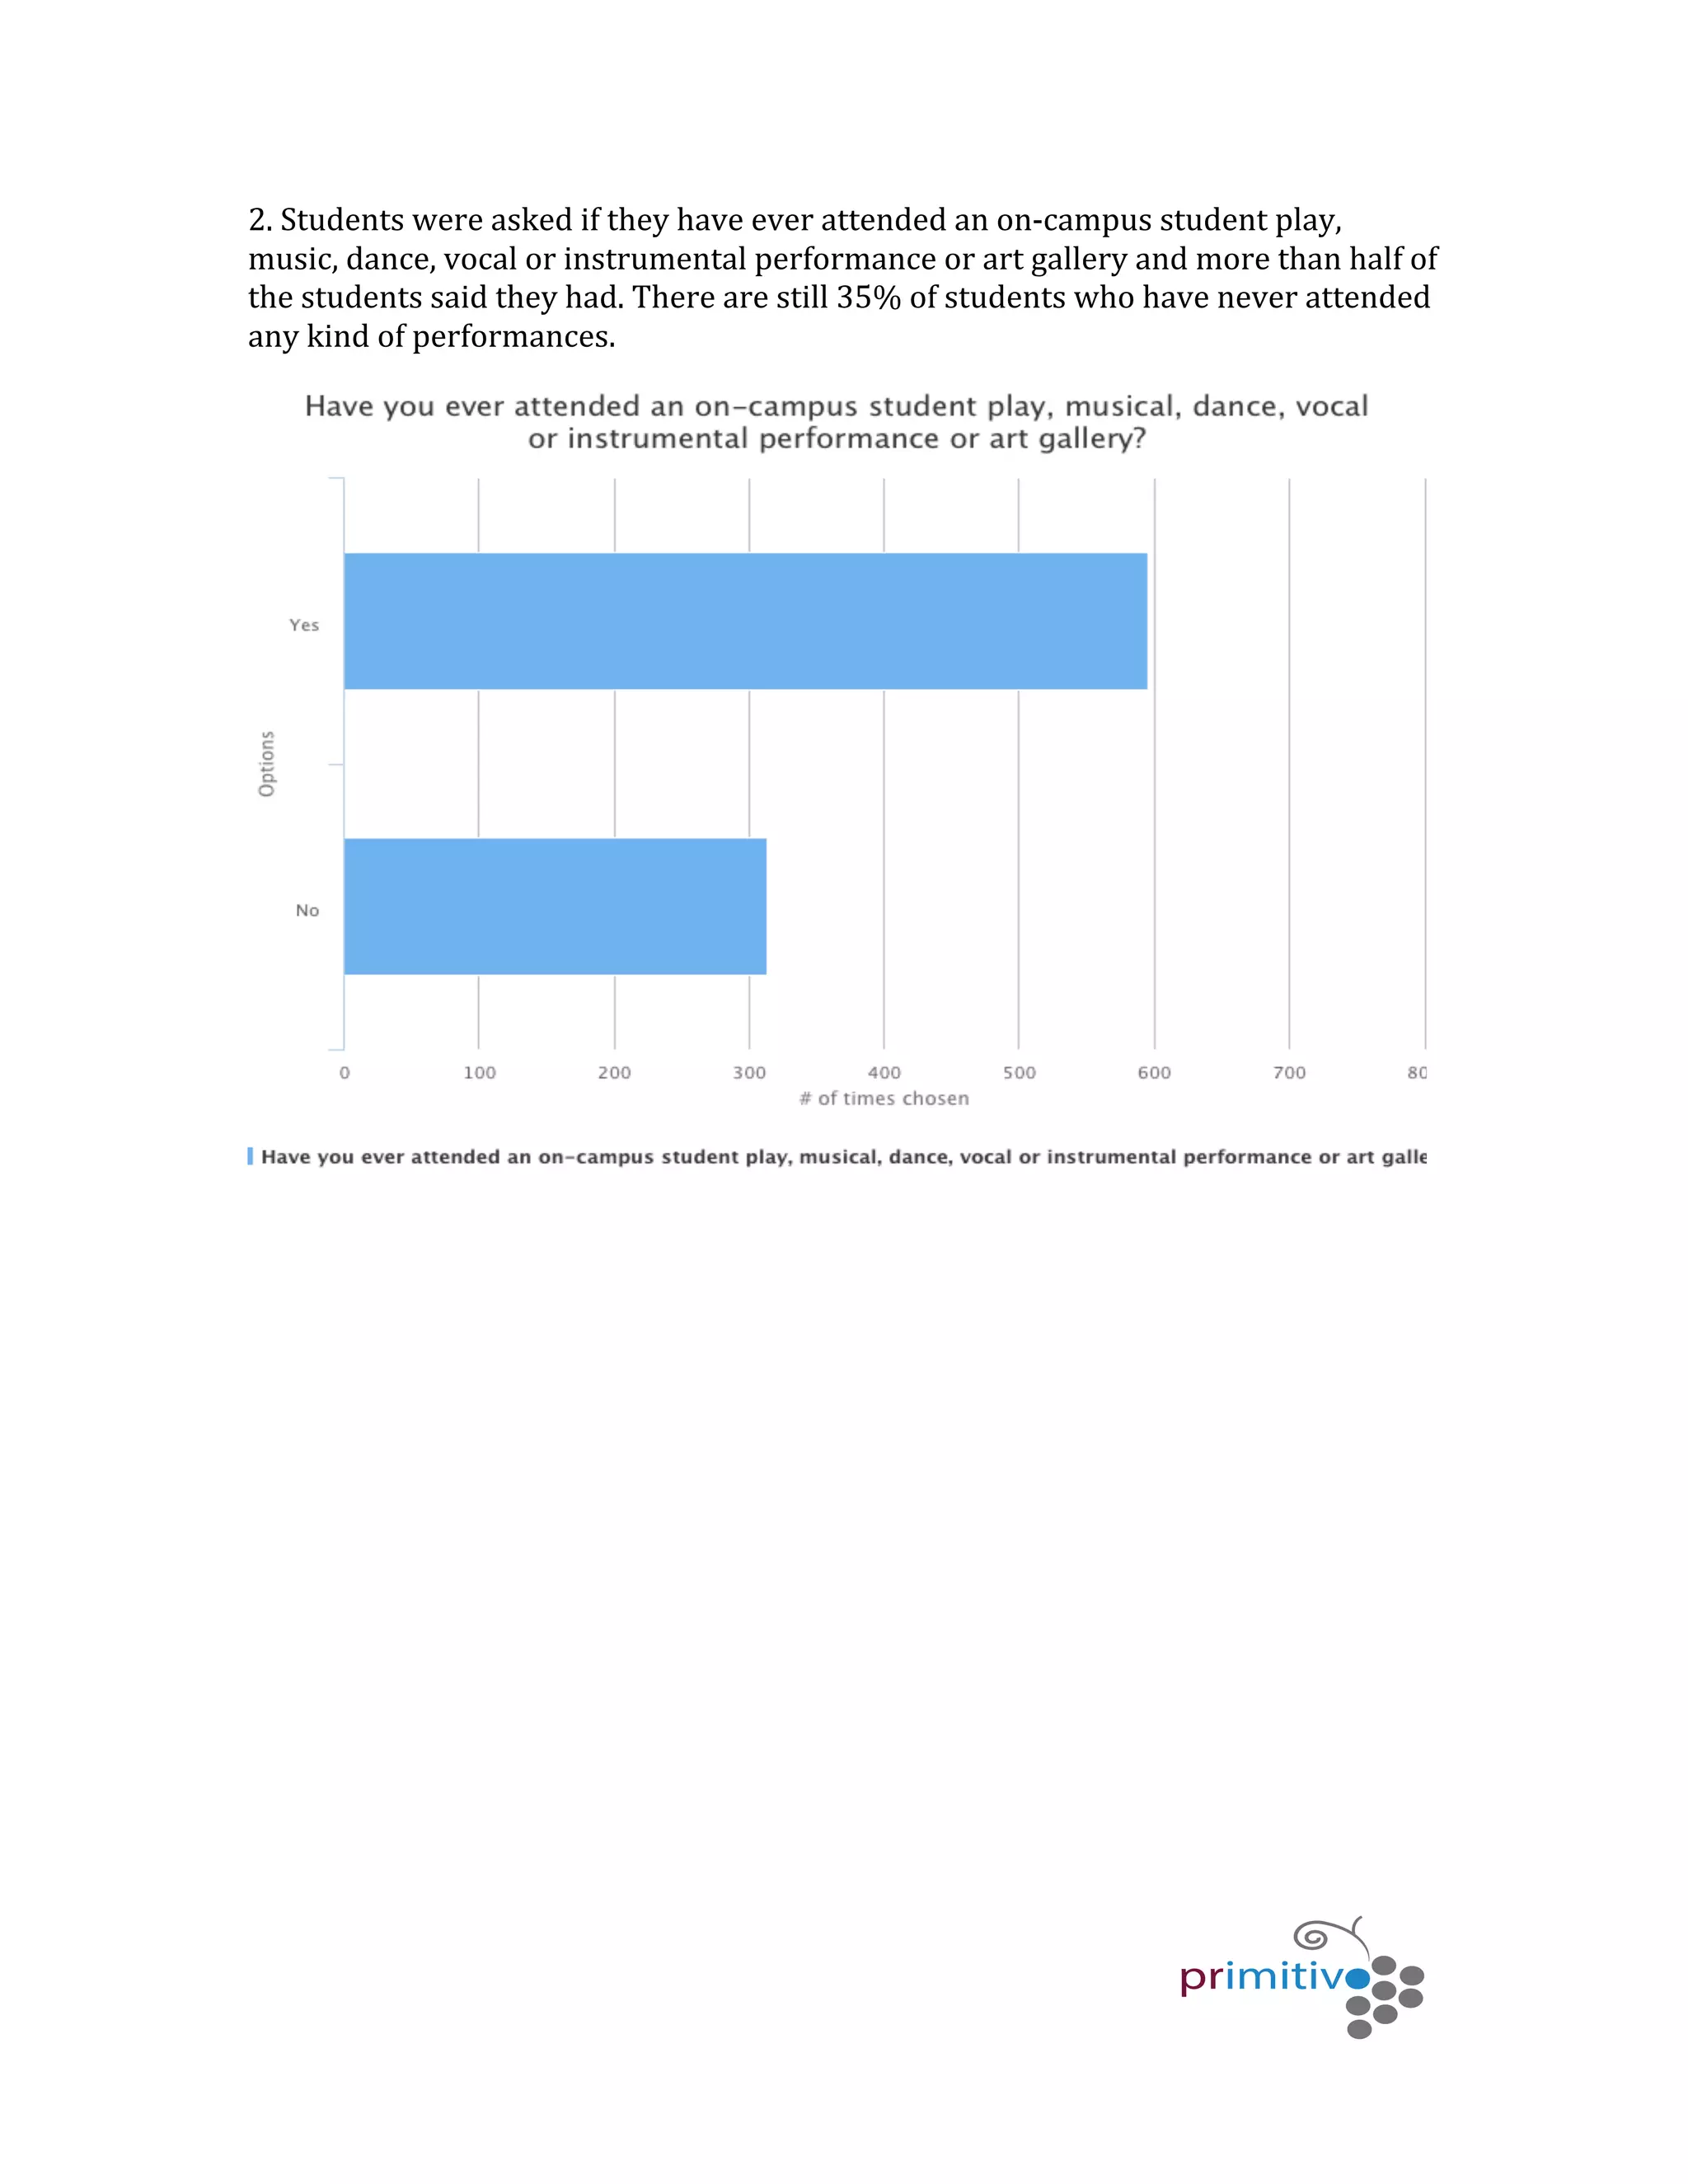
![Carp final[1]](https://cdn.slidesharecdn.com/ss_thumbnails/carpfinal1-110316210214-phpapp02-thumbnail.jpg?width=640&height=640&fit=bounds)
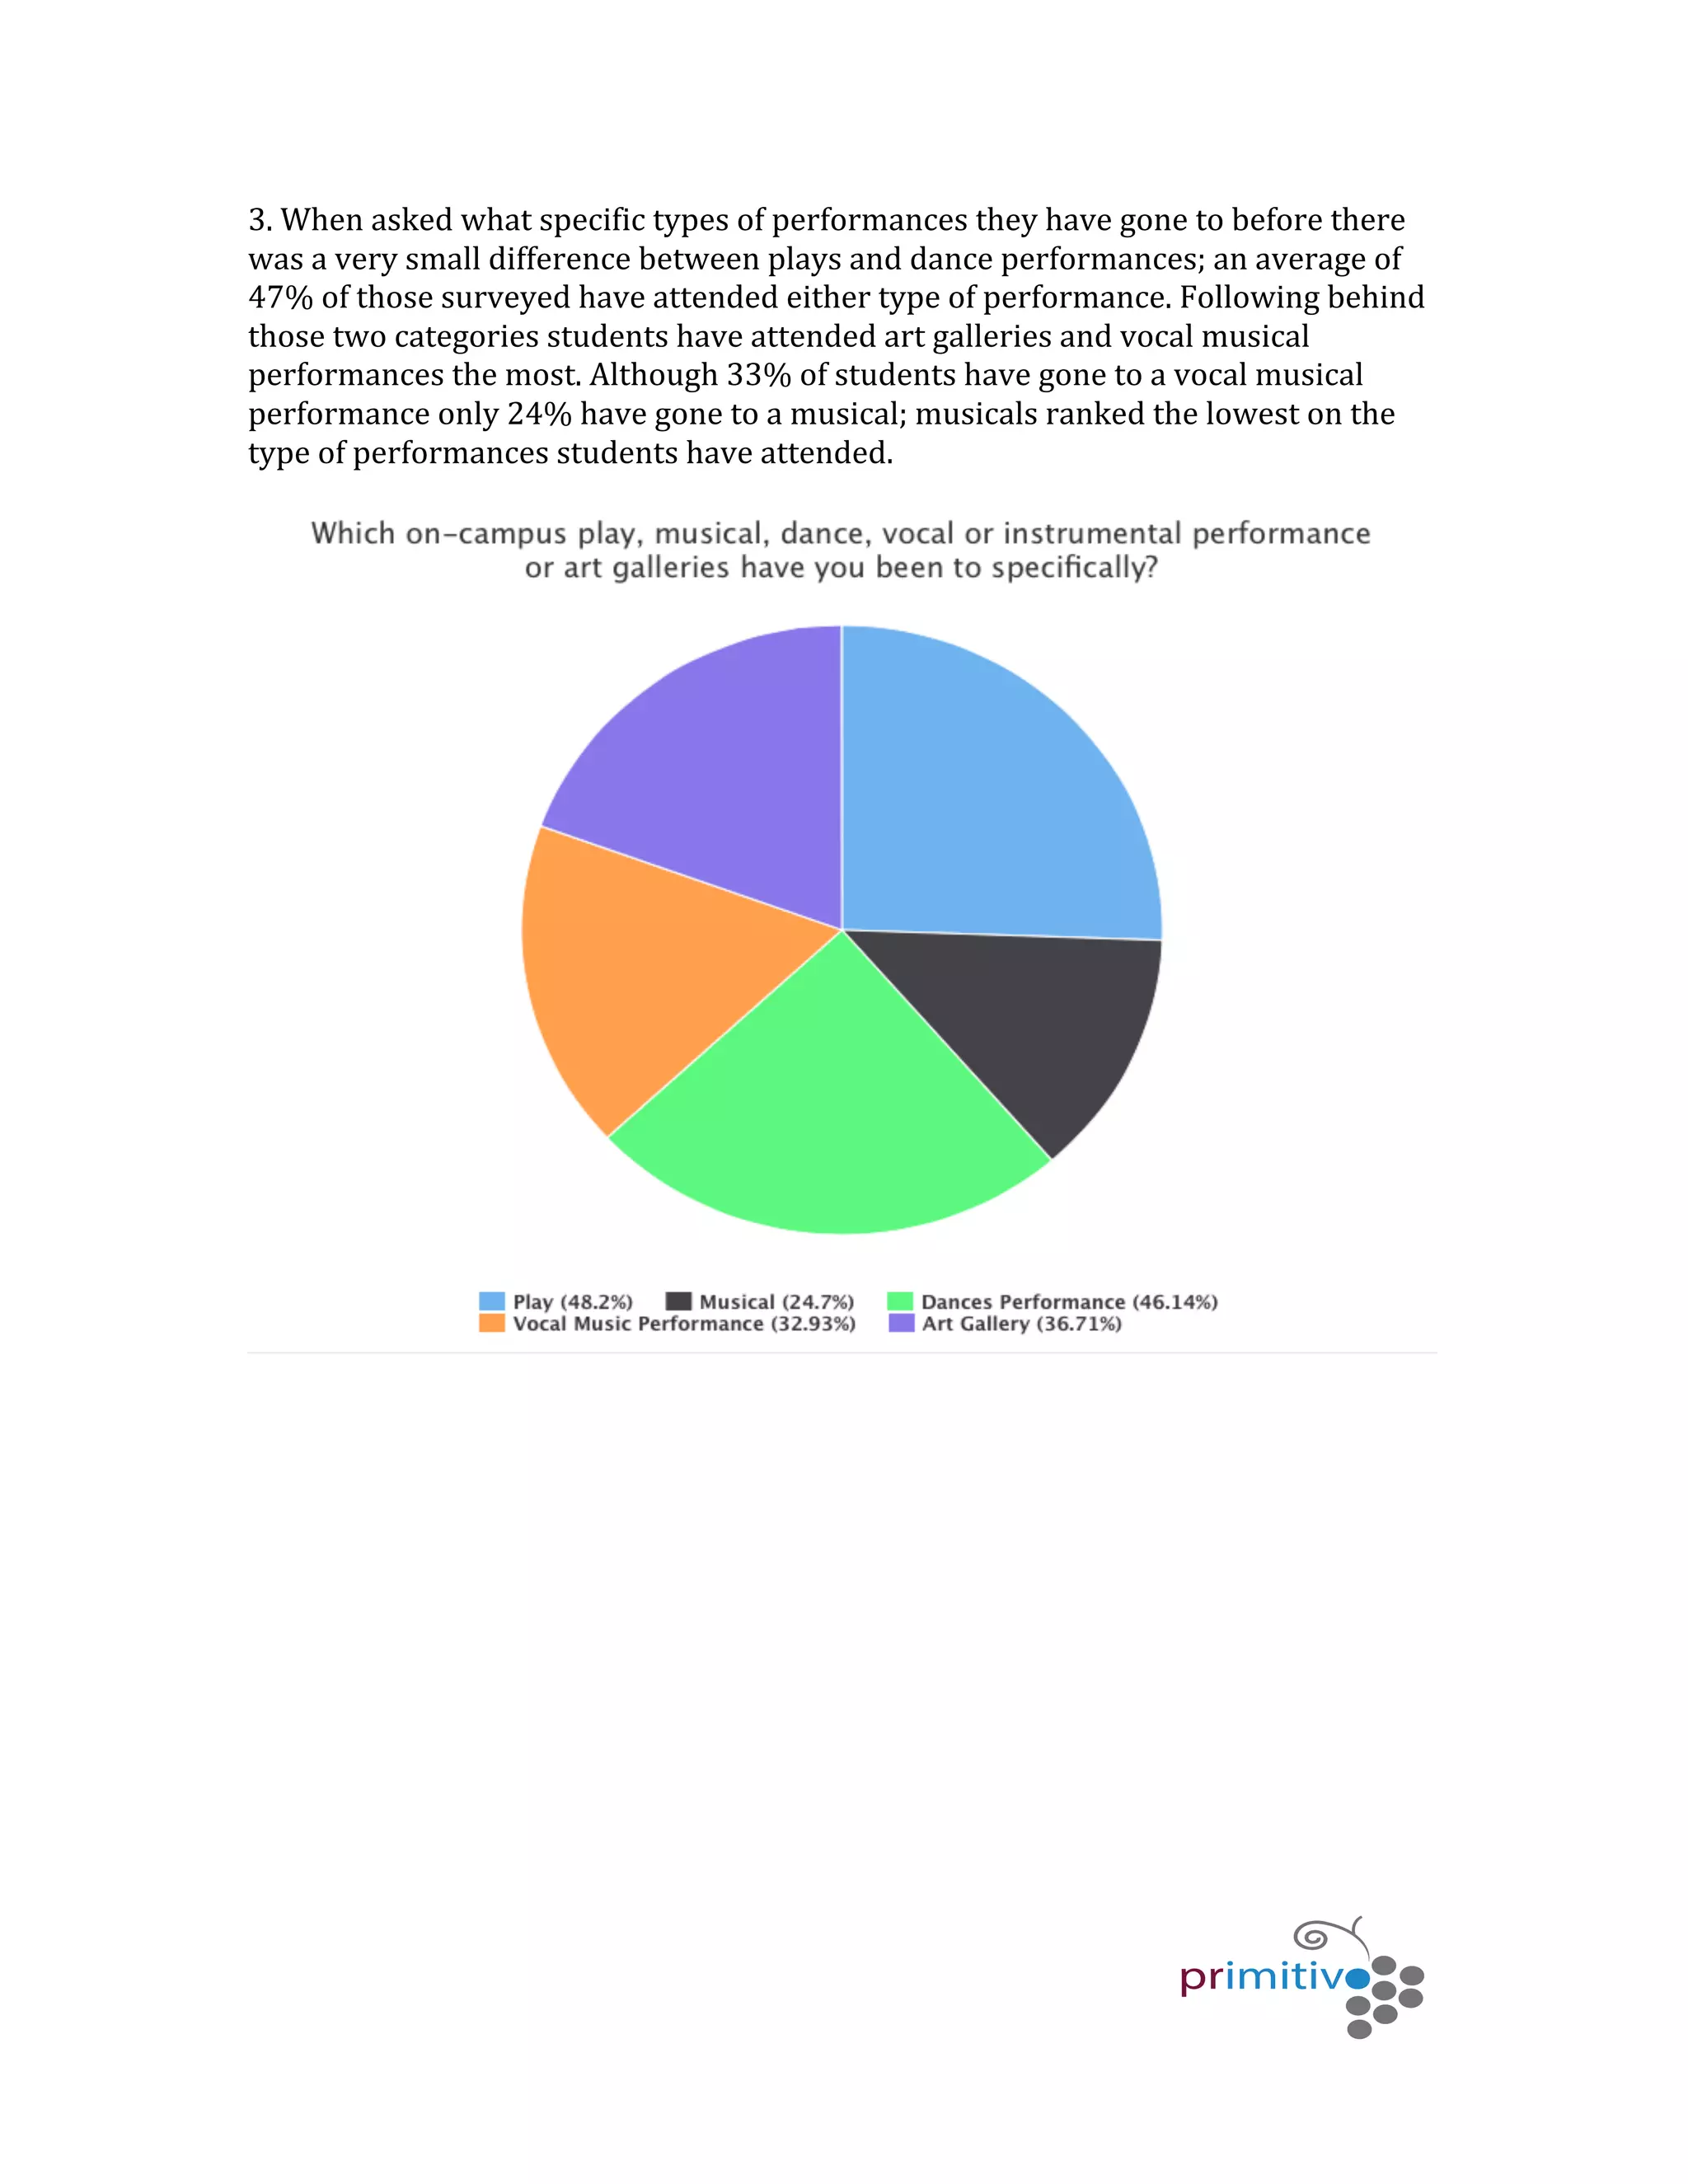
![Carp final[1]](https://cdn.slidesharecdn.com/ss_thumbnails/carpfinal1-110316211051-phpapp01-thumbnail.jpg?width=640&height=640&fit=bounds)


