SlideShare a Scribd company logo
1 of 85
Download to read offline
power                 of

 yum!
  2004 Annual Customer Mania Report
financial
                      highlights

                                                                                                                      % B/(W)
                                                                                        2004
(In millions, except per share amounts)                                                                2003           Change
                                                                                    $ 7,992
Company sales                                                                                      $ 7,441                   7
                                                                                      1,019
Franchise and license fees                                                                             939                   8
                                                                                    $ 9,011
Total revenues                                                                                     $ 8,380                   8
                                                                                    $ 1,155
Operating profit                                                                                   $ 1,059                   9
                                                                                    $   721
Earnings before special items                                                                      $    628                15
                                                                                         19
Special items, net of tax                                                                                (11)              NM
                                                                                    $   740
Net income                                                                                         $    617                20
                                                                                    $     14
Wrench litigation income (expense)                                                                 $     (42)              NM
                                                                                          16
AmeriServe and other (charges) credits                                                                    26               NM
                                                                                          —
Cumulative effect of accounting change                                                                     (2)             NM
                                                                                          30
Special items                                                                                            (18)              NM
                                                                                         (11)
Income tax on special items                                                                                 7              NM
                                                                                    $     19
Special items, net of tax                                                                          $     (11)              NM
Diluted earnings per common share:
                                                                                    $ 2.36
Earnings before special items                                                                      $ 2.06                  15
                                                                                      0.06
Special items, net of tax                                                                            (0.04)                NM
                                                                                    $ 2.42
Reported                                                                                           $ 2.02                  20
                                                                                    $ 1,131
Cash flows provided by operating activities                                                        $ 1,053                   7


AVERAGE U.S. SALES PER SYSTEM UNIT(a)

                                                2004
(In thousands)                                                    2003       2002         2001         2000      5-year growth(b)
                                           $     896
KFC                                                          $     898      $ 898        $ 865         $ 833               1%
                                                 794
Pizza Hut                                                          748        748          724           712               3%
                                               1,069
Taco Bell                                                        1,005        964          890           896               3%
(a) Excludes license units.
(b) Compound annual growth rate.


TABLE OF CONTENTS

1-6        DEAR PARTNERS                                                 20-21   KFC: CHICKEN CAPITAL U.S.A.
7          THE Yum! DYNASTY MODEL                                        22-23   LONG JOHN SILVER’S: GET COASTAL!
8-11       CHINA POWER                                                           A&W: HOMETOWN FOOD MADE FUN
12-13      GLOBAL POWER                                                  24-25   MULTIBRAND POWER
14-15      BRAND POWER X5                                                26-29   CUSTOMER MANIA POWER: 100% CHAMPS
16-17      TACO BELL: THINK OUTSIDE THE BUN!                             30-32   POWER OF RESULTS: FINANCIAL REVIEW
18-19      PIZZA HUT: GATHER ’ROUND THE GOOD STUFF                       33-80   FINANCIALS


Front and Back Cover: KFC and Pizza Hut in Shanghai, China
David C. Novak, Chairman and Chief Executive Officer, pictured in
                                                                 his office literally filled from floor to ceiling with “customer maniac”
                                                                 recognition photos.


                                                                       1
                                                                 #
Dear Partners,                                                                      BUILD DOMINANT
                                                                                    CHINA BRANDS
I’m pleased to report 2004 was
another year where we demon-                                     There’s nothing like making a strategic investment in
                                                                 the right place at the right time and that’s exactly what
strated the underlying power of                                  we’ve done in China. With KFC and Pizza Hut, we already
our global portfolio of leading                                  have the dominant brands in the fastest growing econ-
                                                                 omy in the world populated with 1.3 billion people. To be
restaurant brands.                                               more specific, KFC has 1,243 quick service restaurants
Fueled by continued profitable international expansion,          compared to approximately 600 for McDonald’s. Pizza Hut
dynamic growth in China, and strong momentum at Taco Bell        has 171 casual dining restaurants and there is no other
                                                                                                                                            1
and Pizza Hut in the United States, we achieved 15% earnings     substantial casual dining chain in China.
per share growth prior to special items. Highlights include      We have an outstanding tenured team, which has worked
a number of firsts: a record $1.2 billion in operating profit;   together for over ten years building the business from
a record $1.1 billion in cash provided by operating activities   scratch. Our China Division now generates over $1 billion
and a record $1.0 billion in franchise and license fees.         in revenue and $200 million in operating profit, up over
We also reached our goal to achieve an investment grade          20% versus a year ago. What’s more, it is our highest
rating from each major rating agency after paying off            return international equity business with a +20% store
nearly $3 billion in debt the past seven years. Armed with       level margin. In fact, China has grown to the point that
increasing cash flow and a powerful balance sheet, we            the team will now report into Yum! as a separate operat-
increased our shareholder payout by initiating the first divi-   ing division.
dend in our history and buying back a record $569 million        Consider the powerful competitive advantages we have in
of Yum! shares. Given this overall strong performance,           China. We uniquely own our own food distribution system
our share price climbed 37% in 2004. We’re pleased our           that gives us coverage in every major Chinese province and
annual return to shareholders is 22% for the first half of       has allowed us to expand KFC to over 280 cities. We also
this decade.                                                     have one of the largest real estate development teams
Most importantly, we remain confident we will continue           of any retailer in the world that opened up over 350 new
our track record of growing earnings per share at least          restaurants in 2004.
10% each year. We have four powerfully unique growth             Our China operations are best in class. In fact, 81% of
opportunities that differentiate us from the competi-            our restaurant managers have at least a college education
tion and bolster our belief that we are Not Your Ordinary        (the rest are just plain smart!). We also have highly sought
Restaurant Company. Let me give you my perspective on            after jobs with 13,000 team members. This investment in
each of these strategies and hopefully you will come to          infrastructure has given us an incredible opportunity and
the same conclusion.
Our China Division is our
                                                                     highest return international
                                                                     equity business generating
                                                                     over $1 billion in revenue
                                                                     and $200 million in
                                                                     operating profit, up over
                                                                     20% versus a year ago.


    an incredible head start. We estimate there are already          The foundation of this consistent growth comes from the
    500 million urban Chinese customers who can afford our           competitive advantage of the strong infrastructure we
    food. There’s no question, we are on the ground floor with       already have in place. For this we are largely indebted
    an unprecedented opportunity. I liken it to the days when        to PepsiCo who, prior to our spin-off in 1997, invested
    Colonel Sanders, Glen Bell, Dan Carney and Ray Kroc              40 years and billions of dollars to establish the global net-
    started KFC, Taco Bell, Pizza Hut and McDonald’s, respec-        work we inherited.
    tively, and created fast-food categories in the U.S., leading    The tough reality for our competition is that it would
    to 270,000 units today. We have the first mover advantage        take the same kind of time and commitment to reach
    and the opportunity to do the same thing in China.               our size and scale. The obvious exception, of course,
    That’s why our goal is to build dominant restaurant brands       is McDonald’s. McDonald’s already makes $1.8 billion
    in every significant category. So, in addition to KFC and        outside the U.S. demonstrating the clear profit opportu-
    Pizza Hut casual dining, we’ve recently developed Pizza          nity we can capture in the international arena.
    Hut Home Service and our Taco Bell Grande dine-in format.        That’s because the great reality for us is we already have
    The team has also enthusiastically developed and is now          strong local teams and operate in approximately 100
    testing East Dawning, which is a Chinese fast-food concept       countries around the world with nearly 600 international
    that is geared to provide the everyday local favorite foods      franchisees growing two popular global brands, KFC and
    of Chinese customers.                                            Pizza Hut. In fact, our franchisees opened up over 80% of
2   With all the good news in China, the leading question is,        the 738 new restaurants we added this year. This helps
    what can go wrong? Well, the past two years we’ve weath-         make our international business high return because our
    ered SARS, the Avian Flu and events like that are always         franchisees are using their capital, not ours, to grow.
    a possibility. And I’ll leave it to you to predict the future    Our plan is to continue to leverage our big scale markets.
    economy or potential political issues. One thing I’m sure of     We have nine countries and franchise-only business units
    is we’ll have our ups and some unforeseen downs but as           that have over 600 restaurants each. We’re focusing our
    I said last year and I’ll say it again, there’s no doubt in my   international company operations investment in four of
    mind that one day we will have more restaurants in China         these countries where we are building scale and expect to
    than we do in the U.S.                                           produce excellent returns over time (U.K., Australia, South
    China Division Key Measures: +20% operating profit growth;       Korea, Mexico). The largest of these markets is the U.K.
    +22% system sales growth; +375 new units/year.                   where we have great KFC and Pizza Hut businesses. Here,
                                                                     we have almost 1,300 restaurants generating $115 million


         2
    #                                                                in operating profits with a 24% 5-year growth rate.
                   DRIVE PROFITABLE                                  When you look at our franchise-only business, you’ll see
                   INTERNATIONAL EXPANSION                           we have nearly 4,500 restaurants generating $154 million
                                                                     in operating profit and a 16% 5-year growth rate. What’s
    Since China is now a separate division, the remainder            more we have broad-based growth evidenced by the fact we
    of our international business is now reported excluding          opened new units in 60 countries this year.
    our China Division. It too is a large and growing busi-          Going forward, we want to continue to add at least 700 new
    ness. For the fifth straight year we opened up over 700          units each year and do it profitably. Consider this, excluding
    restaurants in countries outside of China and the U.S. The       the China Division we only have 6,100 KFCs and 4,500
    International Division generates over $335 million in oper-      Pizza Huts compared to over 16,000 units McDonald’s has
    ating profit, with a solid record of growing at least 10% in     in international markets outside of China.
    operating profits.
On the international front
       we have an undeniable
   competitive advantage and
      growth opportunity with
       two global brands, KFC
                and Pizza Hut!


To attack this opportunity, we are making targeted invest-        a focus on “exceptional execution of the basics” which
ments to develop new markets, with the goal to eventually         is driving continuous improvement in both operations and
get to scale in India, Brazil, Russia, France, Germany and        marketing. Taco Bell has made dramatic improvement in
Holland. We are especially pleased with our progress              speed of service and cleanliness. And Taco Bell’s “Think
in India and France. Pizza Hut is the number one most             Outside the Bun” marketing campaign which features a
trusted brand in India with almost 100 units and we are           steady stream of product and value news continues to build
now developing KFC with an offering that includes a vege-         what we call “big brand momentum” with our customers.
tarian menu.                                                      Pizza Hut also had strong same store sales performance,
KFC in France is generating huge sales volume and good            +5%. Pizza Hut did this by staying one step ahead of our
unit economics so we are beginning to expand. While               competition, introducing innovative new pizzas like The
we’ve made some progress, we are struggling with our unit         4forALL®, The Full House XL Pizza™ and limited time
economics in Germany and Holland.                                 only offerings like Buffalo Chicken Pizza. The brand’s
                                                                  “Gather ‘Round the Good Stuff” advertising campaign is
Developing new markets is tough because building
                                                                  building real traction with the heart of the pizza category
consumer awareness and acceptance takes time. Just as
                                                                  by focusing on the family and the primary decision maker,
importantly, it takes time to build local operating capability.
                                                                  Mom. And importantly, Pizza Hut is also steadily improving
Our approach is to continue to be patient and ever mindful
                                                                  its operations, targeting improving delivery phone service
of overall profitability and returns. The potential is obvious

                                                                                                                                  3
                                                                  and dine-in table service.
and we are determined to build our international business
the right way.                                                    Our single biggest disappointment in the U.S. was negative
                                                                  2% same store sales at KFC. It would be easy to blame
International Division Key Measures: +10 – 15% operating
                                                                  increasing competition from McDonald’s and Wendy’s
profit growth; +5% system sales growth; +700 new
                                                                  since both had national introductions of chicken strips
units/year.
                                                                  representing 20,000 units. But we know we can grow this


     3
#
                                                                  brand by simply doing a much better job of marketing and
                BE THE BEST AT PROVIDING
                                                                  operations execution. One big advantage we have at Yum!
                BRANDED RESTAURANT CHOICE
                AND MULTIBRANDING GREAT                           is the ability to spread best practices. As a result, our new
                BRANDS                                            management team is now implementing the product inno-
                                                                  vation and operating processes used successfully at both
The foundation of our company is category-leading U.S.
                                                                  Taco Bell and Pizza Hut. KFC also introduced a new menu
brands with proprietary products and operating systems
                                                                  board that lays the foundation for upcoming product and
that are highly successful on a stand alone basis. Our
                                                                  value innovation. Much needs to be done, but we expect to
strategy is to make our brands more and more powerful
                                                                  turn the corner this year.
each year by building even more relevance, energy and
                                                                  Our other setback in the U.S. performance was unusu-
differentiation for our customers. Let me post you on our
                                                                  ally high commodity inflation resulting in approximately
U.S. progress.
                                                                  $70 million in unplanned food and paper costs. We expect
Taco Bell generated 5% same store sales growth, hit the
                                                                  this inflation to moderate somewhat this year and to
$1 million mark again for average unit volumes and is
                                                                  improve our U.S. profits.
now the second most profitable Quick Service Restaurant
                                                                  U.S. Brand Key Measures: +5–7% operating profit growth;
brand. We’re especially pleased that Taco Bell is becoming
                                                                  +1–2% blended same store sales growth.
a model for consistency, growing its same store sales at
least 2% the past three years. This result is coming from
Multibranding is becoming
          a big business for Yum!,
        accounting for 14% of our
        U.S. traditional restaurant
           base and an estimated
               $224 million in U.S.
             company store profits
              and franchisee fees.


    Given the fact we are the only restaurant company to have a     Our KFC/Taco Bell concept had solid same store sales
    portfolio of leading brands, we have the unique opportunity     growth and achieved parity margins with our single brands.
    to offer our customers two great brands in one restaurant.      Taco Bell/Long John Silver’s is showing promise with high
                                                                    volume and good margins. Given the results, we will begin
    Not surprisingly, when you think about it, our customers tell
                                                                    to more aggressively expand this combination. While it’s
    us they prefer multibranding over single brands because
                                                                    too early to make a call, we have expanded testing of
    it provides more choice and convenience under one roof.
                                                                    our new Long John Silver’s/A&W combos. Given the soft-
    For example, if someone doesn’t want chicken, they can
                                                                    ness in KFC’s core business, we have delayed expansion
    have tacos, thereby canceling a veto vote. The response
                                                                    of multibranding in company stores until we improve our
    we hear most often from our customers who experience
                                                                    operations. However, our best KFC franchise operators are
    multibranding is, “What took you so long?”
                                                                    continuing to develop multibrand units.
    As a result, multibranding is becoming a big business for
                                                                    After seeing the power of multibranding, our Pizza Hut team
    Yum!, accounting for 14% of our U.S. traditional restau-
                                                                    successfully created and tested its own multibranding
    rant base and an estimated $224 million in U.S. company
                                                                    concept for home delivery called WingStreet, which is a
    store profits and franchise fees. Sales of our new multi-
                                                                    tasty line of flavored bone-in and bone-out chicken wings.
    branding restaurants are typically $250,000 a year higher
                                                                    We also took the menu and learnings from our Pasta Bravo
    than our single brands and same store sales for restau-
                                                                    acquisition and created Italian Bistro as a partner brand
    rants opened more than a year are also higher.

4                                                                   with Pizza Hut’s traditional dine-in restaurants. Again, early
    To give you a historical perspective, we started with
                                                                    results are extremely promising.
    combinations of KFC/Taco Bell and Taco Bell/Pizza Hut
                                                                    We are now confident the potential for multibranding at
    Express. We learned that we were able to add significant
                                                                    Pizza Hut is as strong as it is for our other brands. In
    incremental average sales per unit, dramatically improving
                                                                    fact, our interests and capabilities to take advantage of
    unit cash flows. Our franchisees then pioneered multi-
                                                                    the multibranding opportunity for all our brands has never
    brand combinations by pairing KFC and Taco Bell with Long
                                                                    been greater than it is today.
    John Silver’s, the country’s leading quick-service seafood
    restaurant, and A&W All American Food, which offers pure-       However, our biggest challenge for multibranding remains
    beef hamburgers and hot dogs along with its signature           the same. We must continue to get better and better
    Root Beer Float. Based on outstanding customer feedback         at building the operating capability to successfully run
    and results, we acquired Long John Silver’s and A&W in          these restaurants. And the plain fact is it’s harder to run
    2002. With this acquisition we significantly expanded our       a restaurant with two brands. With more variety comes
    multibranding potential in the U.S.                             more complexity, so we’ve been dedicated to improving
                                                                    the capability of our people to deliver our customers a
    We can now open high return new restaurants in trade
                                                                    great experience. We have simplified our back of house
    areas that used to be too expensive or did not have
                                                                    systems and are reducing costs by value engineering our
    enough population density to allow us to go to market with
                                                                    facilities, while at the same time offering more exciting
    one brand. With multibranding, we believe we can eventu-
                                                                    building designs.
    ally take both KFC and Taco Bell to 8,000 units in the U.S.
    compared to the over 5,000 each we have today.                  Again, this is an opportunity we created and is unique to
                                                                    Yum! and again, we continue to have first mover advan-
    I’m happy to report 2004 was another year of solid prog-
                                                                    tage. Our operational learnings put us well ahead of the
    ress for multibranding.
Whether you’re one of our smallest
customers enjoying a special Chicky party,
a delicious A&W hamburger and shake
or a lunch date with mom, our Customer
Maniacs are putting smiles on customers’
faces around the world.


pack and no one else has the power to combine leading
brands like we do. The challenge we have is to execute it
right and more progress needs to be done before we accel-
erate our growth rate. To borrow a famous phrase from the
legendary basketball coach John Wooden, our strategy is
to “be quick, but not hurry” so we take advantage of the
unique opportunity by building the business the right way.
Multibrand Key Measures: at least 550 multibranding
additions per year, earning a return on company additions
several points above the company’s cost of capital.


     4
#               RUN
                GREAT
                RESTAURANTS

As I stated last year, we have pockets of operating excel-
lence around the globe. For example, our operations in

                                                              5
countries like China and Australia are first class. I also
wrote that we had climbed from the bottom to the middle
of the pack versus competition in the U.S. I’m pleased
we continued to make progress across almost all our key
operating measures this year, especially at Taco Bell, but
objectively we can only give ourselves no more than a C+
grade on our 2004 performance.
“Mediocrity plus” clearly isn’t good enough for you or
us and most importantly, it’s not good enough for our
customers. In fact, our customers in the U.S. are telling
us we are giving them a 100% CHAMPS experience only
53% of the time (up from 49% in 2003). CHAMPS stands
for executional basics (Cleanliness, Hospitality, Accuracy,
Maintenance, Product Quality and Speed) and we are only
delivering the basic expectations of our customers half of
the time.
We realize consistent execution of our brand experience
is the cornerstone to consumer trust, which is critical to
consistent same store sales growth. So we’re working hard
on operational enablers, like new point of sale and drive
thru systems, telephone access for home delivery, and
technology for back of house systems. Most importantly,
Our formula for success is
                                                                   simple: put people capability
                                                                   first. When we do that, we’ll
                                                                   satisfy our customers better
                                                                   than anyone and generate
                                                                   more profits.


    it’s also why our single biggest global initiative is what     First, we now have process and discipline around the things
    we’ve coined Customer Mania. Customer Mania is defined         that really matter in our restaurants and in every function
    as delivering our customers 100% CHAMPS with a “Yes!”          at our restaurant support centers.
    attitude every single time. We’ve been on this journey for     Second, and most importantly, if you talk to our people you’d
    three years now training our 850,000 team members once         hear a universal conviction that our distinct culture is our
    a quarter on how to be Customer Maniacs.                       biggest competitive advantage. It’s a high energy, people
    In fact, Ken Blanchard, the author of One Minute Manager       capability-first, Customer Mania work environment that is
    was so impressed with the operating culture and processes      centered on spirited recognition that drives performance.
    he learned Yum! is putting in place to create Customer         There’s no doubt in my mind that continuing to build a work
    Mania that he wrote a book on our approach and prog-           environment where everyone knows they can make a differ-
    ress entitled Customer Mania! It’s Never Too Late To Build A   ence will make the biggest difference for shareholders
    Customer-Focused Company.                                      today and tomorrow. This has been and will remain my
    While Ken gives us high marks on process, recognition and      number one priority.
    leadership, he only gave us a rating of six on a scale of      I’d like to thank our dedicated team members, restaurant
    one to 10 on having Customer Mania being executed by           managers, franchise partners, and outstanding Board of
    our team members at our restaurants. Clearly we can do         Directors for their many contributions and commitment
    better and we are committed to improving with urgency.         to Customer Mania. I’d particularly like to thank Jamie
6   We’ve made progress and can tell you with certainty we         Dimon and Sidney Kohl who retired from our board this
    have the people, tools and processes to make a lot more.       year, and Pete Bassi, who retired as the President of Yum!
    Our goal is to run the best restaurants in the business and    Restaurants International. Jamie, Sidney and Pete made
    we are on a march to make it happen. Just think what we        lasting contributions to the formation and growth of our
    can do as we take our operations from mediocre to good         company. I would also like to thank Bonnie Hill, David
    to great. Our best run restaurants always make more sales      Grissom, Dave Dorman and Jon Linen for the contributions
    and profits so the payoff will come.                           they are making as our newest board members.
    Operations Key Measures: 100% CHAMPS with a “Yes!”             We have the power of Yum! and the unique growth oppor-
    attitude in Every Store and Same Store Sales Growth in         tunities to build one of the world’s most consistent and
    Every Store.                                                   highest performing companies. I hope you agree we are
    Going forward, we are galvanized around building what          anything but your ordinary restaurant company.
    we call the Yum! Dynasty, driving consistent results year
                                                                   Yum! to You!
    after year, which as you know, is the hallmark of truly
    great companies.
    On the next page, you can see the roadmap we’ve laid
    out for dynasty-like performance, along with handwritten
    comments I always include in my New Year’s letter to our
    restaurant teams.
                                                                   David C. Novak
    I’m often asked by investors what I see going on in our
                                                                   Chairman and Chief Executive Officer
    company that they don’t see. What you can’t see in the
    numbers is the quality way in which we are achieving them.
China
“
          power”
    The China business has come a long way since we started our
8   first KFC store in Beijing in 1987. Today, we are by far the largest
    restaurant company — and a pioneer of franchising — in China.
    And we’ve only just begun. Over the last four years we’ve been adding
    restaurants at a 22% growth rate — not many restaurant companies
    in the world can say that. And we’re pulling away from our competi-
    tors with increasing margins. But why are we so successful? We have
    tremendous branding power, a highly educated workforce, an incredible
    supply-chain infrastructure, ownership of the distribution system and
    finally, a strong, tenured leadership team averaging 17
    years of experience in the business. With a population
    of 5 times that of the United States and a rapidly devel-
    oping economy, the opportunities are unlimited. We’ve
    only just scratched the surface!


    SAM SU, PRESIDENT, Yum! RESTAURANTS CHINA
    Our China Division includes: Mainland China, Thailand and KFC Taiwan.
OVER           1,900         OVER           AVERAGE SALES     OVER 85,000
$1.1 BILLION   SYSTEM        $200 MILLION   PER SYSTEM UNIT   EMPLOYEES IN
IN REVENUE     RESTAURANTS   IN OPERATING   OF $1.0 MILLION   OVER 280 CITIES!
                             PROFIT         (U.S. DOLLARS)
KFC IS THE LARGEST    PIZZA HUT IS THE #1 CASUAL   RECENTLY INTRODUCED
AND FASTEST GROWING   DINING BRAND IN CHINA        PIZZA HUT HOME SERVICE
RESTAURANT CHAIN                                   AND TACO BELL GRANDE
IN CHINA                                           DINE-IN


                                                                    1,000 RGMs
                                                            celebrating the 1,000th KFC
                                                              with the world’s largest
                                                                   “Yum!” cheer.
KFC RGM, Din Jing,
                                          celebrating with some of
                                          her smallest customers!


              We served nearly a billion customers
PLEASE OPEN

              in China alone in 2004!
“global
       power”
12
Our International Division
continues to set new records
in terms of revenues, profits
and new unit development. In
2004,
2004, we achieved $2 billion                                                                            We are proud of the strong track
                                                                                                        record of growth of the international
  in revenues, generated over                                                                           business and we’re excited by the
                                                                                                        opportunities still in front of us.

     $335 million in operating
     $335                                                                                               This combination of a solid, estab-
                                                                                                        lished international base and huge

       profit — up 20% — and                                                                             untapped potential makes us truly
                                                                                                        unique in the restaurant business.

        we opened 738 new
            opene                                                                                       Each of our major equity markets —
                                                                                                        United Kingdom, Australia, South
                                                                                                        Korea and Mexico — have category-
         restaurants outside                                                                            leading market positions and pow-
                                                                                                        erful local leadership teams. Even
         of the United States.                                                                          with their scale, these businesses
                                                                                                        still have significant new unit poten-
         That brings us to an                                                                           tial and exciting future prospects.
                                                                                                        So too do our franchisees which
         impressive 11,093                                                                              generate nearly $400 million in
                                                                                                        franchise fees. In all, nearly 600
        units outside of the                                                                            franchisees are building our brands
                                                                                                        across the globe. And they are as

       U.S. with a presence in                                                                          passionate about growth as we are.
                                                                                                        Despite our current size, attrac-
     approximately 100 countries                                                                        tive new opportunities abound.
                                                                                                        We expect growth in all of our

  and territories. Now that’s                                                                           current markets, equity and fran-

                                                                                                                                                13
                                                                                                        chise. But, we’re also investing in

     undeniable growth!                                                                                 high potential markets where we
                                                                                                        have a modest presence today —
                                                                                                        Western Europe, Eastern Europe,
                                                                                                        India, and Brazil in particular.
                                                                                                        All in all, ours is a balanced port-
                                                                                                        folio which is delivering broad-
                                                                                                        based unit development and strong
INTERNATIONAL DIVISION SYSTEM SALES(a) BY KEY MARKET                                                    growth in system sales. In 2004,
Includes all operations outside the U.S., with the exception of those reported in the China Division.
                                                                                                        we opened new units in 60 coun-
Year-end 2004
                                                                                                        tries and achieved positive same
    U.K.                                  19%
                                                                                                        store sales growth in most major
    Asia Franchise                        13%
                                                                                                        markets. We’re targeting similar
    Caribbean/Latin America Franchise      8%
                                                                                                        performance in 2005.
    Middle East/Northern Africa Franchise 5%
                                                                                                        Great brands. Motivated people.
    Continental Europe Franchise           6%
                                                                                                        Strong results. Huge potential.
    Southern Africa Franchise              4%
                                                                                                        That’s why the International busi-
    Australia                             11%
                                                                                                        ness is the envy of our industry.
    PH Korea                               4%
    Mexico                                 3%
    Early-Stage Growth Markets(b)          3%
    Other Markets(c)                      24%
International Division                   100%
(a) System sales represents the combined sales of                                                       GRAHAM ALLAN
    Company, franchise, unconsolidated affiliate and                                                    PRESIDENT Yum! RESTAURANTS
    license restaurants.
                                                                                                        INTERNATIONAL
(b) Includes KFC Germany, KFC Netherlands, KFC France,
    Brazil and India.
(c) Includes Japan, Canada, PH France and Poland.
We’re the leader in the chicken, pizza, Mexican-style food and quick-service seafood categories.
                                        Mexican
    Taco Bell continues to invite customers to “Think Outside the Bun” with their exciting line-up
of Mexican-inspired signature products. While       Pizza Hut gave us even more reasons to
“Gather ’Round the Good Stuff” creating dinner solutions that are pleasing the entire family.
     KFC is inviting customers to visit “Chicken Capital USA” to try some of the Colonel’s secret
11 herbs and spices.          Long John Silver’s is giving seafood lovers the chance to “Get
Coastal” with the signature seafood tastes you crave. And in 2004,          A&W All-American
Restaurants celebrated 85 years of satisfying customers, sharing their “Hometown Favorites
Made Fun” with everyone.
“brand
  power x5”

          15
16
Think Outside the Bun!™
                        2004 was a year of significant progress for Taco Bell®. We delivered positive same store sales growth in
                        every period — with over three consecutive years of sustained growth. Throughout the year we continued
                        to set weekly sales records systemwide, fueled by innovative marketing and a commitment to Running
                        Great Restaurants. We’re proud of the fact that our One System Operating Platform helped our Restaurant
                        General Managers and their teams drive more consistent execution and greater Customer Mania. As a result,
                        our Speed with Service improved, with QSR Magazine rating us third in the overall drive-thru experience in
                        their 2004 Drive-Thru Survey. We also continued to deepen our people-first, recognition culture as seen by
the fact that our team member turnover was down from 221% in 2001 to just 108% in 2004.
   And then there’s our food! Already delighting customers with our existing lineup of Mexican-inspired products, like our delicious
Grilled Stuft Burritos, signature Quesadillas and Fiesta Taco Salad™ — in 2004 we invited consumers to Think Outside The Bun™
with our new Big Bell Value Menu™. Priced at just 99¢ – $1.29, customers can keep their stomachs and wallets full with items like
our 1/2 lb Beef & Potato Burrito, Spicy Chicken Soft Taco, and Caramel Apple Empanada.
   We also had customers Drinking Outside the Bun with the introduction of Mountain Dew Baja Blast™, our new carbonated soft
drink that combines the flavor and energy of Mountain Dew with a bold tropical lime blast, available only at participating Taco Bell
restaurants. Another industry first was Taco Bell becoming the “Official Quick Service Restaurant” of Major League Baseball®
(MLB).* Our exciting three-year partnership includes advertising, on-site signage and fan promotions during MLB™ events.
   So in 2005, we’re going to build on our success and continue to: put our People first so they can be great Customer Maniacs;
get better and better at Execution; and deliver that “Taco Bell taste” and spirit that keep our customers coming back for more!
                                                     *Major League Baseball trademarks and copyrights are used with the permission of Major League Baseball Properties, Inc.


EMIL BROLICK, PRESIDENT AND CHIEF CONCEPT OFFICER, TACO BELL
18
Gather ’Round the Good Stuff ®
                      In 2004, Pizza Hut gave us even more reasons to “Gather ’Round the Good Stuff,®” kicking off the year in a big
                      way by creating dinner solutions that please the entire family. The 4forAll® Pizza is a revolutionary pizza that
                      gives everyone what they want, because it’s four individually topped pizzas in one. Not only did this innovative
                      pizza drive strong same store sales growth, it was one of the most successful new product launches in Pizza
                      Hut history, with the highest consumer awareness of any new product. This success was followed closely by
                      Buffalo Chicken Pizza and our unique Fit ’N Delicious™ line of “keep it balanced” products. To further bring
                      to life our brand positioning, we introduced The Full House XL Pizza™ providing families a 30 percent bigger
pizza than a traditional large pizza (based on size comparison).
   With a focus on Customer and Sales Mania, our operators have gone all out building sales, focusing on the basics and creating
year-over-year improvement. We’ve seen sales growth for 15 straight periods and increased our market share for the first time
in 10 years. We’ve also done a great job of retaining our people and keeping our team member turnover at 100% — some of
the lowest in the industry.
   We’ve driven incremental sales too, by creating two profitable new concept layers: with 327 WingStreet™ restaurants, we
have the largest dedicated, wing delivery brand in the U.S. (based on comparison of total units vs. other national dedicated wing
brands), and we have a proven dine-in solution with 58 Pizza Hut Italian Bistro restaurants.
   2004 was a banner year, filled with differentiated products, new concept layers, and a sharp focus on operations driving same
store sales growth of 5 percent for the year. Over the past four decades, we’ve satisfied customers all around the world, serving
more than 1.7 million pizzas every day to approximately 4 million customers worldwide. Now that’s just one more reason to
“Gather ’Round the Good Stuff.”


PETER HEARL, PRESIDENT AND CHIEF CONCEPT OFFICER, PIZZA HUT
20
Chicken Capital USA
                      2004 was a year of rebuilding for KFC. The KFC team was aggressive with its plan — installing new
                      menuboards in every restaurant, adding new products to the menu and launching a new advertising
                      campaign: “Chicken Capital USA.”
                         We’re also proud to have brought back one of our most important icons to our restaurants — the Bucket.
                      Introduced in 1957 by Colonel Harland Sanders and KFC’s first franchisee, Pete Harman, the bucket
                      symbolizes the heart and soul of our brand.
                         KFC also spent the year organizing around a restaurant readiness process to build a pipeline of products
                      and promotions that will yield positive results in 2005 and beyond. The first promotion to come through
the restaurant readiness process came in December with our new Variety Bucket. Just as its name suggests, the Variety Bucket
gives customers a variety of chicken choices — our famous Kentucky Fried Chicken, Strips and Popcorn Chicken — in one
bucket. This promotion helped KFC end the year with momentum leading in to 2005.
   On the operations side KFC made improvements in speed that bumped up the brand to being named the eighth fastest drive-
thru in America, according to QSR Magazine. Harvey Brownlee joined KFC in November as Chief Operating Officer and brought
a renewed focus to building the brand through better operations. Under Harvey’s leadership, we are now testing simplified back
of house systems to help improve speed and efficiencies. Harvey is also leading our efforts to continue to grow KFC through
multibranding with our Yum! partners.
   We are excited about the progress made to rebuild KFC in 2004. In 2005, stay tuned…we have more exciting news coming
your way from Chicken Capital USA.


GREGG DEDRICK, PRESIDENT AND CHIEF CONCEPT OFFICER, KFC


                                                                                                                                    21
Get Coastal! Long John Silver’s signature battered fish and shrimp has been an “Escape from the Ordinary” since 1969.
     With the opening of 175 new points of distribution in 2004, we’ve made it more convenient than ever for seafood lovers across
     the nation to “Get Coastal.” That’s more openings than in any other year in LJS history. In fact, that seafood excitement translated
     into another record-breaking Lenten season, achieving the highest weekly sales in the brand’s history.
        While we still have work to do, we’re getting better at satisfying our customers and employees. We’ve seen customer complaints
     fall 35% and we’ve cut our drive-through speed of service time by 50 seconds. Our team member turnover continues to drop from
     232% in 2002 to 157% in 2004. We’re proud to be a leading Multibrand partner and through our operations simplicity and a
     focus on delivering outstanding core products, we’re looking forward to the possibilities in 2005. So if you love seafood, it’s time
     to “Get Coastal” at Long John Silver’s.

     Hometown Food Made Fun                        Free Root Beer Floats, curiously delicious Cheese Curds and the reintroduction
     of the famous Papa Burger were highlights for A&W Restaurants in 2004. A&W celebrated its 85th anniversary by giving
     away free Root Beer Floats and our “Hometown Food Made Fun” brand position guided marketing and operations activities all
     year — featuring new, improved menu items. Going forward, we will continue to build our brand by leveraging our history and
     equity in both single and multibrand formats.


     STEVE DAVIS, PRESIDENT, LONG JOHN SILVER’S/A&W AND Yum! MULTIBRANDING


22
23
“multibrand
  power ”
Today, we’re changing the industry with
 Multibrand innovation and providing the
 choice and convenience our customers

                                                    500+
 prefer. Yum! is the undeniable world
 leader in multibranding with over 2,600
 combination restaurants accounting for:                  new
                                                        multibrand
 More than 14% of our U.S. traditional
                                                         units in
 restaurant base with a potential to grow
                                                          2004
 to 23% in 2007
 Estimated $224 million in restaurant profits
 and franchise fees (excluding G&A expenses),
 or about 17% of the U.S. total
 Significant incremental average sales
 per units, dramatically improving our unit
 cash flows


                                                2,600+
                                                multibranded
                                                units in the
                                                                                25
                                                U.S.


                                                The bottom line is: we’re
                                                always getting better.
Multibrand average                              Whether we’re improving
                                                our people capability,
unit volumes are typically                      simplifying our back of the
                                                house systems, or value-
$250,000 a year higher                          engineering our facilities
                                                and creating more exciting
                                                designs, it’s for one reason
than single-brand restaurants.                  only: our customers. With all
                                                that choice and convenience
                                                under one roof, it’s an
                                                undeniable win!
M
C
    H


        A
MAINTENANCE                                   PRODUCT QUALITY                            SPEED OF SERVICE
                   “We’re always ready                                How do you say                            Don’t blink. You
for our customers.” That’s how 19-year        Yum? Just ask RGM Diane Oney. This         might miss RGM Abul Azad making
veteran RGM Jim Gribble runs his restau-      28-year veteran drives a passionate        things happen — fast. Abul runs one
rant and keeps it humming. Last year          Customer Mania culture in her restaurant   of KFC’s best restaurants! In 2004, he
he boosted sales by 32%! Jim is always        with consistent CHAMPS scores in the       maintained a 97% CHAMPS average and
running a great restaurant and serving        high 90’s. Just listen to the rings of     a near-perfect 5.0 Balanced Scorecard.
up delicious root beer floats with a smile.   satisfaction on the Long John Silver’s     Abul constantly reinforces CHAMPS with
Jim Gribble, A&W All American Food,           bell in her lobby. Ring!                   a Yes! — serving up his special brand of
Daugharthy, Inc. franchisee                   Diane Oney, Long John Silver’s,            Customer Mania — in a snap.
                                              Sterling Silver Restaurants franchisee     Abul Azad, KFC


                                                                                                                        S


P
“customer
                   mania
           power”
26


     C             H             A          M             P         S
     Cleanliness   Hospitality   Accuracy   Maintenance   Product   Speed of
                                                          Quality   Service
The power of our people is our secret ingredient, and
                    what sets us apart from the competition.
              Around the world, our 850,000 Customer Maniacs
              are striving each and every day to put a smile on our
customers’ faces. At Yum! Brands, we’re building an operating culture
dedicated to 100% CHAMPS with a Yes! Attitude. It’s a daily focus
on executing the basics with passion, urgency and excellence so that
we will drive Same Store Sales Growth in every restaurant. We know
that if we put the customer first in everything we do, then we’re running
great restaurants. And when we do that, we’re driving consistent perfor-
mance year over year.
This is our fifth year of executing against our operational framework
and our fourth year of Customer and Sales Mania training every quarter
in every restaurant. Throughout our journey we have not changed our
focus, we’ve just become more maniacal about driving our unique oper-
ating culture deep to our restaurant teams. And I’m proud to report that
we’re making steady progress in our operating measures. While we still
have work to do, we’re committed to continuing our efforts to satisfy
our customers better than anyone in the industry. It’s that commitment
to Customer Mania that will take this company to the next level!
                                                                            29
Please open this page to meet some of our very best Customer Maniacs
from around the world.


DAVE DENO, CHIEF OPERATING OFFICER


                    Customer Mania = 100% CHAMPS with a Yes! Attitude
  PLEASE OPEN
Global Facts
     INTERNATIONAL
     OPERATING PROFIT BY KEY MARKET


                                                                      “power
                                                    2004
     (in millions)
     China Division                       $          205
     U.K.                                            115
     Asia Franchise                                   54
     Caribbean/Latin America Franchise                42
     Middle East/Northern Africa Franchise            23
     Continental Europe Franchise                     18
     Southern Africa Franchise                        17
     Australia                                        61


                                                                        of results”
     PH Korea                                         34
     Mexico                                            9
     Early-Stage Growth Markets (a)                  (29)
     Other Markets (b)                                52
     Headquarters General &
      Administrative Costs                            (59)
     International Division                          337
     International Operating Profit             $    542
     (a) Includes KFC Germany, KFC Netherlands, KFC France,
         Brazil and India.
     (b) Includes Japan, Canada, PH France and Poland.


     WORLDWIDE SALES
                                                                                                              5-Year
                                                               2004
     (in billions)                                                      2003    2002       2001       2000   Growth(a)
     UNITED STATES
     KFC
                                                              $ 1.4
     Company sales                                                     $ 1.4   $ 1.4   $    1.4   $    1.4    (2)%
                                                                3.6
     Franchisee sales (b)                                                3.5     3.4        3.3        3.0     5%
     PH
                                                              $ 1.6
     Company sales                                                     $ 1.6   $ 1.5   $    1.5   $    1.8    (5)%
                                                                3.6
     Franchisee sales (b)                                                3.5     3.6        3.5        3.2     5%
     TACO BELL
                                                              $ 1.7
     Company sales                                                     $ 1.6   $ 1.6   $    1.4   $    1.4      1%
                                                                4.0
     Franchisee sales (b)                                                3.8     3.6        3.5        3.7      2%
     LONG JOHN SILVER’S (c)
                                                              $ 0.5
     Company sales                                                     $ 0.5   $ 0.3         —          —      NM
30                                                              0.3
     Franchisee sales (b)                                                0.3     0.2         —          —      NM
     A&W (c)
                                                                 —        —       —          —          —      NM
                                                              $ 0.2
     Franchisee sales (b)                                              $ 0.2   $ 0.2         —          —      NM
     TOTAL U.S.
                                                              $ 5.2
     Company sales                                                     $ 5.1   $ 4.8   $    4.3   $    4.6    (2)%
                                                               11.7
     Franchisee sales (b)                                               11.3    11.0       10.3        9.9     4%
     INTERNATIONAL
     KFC
                                                              $ 1.9
     Company sales                                                     $ 1.7   $ 1.5   $    1.2   $    1.1    11%
                                                                5.3
     Franchisee sales (b)                                                4.6     3.9        3.8        3.9     9%
     PIZZA HUT
                                                              $ 0.9
     Company sales                                                     $ 0.6   $ 0.6   $    0.6   $    0.6      5%
                                                                2.6
     Franchisee sales (b)                                                2.4     2.2        2.0        2.0      7%
     TACO BELL
                                                                 —
     Company sales                                                        —       —          —          —      NM
                                                              $ 0.2
     Franchisee sales (b)                                              $ 0.1   $ 0.2   $    0.1   $    0.1     5%
     LONG JOHN SILVER’S (c)
                                                                 —
     Company sales                                                        —       —          —          —      NM
                                                                 —
     Franchisee sales (b)                                                 —       —          —          —      NM
     A&W (c)
                                                                 —
     Company sales                                                        —       —          —          —      NM
                                                              $ 0.1
     Franchisee sales (b)                                              $ 0.1      —          —          —      NM
     TOTAL INTERNATIONAL
                                                              $ 2.8
     Company sales                                                     $ 2.3   $ 2.1   $    1.8   $    1.7      9%
                                                                8.2
     Franchisee sales (b)                                                7.2     6.3        5.9        6.0      8%
     TOTAL WORLDWIDE
                                                              $ 8.0
     Company sales                                                     $ 7.4   $ 6.9   $    6.1   $    6.3      1%
                                                               19.9
     Franchisee sales (b)                                               18.5    17.3       16.2       15.9      6%
       , Inc.
Unit Information
WORLDWIDE SYSTEM UNITS
                                                                                                                                                         % B/(W)
                                                                                                                     2004                   2003         Change
                                                                                                                   7,743
Company                                                                                                                                   7,854            (1%)
                                                                                                                   1,662
Unconsolidated affiliates                                                                                                                 1,512            10%
                                                                                                                  21,858
Franchisees                                                                                                                              21,471             2%
                                                                                                                   2,345
Licensees                                                                                                                                 2,362            (1%)
                                                                                                                  33,608
Total                                                                                                                                    33,199             1%

                                                                                                                                                          5-Year
                                                                  2004             2003                 2002                 2001                2000     Growth(a) (b)

UNITED STATES
                                                             5,525
KFC                                                                              5,524                5,472                5,399               5,364         1%
                                                             7,500
Pizza Hut                                                                        7,523                7,599                7,719               7,927        (1%)
                                                             5,900
Taco Bell                                                                        5,989                6,165                6,444               6,746        (3%)
                                                             1,200
Long John Silver’s                                                               1,204                1,221                   —                   —         NM
                                                               485
A&W                                                                                576                  665                   —                   —         NM
                                                            20,610
Total U.S.(c)                                                                   20,822               21,126               19,562              20,037        (1%)

INTERNATIONAL
                                                             7,741
KFC                                                                              7,354                6,890                6,416               5,974         7%
                                                             4,774
Pizza Hut                                                                        4,560                4,431                4,272               4,157         4%
                                                               238
Taco Bell                                                                          249                  267                  239                 249         1%
                                                                34
Long John Silver’s                                                                  31                   28                   —                   —          NM
                                                               210
A&W                                                                                183                  182                   —                   —          NM
                                                            12,998
Total International (d)                                                         12,377               11,798               10,927              10,380         5%
                                                            33,608
Total (c)(d)                                                                    33,199               32,924               30,489              30,417         1%
(a) Compound annual growth rate; total U.S., International and Worldwide exclude the impact of Long John Silver’s and A&W.
(b) Compound annual growth rate excludes the impact of transferring 30 units from Taco Bell U.S. to Taco Bell International in 2002.
(c) Includes 6 and 4 Yan Can units in 2003 and 2002, respectively.
(d) Includes 1 unit in 2004 for an Asian food concept in China.


BREAKDOWN OF WORLDWIDE SYSTEM UNITS
                                                                                               Unconsolidated

                                                                                                                                                                          31
2004                                                                            Company              Affiliate          Franchised            Licensed      Total

UNITED STATES
KFC                                                                               1,248                     —              4,202                  75      5,525
Pizza Hut                                                                         1,741                     —              4,565               1,194      7,500
Taco Bell                                                                         1,283                     —              3,747                 870      5,900
Long John Silver’s                                                                  700                     —                500                  —       1,200
A&W                                                                                  17                     —                468                  —         485
Total U.S.                                                                        4,989                     —             13,482               2,139     20,610

INTERNATIONAL
KFC                                                                               1,751                  897               5,028                  65      7,741
Pizza Hut                                                                           989                  765               2,926                  94      4,774
Taco Bell                                                                            13                   —                  180                  45        238
Long John Silver’s                                                                   —                    —                   33                   1         34
A&W                                                                                  —                    —                  209                   1        210
Total International (a)                                                           2,754                1,662               8,376                 206     12,998
Total (a)                                                                         7,743                1,662              21,858               2,345     33,608
(a) Includes 1 unit in 2004 for an Asian food concept in China.


WORLDWIDE UNITS                                                    Yum! BRANDS                                                                                34
                                                                    MCDONALD’S                                                                                32
2004 (in thousands)
                                                                         SUBWAY                                                                               23
                                                                    BURGER KING                                                                               11
                                                                        WENDY’S                                                                               10
                                                                  DOMINO’S PIZZA                                                                               8
                                                                    DAIRY QUEEN                                                                                6
                                                                           AFC*                                                                                4
                                                                                    *Includes Popeye’s, Church’s, Cinnabon & Seattle’s Best Coffee
Yum! at a glance

     U.S. SALES     BY DAYPART                                          BY DISTRIBUTION CHANNEL


                        Dinner 59%                                       Dine Out 78%
                                        Lunch 35%
                        Snacks/Breakfast 6%                              Dine In 22%


                        Dinner 63%                                       Dine Out 72%
                                        Lunch 27%
                        Snacks/Breakfast 10%                             Dine In 28%


32
                                        Lunch 46%                        Dine Out 73%
                        Dinner 42%
                        Snacks/Breakfast 12%                             Dine In 27%


                        Dinner 53%                                       Dine Out 59%
                                        Lunch 44%
                        Snacks/Breakfast 3%                              Dine In 41%


                                        Lunch 48%                        Dine Out 50%
                        Dinner 32%
                        Snacks/Breakfast 20%                             Dine In 50%

                    Source: The NPD Group, Inc.; NPD Foodworld; CREST
Management’s Discussion and Analysis                                                                                Yum! Brands, Inc.


of Financial Condition and Results of Operations

INTRODUCTION AND OVERVIEW                                               Portfolio of category-leading U.S. brands
                                                                        • U.S. blended same store sales growth
                                                                        • U.S. system sales growth
YUM! Brands, Inc. and Subsidiaries (collectively referred
                                                                        Global franchise fees
to as “YUM” or the “Company”) comprises the worldwide
                                                                        • New restaurant openings by franchisees
operations of KFC, Pizza Hut, Taco Bell, Long John Silver’s
                                                                        • Franchise fee growth
(“LJS”) and A&W All-American Food Restaurants (“A&W”)
                                                                        Strong cash generation and returns
(collectively “the Concepts”) and is the world’s largest quick
                                                                        • Cash generated from all sources
service restaurant (“QSR”) company based on the number of
                                                                        • Cash generated from all sources after capital
system units. LJS and A&W were added when YUM acquired
                                                                          spending
Yorkshire Global Restaurants, Inc. (“YGR”) on May 7, 2002.
                                                                        • Restaurant margins
With 12,998 international units, YUM is the second largest
                                                                        Our progress against these measures is discussed
QSR company outside the U.S. YUM became an independent,
                                                                   throughout the Management’s Discussion and Analysis
publicly-owned company on October 6, 1997 (the “Spin-off
                                                                   (“MD&A”).
Date”) via a tax-free distribution of our Common Stock (the
                                                                        Throughout the MD&A, the Company provides the
“Distribution” or “Spin-off”) to the shareholders of our former
                                                                   percentage change excluding the impact of foreign currency
parent, PepsiCo, Inc. (“PepsiCo”).
                                                                   translation. These amounts are derived by translating current
     Through its Concepts, YUM develops, operates, franchises
                                                                   year results at prior year average exchange rates. We believe
and licenses a system of both traditional and non-traditional
                                                                   the elimination of the foreign currency translation impact
QSR restaurants. Traditional units feature dine-in, carryout
                                                                   provides better year-to-year comparability without the distor-
and, in some instances, drive-thru or delivery services. Non-
                                                                   tion of foreign currency fluctuations.
traditional units, which are typically licensed outlets, include
                                                                        This MD&A should be read in conjunction with our
express units and kiosks which have a more limited menu
                                                                   Consolidated Financial Statements on pages 47 through 50
and operate in non-traditional locations like malls, airports,
                                                                   and the Cautionary Statements on page 46. All Note refer-
gasoline service stations, convenience stores, stadiums,
                                                                   ences herein refer to the Notes to the Consolidated Financial
amusement parks and colleges, where a full-scale traditional
                                                                   Statements on pages 51 through 73. Tabular amounts are
outlet would not be practical or efficient.
                                                                   displayed in millions except per share and unit count amounts,
     The retail food industry, in which the Company competes,
                                                                   or as otherwise specifically identified.
is made up of supermarkets, supercenters, warehouse stores,
convenience stores, coffee shops, snack bars, delicatessens
                                                                   FACTORS AFFECTING COMPARABILITY OF 2004 RESULTS
and restaurants (including the QSR segment), and is intensely
                                                                   TO 2003 RESULTS AND 2003 RESULTS TO 2002 RESULTS
competitive with respect to food quality, price, service, conve-
nience, location and concept. The industry is often affected
                                                                                                                                        33
by changes in consumer tastes; national, regional or local         Lease Accounting Adjustments In late 2004 and early
economic conditions; currency fluctuations; demographic            2005, a number of companies within the QSR industry
trends; traffic patterns; the type, number and location of         announced adjustments to their accounting for leases and
competing food retailers and products; and disposable              the depreciation of leasehold improvements. In consultation
purchasing power. Each of the Concepts competes with inter-        with our external auditors, we also determined that an adjust-
national, national and regional restaurant chains as well as       ment was necessary to modify our accounting in these areas.
locally-owned restaurants, not only for customers, but also for    Accordingly, in the fourth quarter of 2004, we recorded an
management and hourly personnel, suitable real estate sites        adjustment such that all of our leasehold improvements are
and qualified franchisees.                                         now being depreciated over the shorter of their useful lives
     The Company’s key strategies are:                             or the term of the lease, including options in some instances,
     Building dominant restaurant brands in China                  over which we are recording rent expense, including escala-
     Driving profitable international expansion                    tions, on a straight-line basis.
     Improving restaurant operations                                    The cumulative adjustment, primarily through increased
     Multibranding category-leading brands                         U.S. depreciation expense, totaled $11.5 million ($7 million
     The Company is focused on five long-term measures             after tax). The portions of this adjustment that related to
identified as essential to our growth and progress. These          2004 full year and 2004 fourth quarter were approximately
five measures and related key performance indicators are as        $3 million and $1 million, respectively. As the portion of
follows:                                                           our adjustment recorded that was a correction of errors of
     International expansion                                       amounts reported in our prior period financial statements was
     • International system-sales growth (local currency)          not material to any of those prior period financial statements,
     • Number of new international restaurant openings             the entire adjustment was recorded in the 2004 Consolidated
     • Net international unit growth                               Financial Statements and no adjustment was made to any
     Multibrand innovation and expansion                           prior period financial statements. We anticipate that the
     • Number of multibrand restaurant locations                   impact of this accounting change will result in additional
     • Number of multibrand units added                            expense of $3 million in 2005.
     • Number of franchise multibrand units added
YGR Acquisition On May 7, 2002, the Company completed              cheese and meat prices, negatively impacted U.S. restaurant
     its acquisition of YGR, the parent company of LJS and A&W.         margins as a percentage of sales by approximately 160 basis
     See Note 4 for a discussion of the acquisition.                    points for the year ended December 25, 2004.
          As of the date of the acquisition, YGR consisted of 742
                                                                        Wrench Litigation We recorded income of $14 million in
     and 496 company and franchise LJS units, respectively, and
                                                                        2004 and expense of $42 million in 2003. See Note 24 for a
     127 and 742 company and franchise A&W units, respec-
                                                                        discussion of the Wrench litigation.
     tively. In addition, 133 multibranded LJS/A&W restaurants
     were included in the LJS unit totals. Except as discussed
                                                                        AmeriServe and Other Charges (Credits) We recorded
     in certain sections of the MD&A, the impact of the acquisi-
                                                                        income of $16 million in 2004, $26 million in 2003 and
     tion on our results of operations in 2003 was not significant
                                                                        $27 million in 2002. See Note 7 for a detailed discussion of
     relative to 2002.
                                                                        AmeriServe and other charges (credits).
     Amendment of Sale-Leaseback Agreements As discussed
                                                                        Store Portfolio Strategy From time to time we sell Company
     in Note 14, on August 15, 2003 we amended two sale-
                                                                        restaurants to existing and new franchisees where geographic
     leaseback agreements assumed in our 2002 acquisition of
                                                                        synergies can be obtained or where their expertise can
     YGR such that the agreements now qualify for sale-leaseback
                                                                        generally be leveraged to improve our overall operating perfor-
     accounting. Restaurant profit decreased by $5 million and
                                                                        mance, while retaining Company ownership of key U.S. and
     by $3 million in 2004 and 2003, respectively, as a result of
                                                                        International markets. Such refranchisings reduce our reported
     the two amended agreements being accounted for as oper-
                                                                        revenues and restaurant profits and increase the importance
     ating leases subsequent to the amendment. The decrease
                                                                        of system sales growth as a key performance measure.
     in restaurant profit was largely offset by a similar decrease in
                                                                             The following table summarizes our refranchising
     interest expense.
                                                                        activities:
                                                                                                                           2004           2003          2002
     Canada Unconsolidated Affiliate Dissolution On November
                                                                                                                             317
                                                                        Number of units refranchised                                       228            174
     10, 2003, we dissolved our unconsolidated affiliate that previ-
                                                                                                                           $ 140
                                                                        Refranchising proceeds, pre-tax                                    $ 92          $ 81
     ously operated 733 restaurants in Canada. We owned 50%
                                                                        Refranchising net gains, pre-tax(a)                $ 12            $4            $ 19
     of this unconsolidated affiliate prior to its dissolution and
                                                                        (a) Refranchising net gains for the year ended December 25, 2004 include charges
     accounted for our interest under the equity method. Of the             to write down our Puerto Rico business to our then estimate of its fair value and
     restaurants previously operated by the unconsolidated affil-           charges to write down certain U.S. restaurants we currently own but we have
                                                                            offered to sell at amounts lower than their carrying values. Refranchising net gains
     iate, we now operate the vast majority of Pizza Huts and Taco          for the year ended December 27, 2003 also include charges to write down our
     Bells, while almost all KFCs are operated by franchisees. As           Puerto Rico business to our then estimate of its fair value. As previously noted,
                                                                            we sold our Puerto Rico business effective October 4, 2004 for an amount approxi-
     a result of operating certain restaurants that were previously         mating its then carrying value.

34   operated by the unconsolidated affiliate, our Company sales,
     restaurant profit and general and administrative expenses          In addition to our refranchising program, from time to time
     increased and our franchise fees decreased. Additionally,          we close restaurants that are poor performing, we relocate
     on a full year basis other income increased as we recorded         restaurants to a new site within the same trade area or we
     a loss from our investment in the Canadian unconsolidated          consolidate two or more of our existing units into a single unit
     affiliate in 2003.                                                 (collectively “store closures”).
           As a result of the dissolution of our Canadian uncon-             The following table summarizes Company store closure
     solidated affiliate, Company sales increased $147 million,         activities:
     franchise fees decreased $9 million, restaurant profit                                                                 2004          2003          2002
     increased $8 million, general and administrative expenses                                                               319
                                                                        Number of units closed                                             287           224
     increased $11 million and other income increased $4 million        Store closure costs (income)(a)                      $ (3)         $6            $ 15
                                                                        Impairment charges for stores
     for the year ended December 25, 2004 compared to the year
                                                                                                                              $5
                                                                          to be closed                                                     $ 12           $9
     ended December 27, 2003. The impact on 2004 net income
     was not significant. The impact of the dissolution on our 2003     (a) Store closure income in 2004 is primarily the result of gains from the sale of
                                                                            properties on which we formerly operated restaurants.
     results was also not significant.
                                                                        The impact on operating profit arising from refranchising
     Sale of Puerto Rico Business Our Puerto Rico business was
                                                                        and Company store closures is the net of (a) the estimated
     held for sale since the fourth quarter of 2002 and was sold
                                                                        reductions in restaurant profit, which reflects the decrease in
     on October 4, 2004 for an amount approximating its then
                                                                        Company sales, and general and administrative expenses and
     carrying value. Company sales and restaurant profit decreased
                                                                        (b) the estimated increase in franchise fees from the stores
     $27 million and $4 million, respectively, franchise fees
                                                                        refranchised. The amounts presented below reflect the esti-
     increased $1 million and general and administrative expenses
                                                                        mated impact from stores that were operated by us for all
     decreased $1 million for the year ended December 25, 2004
                                                                        or some portion of the respective previous year and were no
     as compared to the year ended December 27, 2003.
                                                                        longer operated by us as of the last day of the respective year.
                                                                        The amounts do not include results from new restaurants that
     Commodity Inflation The increased cost of certain commod-
                                                                        we opened in connection with a relocation of an existing unit
     ities negatively impacted our U.S. margins for the year ended
                                                                        or any incremental impact upon consolidation of two or more
     December 25, 2004. Higher commodity costs, particularly in
                                                                        of our existing units into a single unit.
Yum! 2004 Annual Report Highlights Record Financial and Global Growth

More Related Content

What's hot

conoco phillips 2006First Quarter
conoco phillips 2006First Quarter conoco phillips 2006First Quarter
conoco phillips 2006First Quarter finance1
 
hess Annual Reports 2005
hess Annual Reports 2005hess Annual Reports 2005
hess Annual Reports 2005finance8
 
wal mart store 2000Financials
wal mart store 2000Financialswal mart store 2000Financials
wal mart store 2000Financialsfinance1
 
Q1/05Schedules_Baxter
Q1/05Schedules_BaxterQ1/05Schedules_Baxter
Q1/05Schedules_Baxterfinance24
 
williams 2004_AR
williams 2004_ARwilliams 2004_AR
williams 2004_ARfinance21
 
Duke Energy DEC_3Q04_EPS_Reconciliation
Duke Energy DEC_3Q04_EPS_ReconciliationDuke Energy DEC_3Q04_EPS_Reconciliation
Duke Energy DEC_3Q04_EPS_Reconciliationfinance21
 
conoco phillips 2005First Quarter
conoco phillips 2005First Quarterconoco phillips 2005First Quarter
conoco phillips 2005First Quarterfinance1
 
wal mart store 2001Financials
wal mart store 2001Financialswal mart store 2001Financials
wal mart store 2001Financialsfinance1
 
AR BBT Annual2005
AR BBT Annual2005AR BBT Annual2005
AR BBT Annual2005finance25
 
nordstrom R2001AR
nordstrom R2001ARnordstrom R2001AR
nordstrom R2001ARfinance43
 
integrys 2002 wpsr
integrys 2002 wpsrintegrys 2002 wpsr
integrys 2002 wpsrfinance26
 
alltel 1q 07_highlights
alltel  1q 07_highlightsalltel  1q 07_highlights
alltel 1q 07_highlightsfinance27
 
allstate 2002 Summary Annual Report
allstate 2002 Summary Annual Report allstate 2002 Summary Annual Report
allstate 2002 Summary Annual Report finance7
 
atmos enerrgy FS1Q09s
atmos enerrgy FS1Q09satmos enerrgy FS1Q09s
atmos enerrgy FS1Q09sfinance35
 

What's hot (15)

conoco phillips 2006First Quarter
conoco phillips 2006First Quarter conoco phillips 2006First Quarter
conoco phillips 2006First Quarter
 
hess Annual Reports 2005
hess Annual Reports 2005hess Annual Reports 2005
hess Annual Reports 2005
 
wal mart store 2000Financials
wal mart store 2000Financialswal mart store 2000Financials
wal mart store 2000Financials
 
Q1/05Schedules_Baxter
Q1/05Schedules_BaxterQ1/05Schedules_Baxter
Q1/05Schedules_Baxter
 
williams 2004_AR
williams 2004_ARwilliams 2004_AR
williams 2004_AR
 
Duke Energy DEC_3Q04_EPS_Reconciliation
Duke Energy DEC_3Q04_EPS_ReconciliationDuke Energy DEC_3Q04_EPS_Reconciliation
Duke Energy DEC_3Q04_EPS_Reconciliation
 
conoco phillips 2005First Quarter
conoco phillips 2005First Quarterconoco phillips 2005First Quarter
conoco phillips 2005First Quarter
 
wal mart store 2001Financials
wal mart store 2001Financialswal mart store 2001Financials
wal mart store 2001Financials
 
AR BBT Annual2005
AR BBT Annual2005AR BBT Annual2005
AR BBT Annual2005
 
nordstrom R2001AR
nordstrom R2001ARnordstrom R2001AR
nordstrom R2001AR
 
integrys 2002 wpsr
integrys 2002 wpsrintegrys 2002 wpsr
integrys 2002 wpsr
 
alltel 1q 07_highlights
alltel  1q 07_highlightsalltel  1q 07_highlights
alltel 1q 07_highlights
 
NOR2000AR
NOR2000ARNOR2000AR
NOR2000AR
 
allstate 2002 Summary Annual Report
allstate 2002 Summary Annual Report allstate 2002 Summary Annual Report
allstate 2002 Summary Annual Report
 
atmos enerrgy FS1Q09s
atmos enerrgy FS1Q09satmos enerrgy FS1Q09s
atmos enerrgy FS1Q09s
 

Viewers also liked

Yum! brand presentation
Yum! brand presentationYum! brand presentation
Yum! brand presentationJohn Chang
 
SWOT Analysis Yum! Brands,pizza hut and kfc
SWOT Analysis Yum! Brands,pizza hut and kfcSWOT Analysis Yum! Brands,pizza hut and kfc
SWOT Analysis Yum! Brands,pizza hut and kfcIsha Sharinah
 
Yum! Brands - 2014 Analyst Meeting Presentation
Yum! Brands - 2014 Analyst Meeting PresentationYum! Brands - 2014 Analyst Meeting Presentation
Yum! Brands - 2014 Analyst Meeting PresentationCompany Spotlight
 
Yum! Brands Inc. on Consumer Behavior
Yum! Brands Inc. on Consumer BehaviorYum! Brands Inc. on Consumer Behavior
Yum! Brands Inc. on Consumer BehaviorTina Salacup
 

Viewers also liked (7)

Yum foods
Yum foodsYum foods
Yum foods
 
Yum Brands Presentation
Yum Brands PresentationYum Brands Presentation
Yum Brands Presentation
 
Yum! Brands
Yum! BrandsYum! Brands
Yum! Brands
 
Yum! brand presentation
Yum! brand presentationYum! brand presentation
Yum! brand presentation
 
SWOT Analysis Yum! Brands,pizza hut and kfc
SWOT Analysis Yum! Brands,pizza hut and kfcSWOT Analysis Yum! Brands,pizza hut and kfc
SWOT Analysis Yum! Brands,pizza hut and kfc
 
Yum! Brands - 2014 Analyst Meeting Presentation
Yum! Brands - 2014 Analyst Meeting PresentationYum! Brands - 2014 Analyst Meeting Presentation
Yum! Brands - 2014 Analyst Meeting Presentation
 
Yum! Brands Inc. on Consumer Behavior
Yum! Brands Inc. on Consumer BehaviorYum! Brands Inc. on Consumer Behavior
Yum! Brands Inc. on Consumer Behavior
 

Similar to Yum! 2004 Annual Report Highlights Record Financial and Global Growth

timken 2001ar
timken 2001artimken 2001ar
timken 2001arfinance39
 
tribune earnings_q3_06_tables
tribune  earnings_q3_06_tablestribune  earnings_q3_06_tables
tribune earnings_q3_06_tablesfinance47
 
United Health Group [PDF Document] Results of Operations
United Health Group [PDF Document] Results of OperationsUnited Health Group [PDF Document] Results of Operations
United Health Group [PDF Document] Results of Operationsfinance3
 
EP1Q08OpStats_withDividendFootnote
EP1Q08OpStats_withDividendFootnoteEP1Q08OpStats_withDividendFootnote
EP1Q08OpStats_withDividendFootnotefinance49
 
energy future holindings txu2006ar
energy future holindings txu2006arenergy future holindings txu2006ar
energy future holindings txu2006arfinance29
 
energy future holindings txu2006ar
energy future holindings  txu2006arenergy future holindings  txu2006ar
energy future holindings txu2006arfinance29
 
MGMM FinHigh00
MGMM  FinHigh00MGMM  FinHigh00
MGMM FinHigh00finance29
 
tribune earnings_q2_02_tables
tribune  earnings_q2_02_tablestribune  earnings_q2_02_tables
tribune earnings_q2_02_tablesfinance47
 
Duke Energy 02/02/05_Slides
Duke Energy 02/02/05_SlidesDuke Energy 02/02/05_Slides
Duke Energy 02/02/05_Slidesfinance21
 
tribune earnings_q1_02_tables
tribune  earnings_q1_02_tablestribune  earnings_q1_02_tables
tribune earnings_q1_02_tablesfinance47
 
energy future holindingstxu2005ar
energy future holindingstxu2005arenergy future holindingstxu2005ar
energy future holindingstxu2005arfinance29
 
United Health Group Consolidated Financial Statements
United Health Group Consolidated Financial StatementsUnited Health Group Consolidated Financial Statements
United Health Group Consolidated Financial Statementsfinance3
 
Duke Energy 1Q/05_Slides
Duke Energy 1Q/05_SlidesDuke Energy 1Q/05_Slides
Duke Energy 1Q/05_Slidesfinance21
 
spectra energy 1Q2008EBITDA
spectra energy 1Q2008EBITDAspectra energy 1Q2008EBITDA
spectra energy 1Q2008EBITDAfinance49
 
walt disney Annual Report 2002
walt disney Annual Report 2002walt disney Annual Report 2002
walt disney Annual Report 2002finance7
 
citigroup July 18, 2005 - Second Quarter Press Release
citigroup July 18, 2005 - Second Quarter Press Releasecitigroup July 18, 2005 - Second Quarter Press Release
citigroup July 18, 2005 - Second Quarter Press ReleaseQuarterlyEarningsReports
 
arrow electronics annual reports 2006
arrow electronics annual reports 2006arrow electronics annual reports 2006
arrow electronics annual reports 2006finance16
 
coca cola Reconciliation of Q2 and YTD 2008 Non-GAAP Financial Measures
coca cola  	Reconciliation of Q2 and YTD 2008 Non-GAAP Financial Measurescoca cola  	Reconciliation of Q2 and YTD 2008 Non-GAAP Financial Measures
coca cola Reconciliation of Q2 and YTD 2008 Non-GAAP Financial Measuresfinance9
 
yum brands annual reports 2001
 yum brands annual reports 2001 yum brands annual reports 2001
yum brands annual reports 2001finance26
 

Similar to Yum! 2004 Annual Report Highlights Record Financial and Global Growth (20)

timken 2001ar
timken 2001artimken 2001ar
timken 2001ar
 
tribune earnings_q3_06_tables
tribune  earnings_q3_06_tablestribune  earnings_q3_06_tables
tribune earnings_q3_06_tables
 
United Health Group [PDF Document] Results of Operations
United Health Group [PDF Document] Results of OperationsUnited Health Group [PDF Document] Results of Operations
United Health Group [PDF Document] Results of Operations
 
EP1Q08OpStats_withDividendFootnote
EP1Q08OpStats_withDividendFootnoteEP1Q08OpStats_withDividendFootnote
EP1Q08OpStats_withDividendFootnote
 
energy future holindings txu2006ar
energy future holindings txu2006arenergy future holindings txu2006ar
energy future holindings txu2006ar
 
energy future holindings txu2006ar
energy future holindings  txu2006arenergy future holindings  txu2006ar
energy future holindings txu2006ar
 
MGMM FinHigh00
MGMM  FinHigh00MGMM  FinHigh00
MGMM FinHigh00
 
tribune earnings_q2_02_tables
tribune  earnings_q2_02_tablestribune  earnings_q2_02_tables
tribune earnings_q2_02_tables
 
Duke Energy 02/02/05_Slides
Duke Energy 02/02/05_SlidesDuke Energy 02/02/05_Slides
Duke Energy 02/02/05_Slides
 
tribune earnings_q1_02_tables
tribune  earnings_q1_02_tablestribune  earnings_q1_02_tables
tribune earnings_q1_02_tables
 
energy future holindingstxu2005ar
energy future holindingstxu2005arenergy future holindingstxu2005ar
energy future holindingstxu2005ar
 
United Health Group Consolidated Financial Statements
United Health Group Consolidated Financial StatementsUnited Health Group Consolidated Financial Statements
United Health Group Consolidated Financial Statements
 
Duke Energy 1Q/05_Slides
Duke Energy 1Q/05_SlidesDuke Energy 1Q/05_Slides
Duke Energy 1Q/05_Slides
 
spectra energy 1Q2008EBITDA
spectra energy 1Q2008EBITDAspectra energy 1Q2008EBITDA
spectra energy 1Q2008EBITDA
 
walt disney Annual Report 2002
walt disney Annual Report 2002walt disney Annual Report 2002
walt disney Annual Report 2002
 
citigroup July 18, 2005 - Second Quarter Press Release
citigroup July 18, 2005 - Second Quarter Press Releasecitigroup July 18, 2005 - Second Quarter Press Release
citigroup July 18, 2005 - Second Quarter Press Release
 
arrow electronics annual reports 2006
arrow electronics annual reports 2006arrow electronics annual reports 2006
arrow electronics annual reports 2006
 
coca cola Reconciliation of Q2 and YTD 2008 Non-GAAP Financial Measures
coca cola  	Reconciliation of Q2 and YTD 2008 Non-GAAP Financial Measurescoca cola  	Reconciliation of Q2 and YTD 2008 Non-GAAP Financial Measures
coca cola Reconciliation of Q2 and YTD 2008 Non-GAAP Financial Measures
 
yum brands annual reports 2001
 yum brands annual reports 2001 yum brands annual reports 2001
yum brands annual reports 2001
 
timken
timkentimken
timken
 

More from finance26

xcel energy merrill_09/16//03
xcel energy  merrill_09/16//03xcel energy  merrill_09/16//03
xcel energy merrill_09/16//03finance26
 
xcel energy merrill_09/16/03
xcel energy  merrill_09/16/03xcel energy  merrill_09/16/03
xcel energy merrill_09/16/03finance26
 
xcel energy merrill_09/16/03
xcel energy  merrill_09/16/03xcel energy  merrill_09/16/03
xcel energy merrill_09/16/03finance26
 
xcel energy BofA_09/16/03
xcel energy  BofA_09/16/03xcel energy  BofA_09/16/03
xcel energy BofA_09/16/03finance26
 
xcel energy BofA_09/16/03
xcel energy  BofA_09/16/03xcel energy  BofA_09/16/03
xcel energy BofA_09/16/03finance26
 
xcel energy BofA_09/16/03
xcel energy  BofA_09/16/03xcel energy  BofA_09/16/03
xcel energy BofA_09/16/03finance26
 

More from finance26 (20)

xcel energy merrill_09/16//03
xcel energy  merrill_09/16//03xcel energy  merrill_09/16//03
xcel energy merrill_09/16//03
 
xcel energy merrill_09/16/03
xcel energy  merrill_09/16/03xcel energy  merrill_09/16/03
xcel energy merrill_09/16/03
 
xcel energy merrill_09/16/03
xcel energy  merrill_09/16/03xcel energy  merrill_09/16/03
xcel energy merrill_09/16/03
 
xcel energy BofA_09/16/03
xcel energy  BofA_09/16/03xcel energy  BofA_09/16/03
xcel energy BofA_09/16/03
 
xcel energy BofA_09/16/03
xcel energy  BofA_09/16/03xcel energy  BofA_09/16/03
xcel energy BofA_09/16/03
 
xcel energy BofA_09/16/03
xcel energy  BofA_09/16/03xcel energy  BofA_09/16/03
xcel energy BofA_09/16/03
 
xel_102303b
xel_102303bxel_102303b
xel_102303b
 
xel_102303b
xel_102303bxel_102303b
xel_102303b
 
xel_102303b
xel_102303bxel_102303b
xel_102303b
 
xel_111403
xel_111403xel_111403
xel_111403
 
xel_111403
xel_111403xel_111403
xel_111403
 
xel_111403
xel_111403xel_111403
xel_111403
 
xel_021104
xel_021104xel_021104
xel_021104
 
xel_021104
xel_021104xel_021104
xel_021104
 
xel_021104
xel_021104xel_021104
xel_021104
 
xel_072804
xel_072804xel_072804
xel_072804
 
xel_090804
xel_090804xel_090804
xel_090804
 
xel_092404
xel_092404xel_092404
xel_092404
 
xel_092404
xel_092404xel_092404
xel_092404
 
xel_092404
xel_092404xel_092404
xel_092404
 

Recently uploaded

(中央兰开夏大学毕业证学位证成绩单-案例)
(中央兰开夏大学毕业证学位证成绩单-案例)(中央兰开夏大学毕业证学位证成绩单-案例)
(中央兰开夏大学毕业证学位证成绩单-案例)twfkn8xj
 
Bladex 1Q24 Earning Results Presentation
Bladex 1Q24 Earning Results PresentationBladex 1Q24 Earning Results Presentation
Bladex 1Q24 Earning Results PresentationBladex
 
原版1:1复刻堪萨斯大学毕业证KU毕业证留信学历认证
原版1:1复刻堪萨斯大学毕业证KU毕业证留信学历认证原版1:1复刻堪萨斯大学毕业证KU毕业证留信学历认证
原版1:1复刻堪萨斯大学毕业证KU毕业证留信学历认证jdkhjh
 
NO1 Certified Amil Baba In Lahore Kala Jadu In Lahore Best Amil In Lahore Ami...
NO1 Certified Amil Baba In Lahore Kala Jadu In Lahore Best Amil In Lahore Ami...NO1 Certified Amil Baba In Lahore Kala Jadu In Lahore Best Amil In Lahore Ami...
NO1 Certified Amil Baba In Lahore Kala Jadu In Lahore Best Amil In Lahore Ami...Amil baba
 
Overview of Inkel Unlisted Shares Price.
Overview of Inkel Unlisted Shares Price.Overview of Inkel Unlisted Shares Price.
Overview of Inkel Unlisted Shares Price.Precize Formely Leadoff
 
The Inspirational Story of Julio Herrera Velutini - Global Finance Leader
The Inspirational Story of Julio Herrera Velutini - Global Finance LeaderThe Inspirational Story of Julio Herrera Velutini - Global Finance Leader
The Inspirational Story of Julio Herrera Velutini - Global Finance LeaderArianna Varetto
 
project management information system lecture notes
project management information system lecture notesproject management information system lecture notes
project management information system lecture notesongomchris
 
House of Commons ; CDC schemes overview document
House of Commons ; CDC schemes overview documentHouse of Commons ; CDC schemes overview document
House of Commons ; CDC schemes overview documentHenry Tapper
 
Tenets of Physiocracy History of Economic
Tenets of Physiocracy History of EconomicTenets of Physiocracy History of Economic
Tenets of Physiocracy History of Economiccinemoviesu
 
Stock Market Brief Deck FOR 4/17 video.pdf
Stock Market Brief Deck FOR 4/17 video.pdfStock Market Brief Deck FOR 4/17 video.pdf
Stock Market Brief Deck FOR 4/17 video.pdfMichael Silva
 
Call Girls Near Me WhatsApp:+91-9833363713
Call Girls Near Me WhatsApp:+91-9833363713Call Girls Near Me WhatsApp:+91-9833363713
Call Girls Near Me WhatsApp:+91-9833363713Sonam Pathan
 
magnetic-pensions-a-new-blueprint-for-the-dc-landscape.pdf
magnetic-pensions-a-new-blueprint-for-the-dc-landscape.pdfmagnetic-pensions-a-new-blueprint-for-the-dc-landscape.pdf
magnetic-pensions-a-new-blueprint-for-the-dc-landscape.pdfHenry Tapper
 
fca-bsps-decision-letter-redacted (1).pdf
fca-bsps-decision-letter-redacted (1).pdffca-bsps-decision-letter-redacted (1).pdf
fca-bsps-decision-letter-redacted (1).pdfHenry Tapper
 
Kempen ' UK DB Endgame Paper Apr 24 final3.pdf
Kempen ' UK DB Endgame Paper Apr 24 final3.pdfKempen ' UK DB Endgame Paper Apr 24 final3.pdf
Kempen ' UK DB Endgame Paper Apr 24 final3.pdfHenry Tapper
 
Vp Girls near me Delhi Call Now or WhatsApp
Vp Girls near me Delhi Call Now or WhatsAppVp Girls near me Delhi Call Now or WhatsApp
Vp Girls near me Delhi Call Now or WhatsAppmiss dipika
 
Governor Olli Rehn: Dialling back monetary restraint
Governor Olli Rehn: Dialling back monetary restraintGovernor Olli Rehn: Dialling back monetary restraint
Governor Olli Rehn: Dialling back monetary restraintSuomen Pankki
 
PMFBY , Pradhan Mantri Fasal bima yojna
PMFBY , Pradhan Mantri  Fasal bima yojnaPMFBY , Pradhan Mantri  Fasal bima yojna
PMFBY , Pradhan Mantri Fasal bima yojnaDharmendra Kumar
 
The AES Investment Code - the go-to counsel for the most well-informed, wise...
The AES Investment Code -  the go-to counsel for the most well-informed, wise...The AES Investment Code -  the go-to counsel for the most well-informed, wise...
The AES Investment Code - the go-to counsel for the most well-informed, wise...AES International
 
AnyConv.com__FSS Advance Retail & Distribution - 15.06.17.ppt
AnyConv.com__FSS Advance Retail & Distribution - 15.06.17.pptAnyConv.com__FSS Advance Retail & Distribution - 15.06.17.ppt
AnyConv.com__FSS Advance Retail & Distribution - 15.06.17.pptPriyankaSharma89719
 

Recently uploaded (20)

(中央兰开夏大学毕业证学位证成绩单-案例)
(中央兰开夏大学毕业证学位证成绩单-案例)(中央兰开夏大学毕业证学位证成绩单-案例)
(中央兰开夏大学毕业证学位证成绩单-案例)
 
Bladex 1Q24 Earning Results Presentation
Bladex 1Q24 Earning Results PresentationBladex 1Q24 Earning Results Presentation
Bladex 1Q24 Earning Results Presentation
 
原版1:1复刻堪萨斯大学毕业证KU毕业证留信学历认证
原版1:1复刻堪萨斯大学毕业证KU毕业证留信学历认证原版1:1复刻堪萨斯大学毕业证KU毕业证留信学历认证
原版1:1复刻堪萨斯大学毕业证KU毕业证留信学历认证
 
NO1 Certified Amil Baba In Lahore Kala Jadu In Lahore Best Amil In Lahore Ami...
NO1 Certified Amil Baba In Lahore Kala Jadu In Lahore Best Amil In Lahore Ami...NO1 Certified Amil Baba In Lahore Kala Jadu In Lahore Best Amil In Lahore Ami...
NO1 Certified Amil Baba In Lahore Kala Jadu In Lahore Best Amil In Lahore Ami...
 
Overview of Inkel Unlisted Shares Price.
Overview of Inkel Unlisted Shares Price.Overview of Inkel Unlisted Shares Price.
Overview of Inkel Unlisted Shares Price.
 
The Inspirational Story of Julio Herrera Velutini - Global Finance Leader
The Inspirational Story of Julio Herrera Velutini - Global Finance LeaderThe Inspirational Story of Julio Herrera Velutini - Global Finance Leader
The Inspirational Story of Julio Herrera Velutini - Global Finance Leader
 
project management information system lecture notes
project management information system lecture notesproject management information system lecture notes
project management information system lecture notes
 
House of Commons ; CDC schemes overview document
House of Commons ; CDC schemes overview documentHouse of Commons ; CDC schemes overview document
House of Commons ; CDC schemes overview document
 
Tenets of Physiocracy History of Economic
Tenets of Physiocracy History of EconomicTenets of Physiocracy History of Economic
Tenets of Physiocracy History of Economic
 
Stock Market Brief Deck FOR 4/17 video.pdf
Stock Market Brief Deck FOR 4/17 video.pdfStock Market Brief Deck FOR 4/17 video.pdf
Stock Market Brief Deck FOR 4/17 video.pdf
 
Call Girls Near Me WhatsApp:+91-9833363713
Call Girls Near Me WhatsApp:+91-9833363713Call Girls Near Me WhatsApp:+91-9833363713
Call Girls Near Me WhatsApp:+91-9833363713
 
magnetic-pensions-a-new-blueprint-for-the-dc-landscape.pdf
magnetic-pensions-a-new-blueprint-for-the-dc-landscape.pdfmagnetic-pensions-a-new-blueprint-for-the-dc-landscape.pdf
magnetic-pensions-a-new-blueprint-for-the-dc-landscape.pdf
 
fca-bsps-decision-letter-redacted (1).pdf
fca-bsps-decision-letter-redacted (1).pdffca-bsps-decision-letter-redacted (1).pdf
fca-bsps-decision-letter-redacted (1).pdf
 
Kempen ' UK DB Endgame Paper Apr 24 final3.pdf
Kempen ' UK DB Endgame Paper Apr 24 final3.pdfKempen ' UK DB Endgame Paper Apr 24 final3.pdf
Kempen ' UK DB Endgame Paper Apr 24 final3.pdf
 
Vp Girls near me Delhi Call Now or WhatsApp
Vp Girls near me Delhi Call Now or WhatsAppVp Girls near me Delhi Call Now or WhatsApp
Vp Girls near me Delhi Call Now or WhatsApp
 
Governor Olli Rehn: Dialling back monetary restraint
Governor Olli Rehn: Dialling back monetary restraintGovernor Olli Rehn: Dialling back monetary restraint
Governor Olli Rehn: Dialling back monetary restraint
 
Monthly Economic Monitoring of Ukraine No 231, April 2024
Monthly Economic Monitoring of Ukraine No 231, April 2024Monthly Economic Monitoring of Ukraine No 231, April 2024
Monthly Economic Monitoring of Ukraine No 231, April 2024
 
PMFBY , Pradhan Mantri Fasal bima yojna
PMFBY , Pradhan Mantri  Fasal bima yojnaPMFBY , Pradhan Mantri  Fasal bima yojna
PMFBY , Pradhan Mantri Fasal bima yojna
 
The AES Investment Code - the go-to counsel for the most well-informed, wise...
The AES Investment Code -  the go-to counsel for the most well-informed, wise...The AES Investment Code -  the go-to counsel for the most well-informed, wise...
The AES Investment Code - the go-to counsel for the most well-informed, wise...
 
AnyConv.com__FSS Advance Retail & Distribution - 15.06.17.ppt
AnyConv.com__FSS Advance Retail & Distribution - 15.06.17.pptAnyConv.com__FSS Advance Retail & Distribution - 15.06.17.ppt
AnyConv.com__FSS Advance Retail & Distribution - 15.06.17.ppt
 

Yum! 2004 Annual Report Highlights Record Financial and Global Growth

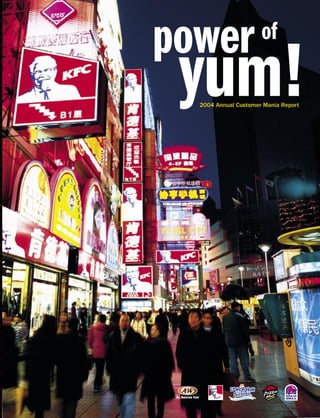
  • 1. power of yum! 2004 Annual Customer Mania Report
  • 2. financial highlights % B/(W) 2004 (In millions, except per share amounts) 2003 Change $ 7,992 Company sales $ 7,441 7 1,019 Franchise and license fees 939 8 $ 9,011 Total revenues $ 8,380 8 $ 1,155 Operating profit $ 1,059 9 $ 721 Earnings before special items $ 628 15 19 Special items, net of tax (11) NM $ 740 Net income $ 617 20 $ 14 Wrench litigation income (expense) $ (42) NM 16 AmeriServe and other (charges) credits 26 NM — Cumulative effect of accounting change (2) NM 30 Special items (18) NM (11) Income tax on special items 7 NM $ 19 Special items, net of tax $ (11) NM Diluted earnings per common share: $ 2.36 Earnings before special items $ 2.06 15 0.06 Special items, net of tax (0.04) NM $ 2.42 Reported $ 2.02 20 $ 1,131 Cash flows provided by operating activities $ 1,053 7 AVERAGE U.S. SALES PER SYSTEM UNIT(a) 2004 (In thousands) 2003 2002 2001 2000 5-year growth(b) $ 896 KFC $ 898 $ 898 $ 865 $ 833 1% 794 Pizza Hut 748 748 724 712 3% 1,069 Taco Bell 1,005 964 890 896 3% (a) Excludes license units. (b) Compound annual growth rate. TABLE OF CONTENTS 1-6 DEAR PARTNERS 20-21 KFC: CHICKEN CAPITAL U.S.A. 7 THE Yum! DYNASTY MODEL 22-23 LONG JOHN SILVER’S: GET COASTAL! 8-11 CHINA POWER A&W: HOMETOWN FOOD MADE FUN 12-13 GLOBAL POWER 24-25 MULTIBRAND POWER 14-15 BRAND POWER X5 26-29 CUSTOMER MANIA POWER: 100% CHAMPS 16-17 TACO BELL: THINK OUTSIDE THE BUN! 30-32 POWER OF RESULTS: FINANCIAL REVIEW 18-19 PIZZA HUT: GATHER ’ROUND THE GOOD STUFF 33-80 FINANCIALS Front and Back Cover: KFC and Pizza Hut in Shanghai, China
  • 3. David C. Novak, Chairman and Chief Executive Officer, pictured in his office literally filled from floor to ceiling with “customer maniac” recognition photos. 1 # Dear Partners, BUILD DOMINANT CHINA BRANDS I’m pleased to report 2004 was another year where we demon- There’s nothing like making a strategic investment in the right place at the right time and that’s exactly what strated the underlying power of we’ve done in China. With KFC and Pizza Hut, we already our global portfolio of leading have the dominant brands in the fastest growing econ- omy in the world populated with 1.3 billion people. To be restaurant brands. more specific, KFC has 1,243 quick service restaurants Fueled by continued profitable international expansion, compared to approximately 600 for McDonald’s. Pizza Hut dynamic growth in China, and strong momentum at Taco Bell has 171 casual dining restaurants and there is no other 1 and Pizza Hut in the United States, we achieved 15% earnings substantial casual dining chain in China. per share growth prior to special items. Highlights include We have an outstanding tenured team, which has worked a number of firsts: a record $1.2 billion in operating profit; together for over ten years building the business from a record $1.1 billion in cash provided by operating activities scratch. Our China Division now generates over $1 billion and a record $1.0 billion in franchise and license fees. in revenue and $200 million in operating profit, up over We also reached our goal to achieve an investment grade 20% versus a year ago. What’s more, it is our highest rating from each major rating agency after paying off return international equity business with a +20% store nearly $3 billion in debt the past seven years. Armed with level margin. In fact, China has grown to the point that increasing cash flow and a powerful balance sheet, we the team will now report into Yum! as a separate operat- increased our shareholder payout by initiating the first divi- ing division. dend in our history and buying back a record $569 million Consider the powerful competitive advantages we have in of Yum! shares. Given this overall strong performance, China. We uniquely own our own food distribution system our share price climbed 37% in 2004. We’re pleased our that gives us coverage in every major Chinese province and annual return to shareholders is 22% for the first half of has allowed us to expand KFC to over 280 cities. We also this decade. have one of the largest real estate development teams Most importantly, we remain confident we will continue of any retailer in the world that opened up over 350 new our track record of growing earnings per share at least restaurants in 2004. 10% each year. We have four powerfully unique growth Our China operations are best in class. In fact, 81% of opportunities that differentiate us from the competi- our restaurant managers have at least a college education tion and bolster our belief that we are Not Your Ordinary (the rest are just plain smart!). We also have highly sought Restaurant Company. Let me give you my perspective on after jobs with 13,000 team members. This investment in each of these strategies and hopefully you will come to infrastructure has given us an incredible opportunity and the same conclusion.
  • 4. Our China Division is our highest return international equity business generating over $1 billion in revenue and $200 million in operating profit, up over 20% versus a year ago. an incredible head start. We estimate there are already The foundation of this consistent growth comes from the 500 million urban Chinese customers who can afford our competitive advantage of the strong infrastructure we food. There’s no question, we are on the ground floor with already have in place. For this we are largely indebted an unprecedented opportunity. I liken it to the days when to PepsiCo who, prior to our spin-off in 1997, invested Colonel Sanders, Glen Bell, Dan Carney and Ray Kroc 40 years and billions of dollars to establish the global net- started KFC, Taco Bell, Pizza Hut and McDonald’s, respec- work we inherited. tively, and created fast-food categories in the U.S., leading The tough reality for our competition is that it would to 270,000 units today. We have the first mover advantage take the same kind of time and commitment to reach and the opportunity to do the same thing in China. our size and scale. The obvious exception, of course, That’s why our goal is to build dominant restaurant brands is McDonald’s. McDonald’s already makes $1.8 billion in every significant category. So, in addition to KFC and outside the U.S. demonstrating the clear profit opportu- Pizza Hut casual dining, we’ve recently developed Pizza nity we can capture in the international arena. Hut Home Service and our Taco Bell Grande dine-in format. That’s because the great reality for us is we already have The team has also enthusiastically developed and is now strong local teams and operate in approximately 100 testing East Dawning, which is a Chinese fast-food concept countries around the world with nearly 600 international that is geared to provide the everyday local favorite foods franchisees growing two popular global brands, KFC and of Chinese customers. Pizza Hut. In fact, our franchisees opened up over 80% of 2 With all the good news in China, the leading question is, the 738 new restaurants we added this year. This helps what can go wrong? Well, the past two years we’ve weath- make our international business high return because our ered SARS, the Avian Flu and events like that are always franchisees are using their capital, not ours, to grow. a possibility. And I’ll leave it to you to predict the future Our plan is to continue to leverage our big scale markets. economy or potential political issues. One thing I’m sure of We have nine countries and franchise-only business units is we’ll have our ups and some unforeseen downs but as that have over 600 restaurants each. We’re focusing our I said last year and I’ll say it again, there’s no doubt in my international company operations investment in four of mind that one day we will have more restaurants in China these countries where we are building scale and expect to than we do in the U.S. produce excellent returns over time (U.K., Australia, South China Division Key Measures: +20% operating profit growth; Korea, Mexico). The largest of these markets is the U.K. +22% system sales growth; +375 new units/year. where we have great KFC and Pizza Hut businesses. Here, we have almost 1,300 restaurants generating $115 million 2 # in operating profits with a 24% 5-year growth rate. DRIVE PROFITABLE When you look at our franchise-only business, you’ll see INTERNATIONAL EXPANSION we have nearly 4,500 restaurants generating $154 million in operating profit and a 16% 5-year growth rate. What’s Since China is now a separate division, the remainder more we have broad-based growth evidenced by the fact we of our international business is now reported excluding opened new units in 60 countries this year. our China Division. It too is a large and growing busi- Going forward, we want to continue to add at least 700 new ness. For the fifth straight year we opened up over 700 units each year and do it profitably. Consider this, excluding restaurants in countries outside of China and the U.S. The the China Division we only have 6,100 KFCs and 4,500 International Division generates over $335 million in oper- Pizza Huts compared to over 16,000 units McDonald’s has ating profit, with a solid record of growing at least 10% in in international markets outside of China. operating profits.
  • 5. On the international front we have an undeniable competitive advantage and growth opportunity with two global brands, KFC and Pizza Hut! To attack this opportunity, we are making targeted invest- a focus on “exceptional execution of the basics” which ments to develop new markets, with the goal to eventually is driving continuous improvement in both operations and get to scale in India, Brazil, Russia, France, Germany and marketing. Taco Bell has made dramatic improvement in Holland. We are especially pleased with our progress speed of service and cleanliness. And Taco Bell’s “Think in India and France. Pizza Hut is the number one most Outside the Bun” marketing campaign which features a trusted brand in India with almost 100 units and we are steady stream of product and value news continues to build now developing KFC with an offering that includes a vege- what we call “big brand momentum” with our customers. tarian menu. Pizza Hut also had strong same store sales performance, KFC in France is generating huge sales volume and good +5%. Pizza Hut did this by staying one step ahead of our unit economics so we are beginning to expand. While competition, introducing innovative new pizzas like The we’ve made some progress, we are struggling with our unit 4forALL®, The Full House XL Pizza™ and limited time economics in Germany and Holland. only offerings like Buffalo Chicken Pizza. The brand’s “Gather ‘Round the Good Stuff” advertising campaign is Developing new markets is tough because building building real traction with the heart of the pizza category consumer awareness and acceptance takes time. Just as by focusing on the family and the primary decision maker, importantly, it takes time to build local operating capability. Mom. And importantly, Pizza Hut is also steadily improving Our approach is to continue to be patient and ever mindful its operations, targeting improving delivery phone service of overall profitability and returns. The potential is obvious 3 and dine-in table service. and we are determined to build our international business the right way. Our single biggest disappointment in the U.S. was negative 2% same store sales at KFC. It would be easy to blame International Division Key Measures: +10 – 15% operating increasing competition from McDonald’s and Wendy’s profit growth; +5% system sales growth; +700 new since both had national introductions of chicken strips units/year. representing 20,000 units. But we know we can grow this 3 # brand by simply doing a much better job of marketing and BE THE BEST AT PROVIDING operations execution. One big advantage we have at Yum! BRANDED RESTAURANT CHOICE AND MULTIBRANDING GREAT is the ability to spread best practices. As a result, our new BRANDS management team is now implementing the product inno- vation and operating processes used successfully at both The foundation of our company is category-leading U.S. Taco Bell and Pizza Hut. KFC also introduced a new menu brands with proprietary products and operating systems board that lays the foundation for upcoming product and that are highly successful on a stand alone basis. Our value innovation. Much needs to be done, but we expect to strategy is to make our brands more and more powerful turn the corner this year. each year by building even more relevance, energy and Our other setback in the U.S. performance was unusu- differentiation for our customers. Let me post you on our ally high commodity inflation resulting in approximately U.S. progress. $70 million in unplanned food and paper costs. We expect Taco Bell generated 5% same store sales growth, hit the this inflation to moderate somewhat this year and to $1 million mark again for average unit volumes and is improve our U.S. profits. now the second most profitable Quick Service Restaurant U.S. Brand Key Measures: +5–7% operating profit growth; brand. We’re especially pleased that Taco Bell is becoming +1–2% blended same store sales growth. a model for consistency, growing its same store sales at least 2% the past three years. This result is coming from
  • 6. Multibranding is becoming a big business for Yum!, accounting for 14% of our U.S. traditional restaurant base and an estimated $224 million in U.S. company store profits and franchisee fees. Given the fact we are the only restaurant company to have a Our KFC/Taco Bell concept had solid same store sales portfolio of leading brands, we have the unique opportunity growth and achieved parity margins with our single brands. to offer our customers two great brands in one restaurant. Taco Bell/Long John Silver’s is showing promise with high volume and good margins. Given the results, we will begin Not surprisingly, when you think about it, our customers tell to more aggressively expand this combination. While it’s us they prefer multibranding over single brands because too early to make a call, we have expanded testing of it provides more choice and convenience under one roof. our new Long John Silver’s/A&W combos. Given the soft- For example, if someone doesn’t want chicken, they can ness in KFC’s core business, we have delayed expansion have tacos, thereby canceling a veto vote. The response of multibranding in company stores until we improve our we hear most often from our customers who experience operations. However, our best KFC franchise operators are multibranding is, “What took you so long?” continuing to develop multibrand units. As a result, multibranding is becoming a big business for After seeing the power of multibranding, our Pizza Hut team Yum!, accounting for 14% of our U.S. traditional restau- successfully created and tested its own multibranding rant base and an estimated $224 million in U.S. company concept for home delivery called WingStreet, which is a store profits and franchise fees. Sales of our new multi- tasty line of flavored bone-in and bone-out chicken wings. branding restaurants are typically $250,000 a year higher We also took the menu and learnings from our Pasta Bravo than our single brands and same store sales for restau- acquisition and created Italian Bistro as a partner brand rants opened more than a year are also higher. 4 with Pizza Hut’s traditional dine-in restaurants. Again, early To give you a historical perspective, we started with results are extremely promising. combinations of KFC/Taco Bell and Taco Bell/Pizza Hut We are now confident the potential for multibranding at Express. We learned that we were able to add significant Pizza Hut is as strong as it is for our other brands. In incremental average sales per unit, dramatically improving fact, our interests and capabilities to take advantage of unit cash flows. Our franchisees then pioneered multi- the multibranding opportunity for all our brands has never brand combinations by pairing KFC and Taco Bell with Long been greater than it is today. John Silver’s, the country’s leading quick-service seafood restaurant, and A&W All American Food, which offers pure- However, our biggest challenge for multibranding remains beef hamburgers and hot dogs along with its signature the same. We must continue to get better and better Root Beer Float. Based on outstanding customer feedback at building the operating capability to successfully run and results, we acquired Long John Silver’s and A&W in these restaurants. And the plain fact is it’s harder to run 2002. With this acquisition we significantly expanded our a restaurant with two brands. With more variety comes multibranding potential in the U.S. more complexity, so we’ve been dedicated to improving the capability of our people to deliver our customers a We can now open high return new restaurants in trade great experience. We have simplified our back of house areas that used to be too expensive or did not have systems and are reducing costs by value engineering our enough population density to allow us to go to market with facilities, while at the same time offering more exciting one brand. With multibranding, we believe we can eventu- building designs. ally take both KFC and Taco Bell to 8,000 units in the U.S. compared to the over 5,000 each we have today. Again, this is an opportunity we created and is unique to Yum! and again, we continue to have first mover advan- I’m happy to report 2004 was another year of solid prog- tage. Our operational learnings put us well ahead of the ress for multibranding.
  • 7. Whether you’re one of our smallest customers enjoying a special Chicky party, a delicious A&W hamburger and shake or a lunch date with mom, our Customer Maniacs are putting smiles on customers’ faces around the world. pack and no one else has the power to combine leading brands like we do. The challenge we have is to execute it right and more progress needs to be done before we accel- erate our growth rate. To borrow a famous phrase from the legendary basketball coach John Wooden, our strategy is to “be quick, but not hurry” so we take advantage of the unique opportunity by building the business the right way. Multibrand Key Measures: at least 550 multibranding additions per year, earning a return on company additions several points above the company’s cost of capital. 4 # RUN GREAT RESTAURANTS As I stated last year, we have pockets of operating excel- lence around the globe. For example, our operations in 5 countries like China and Australia are first class. I also wrote that we had climbed from the bottom to the middle of the pack versus competition in the U.S. I’m pleased we continued to make progress across almost all our key operating measures this year, especially at Taco Bell, but objectively we can only give ourselves no more than a C+ grade on our 2004 performance. “Mediocrity plus” clearly isn’t good enough for you or us and most importantly, it’s not good enough for our customers. In fact, our customers in the U.S. are telling us we are giving them a 100% CHAMPS experience only 53% of the time (up from 49% in 2003). CHAMPS stands for executional basics (Cleanliness, Hospitality, Accuracy, Maintenance, Product Quality and Speed) and we are only delivering the basic expectations of our customers half of the time. We realize consistent execution of our brand experience is the cornerstone to consumer trust, which is critical to consistent same store sales growth. So we’re working hard on operational enablers, like new point of sale and drive thru systems, telephone access for home delivery, and technology for back of house systems. Most importantly,
  • 8. Our formula for success is simple: put people capability first. When we do that, we’ll satisfy our customers better than anyone and generate more profits. it’s also why our single biggest global initiative is what First, we now have process and discipline around the things we’ve coined Customer Mania. Customer Mania is defined that really matter in our restaurants and in every function as delivering our customers 100% CHAMPS with a “Yes!” at our restaurant support centers. attitude every single time. We’ve been on this journey for Second, and most importantly, if you talk to our people you’d three years now training our 850,000 team members once hear a universal conviction that our distinct culture is our a quarter on how to be Customer Maniacs. biggest competitive advantage. It’s a high energy, people In fact, Ken Blanchard, the author of One Minute Manager capability-first, Customer Mania work environment that is was so impressed with the operating culture and processes centered on spirited recognition that drives performance. he learned Yum! is putting in place to create Customer There’s no doubt in my mind that continuing to build a work Mania that he wrote a book on our approach and prog- environment where everyone knows they can make a differ- ress entitled Customer Mania! It’s Never Too Late To Build A ence will make the biggest difference for shareholders Customer-Focused Company. today and tomorrow. This has been and will remain my While Ken gives us high marks on process, recognition and number one priority. leadership, he only gave us a rating of six on a scale of I’d like to thank our dedicated team members, restaurant one to 10 on having Customer Mania being executed by managers, franchise partners, and outstanding Board of our team members at our restaurants. Clearly we can do Directors for their many contributions and commitment better and we are committed to improving with urgency. to Customer Mania. I’d particularly like to thank Jamie 6 We’ve made progress and can tell you with certainty we Dimon and Sidney Kohl who retired from our board this have the people, tools and processes to make a lot more. year, and Pete Bassi, who retired as the President of Yum! Our goal is to run the best restaurants in the business and Restaurants International. Jamie, Sidney and Pete made we are on a march to make it happen. Just think what we lasting contributions to the formation and growth of our can do as we take our operations from mediocre to good company. I would also like to thank Bonnie Hill, David to great. Our best run restaurants always make more sales Grissom, Dave Dorman and Jon Linen for the contributions and profits so the payoff will come. they are making as our newest board members. Operations Key Measures: 100% CHAMPS with a “Yes!” We have the power of Yum! and the unique growth oppor- attitude in Every Store and Same Store Sales Growth in tunities to build one of the world’s most consistent and Every Store. highest performing companies. I hope you agree we are Going forward, we are galvanized around building what anything but your ordinary restaurant company. we call the Yum! Dynasty, driving consistent results year Yum! to You! after year, which as you know, is the hallmark of truly great companies. On the next page, you can see the roadmap we’ve laid out for dynasty-like performance, along with handwritten comments I always include in my New Year’s letter to our restaurant teams. David C. Novak I’m often asked by investors what I see going on in our Chairman and Chief Executive Officer company that they don’t see. What you can’t see in the numbers is the quality way in which we are achieving them.
  • 9.
  • 10. China “ power” The China business has come a long way since we started our 8 first KFC store in Beijing in 1987. Today, we are by far the largest restaurant company — and a pioneer of franchising — in China. And we’ve only just begun. Over the last four years we’ve been adding restaurants at a 22% growth rate — not many restaurant companies in the world can say that. And we’re pulling away from our competi- tors with increasing margins. But why are we so successful? We have tremendous branding power, a highly educated workforce, an incredible supply-chain infrastructure, ownership of the distribution system and finally, a strong, tenured leadership team averaging 17 years of experience in the business. With a population of 5 times that of the United States and a rapidly devel- oping economy, the opportunities are unlimited. We’ve only just scratched the surface! SAM SU, PRESIDENT, Yum! RESTAURANTS CHINA Our China Division includes: Mainland China, Thailand and KFC Taiwan.
  • 11. OVER 1,900 OVER AVERAGE SALES OVER 85,000 $1.1 BILLION SYSTEM $200 MILLION PER SYSTEM UNIT EMPLOYEES IN IN REVENUE RESTAURANTS IN OPERATING OF $1.0 MILLION OVER 280 CITIES! PROFIT (U.S. DOLLARS)
  • 12. KFC IS THE LARGEST PIZZA HUT IS THE #1 CASUAL RECENTLY INTRODUCED AND FASTEST GROWING DINING BRAND IN CHINA PIZZA HUT HOME SERVICE RESTAURANT CHAIN AND TACO BELL GRANDE IN CHINA DINE-IN 1,000 RGMs celebrating the 1,000th KFC with the world’s largest “Yum!” cheer.
  • 13. KFC RGM, Din Jing, celebrating with some of her smallest customers! We served nearly a billion customers PLEASE OPEN in China alone in 2004!
  • 14. “global power” 12
  • 15. Our International Division continues to set new records in terms of revenues, profits and new unit development. In 2004, 2004, we achieved $2 billion We are proud of the strong track record of growth of the international in revenues, generated over business and we’re excited by the opportunities still in front of us. $335 million in operating $335 This combination of a solid, estab- lished international base and huge profit — up 20% — and untapped potential makes us truly unique in the restaurant business. we opened 738 new opene Each of our major equity markets — United Kingdom, Australia, South Korea and Mexico — have category- restaurants outside leading market positions and pow- erful local leadership teams. Even of the United States. with their scale, these businesses still have significant new unit poten- That brings us to an tial and exciting future prospects. So too do our franchisees which impressive 11,093 generate nearly $400 million in franchise fees. In all, nearly 600 units outside of the franchisees are building our brands across the globe. And they are as U.S. with a presence in passionate about growth as we are. Despite our current size, attrac- approximately 100 countries tive new opportunities abound. We expect growth in all of our and territories. Now that’s current markets, equity and fran- 13 chise. But, we’re also investing in undeniable growth! high potential markets where we have a modest presence today — Western Europe, Eastern Europe, India, and Brazil in particular. All in all, ours is a balanced port- folio which is delivering broad- based unit development and strong INTERNATIONAL DIVISION SYSTEM SALES(a) BY KEY MARKET growth in system sales. In 2004, Includes all operations outside the U.S., with the exception of those reported in the China Division. we opened new units in 60 coun- Year-end 2004 tries and achieved positive same U.K. 19% store sales growth in most major Asia Franchise 13% markets. We’re targeting similar Caribbean/Latin America Franchise 8% performance in 2005. Middle East/Northern Africa Franchise 5% Great brands. Motivated people. Continental Europe Franchise 6% Strong results. Huge potential. Southern Africa Franchise 4% That’s why the International busi- Australia 11% ness is the envy of our industry. PH Korea 4% Mexico 3% Early-Stage Growth Markets(b) 3% Other Markets(c) 24% International Division 100% (a) System sales represents the combined sales of GRAHAM ALLAN Company, franchise, unconsolidated affiliate and PRESIDENT Yum! RESTAURANTS license restaurants. INTERNATIONAL (b) Includes KFC Germany, KFC Netherlands, KFC France, Brazil and India. (c) Includes Japan, Canada, PH France and Poland.
  • 16. We’re the leader in the chicken, pizza, Mexican-style food and quick-service seafood categories. Mexican Taco Bell continues to invite customers to “Think Outside the Bun” with their exciting line-up of Mexican-inspired signature products. While Pizza Hut gave us even more reasons to “Gather ’Round the Good Stuff” creating dinner solutions that are pleasing the entire family. KFC is inviting customers to visit “Chicken Capital USA” to try some of the Colonel’s secret 11 herbs and spices. Long John Silver’s is giving seafood lovers the chance to “Get Coastal” with the signature seafood tastes you crave. And in 2004, A&W All-American Restaurants celebrated 85 years of satisfying customers, sharing their “Hometown Favorites Made Fun” with everyone.
  • 17. “brand power x5” 15
  • 18. 16
  • 19. Think Outside the Bun!™ 2004 was a year of significant progress for Taco Bell®. We delivered positive same store sales growth in every period — with over three consecutive years of sustained growth. Throughout the year we continued to set weekly sales records systemwide, fueled by innovative marketing and a commitment to Running Great Restaurants. We’re proud of the fact that our One System Operating Platform helped our Restaurant General Managers and their teams drive more consistent execution and greater Customer Mania. As a result, our Speed with Service improved, with QSR Magazine rating us third in the overall drive-thru experience in their 2004 Drive-Thru Survey. We also continued to deepen our people-first, recognition culture as seen by the fact that our team member turnover was down from 221% in 2001 to just 108% in 2004. And then there’s our food! Already delighting customers with our existing lineup of Mexican-inspired products, like our delicious Grilled Stuft Burritos, signature Quesadillas and Fiesta Taco Salad™ — in 2004 we invited consumers to Think Outside The Bun™ with our new Big Bell Value Menu™. Priced at just 99¢ – $1.29, customers can keep their stomachs and wallets full with items like our 1/2 lb Beef & Potato Burrito, Spicy Chicken Soft Taco, and Caramel Apple Empanada. We also had customers Drinking Outside the Bun with the introduction of Mountain Dew Baja Blast™, our new carbonated soft drink that combines the flavor and energy of Mountain Dew with a bold tropical lime blast, available only at participating Taco Bell restaurants. Another industry first was Taco Bell becoming the “Official Quick Service Restaurant” of Major League Baseball® (MLB).* Our exciting three-year partnership includes advertising, on-site signage and fan promotions during MLB™ events. So in 2005, we’re going to build on our success and continue to: put our People first so they can be great Customer Maniacs; get better and better at Execution; and deliver that “Taco Bell taste” and spirit that keep our customers coming back for more! *Major League Baseball trademarks and copyrights are used with the permission of Major League Baseball Properties, Inc. EMIL BROLICK, PRESIDENT AND CHIEF CONCEPT OFFICER, TACO BELL
  • 20. 18
  • 21. Gather ’Round the Good Stuff ® In 2004, Pizza Hut gave us even more reasons to “Gather ’Round the Good Stuff,®” kicking off the year in a big way by creating dinner solutions that please the entire family. The 4forAll® Pizza is a revolutionary pizza that gives everyone what they want, because it’s four individually topped pizzas in one. Not only did this innovative pizza drive strong same store sales growth, it was one of the most successful new product launches in Pizza Hut history, with the highest consumer awareness of any new product. This success was followed closely by Buffalo Chicken Pizza and our unique Fit ’N Delicious™ line of “keep it balanced” products. To further bring to life our brand positioning, we introduced The Full House XL Pizza™ providing families a 30 percent bigger pizza than a traditional large pizza (based on size comparison). With a focus on Customer and Sales Mania, our operators have gone all out building sales, focusing on the basics and creating year-over-year improvement. We’ve seen sales growth for 15 straight periods and increased our market share for the first time in 10 years. We’ve also done a great job of retaining our people and keeping our team member turnover at 100% — some of the lowest in the industry. We’ve driven incremental sales too, by creating two profitable new concept layers: with 327 WingStreet™ restaurants, we have the largest dedicated, wing delivery brand in the U.S. (based on comparison of total units vs. other national dedicated wing brands), and we have a proven dine-in solution with 58 Pizza Hut Italian Bistro restaurants. 2004 was a banner year, filled with differentiated products, new concept layers, and a sharp focus on operations driving same store sales growth of 5 percent for the year. Over the past four decades, we’ve satisfied customers all around the world, serving more than 1.7 million pizzas every day to approximately 4 million customers worldwide. Now that’s just one more reason to “Gather ’Round the Good Stuff.” PETER HEARL, PRESIDENT AND CHIEF CONCEPT OFFICER, PIZZA HUT
  • 22. 20
  • 23. Chicken Capital USA 2004 was a year of rebuilding for KFC. The KFC team was aggressive with its plan — installing new menuboards in every restaurant, adding new products to the menu and launching a new advertising campaign: “Chicken Capital USA.” We’re also proud to have brought back one of our most important icons to our restaurants — the Bucket. Introduced in 1957 by Colonel Harland Sanders and KFC’s first franchisee, Pete Harman, the bucket symbolizes the heart and soul of our brand. KFC also spent the year organizing around a restaurant readiness process to build a pipeline of products and promotions that will yield positive results in 2005 and beyond. The first promotion to come through the restaurant readiness process came in December with our new Variety Bucket. Just as its name suggests, the Variety Bucket gives customers a variety of chicken choices — our famous Kentucky Fried Chicken, Strips and Popcorn Chicken — in one bucket. This promotion helped KFC end the year with momentum leading in to 2005. On the operations side KFC made improvements in speed that bumped up the brand to being named the eighth fastest drive- thru in America, according to QSR Magazine. Harvey Brownlee joined KFC in November as Chief Operating Officer and brought a renewed focus to building the brand through better operations. Under Harvey’s leadership, we are now testing simplified back of house systems to help improve speed and efficiencies. Harvey is also leading our efforts to continue to grow KFC through multibranding with our Yum! partners. We are excited about the progress made to rebuild KFC in 2004. In 2005, stay tuned…we have more exciting news coming your way from Chicken Capital USA. GREGG DEDRICK, PRESIDENT AND CHIEF CONCEPT OFFICER, KFC 21
  • 24. Get Coastal! Long John Silver’s signature battered fish and shrimp has been an “Escape from the Ordinary” since 1969. With the opening of 175 new points of distribution in 2004, we’ve made it more convenient than ever for seafood lovers across the nation to “Get Coastal.” That’s more openings than in any other year in LJS history. In fact, that seafood excitement translated into another record-breaking Lenten season, achieving the highest weekly sales in the brand’s history. While we still have work to do, we’re getting better at satisfying our customers and employees. We’ve seen customer complaints fall 35% and we’ve cut our drive-through speed of service time by 50 seconds. Our team member turnover continues to drop from 232% in 2002 to 157% in 2004. We’re proud to be a leading Multibrand partner and through our operations simplicity and a focus on delivering outstanding core products, we’re looking forward to the possibilities in 2005. So if you love seafood, it’s time to “Get Coastal” at Long John Silver’s. Hometown Food Made Fun Free Root Beer Floats, curiously delicious Cheese Curds and the reintroduction of the famous Papa Burger were highlights for A&W Restaurants in 2004. A&W celebrated its 85th anniversary by giving away free Root Beer Floats and our “Hometown Food Made Fun” brand position guided marketing and operations activities all year — featuring new, improved menu items. Going forward, we will continue to build our brand by leveraging our history and equity in both single and multibrand formats. STEVE DAVIS, PRESIDENT, LONG JOHN SILVER’S/A&W AND Yum! MULTIBRANDING 22
  • 25. 23
  • 27. Today, we’re changing the industry with Multibrand innovation and providing the choice and convenience our customers 500+ prefer. Yum! is the undeniable world leader in multibranding with over 2,600 combination restaurants accounting for: new multibrand More than 14% of our U.S. traditional units in restaurant base with a potential to grow 2004 to 23% in 2007 Estimated $224 million in restaurant profits and franchise fees (excluding G&A expenses), or about 17% of the U.S. total Significant incremental average sales per units, dramatically improving our unit cash flows 2,600+ multibranded units in the 25 U.S. The bottom line is: we’re always getting better. Multibrand average Whether we’re improving our people capability, unit volumes are typically simplifying our back of the house systems, or value- $250,000 a year higher engineering our facilities and creating more exciting designs, it’s for one reason than single-brand restaurants. only: our customers. With all that choice and convenience under one roof, it’s an undeniable win!
  • 28. M C H A
  • 29. MAINTENANCE PRODUCT QUALITY SPEED OF SERVICE “We’re always ready How do you say Don’t blink. You for our customers.” That’s how 19-year Yum? Just ask RGM Diane Oney. This might miss RGM Abul Azad making veteran RGM Jim Gribble runs his restau- 28-year veteran drives a passionate things happen — fast. Abul runs one rant and keeps it humming. Last year Customer Mania culture in her restaurant of KFC’s best restaurants! In 2004, he he boosted sales by 32%! Jim is always with consistent CHAMPS scores in the maintained a 97% CHAMPS average and running a great restaurant and serving high 90’s. Just listen to the rings of a near-perfect 5.0 Balanced Scorecard. up delicious root beer floats with a smile. satisfaction on the Long John Silver’s Abul constantly reinforces CHAMPS with Jim Gribble, A&W All American Food, bell in her lobby. Ring! a Yes! — serving up his special brand of Daugharthy, Inc. franchisee Diane Oney, Long John Silver’s, Customer Mania — in a snap. Sterling Silver Restaurants franchisee Abul Azad, KFC S P
  • 30. “customer mania power” 26 C H A M P S Cleanliness Hospitality Accuracy Maintenance Product Speed of Quality Service
  • 31. The power of our people is our secret ingredient, and what sets us apart from the competition. Around the world, our 850,000 Customer Maniacs are striving each and every day to put a smile on our customers’ faces. At Yum! Brands, we’re building an operating culture dedicated to 100% CHAMPS with a Yes! Attitude. It’s a daily focus on executing the basics with passion, urgency and excellence so that we will drive Same Store Sales Growth in every restaurant. We know that if we put the customer first in everything we do, then we’re running great restaurants. And when we do that, we’re driving consistent perfor- mance year over year. This is our fifth year of executing against our operational framework and our fourth year of Customer and Sales Mania training every quarter in every restaurant. Throughout our journey we have not changed our focus, we’ve just become more maniacal about driving our unique oper- ating culture deep to our restaurant teams. And I’m proud to report that we’re making steady progress in our operating measures. While we still have work to do, we’re committed to continuing our efforts to satisfy our customers better than anyone in the industry. It’s that commitment to Customer Mania that will take this company to the next level! 29 Please open this page to meet some of our very best Customer Maniacs from around the world. DAVE DENO, CHIEF OPERATING OFFICER Customer Mania = 100% CHAMPS with a Yes! Attitude PLEASE OPEN
  • 32. Global Facts INTERNATIONAL OPERATING PROFIT BY KEY MARKET “power 2004 (in millions) China Division $ 205 U.K. 115 Asia Franchise 54 Caribbean/Latin America Franchise 42 Middle East/Northern Africa Franchise 23 Continental Europe Franchise 18 Southern Africa Franchise 17 Australia 61 of results” PH Korea 34 Mexico 9 Early-Stage Growth Markets (a) (29) Other Markets (b) 52 Headquarters General & Administrative Costs (59) International Division 337 International Operating Profit $ 542 (a) Includes KFC Germany, KFC Netherlands, KFC France, Brazil and India. (b) Includes Japan, Canada, PH France and Poland. WORLDWIDE SALES 5-Year 2004 (in billions) 2003 2002 2001 2000 Growth(a) UNITED STATES KFC $ 1.4 Company sales $ 1.4 $ 1.4 $ 1.4 $ 1.4 (2)% 3.6 Franchisee sales (b) 3.5 3.4 3.3 3.0 5% PH $ 1.6 Company sales $ 1.6 $ 1.5 $ 1.5 $ 1.8 (5)% 3.6 Franchisee sales (b) 3.5 3.6 3.5 3.2 5% TACO BELL $ 1.7 Company sales $ 1.6 $ 1.6 $ 1.4 $ 1.4 1% 4.0 Franchisee sales (b) 3.8 3.6 3.5 3.7 2% LONG JOHN SILVER’S (c) $ 0.5 Company sales $ 0.5 $ 0.3 — — NM 30 0.3 Franchisee sales (b) 0.3 0.2 — — NM A&W (c) — — — — — NM $ 0.2 Franchisee sales (b) $ 0.2 $ 0.2 — — NM TOTAL U.S. $ 5.2 Company sales $ 5.1 $ 4.8 $ 4.3 $ 4.6 (2)% 11.7 Franchisee sales (b) 11.3 11.0 10.3 9.9 4% INTERNATIONAL KFC $ 1.9 Company sales $ 1.7 $ 1.5 $ 1.2 $ 1.1 11% 5.3 Franchisee sales (b) 4.6 3.9 3.8 3.9 9% PIZZA HUT $ 0.9 Company sales $ 0.6 $ 0.6 $ 0.6 $ 0.6 5% 2.6 Franchisee sales (b) 2.4 2.2 2.0 2.0 7% TACO BELL — Company sales — — — — NM $ 0.2 Franchisee sales (b) $ 0.1 $ 0.2 $ 0.1 $ 0.1 5% LONG JOHN SILVER’S (c) — Company sales — — — — NM — Franchisee sales (b) — — — — NM A&W (c) — Company sales — — — — NM $ 0.1 Franchisee sales (b) $ 0.1 — — — NM TOTAL INTERNATIONAL $ 2.8 Company sales $ 2.3 $ 2.1 $ 1.8 $ 1.7 9% 8.2 Franchisee sales (b) 7.2 6.3 5.9 6.0 8% TOTAL WORLDWIDE $ 8.0 Company sales $ 7.4 $ 6.9 $ 6.1 $ 6.3 1% 19.9 Franchisee sales (b) 18.5 17.3 16.2 15.9 6% , Inc.
  • 33. Unit Information WORLDWIDE SYSTEM UNITS % B/(W) 2004 2003 Change 7,743 Company 7,854 (1%) 1,662 Unconsolidated affiliates 1,512 10% 21,858 Franchisees 21,471 2% 2,345 Licensees 2,362 (1%) 33,608 Total 33,199 1% 5-Year 2004 2003 2002 2001 2000 Growth(a) (b) UNITED STATES 5,525 KFC 5,524 5,472 5,399 5,364 1% 7,500 Pizza Hut 7,523 7,599 7,719 7,927 (1%) 5,900 Taco Bell 5,989 6,165 6,444 6,746 (3%) 1,200 Long John Silver’s 1,204 1,221 — — NM 485 A&W 576 665 — — NM 20,610 Total U.S.(c) 20,822 21,126 19,562 20,037 (1%) INTERNATIONAL 7,741 KFC 7,354 6,890 6,416 5,974 7% 4,774 Pizza Hut 4,560 4,431 4,272 4,157 4% 238 Taco Bell 249 267 239 249 1% 34 Long John Silver’s 31 28 — — NM 210 A&W 183 182 — — NM 12,998 Total International (d) 12,377 11,798 10,927 10,380 5% 33,608 Total (c)(d) 33,199 32,924 30,489 30,417 1% (a) Compound annual growth rate; total U.S., International and Worldwide exclude the impact of Long John Silver’s and A&W. (b) Compound annual growth rate excludes the impact of transferring 30 units from Taco Bell U.S. to Taco Bell International in 2002. (c) Includes 6 and 4 Yan Can units in 2003 and 2002, respectively. (d) Includes 1 unit in 2004 for an Asian food concept in China. BREAKDOWN OF WORLDWIDE SYSTEM UNITS Unconsolidated 31 2004 Company Affiliate Franchised Licensed Total UNITED STATES KFC 1,248 — 4,202 75 5,525 Pizza Hut 1,741 — 4,565 1,194 7,500 Taco Bell 1,283 — 3,747 870 5,900 Long John Silver’s 700 — 500 — 1,200 A&W 17 — 468 — 485 Total U.S. 4,989 — 13,482 2,139 20,610 INTERNATIONAL KFC 1,751 897 5,028 65 7,741 Pizza Hut 989 765 2,926 94 4,774 Taco Bell 13 — 180 45 238 Long John Silver’s — — 33 1 34 A&W — — 209 1 210 Total International (a) 2,754 1,662 8,376 206 12,998 Total (a) 7,743 1,662 21,858 2,345 33,608 (a) Includes 1 unit in 2004 for an Asian food concept in China. WORLDWIDE UNITS Yum! BRANDS 34 MCDONALD’S 32 2004 (in thousands) SUBWAY 23 BURGER KING 11 WENDY’S 10 DOMINO’S PIZZA 8 DAIRY QUEEN 6 AFC* 4 *Includes Popeye’s, Church’s, Cinnabon & Seattle’s Best Coffee
  • 34. Yum! at a glance U.S. SALES BY DAYPART BY DISTRIBUTION CHANNEL Dinner 59% Dine Out 78% Lunch 35% Snacks/Breakfast 6% Dine In 22% Dinner 63% Dine Out 72% Lunch 27% Snacks/Breakfast 10% Dine In 28% 32 Lunch 46% Dine Out 73% Dinner 42% Snacks/Breakfast 12% Dine In 27% Dinner 53% Dine Out 59% Lunch 44% Snacks/Breakfast 3% Dine In 41% Lunch 48% Dine Out 50% Dinner 32% Snacks/Breakfast 20% Dine In 50% Source: The NPD Group, Inc.; NPD Foodworld; CREST
  • 35. Management’s Discussion and Analysis Yum! Brands, Inc. of Financial Condition and Results of Operations INTRODUCTION AND OVERVIEW Portfolio of category-leading U.S. brands • U.S. blended same store sales growth • U.S. system sales growth YUM! Brands, Inc. and Subsidiaries (collectively referred Global franchise fees to as “YUM” or the “Company”) comprises the worldwide • New restaurant openings by franchisees operations of KFC, Pizza Hut, Taco Bell, Long John Silver’s • Franchise fee growth (“LJS”) and A&W All-American Food Restaurants (“A&W”) Strong cash generation and returns (collectively “the Concepts”) and is the world’s largest quick • Cash generated from all sources service restaurant (“QSR”) company based on the number of • Cash generated from all sources after capital system units. LJS and A&W were added when YUM acquired spending Yorkshire Global Restaurants, Inc. (“YGR”) on May 7, 2002. • Restaurant margins With 12,998 international units, YUM is the second largest Our progress against these measures is discussed QSR company outside the U.S. YUM became an independent, throughout the Management’s Discussion and Analysis publicly-owned company on October 6, 1997 (the “Spin-off (“MD&A”). Date”) via a tax-free distribution of our Common Stock (the Throughout the MD&A, the Company provides the “Distribution” or “Spin-off”) to the shareholders of our former percentage change excluding the impact of foreign currency parent, PepsiCo, Inc. (“PepsiCo”). translation. These amounts are derived by translating current Through its Concepts, YUM develops, operates, franchises year results at prior year average exchange rates. We believe and licenses a system of both traditional and non-traditional the elimination of the foreign currency translation impact QSR restaurants. Traditional units feature dine-in, carryout provides better year-to-year comparability without the distor- and, in some instances, drive-thru or delivery services. Non- tion of foreign currency fluctuations. traditional units, which are typically licensed outlets, include This MD&A should be read in conjunction with our express units and kiosks which have a more limited menu Consolidated Financial Statements on pages 47 through 50 and operate in non-traditional locations like malls, airports, and the Cautionary Statements on page 46. All Note refer- gasoline service stations, convenience stores, stadiums, ences herein refer to the Notes to the Consolidated Financial amusement parks and colleges, where a full-scale traditional Statements on pages 51 through 73. Tabular amounts are outlet would not be practical or efficient. displayed in millions except per share and unit count amounts, The retail food industry, in which the Company competes, or as otherwise specifically identified. is made up of supermarkets, supercenters, warehouse stores, convenience stores, coffee shops, snack bars, delicatessens FACTORS AFFECTING COMPARABILITY OF 2004 RESULTS and restaurants (including the QSR segment), and is intensely TO 2003 RESULTS AND 2003 RESULTS TO 2002 RESULTS competitive with respect to food quality, price, service, conve- nience, location and concept. The industry is often affected 33 by changes in consumer tastes; national, regional or local Lease Accounting Adjustments In late 2004 and early economic conditions; currency fluctuations; demographic 2005, a number of companies within the QSR industry trends; traffic patterns; the type, number and location of announced adjustments to their accounting for leases and competing food retailers and products; and disposable the depreciation of leasehold improvements. In consultation purchasing power. Each of the Concepts competes with inter- with our external auditors, we also determined that an adjust- national, national and regional restaurant chains as well as ment was necessary to modify our accounting in these areas. locally-owned restaurants, not only for customers, but also for Accordingly, in the fourth quarter of 2004, we recorded an management and hourly personnel, suitable real estate sites adjustment such that all of our leasehold improvements are and qualified franchisees. now being depreciated over the shorter of their useful lives The Company’s key strategies are: or the term of the lease, including options in some instances, Building dominant restaurant brands in China over which we are recording rent expense, including escala- Driving profitable international expansion tions, on a straight-line basis. Improving restaurant operations The cumulative adjustment, primarily through increased Multibranding category-leading brands U.S. depreciation expense, totaled $11.5 million ($7 million The Company is focused on five long-term measures after tax). The portions of this adjustment that related to identified as essential to our growth and progress. These 2004 full year and 2004 fourth quarter were approximately five measures and related key performance indicators are as $3 million and $1 million, respectively. As the portion of follows: our adjustment recorded that was a correction of errors of International expansion amounts reported in our prior period financial statements was • International system-sales growth (local currency) not material to any of those prior period financial statements, • Number of new international restaurant openings the entire adjustment was recorded in the 2004 Consolidated • Net international unit growth Financial Statements and no adjustment was made to any Multibrand innovation and expansion prior period financial statements. We anticipate that the • Number of multibrand restaurant locations impact of this accounting change will result in additional • Number of multibrand units added expense of $3 million in 2005. • Number of franchise multibrand units added
  • 36. YGR Acquisition On May 7, 2002, the Company completed cheese and meat prices, negatively impacted U.S. restaurant its acquisition of YGR, the parent company of LJS and A&W. margins as a percentage of sales by approximately 160 basis See Note 4 for a discussion of the acquisition. points for the year ended December 25, 2004. As of the date of the acquisition, YGR consisted of 742 Wrench Litigation We recorded income of $14 million in and 496 company and franchise LJS units, respectively, and 2004 and expense of $42 million in 2003. See Note 24 for a 127 and 742 company and franchise A&W units, respec- discussion of the Wrench litigation. tively. In addition, 133 multibranded LJS/A&W restaurants were included in the LJS unit totals. Except as discussed AmeriServe and Other Charges (Credits) We recorded in certain sections of the MD&A, the impact of the acquisi- income of $16 million in 2004, $26 million in 2003 and tion on our results of operations in 2003 was not significant $27 million in 2002. See Note 7 for a detailed discussion of relative to 2002. AmeriServe and other charges (credits). Amendment of Sale-Leaseback Agreements As discussed Store Portfolio Strategy From time to time we sell Company in Note 14, on August 15, 2003 we amended two sale- restaurants to existing and new franchisees where geographic leaseback agreements assumed in our 2002 acquisition of synergies can be obtained or where their expertise can YGR such that the agreements now qualify for sale-leaseback generally be leveraged to improve our overall operating perfor- accounting. Restaurant profit decreased by $5 million and mance, while retaining Company ownership of key U.S. and by $3 million in 2004 and 2003, respectively, as a result of International markets. Such refranchisings reduce our reported the two amended agreements being accounted for as oper- revenues and restaurant profits and increase the importance ating leases subsequent to the amendment. The decrease of system sales growth as a key performance measure. in restaurant profit was largely offset by a similar decrease in The following table summarizes our refranchising interest expense. activities: 2004 2003 2002 Canada Unconsolidated Affiliate Dissolution On November 317 Number of units refranchised 228 174 10, 2003, we dissolved our unconsolidated affiliate that previ- $ 140 Refranchising proceeds, pre-tax $ 92 $ 81 ously operated 733 restaurants in Canada. We owned 50% Refranchising net gains, pre-tax(a) $ 12 $4 $ 19 of this unconsolidated affiliate prior to its dissolution and (a) Refranchising net gains for the year ended December 25, 2004 include charges accounted for our interest under the equity method. Of the to write down our Puerto Rico business to our then estimate of its fair value and restaurants previously operated by the unconsolidated affil- charges to write down certain U.S. restaurants we currently own but we have offered to sell at amounts lower than their carrying values. Refranchising net gains iate, we now operate the vast majority of Pizza Huts and Taco for the year ended December 27, 2003 also include charges to write down our Bells, while almost all KFCs are operated by franchisees. As Puerto Rico business to our then estimate of its fair value. As previously noted, we sold our Puerto Rico business effective October 4, 2004 for an amount approxi- a result of operating certain restaurants that were previously mating its then carrying value. 34 operated by the unconsolidated affiliate, our Company sales, restaurant profit and general and administrative expenses In addition to our refranchising program, from time to time increased and our franchise fees decreased. Additionally, we close restaurants that are poor performing, we relocate on a full year basis other income increased as we recorded restaurants to a new site within the same trade area or we a loss from our investment in the Canadian unconsolidated consolidate two or more of our existing units into a single unit affiliate in 2003. (collectively “store closures”). As a result of the dissolution of our Canadian uncon- The following table summarizes Company store closure solidated affiliate, Company sales increased $147 million, activities: franchise fees decreased $9 million, restaurant profit 2004 2003 2002 increased $8 million, general and administrative expenses 319 Number of units closed 287 224 increased $11 million and other income increased $4 million Store closure costs (income)(a) $ (3) $6 $ 15 Impairment charges for stores for the year ended December 25, 2004 compared to the year $5 to be closed $ 12 $9 ended December 27, 2003. The impact on 2004 net income was not significant. The impact of the dissolution on our 2003 (a) Store closure income in 2004 is primarily the result of gains from the sale of properties on which we formerly operated restaurants. results was also not significant. The impact on operating profit arising from refranchising Sale of Puerto Rico Business Our Puerto Rico business was and Company store closures is the net of (a) the estimated held for sale since the fourth quarter of 2002 and was sold reductions in restaurant profit, which reflects the decrease in on October 4, 2004 for an amount approximating its then Company sales, and general and administrative expenses and carrying value. Company sales and restaurant profit decreased (b) the estimated increase in franchise fees from the stores $27 million and $4 million, respectively, franchise fees refranchised. The amounts presented below reflect the esti- increased $1 million and general and administrative expenses mated impact from stores that were operated by us for all decreased $1 million for the year ended December 25, 2004 or some portion of the respective previous year and were no as compared to the year ended December 27, 2003. longer operated by us as of the last day of the respective year. The amounts do not include results from new restaurants that Commodity Inflation The increased cost of certain commod- we opened in connection with a relocation of an existing unit ities negatively impacted our U.S. margins for the year ended or any incremental impact upon consolidation of two or more December 25, 2004. Higher commodity costs, particularly in of our existing units into a single unit.