The document is a preface for the ATLAS.ti 9 user manual. It provides information about copyright and trademarks. It notes that the latest version of the software should always be used and includes a table of contents for the manual sections.
Preface 1
ATLAS.ti 9User Manual 1
About this Manual 2
How to Use this Manual 3
Useful Resources for Getting Started 3
ATLAS.ti Account and Licence Activation 4
Requesting a Trial Version 4
Activating a Licence 4
Limited Version after Licence Expiration 8
Introduction 9
ATLAS.ti - The Knowledge Workbench 12
Some Basic Terms 12
General Steps when Working with ATLAS.ti 13
Main Concepts and Features 14
Documents and Document Groups 15
Quotations 16
Codes 17
From a Methodological Perspective 17
From a Technical Perspective 18
References 18
Memos 19
Comments 22
Groups 23
Networks 24
Nodes, Links and Relations 24
Network Manager 24
Network Editor 25
Link Manager 25
Relation Manager 25
Tools for Exploring Text Data 26
Analysis 27
Cross-Tabulation of Codes (Code Co-occurrence) 27
Code-Document Table 27
Query Tool 27
Global Filters 27
Smart Codes 27
Smart Groups 28
Team Tools 29
Project Merge 29
Clean up Redundant Codings 29
Coder Icons in the Margin Area 29
Inter-Coder Agreement 29
User Administration 29
Export 31
Word / PDF 31
Excel Export 31
Print Documents with Margin 31
QDPX Exchange Format For Projects 31
SPSS / PSPP Export 31
CONTENTS
9.0.0.214 (15.12.2021) ATLAS.ti 9 Windows - User Manual
4.
Generic Statistic Exportfor R, SAS, STATA, etc. 32
Image Files 32
Main Steps in Working with ATLAS.ti 33
Data and Project M 33
Two Principal Modes of Working 33
Data Level Work 34
Conceptual Level Work 34
Welcome Screen 36
Welcome Screen (left-hand side) 36
Welcome Screen (middle section) 36
Welcome Screen (right-hand side) 38
Creating a New Project 39
Importing an Existing Project 41
How to Import Projects 41
If the project contains Linked Media Files 43
The ATLAS.ti Interface 45
The ATLAS.ti Ribbon 45
Software Navigation 49
The Six Main Entity Types 57
Entity Managers 58
Launching an Entity Manager 58
The Split Bar 58
The Status Bar 58
Selecting Items in an Entity Manager 59
Searching 59
Context Menus 60
Sorting and Filtering 60
View Options 60
Search & Filter Options 61
The Document Manager 62
Document Manager Columns 63
The Document Manager Ribbon 64
Tools Tab 65
Search & Filter / View Tab 66
Quotation Manager 67
Quotation Manager Columns 67
Quotation Manager Ribbon 68
Search & Filter / View Tab 69
Code Manager 70
Code Manager Columns 71
Code Manager Ribbon 72
Tools Tab 73
Search & Filter 73
View Tab 74
Memo Manager 77
Memo Manager Columns 78
Memo Manager Ribbon 79
Network Manager 80
Network Manager Columns 80
CONTENTS
9.0.0.214 (15.12.2021) ATLAS.ti 9 Windows - User Manual
5.
Network Manager Ribbon81
Search & Filter / View Tab 82
Link Manager 83
Link Manager Columns for Code-Code Links 83
Link Manager Columns for Hyperlinks 84
Link Manager Ribbon 84
View Tab 85
Relation Manager 86
Relation Manager Columns 86
Relation Manager Ribbon 87
View Tab 88
Supported File Formats 89
Textual Documents 89
Transcripts 89
PDF files (Text and Graphic) 90
Images 90
Audio- and Video Documents 91
Geo Documents 91
Survey Data 91
Reference Manager Data 91
Twitter 91
Evernote 92
Adding Documents 93
What happens when you add documents to a project 93
Important note for team projects 93
How to add documents 93
Size Res 95
A Word about "Big Data" 95
Transcription 96
Preparing your Own Transcript 97
Step 1 - Add a Audio or Video File 97
Step 2 - Create a Word file 97
Step 3 - Associate the Word File 97
Step 4 - Begin to transcribe 97
Importing Transcripts in RTF or Word format 99
Step 1 - Add an Audio or Video File 99
Step 2 - Associate a Transcript 99
Synchronized Scrolling 100
Deleting an As 100
Importing Automated Transcripts in VTT and SRT format 102
How to Generate Automated Transcripts - Useful Links 103
How to Import Automated Transcripts 104
Step 1 - Add an Audio or Video File 104
Step 2 - Associate a Transcript 104
Adding a Geo Document to a Project 107
Finding a Location 107
Changing the View from Open Street Map to Bing 108
Working with Geo Documents 109
Change Map Type 109
CONTENTS
9.0.0.214 (15.12.2021) ATLAS.ti 9 Windows - User Manual
6.
Creating Geo Quotations109
Display of Geo Q 109
Activating Geo Quotations 110
Modifying a Geo quotation 110
Coding Geo Quotations 110
Creating a Geo 111
Browsing Geo Locations in Google Map 111
Working With Survey Data 112
Preparing Survey Data For Import 113
Importing Survey Data 115
Inspecting Imported Survey Data 116
Analyzing Survey Data 117
Working With Reference Manager Data 118
Importing Twitter Data 121
Automatic Coding and Linking for Tweets 122
Managing Documents 124
Loading Documents 124
Editing Documents 124
Renaming Documents 125
Deleting Documents 126
Duplicating Documents 126
Renumbering all Documents 126
Project Management 128
Opening a Project 128
Saving a Project 128
Pin to Favorites 129
Hide or Show Projects 129
Renaming a Project 131
Deleting a Project 131
Password Protection 131
ATLAS.ti Project Data is Saved to a Library 133
Working with the ATLAS.ti Library 133
Creating a Project Backup 136
Exporting a Project 136
Exporting a Partial Bundle 138
Project Transfer 139
Exporting a Partial Bundle 140
Creating a Project Snapshot 142
Where Does ATLAS.ti Store Project Data? 143
Default Locations for Files and Text Analysis Models 143
Working With Groups 144
Application of Docume 144
Application of Code Groups 147
Application of Memo Groups 148
Groups as Filters 149
Creating and Renaming Groups 151
Creating Groups in a Manager 151
Creating Groups in the Project Explorer 152
Creating Groups in a Group Manager 153
CONTENTS
9.0.0.214 (15.12.2021) ATLAS.ti 9 Windows - User Manual
7.
Creating Document Groupsin the Query Tool 155
Renaming a Group 155
Removing Group Members / Deleting Groups 156
Removing Group Members 156
Deleting Groups 157
Importing & Exporting Document Groups 158
Exporting Document Groups to Excel 159
Importing Document Groups from Excel 159
Import Document Groups Table 160
The ATLAS.ti Quotation Level 162
Creating Quotations in Text Documents 163
Quotation ID 164
Changing the Chronological Order of Quotations 164
Adding Quotation Names 164
Creating Quotations in PDF Documents 167
Creating Quotations in Image Documents 169
Creating Quotations in PDF Documents 171
Working with Multimedia Data 172
Creating Multimedia Quotations 172
Creating Multimedia Quotations while Listening / Watching 173
Coding Multimedia Quotations 174
Activating and Playing Multimedia Quotations 174
Adjusting the Size of Multimedia Quotations 175
Renaming a Multimedia Quotation 175
Capturing Snapshots of Video Frames as Image Documents 175
Working with Quotations 176
Making Use of the Quotation Names and Comments for Analytical Purposes 176
Reviewing Coded Quotations and Modify Coding 180
Displaying Quotations in Context 181
Deleting Quotations 181
Changing the Chronological Order of Quotations 182
Coding Data 183
Creating New Codes without Coding 183
Coding with a New Code 183
Applying Existing Codes 185
Document Ribbon when Coding 187
Keyboard Shortcuts For Coding 189
More Drag-And-Drop Options 189
Working with Codes 191
Modifying the Length of a Coded Segment 191
Removing a Coding 191
Replacing a Code via Drag & Drop 192
Adding, Changing and Removing Code Color 193
Renaming a Code 193
Deleting One or Multiple Code(s) 194
About Renaming, Deleting and Unlinking Codes 194
Duplicating a Code 195
Writing Code Comments 195
Creating a Code Book 196
CONTENTS
9.0.0.214 (15.12.2021) ATLAS.ti 9 Windows - User Manual
8.
Viewing Codes inCloud View or as Bar Chart 197
Retrieving Coded Data 202
From the Project Explorer, Code Manager or Code Browser 202
Simple Retrieval in the Margin Area 203
Simple AND and OR Queries in The Quotation Manager 203
Exploring Coded Data 206
Merging Codes 207
Splitting a Code 209
Mutually Exclusive Coding 210
Options 211
Working With Code Groups 212
Importing a List of Existing Codes 215
Exporting the List 216
Building a Code System 217
Benefits of a well-structured code list 217
Characteristics of a well-structured code list 217
How to Begin Building a Code System 218
Syntax for Different Types and Levels of Codes 218
The Role of Code Groups in Building a Code System 221
Moving on 221
Literature 221
About Code Trees and the Code Forest 223
Excerpt from a code forest 224
Example for the display of code trees for selected codes 224
The Margin Area 225
Margin Drag & Drop 226
Linking 226
Copying 226
Print with Margin 227
Exploring Text Data 229
Creating Word Clouds 229
Filter Tab 233
Stop and Go Lists 235
Creating Word Lists 241
Sorting Word Lists 243
Setting the Scope 243
Word List Ribbon 244
Filter Tab 245
Context Menu Options 245
Stop and Go Lists 247
Stop and Go Lists 248
Selecting a Stop List 248
Importing a Stop List 248
Cleaning up a Word Cloud 250
Creating a New Stop or Go Lists 251
Exporting a Stop or Go List 253
Creating a User-Defined Stop or Go List in Excel 254
Search & Code 256
Text Search 257
CONTENTS
9.0.0.214 (15.12.2021) ATLAS.ti 9 Windows - User Manual
9.
Carrying out atext search 257
Expert Search with Regular Expressions (regex) 261
Carrying out a text search with Regex 261
GREP Examples 262
Examples of GREP Searches 263
Named Entity Recognition (NER) 264
Reviewing Search Results 266
The Search Engine Behind NER 269
Sentiment Analysis 270
Application Examples 270
Carrying out a Sentiment Analysis 270
The Search Engine Behind the Sentiment Analysis 272
Quotation Reader 274
Analyzing Focus Groups 281
Guidelines for Preparing Focus Group Data 282
Custom Pattern 283
Example transcripts 284
Example A (pattern 1) 284
Example B (pattern 1) 284
Example C (pattern 1) 284
Example D (pattern 2) 285
Recommendation 286
Auto Coding Focus Group Speakers 287
Multimedia Data (Audio & Video) 290
Adding Multimedia Documents to a Project 290
Display of Multimedia Documents 291
Media Controls 292
Multimedia Toolbar 293
Handling Multimedia Data 295
Zooming the Time Line 295
Media Controls 295
Multimedia View Options 296
Use Arrow Keys to Navigate 296
Keyboard Shortcuts 297
Working with Multimedia Data 298
Creating Multimedia Quotations 298
Creating Multimedia Quotations while Listening / Watching 299
Coding Multimedia Quotations 300
Activating and Playing Multimedia Quotations 300
Adjusting the Size of Multimedia Quotations 301
Renaming a Multimedia Quotation 301
Capturing Snapshots of Video Frames as Image Documents 301
Multimedia Preferences 302
Autopreview 302
Memos and Comments 303
Memos 303
Differences between Memos and Comments 304
Difference between Memos and Codes 307
Working with Comments and Memos 308
CONTENTS
9.0.0.214 (15.12.2021) ATLAS.ti 9 Windows - User Manual
10.
Writing a Comment308
Creating Memos 308
Opening an Exis 309
Link 309
Converting a Memo into a Document 311
Hyperlinks 312
Representing the Rhetoric of Data 312
What Codes Can't Do 312
Mapping Hyperlinks in Networks 313
Creating Hyperlinks 314
Terminology 314
Display of Hyperlinks 314
Creating Hyperlinks in a Document 315
Creating Hyperlinks in the Quotation Manager 317
Creating Hyperlinks in the Margin Area 317
Creating Hyperlinks across Documents 317
Working with Hyperlinks 318
Traversing Hyperlinks 318
Modifying Hyperlinks 318
Editing Hyperlink Comments 319
Creating New Relations for H 320
Querying Data 321
Simple Boolean Retrieval. 321
Code-Document Table 321
Co-occurrence Analysis 321
The Query Tool 321
Smart Codes 321
Smart Groups 322
Global Filters 322
Available Operators for Querying Data 323
Boolean Operators 323
Proximity Operators 324
Semantic Operators 325
Code-Document Table 327
Running an Analysis in the Code-Document Table 327
How to read the table 328
Code-Document Table: Relative Frequencies 332
Within Group Comparison: Column Relative Frequencies 332
Across Group Comparisons: Row Relative Frequencies 332
Total Relative Frequencies 333
Code-Document Table: Normalization 334
Binarize the Results of a Code-Document Table 335
Visualizing the Code-Document Table: Sankey Diagram 336
Layout 337
Interactivity 338
Removing edges 338
Fit to Window 338
Refresh Layout 338
Auto Layout 339
CONTENTS
9.0.0.214 (15.12.2021) ATLAS.ti 9 Windows - User Manual
11.
Respect Node Placement339
Rotate Diagram 339
Display Icons 339
Link Color Mode 339
Dark / Light Background 340
Print Diagram 340
Miscellaneous 340
Code Co-Occurrence Tools 341
The Code Co-Occurrence Explorer 342
The Document Tree 343
The Code Co-Occurrence Table 344
How to Read the Table 345
Code Co-Occurrence Table Ribbon 346
Visualizing the Code Co-Occurrence Table: Sankey Diagram 348
Layout 349
Inte 349
Removing edges 350
Fit to Window 350
Refresh Layout 350
Auto Layout 350
Respect Node Placement 351
Rotate Diagram 351
Display Icons 351
Link Color Mode 351
Dark / Light Background 351
Print Diagram 352
Miscellaneous 352
Useful Links 352
Code Co-occurrence Coefficient 353
Distortion due to unequal frequencies 353
Out 354
Summary of Color Indicators 354
The Query Tool 355
How to Build a Query Using Boolean Operators 356
Example 1 356
Inspecting the Results of a Query 358
Options of the Result Pane 360
Removing or Modifying a Query 360
Example 2 360
How to Build a Query using Proximity Operators 363
How to Build a Query using a Mix of Operators 369
Example 1 369
Example 2 371
Restrict a Query to Sub Groups in your Data 373
Opening the Scope Tool 373
Changing the Scope 373
Closing the Scope Tool 373
Storing the Results of a Query 374
Creating Document Groups from Results 375
CONTENTS
9.0.0.214 (15.12.2021) ATLAS.ti 9 Windows - User Manual
12.
Query Tool Reports376
Excel Report 376
Text Report 376
Smart and Snapshot Entities 377
What are Smart Codes? 378
What you cannot do with Smart Codes 378
Working With Smart Codes 379
Creating an ORed Smart Code in the Code Manager 379
Creating a Smart Code in the Quotation Manager 379
Creating a Smart Code in the Q 380
Editing a S 380
What are Smart Groups 381
Working With Smart Groups 382
Creating a Smart Group 382
Editing a Smart Group 382
What are Snapshot Codes and Groups? 384
Snapshot Codes 384
Snapshot Groups 384
Creating Snapshots 385
Working with Global Filters 386
Creating a Global Filter 386
Code Groups as Global filter 386
Document Groups as Global Filter 390
Memo Groups as Global Filter 390
Network Groups as Global Filter 390
Setting a Global Filter 391
Creating a Global Filter 393
Setting a Global Filter 394
Display Of Globa 394
Activating / Deactivating Global Filters 394
Changing a Global Filter 394
Removing a Global Filter 394
Removing / Changing / Activating / Deactivating a Global Filter 395
Removing a Global Filter 395
Changing a Glob 395
Activating or Deactivating Global Filters 395
Global Filters in the Code Co-occurrence Table 396
Global Filters in the Code Document Table 397
ATLAS.ti Networks 398
Nodes And Links 399
Directed and Non-Directed Links 399
First and Second-Class Links 399
Why Groups Cannot be Linked 399
Relations 401
Link vs. Relation 401
ATLAS.ti Default Relations 401
Formal Properties - Some Definitions 402
The Network Editor 404
Node Types 405
CONTENTS
9.0.0.214 (15.12.2021) ATLAS.ti 9 Windows - User Manual
13.
Network View Options407
Style 407
Network Editor - Layout And Routing Options 409
Layout Options 409
Routing 411
Network Editor - Further Options 412
Changing Code Color 412
Merge Codes 412
Duplicate Codes 413
Create Groups 413
Traversing Hyperlinks in Networks 413
Basic Network Procedures 414
Creating a New Network 414
Adding Nodes to 414
Selecting Nodes 415
Opening Ad-hoc Networks 416
Linking Nodes and Entities 419
Linking via Drag & Drop 419
Linking Two Nodes Using the Ribbon Icon 420
Linking Three or More Nodes 420
Editing a Link 421
Cutting Multiple Links 423
Linking Codes to Codes, Quotations to Quotations, Memos to Memos in Managers and
Browsers
423
Linking Entities of Different Types 424
Creating & Modifying Relations 425
Creating New Relations 425
Editing Existing Relations 426
Analytic Functions in Networks 427
Add Node Neighbors 427
Code Co-Occurrence in Networks 428
Exporting Networks 430
Saving a Network as Graphic File 430
Saving a Network in the Microsoft XPS format 430
Saving a Network in PDF format 430
Team Work 431
Workflow 431
User Accounts 433
To check who is currently logged in: 433
Change the Current User 433
Creating a new user account 434
Switching user accounts 434
Merging Users 435
Setting Up a Team Project 436
Tasks of the Project Administrator 436
Team Project: Tasks for Team Members 438
Merging Projects 441
Identical Entities Explained 441
Groups are Additive 441
CONTENTS
9.0.0.214 (15.12.2021) ATLAS.ti 9 Windows - User Manual
14.
Entities with andwithout Comments 442
Handling of Deleted Entities 443
How to Merge 445
Housekeeping 450
Inter-coder Agreement (ICA) 451
Why It Matters 451
ICA - Requirements For Coding 453
Semantic Domains 453
Developing the Code System and Semantic Domains 455
Rules for Applying Codes 455
How Agreement and Disagreement is Measured 458
Example Application 459
Methods For Testing ICA 460
Percent Agreement 460
Holsti Index 461
Cohen's Kappa 461
Krippendorff's Family of Alpha Coefficients 463
Alpha binary 463
cu-alpha 463
Cu-alpha 464
Calculation of Krippendorff's Alpha 464
References 466
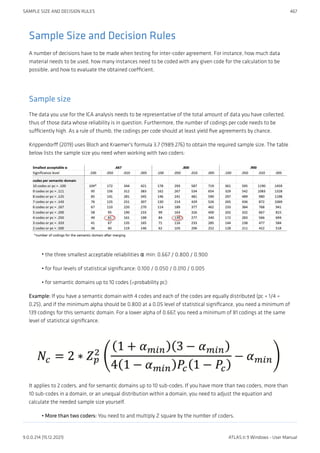
Sample Size and Decision Rules 467
Sample size 467
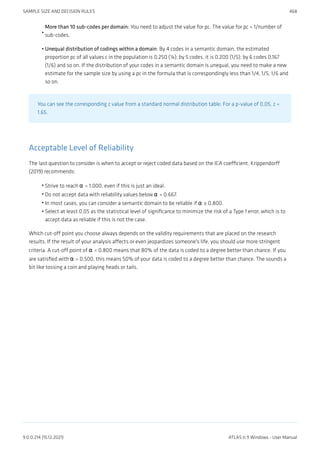
Acceptable Level of Reliability 468
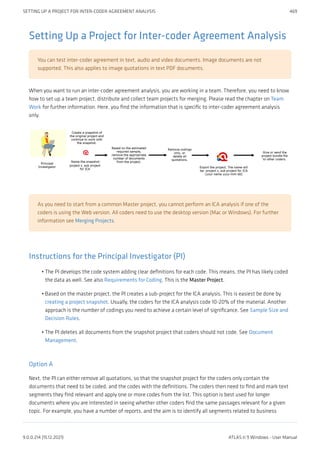
Setting Up a Project for Inter-coder Agreement Analysis 469
Instructions for the Principal Investigator (PI) 469
Instructions f 470
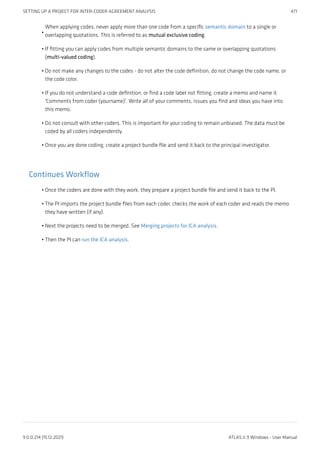
Continues Workflow 471
Merging Projects For ICA Analysis 472
Running an ICA Analysis 473
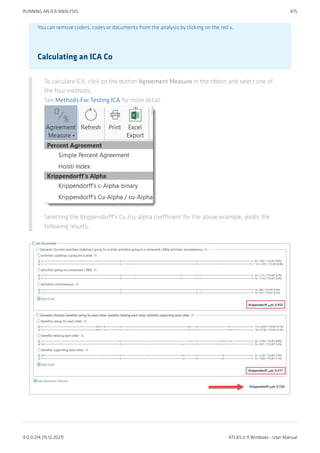
Calculating an ICA Co 475
Tools 476
Project Search 477
Searching in Selected Entities 477
Finding Redundant Codings 478
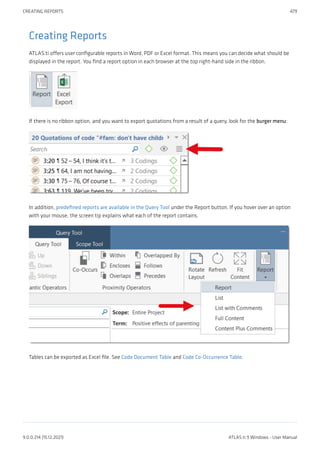
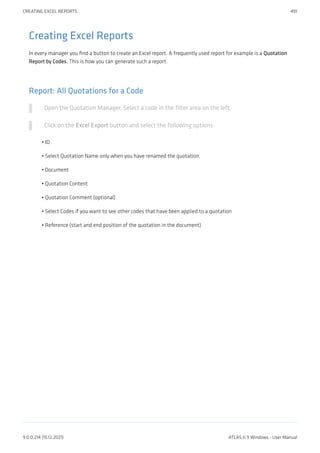
Creating Reports 479
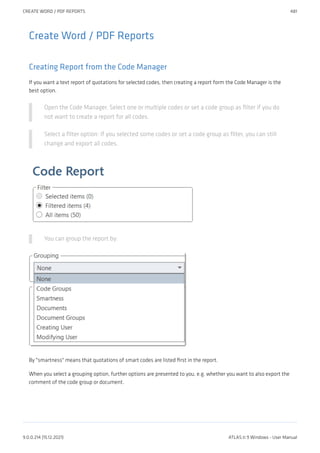
Create Word / PDF Reports 481
Creating Report from the Code Manager 481
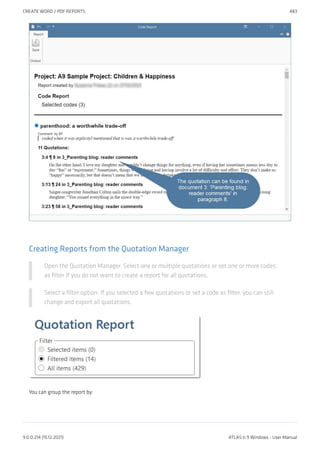
Creating Reports from the Quotation Manager 483
Document Reports 485
Memo Reports 488
Creating Excel Reports 491
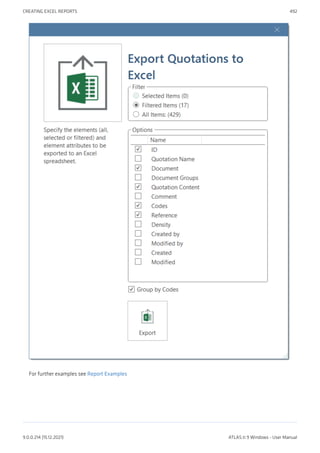
Report: All Quotations for a Code 491
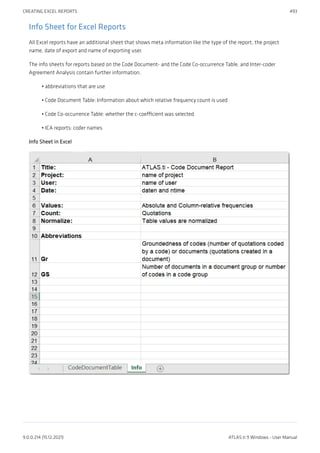
Info Sheet for Excel Reports 493
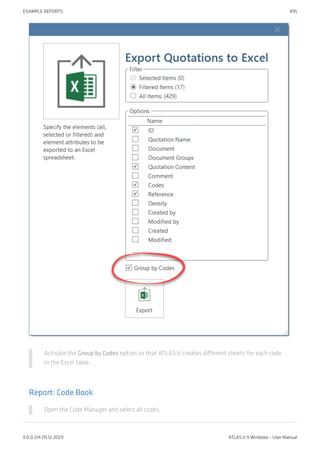
Example Reports 494
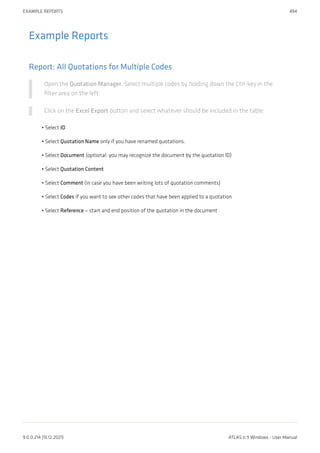
Report: All Quotations for Multiple Codes 494
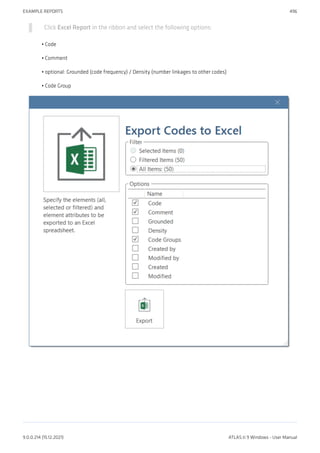
Report: Code Book 495
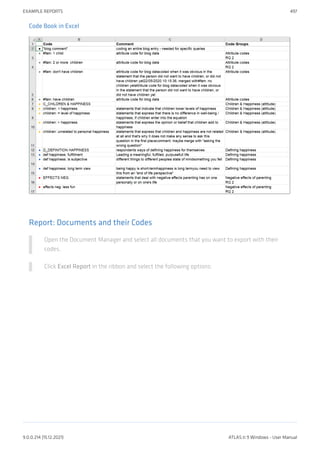
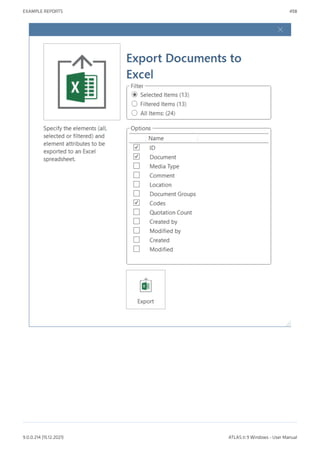
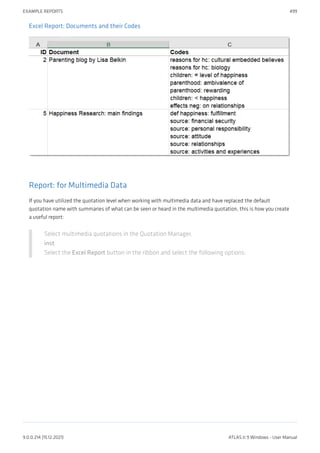
Report: Documents and their Codes 497
CONTENTS
9.0.0.214 (15.12.2021) ATLAS.ti 9 Windows - User Manual
15.
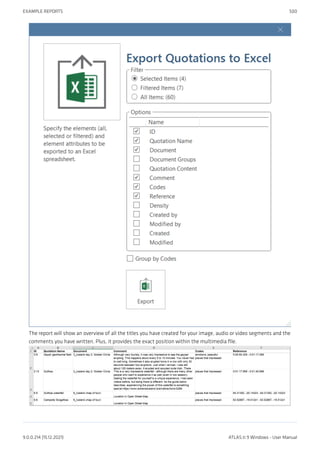
Report: for MultimediaData 499
Exporting Documents 501
To export documents: 501
To Print a Text Document / Save it in 501
Data Export For Further Statistical Analysis 502
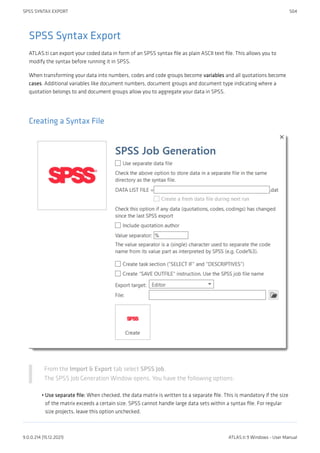
SPSS Syntax Export 504
Creating a Syntax File 504
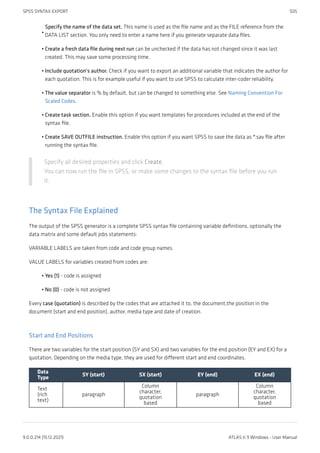
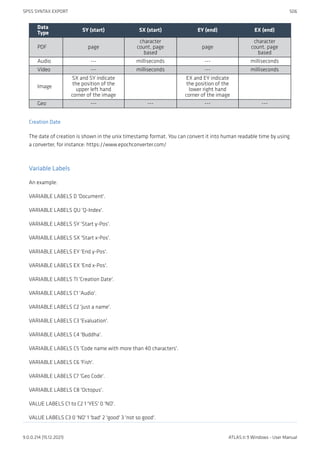
The Syntax File Explained 505
Generic Export for further Statistical Analysis 508
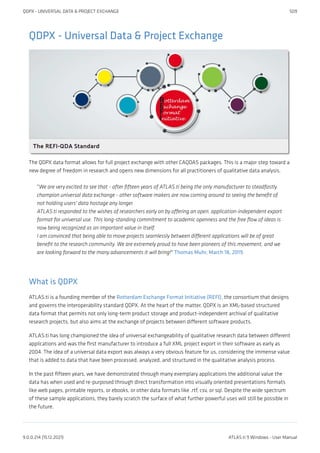
QDPX - Universal Data & Project Exchange 509
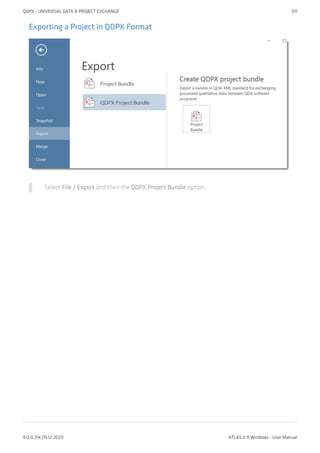
What is QDPX 509
Why is QDPX Great for You? 510
Exporting a Project in QDPX Format 511
Appendix 512
Language Settings 513
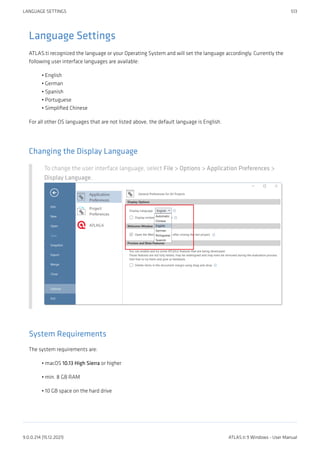
Changing the Display Language 513
System Requirements 513
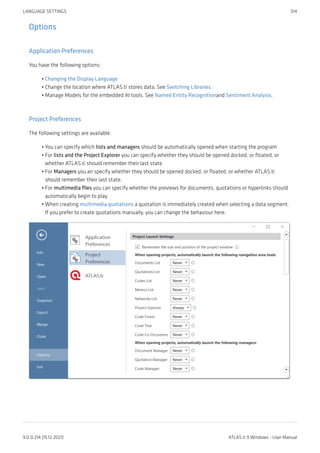
Options 514
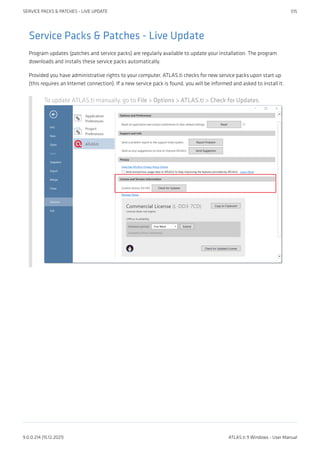
Service Packs & Patches - Live Update 515
Useful Resources 516
The ATLAS.ti Website 516
Getting Support 516
ATLAS.ti 9 - What's New 516
Video Tutorials 516
Sample Projects 516
PDF Manuals 517
Research Blog 517
Inter-coder Agreement in ATLAS.ti by Prof. Krippendorff 517
Publications 517
Get In Touch 519
Reporting A Problem 519
Sending Suggestions 519
CONTENTS
9.0.0.214 (15.12.2021) ATLAS.ti 9 Windows - User Manual
16.
About this Manual
Thismanual describes the concepts and functions of ATLAS.ti 9.
It is not required that you read the manual sequentially from the beginning to the end. Feel free to skip sections
that describe concepts you are already familiar with, jump directly to sections that describe functions you are
interested in, or simply use it as a reference guide to look up information on certain key features.
For users with no prior knowledge of ATLAS.ti, we do, however, recommend that you especially read through the
first part of this manual in order to become familiar with the concepts used by ATLAS.ti and to gain an overview of
the available functions. These are the chapters: The VISE Principle, ATLAS.ti - The Knowledge Workbench, and
Main Steps in Working with ATLAS.ti.
Further, to set up a project, we recommended that you read:
Main Steps in Working with ATLAS.ti
Starting ATLAS.ti
The ATLAS.ti Interface
Adding Documents
Project Management
For all basic-level work like creating quotations, coding, and writing memos, consult the chapters under the main
heading:
Entity Managers
Exploring Data
Working With Quotations
Coding Data
Working With Comments And Memos
Working With Groups
Advanced functions are described under:
Working With Hyperlinks
Querying Data
Working With Networks
The sequence of the chapters follows the steps that are necessary to start and work on an ATLAS.ti project: First,
the main concepts that ATLAS.ti utilizes are explained; next, an overview of all available tools is provided. These
introductory and more theoretically-oriented parts are followed by more practically-oriented chapters providing
step-by-step instructions. You will learn how to manage your data and how to set up and start a project. Once a
project is set up, the basic functions such as coding, text search, auto-coding, writing memos, etc. become
relevant. Conceptual-level functions such as the network editor, the Query Tool, and Co-occurrence Explorer build
on the data-level work (at least in most cases) and are therefore described last.
The section Useful Resources offers some useful advice on how to get support and where to find further
information on the software.
•
•
•
•
•
•
•
•
•
•
•
•
•
•
ABOUT THIS MANUAL 2
9.0.0.214 (15.12.2021) ATLAS.ti 9 Windows - User Manual
17.
How to Usethis Manual
This manual is intended for:
Those who have no prior knowledge of ATLAS.ti
Those who have worked with a previous version.
Some general familiarity with concepts and procedures relating to the Windows operating system and computing
in general (e.g., files, folders, paths) is assumed.
This is largely a technical document. You should not expect any detailed discussion of methodological aspects of
qualitative research other than cursory statements from this manual.
Useful Resources for Getting Started
To those seeking in-depth instruction on methodological aspects, the ATLAS.ti Training Center offers a full
complement of dedicated ATLAS.ti training events worldwide, both through online courses and face-to-face
seminars in nearly all parts of the world. Visit the Training Center at https://training.atlasti.com.
•
•
ABOUT THIS MANUAL 3
9.0.0.214 (15.12.2021) ATLAS.ti 9 Windows - User Manual
18.
ATLAS.ti Account andLicence Activation
For further information on Multi-User License Management, see our Guide for License Holders &
Administrators.
Requesting a Trial Version
Go to https://my.atlasti.com/ to create an account.
Confirm your email address.
Request a trial license by clicking on Trial Desktop.
This brings you to the Cleverbridge Website.
Enter the required information and download the software.
If you do not want to download the software immediately, you can always do this later in your ATLAS.ti account.
To do so, select My Applications.
The trial version can be used for 5 active days by one person on one computer within a period of 3 months.
At the end of the test period, you can continue to use ATLAS.ti with limited functionality. If your project
contains more than 10 documents, 50 quotations or 25 codes, you can no longer save any changes. Thus,
ATLAS.ti then becomes a read-only version.
You can initiate the purchase of a full licence from your ATLAS.ti account. After activating the licence, and the
program can be used again at full capacity. You can also continue to work on your project without any data loss.
You cannot install a trial version again on the same computer.
Activating a Licence
You need to make an online connection at least once to activate your licence. Once the account it activated,
you can work offline and no further online connection is required. Please note, if you are using a seat that
is part of a multi-user licence, you will blog the seat if you are offline.
ATLAS.TI ACCOUNT AND LICENCE ACTIVATION 4
9.0.0.214 (15.12.2021) ATLAS.ti 9 Windows - User Manual
19.
If you havepurchased an individual license from the ATLAS.ti web shop, your license has been added to your
account. The next step is to activate it.
Similarly, if you are a member of a team of users under a multi-user license, you have received a license key, an
invitation code, or invitation link from the person who manages the license.
The ATLAS.ti License Management System allocates seats of multi-user license dynamically. This means, you are
assigned the first free seat under your license. If all seats are occupied, you will be allocated the next seat that
opens up.
Log in to your ATLAS.ti account.
Navigate to License Management (the default page) and enter either the license key, or the
invite code that you were given by the license owner/license manager.
Click Activate License.
Start ATLAS.ti on your computer and click Check For Updated License and follow the on-
screen instructions to complete a few easy steps to activate your license.
Your installation is now activated, and you can start using ATLAS.ti.
Accessing Your Account from within ATLAS.ti
On the opening screen, click on the user avatar. If you have not added a picture yet, it will
show the first two letters of your account name.
Click on Manage Account. This takes you to the login screen. Enter your log in information
(email and password) to access your account.
ATLAS.TI ACCOUNT AND LICENCE ACTIVATION 5
9.0.0.214 (15.12.2021) ATLAS.ti 9 Windows - User Manual
20.
Logging Out
It isimportant to understand that the installation of ATLAS.ti is independent of the licencing of the
software. You can have ATLAS.ti installed on as many computers as you want. A single-user licence gives
you the right to use it on two computers, e.g. your desktop computer at the office and your laptop at
home; or your Windows computer and your Mac computer; or the Cloud version and a desktop version. If
you want to use ATLAS.ti on a third computer, or if you get a new computer, make sure you log out at the
computer that you do no longer want to use. If you have been invited to use a multi-user license, you will
have one seat for the time when using ATLAS.ti.
There are two ways how to log out to free a seat:
Click on the user avatar in the welcome screen and click Log Out and Restart.
If you forgot to log out in ATLAS.ti, you can always access your user account via a web
browser:
Go to https://my.atlasti.com/. Enter your email address and password to log in.
Select the Log Out option at the bottom left above your avatar in your ATLAS.ti account.
ATLAS.TI ACCOUNT AND LICENCE ACTIVATION 6
9.0.0.214 (15.12.2021) ATLAS.ti 9 Windows - User Manual
21.
Working Off-Line
When startingATLAS.ti, it checks whether you have a valid licence. If you know that you won't have online access
for a given period, you can set your licence to off-line work for a specified period.
If you have a licence that does not expire, the maximum off-line period is four months. If you have a lease licence,
the maximum period is dependent on the expiration date of your lease. This means, if your licence expires in 1
month, you cannot set the offline period to an additional 3 months.
To set your licence to off-line use, select Options on the Welcome Screen.
Click on the ATLAS.ti icon to review your current licence settings and select a period for
offline availability.
ATLAS.TI ACCOUNT AND LICENCE ACTIVATION 7
9.0.0.214 (15.12.2021) ATLAS.ti 9 Windows - User Manual
22.
After the periodexpired, you need to connect to the Internet again to verify your licence.
Limited Version after Licence Expiration
Once the trial period or a time limited licence expire, the program is converted into a limited version. You can open,
read and review projects, but you can only save projects that do not exceed a certain limit (see below). Thus, you
can still use ATLAS.ti as a read-only version.
You cannot install a trial version again on the same computer.
Restrictions of the Limited Version
10 primary documents
50 quotations
25 codes
2 memos
2 network views
auto backup is disabled
•
•
•
•
•
•
ATLAS.TI ACCOUNT AND LICENCE ACTIVATION 8
9.0.0.214 (15.12.2021) ATLAS.ti 9 Windows - User Manual
23.
Introduction
ATLAS.ti is apowerful workbench for the qualitative analysis of larger bodies of textual, graphical, audio, and
video data. It offers a variety of tools for accomplishing the tasks associated with any systematic approach to
unstructured data, i. e., data that cannot be meaningfully analyzed by formal, statistical approaches. In the course
of such a qualitative analysis, ATLAS.ti helps you to explore the complex phenomena hidden in your data. For
coping with the inherent complexity of the tasks and the data, ATLAS.ti offers a powerful and intuitive
environment that keeps you focused on the analyzed materials. It offers tools to manage, extract, compare,
explore, and reassemble meaningful pieces from large amounts of data in creative, flexible, yet systematic ways.
The VISE Principle
The main principles of the ATLAS.ti philosophy are best encapsulated by the acronym VISE, which stands for
Visualization
Immersion
Serendipity
Exploration
Visualization
The visualization component of the program means directly supports the way human beings think, plan, and
approach solutions in creative, yet systematic ways.
Tools are available to visualize complex properties and relations between the entities accumulated during the
process of eliciting meaning and structure from the analyzed data.
The process is designed to keep the necessary operations close to the data to which they are applied. The visual
approach of the interface keeps you focused on the data, and quite often the functions you need are just a few
mouse clicks away.
•
•
•
•
INTRODUCTION 9
9.0.0.214 (15.12.2021) ATLAS.ti 9 Windows - User Manual
24.
Immersion
Another fundamental designaspect of the software is to offer tools that allow you to become fully immersed in
your data. No matter where you are in the software, you always have access to the source data. Reading and re-
reading your data, viewing them in different ways and writing down your thoughts and ideas while you are doing
it, are important aspects of the analytical process. And, it is through this engagement with the data that you
develop creative insights.
Serendipity
Webster's Dictionary defines serendipity as a seeming gift for making fortunate discoveries accidentally. Other
meanings are: Fortunate accidents, lucky discoveries. In the context of information systems, one should add:
Finding something without having actually searched for it.
The term serendipity can be equated with an intuitive approach to data. A typical operation that relies on the
serendipity effect is browsing. This information-seeking method is a genuinely human activity: When you spend a
day in the local library (or on the World Wide Web), you often start with searching for particular books (or key
words). But after a short while, you typically find yourself increasingly engaged in browsing through books that
were not exactly what you originally had in mind - but that lead to interesting discoveries.
Examples of tools and procedures ATLAS.ti offers for exploiting the concept of serendipity are the Search & Code
Tools, the Word Clouds and Lists, the Quotation Reader, the interactive margin area, or the hypertext functionality.
INTRODUCTION 10
9.0.0.214 (15.12.2021) ATLAS.ti 9 Windows - User Manual
25.
Exploration
Exploration is closelyrelated to the above principles. Through an exploratory, yet systematic approach to your data
(as opposed to a mere bureaucratic handling), it is assumed that especially constructive activities like theory
building will be of great benefit. The entire program's concept, including the process of getting acquainted with its
particular idiosyncrasies, is particularly conducive to an exploratory, discovery-oriented approach.
Areas of Application
ATLAS.ti serves as a powerful utility for qualitative analysis of textual, graphical, audio, and video data. The
content or subject matter of these materials is in no way limited to any one particular field of scientific or scholarly
investigation.
Its emphasis is on qualitative, rather than quantitative, analysis, i. e., determining the elements that comprise the
primary data material and interpreting their meaning. A related term would be "knowledge management," which
emphasizes the transformation of data into useful knowledge.
ATLAS.ti can be of great help in any field where this kind of soft data analysis is carried out. While ATLAS.ti was
originally designed with the social scientist in mind, it is now being put to use in areas that we had not really
anticipated. Such areas include psychology, literature, medicine, software engineering, user experience research,
quality control, criminology, administration, text linguistics, stylistics, knowledge elicitation, history, geography,
theology, and law, to name just some of the more prominent.
Emerging daily are numerous new fields that can also take full advantage of the program's facilities for working
with graphical, audio, and video data. A few examples:
Anthropology: Micro-gestures, mimics, maps, geographical locations, observations, field notes
Architecture: Annotated floor plans
Art / Art History: Detailed interpretative descriptions of paintings or educational explanations of style
Business Administration: Analysis of interviews, reports, web pages
Criminology: Analysis of letters, finger prints, photographs, surveillance data
Geography and Cultural Geography: Analysis of maps, locations
Graphology: Micro comments to handwriting features.
Industrial Quality Assurance: Analyzing video taped user-system interaction
Medicine and health care practice: Analysis of X-ray images, CAT scans, microscope samples, video data of
patient care, training of health personal using video data
Media Studies: Analysis of films, TV shows, online communities
Tourism: Maps, locations, visitor reviews
Many more applications from a host of academic and professional fields are the reality. The fundamental design
objective in creating ATLAS.ti was to develop a tool that effectively supports the human interpreter, particularly in
handling relatively large amounts of research material, notes, and associated theories.
Although ATLAS.ti facilitates many of the activities involved in qualitative data analysis and interpretation
(particularly selecting, tagging data, and annotating), its purpose is not to fully automate these processes.
Automatic interpretation of text cannot succeed in grasping the complexity, lack of explicitness, or contextuality of
everyday or scientific knowledge. In fact, ATLAS.ti was designed to be more than a single tool - think of it as a
professional workbench that provides a broad selection of effective tools for a variety of problems and tasks.
•
•
•
•
•
•
•
•
•
•
•
INTRODUCTION 11
9.0.0.214 (15.12.2021) ATLAS.ti 9 Windows - User Manual
26.
ATLAS.ti - TheKnowledge Workbench
The image of ATLAS.ti as a knowledge workbench is more than just a lively analogy. Analytical work involves
tangible elements: research material requires piecework, assembly, reworking, complex layouts, and some special
tools. A well-stocked workbench provides you with the necessary instruments to thoroughly analyze and evaluate,
search and query your data, to capture, visualize and share your findings.
Some Basic Terms
To understand how ATLAS.ti handles data, visualize your entire project as an intelligent container that keeps track
of all your data. This container is your ATLAS.ti project.
The project keeps track of the paths to your source data and stores the codes, code groups, networks, etc. that you
develop during your work. Your source data files are copied and stored in a repository. The standard option is for
ATLAS.ti to manage the documents for you in its internal database. If you work with larger audio or video files,
they can be linked to your project to preserve disk space. All files that you assign to the project (except those
externally linked) are copied, i.e., a duplicate is made for ATLAS.ti's exclusive use. Your original files remain intact
and untouched in their original location.
Your source data can consist of text documents (such as interview or focus group transcripts, reports,
observational notes); images (photos, screen shots, diagrams),audio recordings (interviews, broadcasts, music),
video clips (audiovisual material),PDF files (papers, brochures, reports, articles or book chapters for a literature
review), geo data (locative data using Open Street Map), and tweets from a twitter query.
Once your various documents are added or linked to an ATLAS.ti project, your real work can begin. Most commonly,
early project stages involve coding different data sources.
Selecting interesting segments in your data and coding them is the basic activity you engage in when using
ATLAS.ti, and it is the basis of everything else you will do. In practical terms, coding refers to the process of
assigning codes to segments of information that are of interest to your research objectives. We have modeled this
function to correspond with the time-honored practice of marking (underlining or highlighting) and annotating
text passages in a book or other documents.
In its central conceptual underpinnings, ATLAS.ti has drawn deliberately from what might be called the paper and
pencil paradigm. The user interface is designed accordingly, and many of its processes are based on - and thus can
be better understood by - this analogy.
Because of this highly intuitive design principle, you will quickly come to appreciate the margin area as one of your
most central and preferred work space - even though ATLAS.ti almost always offers a variety of ways to
accomplish any given task.
ATLAS.TI - THE KNOWLEDGE WORKBENCH 12
9.0.0.214 (15.12.2021) ATLAS.ti 9 Windows - User Manual
27.
General Steps whenWorking with ATLAS.ti
The following sequence of steps is, of course, not mandatory, but describes a common script:
Create a project, an idea container, meant to enclose your data, all your findings, codes, memos, and
structures under a single name. See Creating a New Project.
Next, add documents, text, graphic, audio and video files, or geo documents to your ATLAS.ti project. See
Adding Documents.
Organize your documents. See Working With Groups.
Read and select text passages or identify areas in an image or select segments on the time line of an audio
or video file that are of further interest, assign key words (codes), and write comments and memos that
contain your thinking about the data. Build a coding system. See Working With Comments And Memos
and Working With Codes.
Compare data segments based on the codes you have assigned; possibly add more data files to the project.
See for example Retrieving Coded Data.
Query the data based on your research questions utilizing the different tools ATLAS.ti provides. The key
words to look for are: simple retrieval, complex code retrievals using the Query Tool, simple or complex
retrievals in combination with variables via the scope button, applying global filters, the Code Co-occurrence
Tools (tree explorer and table), the Code Document Table, data export for further statistical analysis (see
Querying Data and Data Export For Further Statistical Analysis.
Conceptualize your data further by building networks from the codes and other entities you have created.
These networks, together with your codes and memos, form the framework for emerging theory. See
Working With Networks.
Finally, compile a written report based on the memos you have written throughout the various phases of
your project and the networks you have created. See Working With Comments And Memos and Exporting
Networks.
For additional reading about working with ATLAS.ti, see The ATLAS.ti Research Blog and The ATLAS.ti conference
proceedings.
•
•
•
•
•
•
•
•
ATLAS.TI - THE KNOWLEDGE WORKBENCH 13
9.0.0.214 (15.12.2021) ATLAS.ti 9 Windows - User Manual
28.
Main Concepts andFeatures
You need to be familiar with the concepts of documents, quotations, codes, and memos as the overall foundation
when working with ATLAS.ti, complemented by a variety of special aspects such as groups, networks, and the
analytical tools.
Everything that is relevant for your analysis will be part of your ATLAS.ti project residing in the digital domain. For
instance, the data you are analyzing, the quotations as your unit of analysis, the codes, the conceptual linkages,
comments and memos, are all part of it. One obvious advantage of this container concept is that as user you only
have to deal with and think of one entity. Activating the ATLAS.ti project is the straightforward selection of a
single file; all associated material is then activated automatically.
The most basic level of an ATLAS.ti project consists of the documents you are analyzing, followed closely by the
quotations (= selections from these document). On the next level, codes refer to quotations. And comments and
memos - you meet them everywhere. Your ATLAS.ti project can become a highly connected entity, a dense web of
primary data, associated memos and codes, and interrelations between the codes and the data. To find your way
through this web, ATLAS.ti provides powerful browsing, retrieval and editing tools.
You can access information about each of these tools using the links below:
Documents
Document Groups
Quotations
Codes
Memos
Comments
Groups
Networks
Data Exploration
Analysis
Team Tools
Report
Data Export
•
•
•
•
•
•
•
•
•
•
•
•
•
MAIN CONCEPTS AND FEATURES 14
9.0.0.214 (15.12.2021) ATLAS.ti 9 Windows - User Manual
29.
Documents and DocumentGroups
Documents represent the data you have added to an ATLAS.ti project. These can be text, image, audio, video or
geographic materials that you wish to analyze. Working with text data includes importing survey data, importing
data from a reference manager for a literature review, importing twitter data, using interview or focus group data,
reports in text or PDF formats, observational notes, etc. For more information, see Supported file formats.
Document groups fulfill a special function as they can be regarded as quasi dichotomous variables. You can group
all female interviewees into a document group named "gender::female," all male interviewees into a group named
"gender::male." You can do the same for different professions, marital status, education levels, etc. See Working
with Groups for further information
Document groups can later in the analysis be used to restrict code-based searches like: "Show me all data
segments coded with 'attitude towards the environment' but only for females who live in London as compared to
females who live in the country side."
You can also use document groups as a filter, for example to reduce other types of output, like a frequency count
for codes across a particular group of documents.
This is explained in more detail in the section Code Document Table.
DOCUMENTS AND DOCUMENT GROUPS 15
9.0.0.214 (15.12.2021) ATLAS.ti 9 Windows - User Manual
30.
Quotations
A quotation isa segment from a document that you consider to be interesting or important.
Usually, quotations are created manually by the researcher. However, for repetitive words, phrases or structural
information like speaker units, the Search & Code tools can be used. With any of the tools you can automatically
segments the data and assigns a code to them.
Although the creation of quotations is almost always part of a broader task like coding or writing memos,
quotations can also be created without coding. They are called "free" quotations.
If you for instance are using discourse analysis or an interpretive approach to analysis, or if you work with video
data, free quotations can be your starting point for analysis, rather than to code the data right away. See Working
with Quotations, and the ATLAS.ti Quotation Level.
QUOTATIONS 16
9.0.0.214 (15.12.2021) ATLAS.ti 9 Windows - User Manual
31.
Codes
The term codeis used in many different ways. First, we would like to define what that term means in qualitative
research, and then in ATLAS.ti.
Coding means that we attach labels to segments of data that depict what each segment is about. Through
coding, we raise analytic questions about our data from […]. Coding distils data, sorts them, and gives us an
analytic handle for making comparisons with other segments of data.
Charmaz (2014:4)
Coding is the strategy that moves data from diffuse and messy text to organized ideas about what is going
on.
(Richards and Morse, 2013:167)
From a Methodological Perspective
Codes capture meaning in the data.
Codes serve as handles for specific occurrences in the data that cannot be found by simple text-based
search techniques.
Codes are used as classification devices at different levels of abstraction in order to create sets of related
information units for the purpose of comparison.
The length of a code should be restricted and should not be too verbose. If textual annotations are what
you want, you should use quotation comments instead.
Keep code names brief and succinct. Use the comment pane for longer elaborations.
•
•
•
CODES 17
9.0.0.214 (15.12.2021) ATLAS.ti 9 Windows - User Manual
32.
From a TechnicalPerspective
Codes are short pieces of text referencing other pieces of text, graphical, audio, or video data. Their purpose is to
classify data units.
In the realm of information retrieval systems, the terms "tag", "keyword", or "tagging" are often used for "code" or
"coding."
Further information can be found in the sections Coding Data and Working With Codes.
References
Charmaz, Kathy (2014). Constructing Grounded Theory: A Practical Guide Through Qualitative Analysis. London:
Sage.
Richards, Lyn and Janice M. Morse (2013, 3ed). Readme first: for a user’s guide to Qualitative Methods. Los
Angeles: Sage.
CODES 18
9.0.0.214 (15.12.2021) ATLAS.ti 9 Windows - User Manual
33.
Memos
Writing is animportant part of analysis in qualitative research. When using software, it is easy to fall into the code
trap. Always remember that coding the data is only a means to an end, to think, retrieve, and query data (Corbin
and Strauss, 2015; Richards, 2009; Richards and Morse, 2013).
Memos are abit more than just a short scribbled note in the margin area:
Memos [...] are working and living documents. When an analyst sits down to write a memo or do a diagram,
a certain degree of analysis occurs. The very act of writing memos and doing diagrams forces the analyst to
think about the data. And it is in thinking that analysis occurs (Corbin and Strauss, 2008: 118).
Writing is thinking. It is natural to believe that you need to be clear in your mind what you are trying to
express first before you can write it down. However, most of the time, the opposite is true. You may think you
have a clear idea, but it is only when you write it down that you can be certain that you do (or sadly,
sometimes, that you do not) (Gibbs, 2005).
Memos thus represent analytic work in progress, and you can use some of the writing later as building blocks for
your research report (see Friese, 2019). It is probably not by accident that Juliet Corbin includes a lot about memo
writing in the third edition of Basics of Qualitative Research; she wants to show readers how it can be done. In a
talk at the CAQD 2008 Conference about the book, she linked the poor quality of many of today’s qualitative
research projects to a failure to use memos. Along the same lines, Birks et al. (2008) devotes an entire journal
article to memo writing, criticizing the limited exploration of its value in most qualitative methodologies.
Freeman (2017) states that it is one of the challenges facing novice researchers to understand that writing is
inseparable from analysis. We would like to encourage you do it: write a lot already while you code and later when
you query the data. If you do it, you will find out why it is useful - but you've got to do it. As Freeman put it: The
challenge for novice researchers is: “Needing to do analysis to understand analysis” (2017:3).
When you need more input regarding how to write memos see, for example, the third edition of Basics of
Qualitative Research by Corbin and Strauss (2008/2014), Wolcott (2009), Charmaz (2014) or Friese (2019).
MEMOS 19
9.0.0.214 (15.12.2021) ATLAS.ti 9 Windows - User Manual
34.
In technical terms,
Amemo in ATLAS.ti may stand alone, or it may be linked to quotations, codes, and other memos.
Memos can be sorted by type (method, theoretical, descriptive, etc.), which is helpful in organizing and
sorting them, or by creating memo groups.
Memos may also be included in the analysis as secondary data by converting them into a document. Then
they can also be coded.
For more information, see Working with Comments and Memos.
References
Birks, Melanie; Chapman, Ysanne and Francis, Karin (2008). Memoing in qualitative research: probing data and
processes, Journal of Research in Nursing, 13, 68–75.
Charmaz, Kathy (2014). Constructing Grounded Theory: A Practical Guide Through Qualitative Analysis. London:
Sage.
Corbin, Juliet and Strauss, Anselm (2008/2015). Basics of Qualitative Research: Techniques and Procedures for
Developing Grounded Theory (3rd and 4th ed.). Thousand Oaks, CA: Sage.
Freeman, Melissa (2017). Modes of Thinking for Qualitative Data Analysis. NY: Routledge.
Friese, Susanne (2019). Qualitative Data Analysis with ATLAS.ti (3. ed.), London: Sage.
Gibbs, Graham (2005). Writing as analysis. Online QDA.
Richards, Lyn and Morse, Janice M. (2013). Readme First for a User’s Guide to Qualitative Methods.
•
•
•
MEMOS 20
9.0.0.214 (15.12.2021) ATLAS.ti 9 Windows - User Manual
35.
Richards, Lyn (2009).Handling qualitative data: a practical guide (2. ed), London: Sage.
Wolcott, Harry E. (2009). Writing Up Qualitative Research. London: Sage.
MEMOS 21
9.0.0.214 (15.12.2021) ATLAS.ti 9 Windows - User Manual
36.
Comments
You can writecomments for all entities in ATLAS.ti. Comments - different from memos - are always directly
connected to the entity you write them for. Memos are independent stand-alone entities that have a name and a
type. Memos can be grouped and can also have comments on their own.
Writing comments is similar to scribbling notes in the margin of a paper, or attaching sticky notes to things.
Comments can be written for documents, quotations, codes, memos, networks, all types of groups, and for
relations.
See Working with Memos and Comments for further detail.
COMMENTS 22
9.0.0.214 (15.12.2021) ATLAS.ti 9 Windows - User Manual
37.
Groups
Groups in ATLAS.tiare filter devices.
Document groups can be regarded as attributes or variables. It is possible to combine them using logical operators
like AND and OR, for instance to retrieve and analyze data from female respondents living in NYC. This would an
AND combination of two document groups.
Code groups serve as a filter for codes. They can for instance be used to filter all codes that need to be aggregated
if you have been coding very detailled and in the process of generated too many codes.
Code groups are not a kind of higher order code. It is NOT recommmend to use them as categories. For
further information see Building a Code System.
For more information on groups, see Working with Group.
GROUPS 23
9.0.0.214 (15.12.2021) ATLAS.ti 9 Windows - User Manual
38.
Networks
Networks allow youto conceptualize your data by connecting sets of related elements together in a visual
diagram. With the aid of networks you can express relationships between codes and quotations; and you can link
other entities like and memos, documents and groups. Also networks themselves can be "nodes" in a network.
Nodes, Links and Relations
A node is any entity that is displayed in a network . You can change their look and move them around in the
network editor.
A link is a line that allows you to connect two entities.
Relations allow you to name a links between two codes or between two quotations.
Network Manager
The Network Manager contains a list of all saved networks that you have crated. It can be used to access a
network, to delete existing networks, or to write and edit comments. See Network Manager.
NETWORKS 24
9.0.0.214 (15.12.2021) ATLAS.ti 9 Windows - User Manual
39.
Network Editor
The networkeditor displays and offers all editing capability to construct and refine networks. In addition, it allows
the visual creation and traversal of hypertext structures.
Link Manager
The Link Managers provide an overview of all code-code links and of all hyperlinks you have created. See Link
Manager.
Relation Manager
The Relation Manager allows you to modify existing relations or to create new relations. See Creating New
Relations.
Find more information on the network function see Working with Networks.
NETWORKS 25
9.0.0.214 (15.12.2021) ATLAS.ti 9 Windows - User Manual
40.
Tools for ExploringText Data
ATLAS.ti offers a number of tools that you can use to explore your textual data:
Word clouds and word lists for documents, quotations, and codes. See Creating Word Clouds and Creating
Word Lists.
the Search & Code Tools. These tools offer a combination of text search and auto coding:
Text search: search for a words, word fragments including synonyms. AND and OR combination are
also possible. See Text Search.
Expert search: the expert search allows for advances searches using regular expressions (RegEx).
With RegEx you can use pattern matching to search for particular strings of characters rather than
constructing multiple, literal search queries. See Expert Search.
Named Entity Recognition (NER): seeks to locate and classify named entities in text into pre-
defined categories such as persons, organizations, locations, or miscellaneous. You can review all
hits and code them with the suggested categories. See Named Entity Recognition.
Sentiment Analysis: is the interpretation and classification of positive, negative and neutral
statements within text data using text analysis techniques. Sentiment analysis models detect
polarity within a text (e.g. a positive or negative opinion),within the whole document, paragraph,
sentence, or clause. It has multiple applications. For instance it can be used for customer
satisfaction analysis or for all forms of evaluations, e.g. also student evaluation of courses. See
Sentiment Analysis.
•
•
◦
◦
◦
◦
TOOLS FOR EXPLORING TEXT DATA 26
9.0.0.214 (15.12.2021) ATLAS.ti 9 Windows - User Manual
41.
Analysis
ATLAS.ti contains multiplepowerful, dedicated analytical tool to help to make sense of your data.
Cross-Tabulation of Codes (Code Co-occurrence)
The Co-occurrence Explorer and Table show where you have applied codes in an overlapping manner. Rather than
determining the codes yourself, you can ask ATLAS.ti which codes overlap. The output can be viewed in form of a
tree view or a table. The table provides a frequency count of the number of co-occurrences and a coefficient
measuring the strength of the relation. Since a coefficient is only appropriate for some type of data, its display can
be activated or deactivated. It is also possible to directly access the data of each co-occurrence. See Code Co-
Occurrence Tools.
Code-Document Table
The Code Document Table counts the frequency of codes across documents. Aggregated counts based on code and
document groups are also available. Optionally, the table cells can also contain the word counts for the quotations
per code across documents or document group. The table can be exported to Excel. See Code Document Table..
Query Tool
For more complex search requests, the Query Tool is at your disposal. Here you can formulate search requests that
are based on combinations of codes using one or a combination of 14 different operators, Boolean, semantic and
proximity operators. See The Query Tool..
Global Filters
Global filters are a powerful tool to analyze your data. Global filters have an effect on the entire project and you
can compare and contrast your data in all kind of different ways. Effects and connections that were hidden before
can now be seen and patterns emerge. For more information, see Applying Global Filter.
Smart Codes
A Smart Code is a stored query, thus provides an answer to a question (in the best case) and typically consists of
several combined codes. See Working With Smart Codes..
ANALYSIS 27
9.0.0.214 (15.12.2021) ATLAS.ti 9 Windows - User Manual
42.
Smart Groups
Smart groupsare a combination of groups. For instance if want to compare answers of female respondents from
rural areas with female respondents from urban areas, you would create two smart groups that you either use
directly in a Code-Document Table, or as filter in a code query. Smart code groups can be used if you frequently
need a combination of certain codes. See Working With Smart Codes..
ANALYSIS 28
9.0.0.214 (15.12.2021) ATLAS.ti 9 Windows - User Manual
43.
Team Tools
Often researcherswork in teams to collect and analyse data. ATLAS.ti is uniquely suited for collaborative work. A
number of special tools and features support efficient work in a team. For further information see the chapter on
Team Work.
For collaborative real time coding, you may want to take a look at the ATLAS.ti Web version.. ATLAS.ti web
projects can be imported to the desktop version to make use of the advanced analysis tools, and the network
function.
Project Merge
When you work in teams, you usually split the project into subprojects. In the desktop version you need to work
asynchronously. The project merge tool unites all subprojects again. For more information see Merging Projects.
Clean up Redundant Codings
Redundant codings are overlapping or embedded quotations that are associated with the same code. Such
codings can result from normal coding but may occur unnoticed during a merge procedure when working in teams.
The Codings Analyzer finds all redundant codings and offers appropriate procedures to correct it. See Finding
Redundant Codings.
Coder Icons in the Margin Area
You can switch the view in the margin area to display an icon for each user instead of the code icon. This way you
can see while browsing through the data who applied which code.
Inter-Coder Agreement
ATLAS.ti allows for a qualitative and quantitative comparison of the codings of various coders. If you are
interested in calculating a coefficient, ATLAS.ti offers the following: percent agreement, Holsti, and Krippendorff's
family of alpha coefficients. See Inter-coder Agreement.
User Administration
ATLAS.ti automatically creates a username for each user when logging in. Each entity that is created is stamped
with this username. This is a prerequisite for collaborative work, so you can see and compare who did what. You
can rename existing users, create new user accounts, delete users and switch users. See User Accounts for more
information.
TEAM TOOLS 29
9.0.0.214 (15.12.2021) ATLAS.ti 9 Windows - User Manual
44.
Please note thatsynchronous team work is not supported in the desktop version. Each team member
works in his or her own project file, and these need to be merged from time to time.
Use ATLAS.ti Web if you want to work with your team at the same project at the same time.
TEAM TOOLS 30
9.0.0.214 (15.12.2021) ATLAS.ti 9 Windows - User Manual
45.
Export
Word / PDF
Thereare output options for each of the main entities in ATLAS.ti: Documents, quotations, codes, and memos
and within the various tools. All reports are user configurable, and you can decide which type of content to include.
See Creating Reports.
Excel Export
You find an Excel Export option in each Manager and quotation list. In addition, the results of the Code Co-
occurrence Table and the Code Document Table can be exported in Excel format. See Creating Excel Reports.
Print Documents with Margin
You can print or export coded text documents in PDF format as you see them on the screen including the
paragraph numbering. See Print with Margin.
QDPX Exchange Format For Projects
The QDPX format is a QDA-XML standard for exchanging projects between different CAQDAS packages. The
project exchange format was launched March 18, 2019. You can see all participating programs on the following
website: http://www.qdasoftware.org. See QDPX Universal Data Exchange.
SPSS / PSPP Export
You can export your coded data as SPSS syntax file. This file can also bes used the in free basic PSPP version.
When executed in SPSS or PSPP, your quotations become cases and your codes and code groups variables. In
addition, further identifying information in form of variables is provided like the document name and number for
each case, start and end position and creation date. These variables allow you to aggregate your data in SPSS if
needed. See SPSS Export.
If you need a less detailed output, see Code Document Table. The table provides an output that is already
aggregated by documents or document groups.
EXPORT 31
9.0.0.214 (15.12.2021) ATLAS.ti 9 Windows - User Manual
46.
Generic Statistic Exportfor R, SAS, STATA, etc.
You can export your coded data as Excel file for further analysis in any statistical package. Quotations become
cases and codes and code groups variables. In addition, further identifying information in form of variables is
provided like the document name and number for each case, start and end position and creation date. See Generic
Export For Further Statistical Analysis.
Image Files
Networks can be saved in various graphic file formats (jpg, png, tiff, gif, bmp). See Exporting Networks.
Word clouds can be exported as jpg files. See Word Clouds and Word Clouds and Word Lists.
The results of the Code Co-occurrence and the Code Document Table can be visualized in form of Sankey
Diagrams. See Visualization of the Code Co-occurrence Table and Visualization of the Code Document
Table.
•
•
•
EXPORT 32
9.0.0.214 (15.12.2021) ATLAS.ti 9 Windows - User Manual
47.
Main Steps inWorking with ATLAS.ti
Video Tutorial: Overview of ATLAS.ti 9 Windows
Data and Project M
A first important but often neglected aspect of a project is data and project management. The first step is data
preparation. You find more information on supported file formats in the section Supported File Formats.
Apart from analyzing your data, you also manage digital content and it is important to know how the software
does it. For detailed information, see the section on Project Management.
If you work in a team, please read the following section: Team Work.
Two Principal Modes of Working
There are two principal modes of working with ATLAS.ti, the data level and the conceptual level. The data level
includes activities like segmentation of data files; coding text, image, audio, and video passages; and writing
comments and memos. The conceptual level focuses on querying data and model-building activities such as
linking codes to networks, in addition to writing some more comments and memos.
The figure below illustrates the main steps, starting with the creation of a project, adding documents, identifying
interesting things in the data and coding them. Memos and comments can be written at any stage of the process,
whereas there is possibly a shift from writing comments to more extensive memo writing during the later stages
of the analysis. Once your data is coded, it is ready to be queried using the various analysis tools provided. The
insights gained can then be visualized using the ATLAS.ti network function.
Some steps need to be taken in sequence. For instance, logic dictates that you cannot query anything or look for
co-occurrences if your data has not yet been coded. But other than that there are no strict rules.
MAIN STEPS IN WORKING WITH ATLAS.TI 33
9.0.0.214 (15.12.2021) ATLAS.ti 9 Windows - User Manual
48.
Data Level Work
Data-levelactivities include Exploring Data using word clouds and word lists, segmenting the data that you have
assigned to a project into quotations, adding comments to respective passages note-making/annotating, linking
data segments to each other called hyperlinking in ATLAS.ti, and coding data segments and memos to facilitate
their later retrieval. The act of comparing noteworthy segments leads to a creative conceptualization phase that
involves higher-level interpretive work and theory-building.
ATLAS.ti assists you in all of these tasks and provides a comprehensive overview of your work as well as rapid
search, retrieval, and browsing functions.
Within ATLAS.ti, initial ideas often find expression through their assignment to a code or memo, to which similar
ideas or text selections also become assigned. ATLAS.ti provides the researcher with a highly effective means for
quickly retrieving all data selections and notes relevant to one idea.
Conceptual Level Work
Beyond coding and simple data retrieval, ATLAS.ti allows you to query your data in lots of different ways,
combining complex code queries with variables, exploring relationships between codes and to visualize your
findings using the network tool.
ATLAS.ti allows you to visually connect selected passages, memos, and codes into diagrams that graphically
outline complex relations. This feature virtually transforms your text-based work space into a graphical playground
where you can construct concepts and theories based on relationships between codes, data segments, or memos.
MAIN STEPS IN WORKING WITH ATLAS.TI 34
9.0.0.214 (15.12.2021) ATLAS.ti 9 Windows - User Manual
49.
This process sometimesuncovers other relations in the data that were not obvious before and still allows you the
ability to instantly revert to your notes or primary data selection. - For more detail, see Querying Data and
Working With Networks.
MAIN STEPS IN WORKING WITH ATLAS.TI 35
9.0.0.214 (15.12.2021) ATLAS.ti 9 Windows - User Manual
50.
Welcome Screen
When youopen ATLAS.ti, you see the Welcome Screen. It is divided into three parts:
Welcome Screen (left-hand side)
On the left-hand side, you find licence information, you can create a new project or import an existing project, and
you can access Options.
Welcome Screen (middle section)
In the middle section you can see and access all of your projects. If you have lots of projects, the search field will
help you to locate a project.
WELCOME SCREEN 36
9.0.0.214 (15.12.2021) ATLAS.ti 9 Windows - User Manual
51.
You can sortprojects by name, created, last modified, and last used:
If you have lots of projects, you
can hide those that you do not need at the moment:
Right-click on a project and select the option Hide Project.
You can switch between showing all projects or only those that are currently not hidden.
See the Show all projects option.
Other options in the context menu are to open a project, to pin it to the favorite list, to
rename a project, or to delete a project. A pinned project is listed in a separate section
above the list with all other projects.
warn
If you delete a project, it is deleted permanently. It cannot be recovered. If you still want to
have access to the project at a later time, make sure that you export it first and store a
project bundle at a secure location.
WELCOME SCREEN 37
9.0.0.214 (15.12.2021) ATLAS.ti 9 Windows - User Manual
52.
Welcome Screen (right-handside)
On the right-hand side of the Welcome Screen, you have access to useful information and
News about current workshops, updates, newsletters, interesting articles, etc.
Resources Quick Tour, User Manual and sample projects
Video Tutorial: Learn ATLAS.ti quickly by watching our video tutorials that walk you through the entire
process from project creation to analysis and reporting step by step.
If you rather use this space to view the list of your projects, you can click on the blue button with the right-arrow:
If you want to see the screen with the news and resources again, click on the button with the left-arrow.
•
•
•
WELCOME SCREEN 38
9.0.0.214 (15.12.2021) ATLAS.ti 9 Windows - User Manual
53.
Creating a NewProject
Video Tutorial: Creating a project and importing data.
If you just started ATLAS.ti,
In the opening window on the left-hand side of the screen click on the button: Create New
Project.
Enter a name for the project, optionally a comment, and click on Create.
If a project is already open,
click on File > New to open the backdrop. From there select Create New Project.
Enter a name for the project, optionally a comment, and click on Create.
CREATING A NEW PROJECT 39
9.0.0.214 (15.12.2021) ATLAS.ti 9 Windows - User Manual
54.
CREATING A NEWPROJECT 40
9.0.0.214 (15.12.2021) ATLAS.ti 9 Windows - User Manual
55.
Importing an ExistingProject
The following project types can be imported:
Version File Type
Version 9 Project Bundle
Version 8 Project bundle
Version 7 Transfer bundle or copy bundle
Version 6 and older Copy bundle
Project Exchange format QDPX
Exported projects from the Ipad or Android apps can also be imported. ATLAS.ti Cloud projects can
currently not be imported into the desktop version.
How to Import Projects
If you just started ATLAS.ti,
IMPORTING AN EXISTING PROJECT 41
9.0.0.214 (15.12.2021) ATLAS.ti 9 Windows - User Manual
56.
Select the ImportProject option on the right-hand side of the opening screen.
If ATLAS.ti is already open,
Select File > New and from there the Import Project option.
Options
You have the option to rename the project before importing. This is useful for team project work and if you
do not want to overwrite an existing version.
•
IMPORTING AN EXISTING PROJECT 42
9.0.0.214 (15.12.2021) ATLAS.ti 9 Windows - User Manual
57.
If the projectthat you are importing already exists in your library, you have the choice to either overwrite
the existing project with the version you are importing, or whether you want to rename the project that you
are importing.
If the project contains Linked Media Files
If the project contains linked media files, and the files have not been included in the bundle, you can relink them.
This requires that you have a copy of the file on your computer, or a file that is accessible on an external drive or
server.
In the example shown below, the source for document 23 is a video that is available in the library. The source for
document 26 is a linked video and needs to be relinked in order for it to be displayed in ATLAS.ti:
•
IMPORTING AN EXISTING PROJECT 43
9.0.0.214 (15.12.2021) ATLAS.ti 9 Windows - User Manual
58.
You can alsodecide not to relink the files at this stage and proceed with importing the files. The linked multimedia
documents are still listed under Documents, but you cannot load them. They will appear gray in the Document
Manager.
If you double-click on a multimedia file that is not available, ATLAS.ti gives you the option to repair the link. This
means, you point ATLAS.ti to the folder where the multimedia file is stored, so that it can be relinked to your
project.
IMPORTING AN EXISTING PROJECT 44
9.0.0.214 (15.12.2021) ATLAS.ti 9 Windows - User Manual
59.
The ATLAS.ti Interface
Whenyou open a project, you see the ribbon on top, the project navigator on the left-hand side and the ATLAS.ti
logo in the middle of the working area.
At the top of the screen, you see the title bar where the name of the current project is displayed. It also includes
the Save, Undo and Redo functions on the left-hand side.
You are probably familiar with ribbons from other contemporary Windows software that you use. A ribbon is a
graphical control element in the form of a set of toolbars placed on several tabs. They are grouped by functionality
rather than object types. Ribbons, in comparison, use tabs to expose different sets of controls, eliminating the
need for numerous parallel toolbars. This highly improves the workflow and makes it easier for users to see which
functions are available for a given context.
The ATLAS.ti Ribbon
The six core tabs in ATLAS.ti are:
Home
Search & Code
Analyze
Import & Export
Tools
Help
•
•
•
•
•
•
THE ATLAS.TI INTERFACE 45
9.0.0.214 (15.12.2021) ATLAS.ti 9 Windows - User Manual
60.
Depending on thefunction you are using, additional contextual tabs will appear. These will be highlighted by a
colored box at the top of the ribbon.
The Home ribbon is the starting point for most projects. You can start here to add documents to a project, create
new codes, memos and networks. You can open various navigators to be displayed in the navigation area on the
left-hand side of the screen and access all entity managers.
The Search & Code tab allows searching through text data by different criteria like search expressions that you
enter including synonyms, by entities identified by the software, or by sentiment (positive, negative, neutral).
You can review all results before you code them.
The Analyze tab offers a number of advanced functions to analyze your data after coding. See Querying Data.
The Import & Export ribbon offers a number of import option for specific data types:
Twitter data. See Working with Twitter Data.
•
THE ATLAS.TI INTERFACE 46
9.0.0.214 (15.12.2021) ATLAS.ti 9 Windows - User Manual
61.
Data from Evernote.See Support File Types.
Literature stored in reference managers like Endnotes, Medeley, etc., to support you with your literature
review. See Working with Reference Manager Data.
Survey data from Excel. See Working with Survey Data.
Further you can import and export code books and document list with their groups. See Importing and Exporting
Code Lists and Importing and Exporting Document Groups.
If you are interested in a mixed-method approach, you can generate a SPSS syntax file for further quantitative
analysis of your qualitative coding, or export a generic version in form of an Excel file for import in R, SAS or
STATA. See Data Export for Further Statistical Analysis.
The Tools ribbon holds tools for user management (see User Management) and for cleaning up your project by
finding and removing redundant codings. See Finding Redundant Codings.)
The Help ribbon ....
File Menu / Back Stage
Under File you find all options that concern your project, like creating a new project, open existing projects, saving
and deleting projects, creating a snapshot (=copy) of your project, exporting and merging projects. See Project
Management.
•
•
•
THE ATLAS.TI INTERFACE 47
9.0.0.214 (15.12.2021) ATLAS.ti 9 Windows - User Manual
Software Navigation
In thefollowing it is explained how to work with the various entities and features in the main work space. If you
want to click along, you may want to open the Children & Happiness sample project.
After you downloaded the project bundle file, import it. See Importing An Existing Project .
When you open a project, the Project Explorer opens automatically on the left-hand side. From the main branches
you can access documents, codes, memos, networks and all groups. If you are looking for something in particular,
you can enter a search term into the search field. If you open the branches of the various entities, they will only
show you items that contain the search term.
To open a branch, click on the triangle in front of each entity, or right-click and select the
Expand option from the context menu.
When double-clicking a main branch, the respective manager of the selected entity type is
opened. See Entity Managers.
SOFTWARE NAVIGATION 49
9.0.0.214 (15.12.2021) ATLAS.ti 9 Windows - User Manual
64.
Under the mainDocuments branch, you see all documents. Below each document, you can access all
quotations of a document.
Under the main Codes branch, you see the list of all codes. On the next level, you see all linked codes. For
further information see: Linking Nodes.
Under the main Memos branch, you see the list of all memos. On the next level, you see all linked entities,
which for memos can be other memos, quotations and codes.
Under the main Networks branch, you see the list of all networks. On the next level, you see all entities
that are contained in the network. If you open the branches further, you see the entities that are linked to
the respective items.
Under the Groups branches, you see the list of all groups and below each group, the list of all members of
the selected group.
If an entity has a comment, this is indicated by a yellow post-it note attached to the entity icon.
•
•
•
•
•
SOFTWARE NAVIGATION 50
9.0.0.214 (15.12.2021) ATLAS.ti 9 Windows - User Manual
65.
Browsers
In addition tothe Project Explorer that contains all project items, you can open browsers that only contain one
entity type. Browsers are available for documents, quotations, memos and networks.
To open one of the browsers, click on the drop-down arrow of the Navigator button. As the
documents and codes browsers are frequently needed, you can also launch them directly
from the navigator group.
SOFTWARE NAVIGATION 51
9.0.0.214 (15.12.2021) ATLAS.ti 9 Windows - User Manual
66.
The single entitybrowsers open in tabs next to the Project Explorer. Each browser also has a search field on top.
This facilitates working with long lists.
Context Menus
Each item in the navigation panel has a context menu, which means a context sensitive menu opens when you
right-click. Depending on the entity that you click, each context-menu will be slightly different. Common to all
context menus is the Expand and Collapse option, and the option to open the Entity Manager.
SOFTWARE NAVIGATION 52
9.0.0.214 (15.12.2021) ATLAS.ti 9 Windows - User Manual
67.
Explorers
You can openthree types of explorers in the navigation panel: the Project Explorer (see above), the Code Forest,
and the Code Co-occurrence Explorer).
SOFTWARE NAVIGATION 53
9.0.0.214 (15.12.2021) ATLAS.ti 9 Windows - User Manual
68.
Closing Browsers andExplorers
To close either a browser or explorer, click on the X at the top right of the Navigation Panel.
To close all (or all but one), right-click on the drop down arrow and select the appropriate
option from the context menu.
Working with Docked and Floated Windows
When you first open a manager or other windows, they will be opened in floating mode. All windows can however
also be docked. Depending on what you are currently doing, you may prefer a window to be docked or floated. Once
you have docked a window, ATLAS.ti will remember this as your preferred setting for the current session. This is
how you do it:
Open the Code Manager by clicking the Codes button in the Home Tab.
To dock this window, click on the fourth icon from the right (left of the minimize button).
To float a window , click on the drop down arrow next to the manager name and select
Float.
SOFTWARE NAVIGATION 54
9.0.0.214 (15.12.2021) ATLAS.ti 9 Windows - User Manual
69.
Always On Top
Afloating window disappears in the background if you click outside the window. If you prefer the window to stay
on top of other windows, right-click on the button at the top left of the window and select the option Always On
Top.
Working With Tabs and Tab Groups
When you load documents or open managers, networks and memos, they are displayed in tabs next to each other.
Depending on what you do, it is more convenient to see certain items side-by-side in different tab groups. This is
how you do it.
Load for instance two documents. You do this by opening the document tree in the
navigation area on the left-hand side and double-click a document.
When double-clicking on two or more documents, they are loaded into different tabs in the main work space. The
tab of the currently loaded document is colored in white.
To move one of the documents into a new tab group, click on the down arrow next to the
document name in the header and select New Tab Group > Right.
You have the option to move it into a tab group to the right, left, down or up.
This can also be done with any other items you open, be it a list of codes, a memo, or a network. You can
individualize your work space as it suits your needs. An example is shown below.
SOFTWARE NAVIGATION 55
9.0.0.214 (15.12.2021) ATLAS.ti 9 Windows - User Manual
The Six MainEntity Types
The six main entity types in ATLAS.ti are:
Documents
Quotations
Codes
Memos
Networks
Links
All entity types have their own manager. See Entity Managers. The Entity Managers allow access to the entities
and provide several options and functions.
To open a manager, double-click on the button in the ribbon.
Entity Managers are child or dependent window of the main editor. Child windows have some common properties:
They are closely related to the parent window 'knows' about changes in the child window, like the selection
of an item, and vice vera.
They can be resized and positioned independently of their parent window.
They are minimized when the parent window is minimized and they are restored with their parent window.
They are closed when the parent window is closed.
However, child windows do NOT move with the parent window.
Miscellaneous Goodies
You can copy the content of every entity, be it a document name, a group name, a code, memo or quotation name,
or a node in a network and paste it into an editor or a network.
If you copy an entity name from a list into an editor, the name is pasted.
If you copy a node and paste it into an editor, the name of the node is pasted.
If you copy the name of an entity and paste it into a network, it is pasted as node. If links already exist, they will
be shown immediately.
•
•
•
•
•
•
•
•
•
•
•
THE SIX MAIN ENTITY TYPES 57
9.0.0.214 (15.12.2021) ATLAS.ti 9 Windows - User Manual
72.
Entity Managers
There isa separate manager for each of the six entity types: Documents, Quotations, Codes, Memos, Networks,
and Links. The Entity Managers allow access to the entities and provide several options and functions. As there
are differences among the various entity types, you find a section on each of the managers.
Launching an Entity Manager
To open for instance the Document Manager, click on the Documents button in the Home tab. To open the
Quotation Manager, click on the Quotations button; to open the Code Manager click on the Codes button, and so
on.
An alternative way is to double-click on Documents, Codes, Memos, etc. in the Project Explorer in the navigation
panel on the left.
The managers open as floating windows, but all windows can be docked as well. See Software Navigation.
Each manager contains a list of the entities it manages, and some detailed information about them. At the
bottom of the list, you find a comment field in each manager and in some managers, also a preview field.
In the Document and Quotation Manager you can preview the content of either the selected document, or the
selected quotation. In the Memo Manager, the memo content is shown next to the comment field.
Another common element is the filter area on the left-hand side, which can be used to quickly access and filter the
elements listed in the managers via groups or codes. They allow immediate access to fundamental activities like
selecting codes, groups, creating groups and smart groups, and setting local and global filters. This allows a much
more effective integration into the work flow and saves a lot of mouse movements and clicks. It is also possible to
run simple Boolean queries in entity managers.
You can activate or deactivate the filter area by selecting the first option in the View tab, which is to show or hide
entity groups. See View Options below.
The Split Bar
The relative size of the side panel, list, preview and comment pane can be modified by dragging the split bar
between the panes. The cursor changes when the mouse moves over the split bar. You can re-size the adjacent
panes by dragging the split bar to the desired position.
The Status Bar
You find a status bar at the bottom of the window when the Manager opens in floating mode, or at the bottom of
your screen when the manager is in docked mode. It shows the number of items listed in the manager.
ENTITY MANAGERS 58
9.0.0.214 (15.12.2021) ATLAS.ti 9 Windows - User Manual
73.
Selecting Items inan Entity Manager
A single click with the left mouse button selects and highlights an item in each of the Entity Managers.
Double-clicking an item selects the entity and invokes a procedure depending on the type and state of the entity.
For multiple selections, you can use the standard Windows selection techniques using the Ctrl or Shift key.
To jump to a specific entry in the list, first select an item and then click the first, second and subsequent letters of
a word to jump to the entry in the list. For example, suppose a number of codes begin with the two letters 'em' as
in emotions typing 'em' will jump to the first of the EMotion ... codes. Every other character typed advances the
focus to the next list entry unless a matching name cannot be found.
Avoid long delays between entering characters. After a certain system-defined timeout, the next character
starts a new forward search.
Searching
In the filter area and all entity lists, you find a search field.
Use the search field to search for either documents, quotations, codes or memos in the respective managers.
If you enter a search term, all objects that include the term somewhere will be shown in the list. For example, if
you enter the term children in the code manager, all codes that include the word children somewhere in the code
name will be shown.
Remember to delete the search term if you want to see all items again.
ENTITY MANAGERS 59
9.0.0.214 (15.12.2021) ATLAS.ti 9 Windows - User Manual
74.
Incremental Search: Thisfeature is available in the list pane of all Entity Managers. Select any number of items in
the list and type in an arbitrary sequence of characters into the search field to jump to a subsequent list entry
matching this sequence.
Context Menus
The list and text panes offer context sensitive pop-up menus. The context menus contains a portion of the
commands that you also find in the ribbon.
Sorting and Filtering
The Entity Managers permit comfortable sorting and filtering. With a click on a column header all items are sorted
in ascending or descending order based on the entries in the selected column.
When creating entity groups, you can also use them to filter the list of items in a manager. When selecting a
group, only the members of the selected group are shown in the list. When selecting multiple entities, you can
combine them with the operators 'AND' or 'OR'. See Simple AND and OR Queries in the Quotation Manager .
In all managers but the Links Manager you find both a View, and a Search & Filter tab. In the Document and Code
Manager, there is an additional Tools tab.
View Options
In the View tab, you can activate or deactivate the filter area, the preview field (if available) or the comments. In
addition, you can switch between Detail and Single Column view.
The Code Manager offers two additional view options, a cloud and bar chart view of the codes. See Code Manager
for more detail.
ENTITY MANAGERS 60
9.0.0.214 (15.12.2021) ATLAS.ti 9 Windows - User Manual
75.
Search & FilterOptions
The search allows you to search through the entire content of documents, quotations or memos, through entity
names and comments, or entities created or written by a selected author. The search term can contain regular
expression. See Regular Expressions (GREP).
The search option in managers is restricted to the respective entity type.
Further options are to set or remove global filters, and to filter by selected criteria:
today
this week
only mine
commented
•
•
•
•
ENTITY MANAGERS 61
9.0.0.214 (15.12.2021) ATLAS.ti 9 Windows - User Manual
76.
The Document Manager
TheDocument Manager helps you to organize your data, to group documents or to filter them.
Further you can access:
the Search & Code tools if you want to code your data automatically
the focus group coding tool to auto code speaker units or other structural information on your data.
the word clouds or word lists for exploring your documents.
You can create reports or view geo locations in Google Maps.
Double-click: Double-clicking a document loads the data source and displays its content in the main window. For
each document a new tab will be opened.
Multiple Selection: You can select more than one document at a time by holding down the Shift or Ctrl key. This
can be useful when running an analysis for multiple documents, when creating groups or reports.
Filter: Click on one or more document groups in the filter area on the left to set a local filter. This means only the
items in the manager are filtered.
If you want to filter the entire project, right-click on a document group to set a global filter. See Applying Global
Filters For Data Analysis.
Status Bar: The status bar at the bottom of the screen shows how many documents there are in the project.
•
•
•
•
THE DOCUMENT MANAGER 62
9.0.0.214 (15.12.2021) ATLAS.ti 9 Windows - User Manual
77.
Document Manager Columns
Theinformation provided for each document consists of:
ID: The first column shows the blue document icon, and the document number. The document number is a
consecutive number given to the document by ATLAS.ti when it is added to a project.
Name: The default name is the file name of the original source file that you added to the ATLAS.ti project. You can
rename each document if you prefer a different name.
Media Type: This field indicates the document format: text, PDF, image, audio, video, or geo.
Groups: This column lists all groups a document belongs to.
Quotations: The number of quotations a document has.
Created By: The name of the user who added the document.
Modified By: The name of the user modifying a document, either by writing a comment or by editing it.
Created / Modified: Date and time when a document was created (=added to the project) and modified.
Location: Here you see whether a document is stored in the ATLAS.ti library or whether ATLAS.ti opens it from a
linked location. For further information see Adding Documents.
THE DOCUMENT MANAGER 63
9.0.0.214 (15.12.2021) ATLAS.ti 9 Windows - User Manual
78.
The Document ManagerRibbon
From left to right:
Add Document(s): Add a new document to your project. See Adding Documents.
New Group: Create a new document group.See Working With Groups.
New Smart Group: Smart Groups are a combination of existing document groups using Boolean operators. See
Working With Smart Groups for further detail.
Search & Code: Here you can directly access the various search and code functions offered by ATLAS.ti to
automatically code your data. See Search & Code for further information.
Focus Group Coding: You can automatically code all speaker units in a focus group. See Focus Group Coding for
further information. This option can also be used to code data units in other type of structural data.
Rename: When adding a document to an ATLAS.ti project, the default name is the file name. You can change this
name internally in ATLAS.ti. It does not change the name of data file.
Delete: Remove selected document(s) from a project. This is a permanent deletion. It also means that all coding
done on the document(s) is deleted. You can revert the action using UnDo, but only within the currently active
session.
Edit Comment: Open a text editor for writing or editing a comment for a selected document. See Working With
Comments And Memos.
Open Group Manager: See Working With Groups.
Open Network; Open a network on the selected document(s). The network only contains the document and does
not display links yet. This option is for instance useful if you want to compare cases. See Analytic Functions in
Networks.
Word Cloud: Word Clouds visualize the frequency of words. The more frequent a word occurs, the larger the word
is displayed in the image. Word Clouds are an exploratory tool that allow you to gain quick inside into your data. It
can be the basis for auto coding and further analysis. See Creating Word Clouds.
Word List: This function allows you to generate a list of all words that occur in selected documents. The list can be
sorted in alphabetic order or by frequency. You can export it to Excel for further data crunching. See Word Lists.
Report / Excel Export: Reports can be created as text file (Word, PDF), or in Excel format. All reports are
customizable. See Creating Reports.
Many of the options available in the ribbon are also available from the context menu of a document.
THE DOCUMENT MANAGER 64
9.0.0.214 (15.12.2021) ATLAS.ti 9 Windows - User Manual
79.
Tools Tab
Renumber Documents:When adding documents to a project, they are numbered by ATLAS.ti in consecutive order.
If you remove one or more documents, this may result in gaps. Use this option to close these gaps.
You can also use this option to re-order documents the way you want them to be ordered. To achieve this, rename
the document in a way so that sorting them by name results in the order you want them to be in. Next click on the
'name' column to sort the documents by name and then select the 'renumber' option. The document numbers will
then follow the alphabetical order. See also Managing Documents.
Renumber Quotations: Selecting this option will close any gap in the numbering of quotations.
Each quotation that you create has an ID. The ID consists of the document number, and a number indicating the
chronological order when the quotation was created. For example, the ID 3:12 means that this quotation is in
document 3 and that it was the twelfth quotation that was created in this document.
If you delete quotations or modify them, the ID does not change. If you delete a quotation with the ID 3:11, this
does not mean that quotation 3:12 automatically becomes quotation 3:11. Such an automatism is not always
desired. If you for instance have already started the writing process and made reference to some quotations using
their ID, you would not want ATLAS.ti to change the IDs automatically.
If you do want all quotations to be numbered in sequential order, you need to evoke it manually by selecting the
Renumber Quotations option.
Import Transcript: This option is available after you have added a multimedia document (audio or video). If you
have a transcript with timestamps for this document, you can add it as transcript. The transcript and multimedia
document are synchronized via the time marks. See Importing Multimedia Transcripts.
Document Export: This option allows you to export your documents as external data files. Text files are exported
as Word docx files, all PDF. image and multimedia files in their original format.
Repair Link: If you have linked an audio or video file to a project, and the link is no longer valid, you can repair the
link using this option.
Remove Codings: You can use this option if you want to unlink all codes from all quotations. This means all
quotations and all codes remain in the document, but none of the quotation is coded. This is useful at times for
team projects and inter-coder agreement analysis.
Browse Geo Location; All geo documents are based on Open Street Map or Bing. If you want to see a geo-location
in Google Maps, you can use this option. See Working With Geo Docs.
Duplicate document(s): This allows you to create an exact copy of one or more documents with all quotations,
codes, links, ect. This can be useful if for instance you want to code a document based on different aspects. This
THE DOCUMENT MANAGER 65
9.0.0.214 (15.12.2021) ATLAS.ti 9 Windows - User Manual
80.
option will allowyou to split a document, also when it is already coded. You duplicate it first, then (entering edit
mode) you delete the second part of one document, and the first part in the other.
Search & Filter / View Tab
As these tabs are the same in all manager, they are discussed here Entity Manager.
THE DOCUMENT MANAGER 66
9.0.0.214 (15.12.2021) ATLAS.ti 9 Windows - User Manual
81.
Quotation Manager
The QuotationManager can be used for retrieving and reviewing data by codes, creating smart codes, writing
comments , creating reports, or opening networks. When working with multimedia and geo data, it is useful to
rename quotation names as titles for audio- or video segments or for location names for geo data.
A single-click selects a quotation. If you have written a comment for the selected quotation, it is displayed in the
at the bottom of the window.
A double-click on a quotation loads its document (unless already loaded) and displays its content in context.
Multiple Selection: You can select more than one quotation at a time, either to delete them, to attach codes, to
open a network on them, or to create output.
Drag & Drop: By dragging one or more quotations onto other quotations, you create hyperlinks. See Working with
Hyperlinks for further information.
Filter: Click on one or more codes in the filter area on the left to view only quotations linked to the selected
code(s). Status Bar: The status bar at the bottom shows how many quotations there are in the project.
Quotation Manager Columns
QUOTATION MANAGER 67
9.0.0.214 (15.12.2021) ATLAS.ti 9 Windows - User Manual
82.
The information providedfor each quotation consists of: ID: The ID consist of two numbers best explained by an
example:
An ID 3:10 means that the quotation comes from document 3, and it is the 10th quotation that was created in this
document. Quotations are numbered in chronological and not in sequential order.
A tilde sign (~): indicates that a comment has been written for this quotation; Brackets (< or >): indicate that the
quotation is a start anchor or target for a hyperlink. Name: The first 100 characters of a quotation are used as the
default list name. This name can be changed if desired. The default name of a graphic, audio, or video quotation is
the name of the data file name. The name for geo quotations is the geographic reference. Document: The name of
the document it belongs to.
Density: Number of links to other quotations (= hyperlinks).
Codes: The codes the quotation is coded with.
Created By: The name of the user who created the quotation. Modified By: The name of the user modifying a
quotation, either changing the boundaries, renaming it or writing a comment. Created / Modified: Date and time
when a quotation was created and modified. Start / End / Extent: Start and end position of a quotation in the
document, and the total length of a quotation. The measure that is used is dependent on the media type. See
below: Start / End
Text quotation: number of paragraphs
Text PDF: page number in ATLAS.ti plus number of characters on the page
Graphic quotation: upper left coordinates / lower right coordinates
Audio quotation: hours:minutes:seconds: milliseconds
Video quotation: hours:minutes:seconds: milliseconds
Geo quotation: n/a
Extent
Text quotation: total number of paragraphs
Text PDF: total number of pages covered
Graphic quotation: height in pixel of the quotation's rectangle.
Audio quotation: hour:minutes:seconds:milliseconds
Video quotation: hour:minutes:seconds:milliseconds
Geo quotation: n/a
Quotation Manager Ribbon
From left to right:
•
•
•
•
•
•
•
•
•
•
•
•
QUOTATION MANAGER 68
9.0.0.214 (15.12.2021) ATLAS.ti 9 Windows - User Manual
83.
Smart code: Afterselecting codes in the side panel of the Quotation Manager you can create smart codes. See
Working with Smart Codes. Apply Coding: Coding a selected data segment with a new or existing code. See
Coding Data. Quick Coding: Coding with the last used code.
Rename Quotation: You have the option to enter a name for each quotation. This is useful for interpretive analysis
approaches, e.g., to summarize the quotation content or to use it as 'initial code' when using Charmaz's
constructive grounded theory approach. It is also useful when working with multimedia data to describe the
multimedia content in words.
Delete Quotation(s): Removes the quotation and all codings and other links from the project.
Edit Comment: Open a text editor for writing or editing a comment for a selected quotation. See Working With
Comments and Memos.
Merge Quotations: You can merge two or more quotations. The new quotation boundary can either be the
boundary of a selected target quotation, or it can be expanded to include all selected quotations.
Renumber Quotations: This eliminates all gaps in quotation numbering due to deletion and renumbers all
quotations in sequential order as they occur in the document.
Link Source: Uses the selected quotation as source in the process of creating a hyperlink. See Creating Hyperlinks.
Link Target: Click to select the selected quotation as target in the process of creating a hyperlink. See Creating
Hyperlinks.
Open Network: Open a network on one or more selected quotations. See Opening an ad-hoc Network.
Word Cloud: Word Clouds visualize the frequency of words. The more frequent a word occurs, the larger the word
is displayed in the image. In the Quotation Manager you can create word clouds for selected quotations. See
Creating Word Clouds.
Word List: This function allows you to generate a list of all words that occur in selected quotations. The list can be
sorted in alphabetic order or by frequency. You can export it to Excel for further data crunching. See Word Lists.
Report / Excel Export: Reports can be created as text file (Word, PDF), or in Excel format. All reports are
customizable. See Creating Reports.
Search & Filter / View Tab
As these tabs are the same in all manager, they are discussed here Entity Manager.
QUOTATION MANAGER 69
9.0.0.214 (15.12.2021) ATLAS.ti 9 Windows - User Manual
84.
Code Manager
The CodeManager is frequently used to:
create and modify codes
to code data segments via drag & drop
to set code colors
to retrieve coded data segments
to organize them in code groups
to merge and to split codes
to filter them
to review them in networks
to review its content using word clouds and word lists
to create reports.
Code Manager in Detail View A double click on a code opens the list of linked quotations in the Quotation Reader
You can browse through the list of quotations and view them highlighted in the context of its document. If there
is only one quotation linked to a code, it will immediately be highlighted in the context of its document.
Single-click: Selects a code. If you have written a definition for the selected code, it is displayed in the comment
pane below the list. Once selected, the code can be used for drag & drop coding, or you can add it to a code group
•
•
•
•
•
•
•
•
•
•
CODE MANAGER 70
9.0.0.214 (15.12.2021) ATLAS.ti 9 Windows - User Manual
85.
via drag &drop. Multiple Selection: You can select more than one code at a time by holding down the Ctrl or Shift
key. This is useful to:
delete multiple codes
to code a data segment with multiple codes
to open a network that includes all selected codes
to create reports based on the selected codes
to assign multiple codes to a code group or to remove them from a group
to create a new code group based on the selected codes
Drag & Drop: You can use the Code Manager as a convenient tool for coding by dragging codes onto a highlighted
piece of data. If you drag codes onto another code within the same list pane, code-links will be created. If you drag
a code on top of another code in the margin area, it will be replaced.
Colors: If you add code colors, a colored circle is displayed in front of the code icon and name. Code colors also have
an effect on the display of code nodes in networks. See Working with Networks.
Filter: Click on one or more code groups in the filter area on the left to set a local filter. This means only the items
in the manager are filtered. If you want to filter your entire project, then you need to set a global filter. See
Applying Global Filters for Data Analysis.
Status Bar: The blue status bar at the bottom shows how many codes there are in the project.
Code Manager Columns
The information provided for each code consists of: Name: Code name.
Groundedness Code frequency or groundedness. It shows how many quotations are linked to a code.
Density: Number of linkages to other codes. See Linking Nodes.
Groups: This column lists all groups a code belongs to.
•
•
•
•
•
•
CODE MANAGER 71
9.0.0.214 (15.12.2021) ATLAS.ti 9 Windows - User Manual
86.
Created By: Thename of the user who created the code. Modified By: The name of the user modifying the code,
either renaming it or writing a comment. Created / Modified: Date and time when a code was created and
modified (i.e., renaming it, writing a comment, merging or splitting it).
If you do not want to see all columns, right-click on a column header and deselect, what
you do not want to see.
Code Manager Ribbon
From left to right:
Free Code(s): Create one or more new codes. New Group: Create a new code group based on a selection you have
made. Create Smart Group: Smart Groups are a combination of existing groups using Boolean operators. For
further information see Working with Smart Groups. Smart code: If you select two or more codes in the Code
Manager, you can create ORed smart codes i.e., a smart code that combines all selected codes with the OR
operator. For further information see Working with Smart Codes . Create Snapshot: You can create a 'snapshot' of
a smart code to turn it into a regular code again with real links to quotations. The word snapshot indicates that it
conserves the state of the smart code. See Creating Snapshot Codes. Duplicate Code(s): This option duplicates an
existing code with all it links. It is a 1:1 clone of the original. Before the code splitting function became available it
was a helpful first step for splitting. Now this is no longer necessary. However, you might find some other usages
for it. See Working with Codes. Rename Code: When building a code system it is often necessary to rename a
code.
Delete Code(s): Delete selected code(s).
Edit Comment: Open a text editor for writing or editing a comment for a selected code. See Working with
Comments and Memos.
Edit Smart Code: A smart code is a saved query. If you want to see the query that the smart code is based upon or
edit it, use this option. For further information see Working with Smart Codes .
Open Group Manager: Open the Group Manager for Codes. See Working with Groups for more detail.
Change Color: Select a color for one or more selected codes.
Merge Codes: This option allows you to merge two or more codes into one code. If the codes have a comment, it
will be added to the merged code. In addition, information about which codes were merged will be added to the
comment of the merged code as an audit trail. Also see Merging Codes.
CODE MANAGER 72
9.0.0.214 (15.12.2021) ATLAS.ti 9 Windows - User Manual
87.
You need toselect multiple codes (i.e., all codes that you want to merge) in order for the Merge option to
become selectable.
Split Code: The split code function supports you in developing sub codes for a category. See Splitting a
Code.
Open Network: Opens an ad-hoc network on the selected code that shows all existing links. See Opening ad-hoh
Networks.
Code Tree: The code tree shows all links that you have created between codes. This is not a hierarchical tree as you
can link codes using directed and non-directed links. See the chapter on About Code Trees and the Code Forest.
Word Cloud: Word Clouds visualize the frequency of words. The more frequent a word occurs, the larger the word
is displayed in the image. Word Clouds are an exploratory tool that allow you to gain quick inside into your data. If
you create a word cloud for selected codes, it shows you the frequencies of the words that are coded with the
code(s). See Creating Word Clouds.
Word List: This function allows you to generate a list of all words that occur in the quotation sof the selected
code(s). The list can be sorted in alphabetic order or by frequency. You can export it to Excel for further data
crunching. See Word Lists.
Report / Excel Export: Reports can be created as text file (Word, PDF), or in Excel format. All reports are
customizable. See Creating Reports.
Tools Tab
Import / Export Codebook: A codebook including codes and code colors, code definitions and code groups can be
imported or exported in two formats: Excel and the QDPX exchange format. See Importing & Exporting Code Lists
and QDPX Universal Data Exchange.
Find Redundant Codings: It can happen that you code a longer segment and then within this segment you code a
segment using the same code again. This is redundant.
ATLAS.ti can find all those instances for you to help you clean up your coding. It is a helpful option when working
in teams where redundant codings may occur after merging. See Finding Redundant Codings ,
Search & Filter
The options under the Search tabs are the same as in all other managers, and are discussed here: Entity Manager.
CODE MANAGER 73
9.0.0.214 (15.12.2021) ATLAS.ti 9 Windows - User Manual
88.
View Tab
The aboveimage shows the default options: You see the code groups on the left-hand side, the comment field
below the code list, and the code list in 'Details' view.
Code Cloud
Click on the button Cloud to visualize your code list in form of a word cloud:
If you right-click on a code, the same context menu opens as in 'Details' view. Thus, in the
CODE MANAGER 74
9.0.0.214 (15.12.2021) ATLAS.ti 9 Windows - User Manual
89.
cloud view youcan start the same actions as in the regular view. You can for instance
rename codes, split or merge codes, or open a network on one or multiple codes.
Code List as Bar Chart
inst
Click on the button Bar Chart to visualize your code list in form of a bar chart.
CODE MANAGER 75
9.0.0.214 (15.12.2021) ATLAS.ti 9 Windows - User Manual
90.
The codes inthe bar chart view also have a context menu. Thus, also from here, you
can start the same actions as in standard view. Select multiple codes if you want to
merge codes.
CODE MANAGER 76
9.0.0.214 (15.12.2021) ATLAS.ti 9 Windows - User Manual
91.
Memo Manager
The MemoManager is used to keep track of your writing. You can create, read and review, comment, sort and
organize, and group your memos. Further options are to view a memo and its connection in a network, or to turn a
memo into a document for further analysis.
Single-click selects a memo. The content and if available comment of the memo is displayed in the bottom pane
of the window.
Multiple Selection: You can select more than one memo at a time by holding down the Ctrl or Shift-key for bulk
deletion. You may want to do this:
to open a network that contain the selected memos
to create a report for the selected memos
to assign multiple memos to a memo group, or to remove them from a group
to create a new memo group containing the selected memos.
Double-click opens the memo editor as floating window. This window can be docked into the currently active
region.
Ctr + Double-click opens the list of quotations that are linked to a memo.
Drag & Drop: You can attach a memo to a quotation by dragging it onto the quotation in the document or the
margin area.
A memo can also be dragged to a quotation, code or memo in the Project Explorer or any other list. Vice versa, you
can also drag quotations, codes or memos from any list or from the margin area to a memo to link it.
Filter: Click on one or more memo groups in the filter area on the left to set a local filter. This means only the
items in the manager are filtered.
Status Bar: The blue status bar at the bottom shows how many memos there are in the project.
•
•
•
•
MEMO MANAGER 77
9.0.0.214 (15.12.2021) ATLAS.ti 9 Windows - User Manual
92.
Memo Manager Columns
Theinformation provided for each memo consists of:
Name: Memo title.
Type: Memo type selected for this memo.
Grounded: Number of quotations to which a memo is connected.
Density: Number of codes and other memos to which the memo is connected.
Groups: This column lists all groups a memo belongs to.
Created By: The name of the user who created the memo.
Modified By: The name of the user modifying the memo.
Created / Modified: Date and time when a memo was created and modified (i.e., editing it, renaming it, or writing
a comment).
MEMO MANAGER 78
9.0.0.214 (15.12.2021) ATLAS.ti 9 Windows - User Manual
93.
Memo Manager Ribbon
Fromleft to right:
Create Free Memo: Create a new memo.
New Group: Create a new memo group based on the selection you have made.
Create Smart Group: Smart Groups are a combination of existing groups using Boolean operators. For further
information see Working with Smart Groups
Duplicate Memo(s): Duplicate an existing memo. Maybe it became to long, and you want to split it into two
memos.
Convert to Document: If you want to code a memo, or create quotations to hyperlink selected passages from a
memo to other data segments, you can convert a memo into a project document.
Edit Memo: Open text pane for writing the contents of a memo in a full-fledged text editor.
Rename Memo: Change the name of a selected memo.
Delete Memo(s): Delete selected memo(s).
Edit Comment: Open a text editor for writing or editing a comment for a selected memo. See Working With
Comments And Memos.
Set Type: The default memo type is "memo". This can be changed to a user defined type. Memos-types can be
used to sort and organize memos.
Open Group Manager: Open the Memo Group Manager. See Working With Groups for more detail.
Open Network: Open a network on the selected memo(s) that show all other entities the memo is linked to. See
Opening an ad hoc Network.
Report / Excel Export: Reports can be created as text file (Word, PDF), or in Excel format. All reports are
customizable. See Creating Reports.
Search & Filter / View Tab
As these tabs are the same in all manager, they are discussed here: Entity Manager.
MEMO MANAGER 79
9.0.0.214 (15.12.2021) ATLAS.ti 9 Windows - User Manual
94.
Network Manager
The NetworkManager is frequently used to create and open networks, to rename, comment and group them.
Single-click selects a network. The comment of the network is displayed in the pane at the bottom of the window.
Multiple Selection: You can select more than one network at a time by holding down the Ctrl or Shift-key. This is
useful for:
for bulk deletion
to assign the selected networks to a network group or to remove them from a group
to create a new network group from the selected networks
Double-click opens the network editor as floating window. This window can be docked into the currently active
region.
Drag & Drop: You can add a network as node to a network editor, or assign selected networks to a group via drag &
drop.
Filter: Click on one or more network groups in the filter area on the left to set a local filter. This means only the
items in the manager are filtered.
Status Bar: The Status Bar shows how many networks there are in the project.
Network Manager Columns
•
•
•
NETWORK MANAGER 80
9.0.0.214 (15.12.2021) ATLAS.ti 9 Windows - User Manual
95.
The information providedfor each network consists of:
Name: Name of the network.
Degree: Number of nodes in a network.
Groups: This column lists all groups a network belongs to.
Created By: The name of the user who created the network.
Modified By: The name of the user modifying the network.
Created / Modified: Date and time when a network was created and modified.
Network Manager Ribbon
From right to left:
Create Network: Create a new network.
New Group: Create a new network group based on the selection you have made.
New Smart Group: Smart Groups are a combination of existing network groups using Boolean operators. This
option is only available to offer consistent choices in all managers. You may not even feel the need to create
network groups, let alone combining them using smart groups :-).
Duplicate: Duplicates the selected network. This option is useful it you want to create a spin-off of an already
existing network where parts of the existing network is still relevant, and you want to build on it further.
Rename Network: Change the name of an existing network.
Delete Network(s): Delete selected network(s).
Edit Comment: Open a text pane for writing or editing a comment for a network in a full-fledged text editor.
Open Group Manager: Open the group manager for networks.
Excel Export: Exports the information displayed in the Network Manager.
NETWORK MANAGER 81
9.0.0.214 (15.12.2021) ATLAS.ti 9 Windows - User Manual
96.
Search & Filter/ View Tab
As these tabs are the same in all manager, they are discussed here: Entity Manager.
NETWORK MANAGER 82
9.0.0.214 (15.12.2021) ATLAS.ti 9 Windows - User Manual
97.
Link Manager
The LinksManager lists all existing code-code links and all existing hyperlinks (links between two quotations). It is
frequently used to review, modify or comment these links. You can switch to view the list of Code-Code Links and
the list of Hyperlinks.
Link Manager Columns for Code-Code Links
The information provided for each code-code link consists of:
Source: The start position of a link. This is relevant for directed (asymmetric and transitive) links.
Relation: Relations can be used to name a link. This is possible for code-code links and for links between
quotations (hyperlinks). See the section on Working with Networks for more detail.
Target: The end position of a link.
Created by: The name of the user who created the link.
Modified by: The name of the user modifying the link.
Created / Modified: Date and time when a link was created and modified.
In the side panel on the left-hand side you see the list of all available relations and how often they have been used
(number in parentheses). Click on one or more relations in the side panel filter the list of links.
LINK MANAGER 83
9.0.0.214 (15.12.2021) ATLAS.ti 9 Windows - User Manual
98.
Link Manager Columnsfor Hyperlinks
The information provided for each hyperlink consists of:
Source: The start position of a hyperlink. This is relevant for directed (asymmetric and transitive) links.
Relation: Relations can be used to name a hyperlink. See the section on Working with Hyperlinks for more detail.
Target: The end position of a hyperlink.
Created By: The name of the user who created the hyperlink.
Modified By: The name of the user modifying the hyperlink.
Created / Modified: Date and time when a hyperlink was created and modified.
In the side panel on the left-hand side you see the list of all available relations for hyperlinks and how often they
have been used (i.e., number in parentheses). If you click on one or more relations, all hyperlinks will be filtered by
the selected relations.
Link Manager Ribbon
LINK MANAGER 84
9.0.0.214 (15.12.2021) ATLAS.ti 9 Windows - User Manual
99.
The ribbon isthe same for Code-Code and hyperlinks.
From left to right:
Cut Link(s): Cutting the link between selected codes or quotations.
Flip Link(s): Change source and target of selected link.
Change Relation: Change the relation of a selected link.
Edit Comment: Open a text editor for writing or editing a comment for a selected link.
Open Relation Manager; You can access the Relation Manager from here, if you want to create or modify a
relation. See Creating New Relations.
Filter: You can filter links by selecting a relation in the filter area on the left. The Filter button in the ribbon offers
some additional options: you can invert the filter, or filter by links created today, created this week, created by
yourself, or by all links that have a comment.
Open Network: Open a network on the selected link(s). See Open ad-hoc Network.
Excel Export: You can export the information you see in the manager as Excel table.
View Tab
As the view tab is the same in all manager, it is discussed here: Entity Manager.
LINK MANAGER 85
9.0.0.214 (15.12.2021) ATLAS.ti 9 Windows - User Manual
100.
Relation Manager
You canaccess the Relation Manager from within networks or via the drop down option of
the Links button in the Home ribbon.
The Relation Manager is used to review the properties of existing relations, to edit existing relations, or to create
new relations. You can switch between relations for code-code links and relations for hyperlinks. As the column
information and the ribbon options are the same for both, below you find only one description. For further
information see Working With Networks.
Single-click: Selects a relation. Its properties and comment are displayed in the bottom pane of the window.
Relation Manager Columns
The information provided for each relation consists of:
Name: Full name of the relation.
RELATION MANAGER 86
9.0.0.214 (15.12.2021) ATLAS.ti 9 Windows - User Manual
101.
Usage: Number oftimes it is used in the project.
Style: Preview of line: direction, color, width and property (directed, non-directed)
Width: Actual width of the line.
Layout: Automatic layout direction if you open a network on an entity.
Short: Short name as an alternative to the full name. You can either display full names, short names or the
symbolic name for all relations in a network.
Symbol: Symbolic name as an alternative to the full name. You can either display full names, short names or the
symbolic name for all relations in a network.
Formal Property: The formal property of a relation: symmetric, asymmetric, or transitive. See About Relations.
Created By: Name of the user who created the relation.
Modified By: Name of the user who modified the relation.
Created / Modified: Date and time when a relation was created and modified (i.e., editing it, renaming it, or
writing a comment).
Relation Manager Ribbon
From left to right:
New Relation: Select to create a new relation.
Duplicate Relation(s): Duplicate a relation, e.g., if you want to create a new relation based on an already existing
relation with a few modifications.
Rename Relation: Select a relation and rename it.
Delete Relation(s): Select on or more relations that you want to delete.
Line Color: Select the line color.
Line Width: Select the line width.
Line Style: Select the line style(solid or dashed).
Layout Direction: Select the layout direction. If you open an ad-hoc network, the layout directions are used to
position the nodes in the network.
RELATION MANAGER 87
9.0.0.214 (15.12.2021) ATLAS.ti 9 Windows - User Manual
102.
Formal Property: Selectthe property for the relation. Options are: transitive, symmetric or asymmetric. This is
further explained in the section About Relation
Filter: You can filter relations based on the following options: created today, created this week, created by yourself,
or all relations that have a comment. An additional option is to invert the filter.
Excel Export: You can export the information you see in the manager as Excel table.
View Tab
As the View tab is the same in all manager, it has been described here Entity Manager.
RELATION MANAGER 88
9.0.0.214 (15.12.2021) ATLAS.ti 9 Windows - User Manual
103.
Supported File Formats
Inprinciple, most textual, graphical, and multimedia formats are supported by ATLAS.ti. For some formats, their
suitability depends on the state of your Windows system. Before deciding to use an exotic data format, you
should check if this format is available and if it is sufficiently supported by your Windows system.
Textual Documents
The following file formats are supported:
Format File Type
MS Word .doc; .docx; .rtf
Open Office .odt
HyperText Markup Language .htm; .html
Plain text .txt
other .ooxml
Text documents can be edited in ATLAS.ti. This is useful to correct transcription errors, to change
formatting, or to add missing information. When adding an empty text document to an ATLAS.ti project,
you can also transcribe your data in ATLAS.ti. We however recommend using a dedicated transcription tool
or use automated transcriptions. You can add transcripts with timestamps and synchronize them with the
original audio or video file. For this you use Multimedia Transcripts.
Transcripts
You can prepare your own transcripts in ATLAS.ti, or import transcripts that have been created elsewhere.
This could mean - you or another person transcribing data for you - have used a specialized transcription software
like:
Easytranscript
f4 & f5 transcript
Transcribe
Inqsribe
Transana
ExpressSribe, a.o.;
Another source are transcript prepared automatically by services like Microsoft Teams, Zoom or YouTube in SRT or
VTT format. Examples of supported services are:
MS Teams
Zoom
YouTube
•
•
•
•
•
•
•
•
•
SUPPORTED FILE FORMATS 89
9.0.0.214 (15.12.2021) ATLAS.ti 9 Windows - User Manual
104.
Happyscribe
Trint
Descript
Sonix
Rev.com
Panopto
Transcribe by Wreally
Temi
SimonSays
Vimeo
Amberscript
Otter.ai
Vocalmatic
eStream
For further information on how to import transcripts from these services, see Importing Automated Transcripts in
VTT and SRT format
PDF files (Text and Graphic)
PDF files are perfect if you need the original layout. When PDF was invented, its goal was to preserve the same
layout for onscreen display and in print.
If the PDF file has annotations, they are displayed in ATLAS.ti. However, they cannot be edited.
When preparing PDFs, you need to pay attention that you prepare a text PDF file and not a graphic PDF. If you do
the latter, then ATLAS.ti treats it as a graphic file, and you cannot search it or retrieve text.
When scanning a text from paper, you need to use character recognition software (OCR, frequently provided with
your scanner) in order to create a text PDF file. Another option is to apply character recognition in your PDF reader/
writer software.
When you retrieve text from a coded PDF segment the output will be rich text. Thus, you may loose the original
layout. This is due to the nature of PDF as mentioned above. It is a layout format and not meant for text
processing.
Images
Supported graphic file formats are: bmp, gif, jpeg, jpg, png, tif and tiff.
Size recommendation: Digital cameras and scanners often create images with a resolution that significantly
exceeds the resolution of your screen. When preparing a graphic file for use with ATLAS.ti, use image-processing
software to reduce the size so that the graphics are comfortably displayed on your computer screen. ATLAS.ti does
resize the images if they are too big. But this requires additional computer resources and unnecessarily uses space
on your computer hard disk.
To resize and image manually, you can use the zoom function via the mouse wheel or the zoom button in ATLAS.ti.
•
•
•
•
•
•
•
•
•
•
•
•
•
•
SUPPORTED FILE FORMATS 90
9.0.0.214 (15.12.2021) ATLAS.ti 9 Windows - User Manual
105.
Audio- and VideoDocuments
Supported audio file formats are: aac, m4a, mp3, mp4, wav. Supported video file formats are; 3g2, 3gp, 3gp2,
3gpp, asf, avi, m4v, mov, mp4, wmv For audio files, our recommendation is to use *.mp3 files with AAC audio, and
for video files *.mp4 file with AAC audio and H.264 video. These can be played both in the Windows and in the Mac
version. More information is available here. As video files can be quite sizable, we recommend to link video files to
an ATLAS.ti projects rather than to import them. See Adding Documents for further information.
Geo Documents
When you want to work with Geo data, you only need to add a new Geo Document to your ATLAS.ti project. This
opens an Open Street world map. When you click on the option Query Address, you can navigate to a specific
region or location on the map. For more information, see Working With Geo Docs.
Survey Data
The survey import option allows you to import data via an Excel spreadsheet (.xls or .xlsx files). Its main purpose is
to support the analysis of open-ended questions. However, this option can also be used for other case-based data
that can easily be prepared in form of an Excel table.
In addition to the answers to open-ended questions, data attributes (variables) can also be imported. These will be
turned into document groups in ATLAS.ti. For more information, see Working With Survey Data.
Reference Manager Data
In order to support doing a Literature Review with ATLAS.ti, you can import articles from reference managers. The
requirement is that you are using a reference manager that can export data as Endnote XML file like Endnote,
Mendeley, Zotero, or Reference Manager.
If your reference manager cannot export data in Endnote xml format, you can export data in RIS or BIB format and
use the free version of Mendeley or Zotero to produce the xml output for ATLAS.ti.
See Working With Reference Manager Data.
Twitter
You can collect data from Twitter searching for keywords, hashtags, users, etc. ATLAS.ti can collect tweets that
are not older than one week !
You need to sign in with your own twitter account to import twitter data to ATLAS.ti. See Working With Twitter
Data.
SUPPORTED FILE FORMATS 91
9.0.0.214 (15.12.2021) ATLAS.ti 9 Windows - User Manual
106.
Evernote
If you collectand store you data using Evernote, you can directly import files and folders from Evernote. See Bring
out the best in Evernote with ATLAS.ti 8 Windows.
Supported formats are:
Evernote Export File Type
Evernote 2.x database .enb
Evernote exported XML data .enex
Evernote database .exb
Evernote data .reco
Evernote handwritten notes and sketches .top
Evernote for Google Android note file .enml
----------------------------------------- -------
SUPPORTED FILE FORMATS 92
9.0.0.214 (15.12.2021) ATLAS.ti 9 Windows - User Manual
107.
Adding Documents
Video Tutorial:Creating a project and importing data.
What happens when you add documents to a project
All documents that you add to a project are copied, and the copies become internal ATLAS.ti files. This
means, strictly speaking, that ATLAS.ti no longer needs the original files. However, we strongly recommend
that you keep a backup copy of your original sou
When you add documents to a project, they are stamped with a unique ID. This ID allows ATLAS.ti to detect if
documents are the same when merging different projects.
Important note for team projects
When you work in a team and want to work on the same documents, it is important that one person is setting up
the project and adds all documents that should be shared. The consequence of not doing is that documents of the
same content are duplicated or multiplied during the process of merging projects. See Team Work for further
information.
How to add documents
Click on the Add Documents button in the Home tab, or click on the dialog box launcher
(drop-down arrow), or drag- and-drop them from the File Manager either onto the
document display area or the ribbon.
ADDING DOCUMENTS 93
9.0.0.214 (15.12.2021) ATLAS.ti 9 Windows - User Manual
108.
If you clickon "Add Documents", you can select individual files. If you want to add entire folders or link larger
multimedia files (audio / video) to your project, click on the dialog box launcher and select the appropriate option.
All added or linked documents are numbered consecutively starting with D1, D2, D3 and so on.
Linking Video Files
As video files can be quite sizable, you have the option to link them to a project instead of adding them. This
means they remain at their original location and are accessed from there. Preferably, these files should not be
moved to a different location.
If the files need to be moved, you need to re-link the files to your project. ATLAS.ti will alert you, if there is an
issue, and a file can no longer be accessed. You find a Repair Link option in the Document Manager under the
Document Manager > Tools Tab.
Sort Order of Documents
The default sort order is by name in alphabetical order. You cannot change the order of the documents by dragging
them to a different position. However, it is possible to change the order of the documents by renaming and then
renumbering them. See User-defined document sort order.
ADDING DOCUMENTS 94
9.0.0.214 (15.12.2021) ATLAS.ti 9 Windows - User Manual
109.
What happens whenyou add documents to a project
All documents that you add to a project are copied, and the copies become internal ATLAS.ti files. This means,
strictly speaking, that ATLAS.ti no longer needs the original files. However, we strongly recommend that you keep
a backup copy of your original source files.
When you add documents to a project, they are stamped with a unique ID. This ID allows ATLAS.ti to detect if
documents are the same when merging different projects.
When you work in a team and want to work on the same documents, it is important that one person is
setting up the project and adds all documents that should be shared. The consequence of not doing is that
documents of the same content are duplicated or multiplied during the process of merging projects. See
Team Work for further information.
Size Res
Theoretically, size restrictions do not play a major role due to the way ATLAS.ti handles documents. However, you
should bear in mind that your computer's processing speed and storage capacity may affect the performance.
Excessively large documents can be uncomfortable to work with, even when you have an excellently equipped
computer. The crucial issue is not always the file size, but rather, in the case of multimedia files, the length of
playing time.
For textual documents, the number and size of embedded objects may cause extraordinarily long load times.
There is a high likelihood that if a textual document loads slowly in ATLAS.ti, it would also load slowly in WORD or
WordPad.
For very long texts or multimedia files, scrolling to exact positions can be cumbersome.
Please keep those issues in mind when preparing your files.
A Word about "Big Data"
Please keep in mind that the focus of ATLAS.ti is to support qualitative data analysis and to a lesser extent the
analysis of qualitative data.
Big data is a buzz word nowadays, and a lot of big data often comes as text or images, hence could be considered
qualitative. ATLAS.ti, however, is not suited for true big data analysis, which is not the same as qualitative data
analysis.
As point of orientation, coding can be supported using the auto coding feature. However, you still need to read and
correct the coding, and most coding in ATLAS.ti is done while the researcher reads the data and creates or selects
and applies a code that fits.
A project is too large if you have so much data that you need to rely on a machine to do all the coding for you and
you cannot read what has been coded yourself. If this is the case, ATLAS.ti might not be the right tool for you.
ADDING DOCUMENTS 95
9.0.0.214 (15.12.2021) ATLAS.ti 9 Windows - User Manual
110.
Transcription
You can prepareyour own transcripts in ATLAS.ti, or import transcripts that have been created elsewhere.
This could mean - you or another person transcribing data for you - have used a specialized transcription software
like:
Easytranscript
f4 & f5 transcript
Transcribe
Inqsribe
Transana
ExpressSribe, a.o.;
Another source are transcript prepared automatically by services like Microsoft Teams, Zoom or YouTube in SRT or
VTT format. Examples of supported services are:
MS Teams
Zoom
YouTube
Happyscribe
Trint
Descript
Sonix
Rev.com
Panopto
Transcribe by Wreally
Temi
Simon Says
Vimeo
Amberscript
Otter.ai
Vocalmatic
eStream
For further information on how to import transcripts from these services, see Importing Automated Transcripts in
VTT and SRT format
•
•
•
•
•
•
•
•
•
•
•
•
•
•
•
•
•
•
•
•
•
•
•
TRANSCRIPTION 96
9.0.0.214 (15.12.2021) ATLAS.ti 9 Windows - User Manual
111.
Preparing your OwnTranscript
A multimedia transcript in ATLAS.ti consists of two documents: an audio or video file plus an associated
transcript. The first step is to add the audio or video file to a project. Then you can associate one or
multiple transcripts with the document.
It is not yet possible to set timestamps in ATLAS.ti Windows. You can only view existing timestamps if you
import transcripts from other sources like automated transcripts prepared by Teams or Zoom.
Step 1 - Add a Audio or Video File
To add an audio or video file: click on the Add Documents button in the Home ribbon; or
select the link option from the dropdown menu: Add Documents > Add Linked Video/
Audio.
For more information see: Add a multimedia file to your project.
Step 2 - Create a Word file
Create a new document in Word and save it under a meaningful name like "TR _Tim
Miller_m_t_south_58"
(TR = transcript; Tim Miller = interviewee name or pseudonym; m = male; south = from region south; 58 = age 58).
Step 3 - Associate the Word File
Load the multimedia document, select the Tools tab in the toolbar, and from there Import
Transcript. Select the Word document that you have prepared in step 2.
The transcript will be imported into the project and loaded next to the multimedia file, and you see a new entry in
the Project Explorer under the Multimedia Transcripts branch.
Step 4 - Begin to transcribe
Click on the Edit button.
PREPARING YOUR OWN TRANSCRIPT 97
9.0.0.214 (15.12.2021) ATLAS.ti 9 Windows - User Manual
112.
Start the recordingby clicking on the Play button, and listen to as much as you can
remember. Stop the audio or video recording.
Start typing the transcript in the space on the right-hand side.
Repeat.
Click on the Save button in the edit toolbar from time to time. When you close the edit mode without saving,
ATLAS.ti will remind you.
In the future, you will also be able to set timestamps that synchronize the audio/video file with the
transcript. This is currently only available in the ATLAS.ti Mac version.
PREPARING YOUR OWN TRANSCRIPT 98
9.0.0.214 (15.12.2021) ATLAS.ti 9 Windows - User Manual
113.
Importing Transcripts inRTF or Word format
A multimedia transcript in ATLAS.ti consists of two documents: an audio or video file plus an associated
transcript. The first step is to add the audio or video file to a project. Then you can associate one or
multiple transcripts with the document.
The different transcription programs use various formats for time stamps. ATLAS.ti supports the following:
Transcription Software Format of time stamps
Easytranscript, f4 & f5transcript #hh:mm:ss-x#
Transcribe [hh:mm:ss]
HyperTRANSCRIBE, Inqscribe, Transcriva [hh:mm:ss.xx]
HyperTRANSCRIBE, Inqscribe, Transcriva [hh:mm:ss.xxx]
Transana (h:mm:ss.xx)
Transcriber Pro hh:mm:ss
This is how you import an existing transcript:
Step 1 - Add an Audio or Video File
To add an audio or video file: click on the Add Documents button in the Home ribbon; or
select the link option from the dropdown menu: Add Documents > Add Linked Video/
Audio.
For more information see: Add a multimedia file to your project.
Step 2 - Associate a Transcript
Load the multimedia document, select the Tools tab in the toolbar, and from there Import
Transcript.
inst
Select the transcript that belongs to the audio or video file and click Open. Currently,
IMPORTING TRANSCRIPTS IN RTF OR WORD FORMAT 99
9.0.0.214 (15.12.2021) ATLAS.ti 9 Windows - User Manual
114.
supported file formatsare: txt, rtf, doc, docx, srt, and vtt.
The transcript will be imported into the project and loaded next to the multimedia file.
Below you see an audio recorded interview transcribed with f4 transcript.
Further, you see a new entry in the Project Explorer under the Multimedia Transcripts branch.
It is possible to associated multiple transcripts with the same audio or video file, e.g. if you have different
language versions.
Synchronized Scrolling
By default, synchronized scrolling is activated in the toolbar after importing a transcript. This means when you
play the multimedia file, the text segment in the transcript between two timestamps is highlighted while the
multimedia file is playing.
In the lower area of the multimedia file you can see the timestamps. However, these are not visible in the
transcript in the current Windows version and cannot be modified.
Deleting an As
Open the Multimedia Transcripts branch in the Project Explorer, right-click on either
transcript or the multimedia file, and select Delete.
IMPORTING TRANSCRIPTS IN RTF OR WORD FORMAT 100
9.0.0.214 (15.12.2021) ATLAS.ti 9 Windows - User Manual
115.
This does notremove the document from the project. The multimedia file and transcript are still available in the
Documents branch, but they are no longer associated.
If you want to remove an associated document from the project, you need to delete the association first.
IMPORTING TRANSCRIPTS IN RTF OR WORD FORMAT 101
9.0.0.214 (15.12.2021) ATLAS.ti 9 Windows - User Manual
116.
Importing Automated Transcriptsin VTT and SRT
format
A key shift that we have seen due to the COVID-19 pandemic is that researchers conduct their interviews via MS
Teams or Zoom. Both create an automated transcript or caption of the recording, which can serve as a first version
rough transcript. With ATLAS.ti you can import the transcript and associate it with the video recorded interview.
The automated transcripts are provided in form of VTT or SRT files. This is standard also used by many other
services. Thus, with ATLAS.ti’s native support for this format, you can now import transcripts from a great many
services. Examples are:
MS Teams
Zoom
YouTube
Happyscribe
Trint
Descript
Sonix
Rev.com
Panopto
sonix
Transcribe by Wreally
Temi
Simon Says
Vimeo
Amberscript
Otter.ai
Vocalmatic
eStream
All what you then need to do is to go through the text and make changes as necessary, and your transcript is
done!
•
•
•
•
•
•
•
•
•
•
•
•
•
•
•
•
•
•
IMPORTING AUTOMATED TRANSCRIPTS IN VTT AND SRT FORMAT 102
9.0.0.214 (15.12.2021) ATLAS.ti 9 Windows - User Manual
117.
How to GenerateAutomated Transcripts - Useful Links
For most services, you will find instructions on how to generate and export transcripts on their websites. This is
the best source of information as we are currently witnessing a rapid development in the area of automated
transcription and procedures may change quickly. For your convenience, below we provide some links but invite you
to also search yourself for updated information.
Zoom
Instructions how to generate transcripts from Zoom recordings
Microsoft Teams
Instructions on how to record a meeting in MS Teams
Information on how to generate automatic captions
In the following video it is demonstrated how to conduct and transcribe interviews with Microsoft Teams.
YouTube does not provide information directly on how to access the subtitles. If you search online, you will find a
number of third-party tools that support the download of YouTube videos with subtitles.
•
•
•
•
IMPORTING AUTOMATED TRANSCRIPTS IN VTT AND SRT FORMAT 103
9.0.0.214 (15.12.2021) ATLAS.ti 9 Windows - User Manual
118.
How to ImportAutomated Transcripts
Step 1 - Add an Audio or Video File
To add an audio or video file: click on the Add Documents button in the Home ribbon; or
select the link option from the dropdown menu: Add Documents > Add Linked Video/
Audio.
For more information see: Add a multimedia file to your project.
Step 2 - Associate a Transcript
Load the multimedia document, select the Tools tab in the toolbar, and from there Import
Transcript.
HOW TO IMPORT AUTOMATED TRANSCRIPTS 104
9.0.0.214 (15.12.2021) ATLAS.ti 9 Windows - User Manual
119.
inst
Select the VVTor SRT file and click Open.
The transcript will be imported into the project and loaded next to the multimedia file. Further, you see a new
entry in the Project Explorer under the Multimedia Transcripts branch.
Below you see a video interview
recorded in MS Teams with the auto generated transcript in VTT format. The transcription will not be perfect,
however it serves as a good starting point. Editing the transcript will take less time than starting from scratch.
Furthermore, reading and correcting the transcript allows you to familiarize yourself with the data.
HOW TO IMPORT AUTOMATED TRANSCRIPTS 105
9.0.0.214 (15.12.2021) ATLAS.ti 9 Windows - User Manual
120.
It is possibleto associated multiple transcripts with the same audio or video file, e.g. if you have different
language versions.
HOW TO IMPORT AUTOMATED TRANSCRIPTS 106
9.0.0.214 (15.12.2021) ATLAS.ti 9 Windows - User Manual
121.
Adding a GeoDocument to a Project
ATLAS.ti uses Open Street Map or Bing Map / Big Satelite Map as its data source for geo documents. Even though
there is only one data source, you can also use more than one geo docs in your project, e.g. to create distinct sets
of locations, to simulate tours, to simply tell different stories.
To add a geo document to the project, go to the Home tab, look for the Add Documents
button, click on the drop down arrow and select New Geo Document.
A new document is added and if you open it you see the world map. The default name is "New Geo Document".
You may want to rename it, so it better describes your analytic intention.
Finding a Location
The first thing you probably want to do is to query an address:
In the Document tab, click on the button Query Address.
A new tab opens in the navigator on the left. Enter a search term.
ADDING A GEO DOCUMENT TO A PROJECT 107
9.0.0.214 (15.12.2021) ATLAS.ti 9 Windows - User Manual
122.
The map immediatelydisplays the location that fits the search term and adds a place mark.
Changing the View from Open Street Map to Bing
If you prefer to use Bing Map or Bing Satelite Map,
Select the contextual Tools Tab and change the Map Type in the section Maps.
For further information, see Working with Geo Data.
ADDING A GEO DOCUMENT TO A PROJECT 108
9.0.0.214 (15.12.2021) ATLAS.ti 9 Windows - User Manual
123.
Working with GeoDocuments
Change Map Type
Under the tools tab, you can change how you want to view your geo document. Options are:
Open Street Map
Road Map (Here - Map Data)
Satellite Map (Here - Map Data)
Creating Geo Quotations
For more general information on quotations, see Quotation Level and Working with Quotations.
Creating a Geo quotation is not much different from creating other type of quotations. The only difference is that
the quotation is just one location on the map - the place mark, and not a region.
Right-click on the place mark and select the option Create Free Quotation (or click on the
Create Free Quotation button in the Document ribbon).
To create further quotations:
inst
Either enter a new address and search for a location of interest, or left-click a point of
interest on the map to set a place mark.
Right-click and select Create Free Quotation from the context menu.
If you move your mouse over a quotation, a text window opens displaying information
about the quotation like the name, the author, when it was created, any codes and memos
that are attached to it, the longitude and latitude and the address.
Display of Geo Q
Geo quotations can be access in the margin area, the Quotation Manager, the Project Explorer, and from within
networks. Geo quotations are displayed as follows:
The quotation icon shows a place mark.
In the Project Explorer, the Quotation Reader and Manager and all reports, geo quotations are referenced in
decimal degrees, e.g. LAT 48.859911° LON 2.377317°. In addition, the Quotation Manager shows a preview of
the Geo location. You may want to consider renaming Geo quotations, e.g. by adding the name of the
location to the coordinates. Another option is to add a comment. See also Working with Multimedia
•
•
•
•
•
WORKING WITH GEO DOCUMENTS 109
9.0.0.214 (15.12.2021) ATLAS.ti 9 Windows - User Manual
124.
Quotations.
Activating Geo Quotations
Selecta Geo quotation in any of the following places and double-click:
margin area
Quotation Manager
Project Explorer
Network
The quotation will be displayed in context.
An activated place mark is colored in orange. Non-activated place marks are colored in gray.
Modifying a Geo quotation
To modify a Geo quotation, activate it so it is highlighted in orange.
Move the place mark to a different location. The quotation follows along.
Coding Geo Quotations
For more general information on coding, see Codind Data.
You can also create a quotation and link a code to it in one step, or code an existing quotation:
•
•
•
•
WORKING WITH GEO DOCUMENTS 110
9.0.0.214 (15.12.2021) ATLAS.ti 9 Windows - User Manual
125.
Set a placemark or select an existing quotation, right-click and select the option Apply
Codes (or click on the equivalent coding buttons in the Document ribbon).
All other drag-and-drop operations described for coding also apply.
Creating a Geo
You can create a snapshot from the geographic region that is currently shown on your screen. This snapshot is
automatically added as a new image document.
The advantage of the image is that you can select a region as quotation and not only a single point on a map.
Further you can browse the Geo location in Google Maps (see below).
Open a Geo document.
In the toolbar, click Snapshot.
A new document is created. The default name is: 'Geo Snapshot @ longitude:latitude' of
the last selected location.
As a snapshot results in an image document, you can also handle it like an image document. See for example
Creating Image Quotations.
Browsing Geo Locations in Google Map
Create a Geo snapshot.
In the contextual Tools tab, selecting the button Browse Geolocation
This opens Google Maps in your default browser outside of ATLAS.ti.
WORKING WITH GEO DOCUMENTS 111
9.0.0.214 (15.12.2021) ATLAS.ti 9 Windows - User Manual
126.
Working With SurveyData
These days, most surveys are conducted online. A positive side effect is that (a) all data is immediately available in
a digital format and (b) respondents often do write lengthy answers to open-ended questions. If you work with
surveys from the analog world, chances are, they will end up in an Excel™ spreadsheet at some point. Regardless
how your surveys originate, ATLAS.ti can handle them once they exist in that format.
Online surveys can be created using a number of tools. What most of these tools have in common is that the let
you export your data as Excel™ file. And this is what you need to prepare for import in ATLAS.ti. You can download
a sample Excel file here.
Here you find information on how to prepare survey data for import: Preparing Survey Data for Import.
Here you find information on how to import survey data: Importing Survey Data.
WORKING WITH SURVEY DATA 112
9.0.0.214 (15.12.2021) ATLAS.ti 9 Windows - User Manual
127.
Preparing Survey DataFor Import
A survey broadly consists of the name of the survey, the questions, and the answers for each respondent.
Questions can be of different type:
Single choice between two (yes/no) or more options
Multiple choice
Open ended
Within the framework of ATLAS.ti these concepts are mapped as follows:
Survey Concept ATLAS.ti Concept Prefix
Open-ended question Code (and code comment)
:: to separate code and
comment
Answer to an open ended
question
Content of a quotation (data) (none)
Single Choice question 0/1 Document group .
Single Choice question > 2
options
Document groups for each
value
:
Multiple Choice question
Document groups for each
value
#
Based on specific prefixes that you add to your variable names, ATLAS.ti interprets the column headers and cells
of the Excel™ table in different ways and turns them into documents, the content of documents, document
groups, quotations, codes, comments and code groups. Sounds complicated, right? Not so - just follow along, it is
actually very easy!
Data are imported case-based. This means each row of the Excel™ table that is imported from the online survey
tool is transformed into a document.
In addition to the answers to open-ended questions, demographic information like age, profession, or age group,
answers to single choice questions (yes/no, or offering more than two options) and answers to multiple choice
questions can be imported. Within the framework of ATLAS.ti these are mapped in the form of document groups,
one group per value.
Syntax
Syntax Results in ATLAS.ti
! The name in the cells is used as document name
~ This content is used as document comments
<
When added, this column is ignored. Use this to exclude variables you do not want to
analyze in ATLAS.ti
:
Each cell value is turned into a group. The column header is used as main group name. For
example: If you have two values in the column :Gender (male and female) two document
groups with the following names are created:Gender::male and Gender::female. The
documents are sorted into those groups accordingly.
.
A document group is only created from answers coded with 1 or yes. For example: If the
survey contains a question: "Do you think that children bring happiness?" and the answer
choices are yes and no (0/1), then only one group is created and respondents who answered
the question with yes are sorted into that group.
•
•
•
PREPARING SURVEY DATA FOR IMPORT 113
9.0.0.214 (15.12.2021) ATLAS.ti 9 Windows - User Manual
128.
Syntax Results inATLAS.ti
#
Document groups are created for each entry in a cell, which are separated by a comma. Use
this option for questions that allow multiple responses For example: "Which of the following
foods do you like? Choose as many that apply." Possible answers are: chocolate, cheese,
ham, oranges, apples, potatoes or carrots. Respondent 1 selects: chocolate, cheese, apples.
Respondent 2 selects: chocolate, ham, potatoes. When importing the data you get a
document group for each of the possible response choices and each document is added to all
document groups that apply. Assuming the column label is #Selected Foods, the document
for respondent 1 will be added to the document groups: Selected Foods::chocolate, Selected
Foods::cheese, and Selected Foods::apples.
All column headers without a prefix are interpreted as codes; the text in the cells will be the content for the
documents to be analyzed. If the question is longer, and you do not want to use the full question as code name,
then the full question content can be added as code comment. For example, when using the column header
'Question 1::Please write down reasons why you want to have children', Question 1 is used as code name; the text
after the two colons is used as code label.
You can import tables in xls or xlsx format. In case you experience a problem, save the table in .csv format
and try again.
If you import the same table repeatedly, rows with already existing documents are ignored. This way, you do not
have to wait until the last respondent has filled out the questionnaire.
When importing the same data again with updated information, you can only import new cases (i.e. rows
in Excel), but not new questions (i.e. columns in Excel).
PREPARING SURVEY DATA FOR IMPORT 114
9.0.0.214 (15.12.2021) ATLAS.ti 9 Windows - User Manual
129.
Importing Survey Data
Selectthe Import & Export tab and then the Survey button.
Inst
Select the Excel file to be imported and click Open.
The import procedure starts. You see a progress report and ATLAS.ti informs you when the
import is finished.
IMPORTING SURVEY DATA 115
9.0.0.214 (15.12.2021) ATLAS.ti 9 Windows - User Manual
130.
Inspecting Imported SurveyData
Open the Document Manager and take a look at what has been added to the project:
Document names: If you do not specify a name for each case, the default is case 1, case 2, case 3 and so on. In the
example shown here, the name/synonym of each respondent was known and entered as author.
Document groups: Based on the information provided in the Excel table, document groups are created. The
highlighted respondent 'case 6' in the example has some college education, is a female, single, and has no
children. She answered the question: 'Do children bring happiness' with yes.
ATLAS.ti automatically creates a group that contains all survey data in case you work with data from multiple
sources.
If your data comes in waves, you can add the data to the same data and import it again. ATLAS.ti will only
import the new information.
You can only import new cases (i.e. rows in Excel), but not new questions (i.e., columns in Excel).
Data: The document text for each case consists of the answers to the open questions. Each answer is
automatically coded with the information provided in Excel. The code can just be the question number or a longer
label.
As you can see in the example, the first code name is just the question number SQ1. The full question can be seen
in the comment. the second code name contains the full question. It is recommended to only use a short label for
the code, as it also occurs in the body of the text. When creating word clouds and word lists, these words are also
counted and mess up the results. See Preparing Survey Data for Import for further information.
INSPECTING IMPORTED SURVEY DATA 116
9.0.0.214 (15.12.2021) ATLAS.ti 9 Windows - User Manual
131.
Analyzing Survey Data
Analyzingsurvey data requires that you know how to code. See Working With Codes.
You may want to explore the data first by creating Word Clouds or Word Lists, see Exploring Data and by
using the auto coding feature. See Search & Code.
After coding, further analysis options that are often used with survey data are:
the Code-Document Table
the Query Tool in combination with the Scope option
the Code Co-occurence Table
•
•
•
◦
◦
◦
ANALYZING SURVEY DATA 117
9.0.0.214 (15.12.2021) ATLAS.ti 9 Windows - User Manual
132.
Working With ReferenceManager Data
ATLAS.ti is frequently used for assisting with literature reviews. See for example:
On Conducting a Literature Review with ATLAS.ti
Using ATALS.ti 8 Windows in Literature Reviews
Managing Literature Reviews Using ATLAS.ti
You may have collected lots of articles in a reference manager. Not all of these articles will be relevant for the
literature review for a particular research or paper you are writing. Thus, create a collection of 50 to 200 articles in
your reference manager for further coding and analysis in ATLAS.ti.
In order to user the ATLAS.ti import option for reference manager data, the prerequisite is that you are either
using Endnote, or a reference manager that allows you to create an export for Endnote in XML format. This is for
instance the case in the following programs:
Reference Manager
Mendeley
Zotero
If your reference manager does not have an export for Endnote, a work around is to export data in either RIS or BIB
format, import them into the free version of Mendeley or Zotero and create an export for ATLAS.ti from there.
This is how you export data from Mendeley
Highlight the documents that you want to export, right-click and select Export.
When saving the file, select the file format: EndNote XML as file type.
This will save a folder on your computer that contains all of the articles, and the xml file with the meta
information. Both must be stored in one folder when importing the data to ATLAS.ti,
This is how you export data from Zotero
In Zotero, you find the export option under the File menu: Export library.
Zotero offers about ten different formats to export to. Select the Endnote XML option.
You can export notes and the full content of the documents. Select both options. The notes will be imported as
document comments in ATLAS.ti.
This will save a folder on your computer that contains articles in a sub folder and the xml file with the meta
information. Both must be stored in one folder when importing the data to ATLAS.ti,
•
•
•
•
•
•
WORKING WITH REFERENCE MANAGER DATA 118
9.0.0.214 (15.12.2021) ATLAS.ti 9 Windows - User Manual
133.
Importing Reference ManagerData
To start importing the file into ATLAS.ti, select the Import & Export tab and the button
Reference Manager.
Click on the file loader icon and select the XML file that you have exported from your
reference manager.
The xml file contains the reference to the PDF file of your articles. If you use Endnotes make sure the PDF
files are stored at the location indicated in the XML file.
ATLAS.ti can create document groups for you based on the following meta data:
First authors
Co-authors
type of document (journal article, book, book chapter, etc.)
Language
Source - If you import documents from more than one reference manager, it is useful to group documents
by source, so that you know where they were coming from.
Periodical
Year
Volume
Issue
Edition
•
•
•
•
•
•
•
•
•
•
WORKING WITH REFERENCE MANAGER DATA 119
9.0.0.214 (15.12.2021) ATLAS.ti 9 Windows - User Manual
134.
Publisher
Document name format
Thedefault name for the document in ATLAS.ti is the name of the document as it used in the Reference Manager.
For easier sorting and organization, you can choose to add the name of the first author, and the publishing year to
the document name (recommended).
If the full document is not available
If only the document abstract is available and not the full document, you can select to import the abstract as a
document.
If you have written a note about the document in your Reference Manager, this note will be imported as document
comment.
Make your selections and click the Import button.
Inspecting the Imported
Open the Document Manager (Home tab > Documents button).
The imported documents are sorted by author and year in alphabetical order, if you selected this option. Further,
document groups are created from all options that were selected.
The text entered as note in the reference manager is imported as document comment. If the URL of a document
is available, it will also be added into the comment field.
•
WORKING WITH REFERENCE MANAGER DATA 120
9.0.0.214 (15.12.2021) ATLAS.ti 9 Windows - User Manual
135.
Importing Twitter Data
Youneed a Twitter account to use this function.
To import Twitter data, select the Import & Export tab and then the Twitter button.
If you do this for the first time, you have to authorize ATLAS.ti to access your account by
entering your username and password.
Note that you only will be able to import tweets from the past week. Further, as the final selection is done
by Twitter and not within our control, queries at different times, or on different computers may result in
different tweets. There is also a rate limit set by Twitter. This means you can make 180 requests within a
time period of 15 minutes.
Enter a query. You can also look for multiple hashtags or authors by using OR. For example:
#WorldAidsDay|#HIV|#Aids.
Next, select whether you want to import the most recent or the most popular tweets and
whether to include re-tweets, images and profile images.
After you have made your select, click Import Tweets.
IMPORTING TWITTER DATA 121
9.0.0.214 (15.12.2021) ATLAS.ti 9 Windows - User Manual
136.
Automatic Coding andLinking for Tweets
The imported data is automatically coded based on the selection you make:
Tweets often contain many more hashtags than the original one that you searched for. Coding all hashtags often
results in great many codes.
You can choose to code:
only the queried hashtags.
the author
all mentioned Twitter users
the location
the language.
•
•
•
•
•
IMPORTING TWITTER DATA 122
9.0.0.214 (15.12.2021) ATLAS.ti 9 Windows - User Manual
137.
An automatic linkcan be created between:
authors and locations
authors and mentioned Twitter users.
These linkages can be visualized using ATLAS.ti networks.
Inspecting Imported Twitter Data
Load the document with imported tweets.
On the top of the document, you can read how many tweets and retweets were imported and how many you
requested. Each tweet is coded with the selection you have made.
Open the Code Manager to inspect the code and code groups that have been created.
The code groups help you to navigate through your codes. By clicking on the code group Twitter: Languages, for
instance, you can immediately see how many and which languages are used in the tweets you imported.
•
•
IMPORTING TWITTER DATA 123
9.0.0.214 (15.12.2021) ATLAS.ti 9 Windows - User Manual
138.
Managing Documents
Whenever thecontent of a document needs to be displayed, printed, or searched, it accesses its data source and
loads the content. This request is often triggered indirectly, e.g., by displaying a quotation. The following lists a
few procedures that directly or indirectly load the content of a document:
Activating a document in the Project Explorer or the Document Manager.
Activating a quotation in a Navigator, the Quotation Manager or the Quotatoin Reader.
Selecting a quotation for an activated code or memo.
Activating a hyperlink in the margin area.
Loading Documents
Select a document in the Project Explorer and double-click. It will be loaded in the next
available tab.
Alternatively:
Double-click a document in the Document Manager. (To open the Document Manager
double-click on the main document branch in the Project Explorer.)
Editing Documents
To edit a document, click on the Edit button in the toolbar. The ribbon changes, and you see
all editing option that are available.
inst
To leave edit mode, click on the button Exit Edit Mode.
•
•
•
•
MANAGING DOCUMENTS 124
9.0.0.214 (15.12.2021) ATLAS.ti 9 Windows - User Manual
139.
We recommend notdo stay in edit mode while coding. You may accidentally modify text while highlighting
text segments for coding.
When working in a team, we strongly recommend not to edit text. If team members edit the same
document, you will lose one version when merging the project. If text needs to be modified, it should only
be edited in the Master Project by the project administrator.
Renaming Documents
Right-click a document in the Project Explorer or Document Manager and select the
Rename option from the context menu.
Alternatively:
Select a document and press the F2 key.
Renaming a document in ATLAS.ti does not change the name of the original source file. As
described above under Adding Documents documents are copied into the ATLAS.ti library
when adding them to an ATLAS.ti project, and ATLAS.ti no longer needs the original source
files.
MANAGING DOCUMENTS 125
9.0.0.214 (15.12.2021) ATLAS.ti 9 Windows - User Manual
140.
Deleting Documents
If youaccidentally have added documents or want to remove them from your project for other reasons, you can
remove them.
Select one or multiple documents in the Project Explorer or the Document Manager, right
click and select Delete.
If you delete a document by mistake, you can always use the Undo option in the Quick Access toolbar.
After deleting documents, the consecutive numbering may be off. To renumber documents in consecutive order
again, select the Tools tab in the Document Manager, and from there the Renumber Documents option.
Duplicating Documents
If you need a document for different purposes, e.g. you want to view it from different angles and want to code
different aspects; or if you want to associate it with different transcripts, you can duplicate a document. All work
that you have done so far in the document, like the document comment you have written, all quotations and their
comments, all hyperlinks, all linked codes and memos will be duplicated as well,
Open the Document Manager and select one or more documents that you want to
duplicate.
Click on the Tools tab and select Duplicate Document(s)
The duplicated document(s) will be added at the end of the list of documents. They have the same name as the
original document(s) plus a consecutive number in parentheses.
In terms of project size, the file(s) in the library are not duplicated. The duplicated document uses the same source
file as the original document.
Renumbering all Documents
This option becomes useful after you removed one or more documents from a project. This results in gaps in the
sequence of document numbers. You may remove these gaps by renumbering all documents using the Renumber
Documents option.
Open the Document Manager.
inst
Select the Tools tab and from there: Renumber Documents.
MANAGING DOCUMENTS 126
9.0.0.214 (15.12.2021) ATLAS.ti 9 Windows - User Manual
141.
User-defined Document S
Ifthe documents are not listed in the order you want them to be listed as by default, you can impose your own
sort order. This is how you do it:
Rename the documents in a way that when sorted in alphabetic order by name, they show
up in the order you want them to be.
Click on the Name column in the Document Manager to resort the documents.
Check whether the documents are now in the correct order.
Select the Renumber Documents option from the Tools tab.
It is not necessary to renumber documents for working with ATLAS.t! However, it might be useful for your
own work organization, and it can give reports a cleaner appearance.
MANAGING DOCUMENTS 127
9.0.0.214 (15.12.2021) ATLAS.ti 9 Windows - User Manual
142.
Project Management
Opening aProject
To open a project, click on a project in the list of projects on the Welcome Screen, or if a project is already open,
and you want to open another one, select File > Open.
Saving a Project
To save a project, click on the Save icon in the Quick Access toolbar, or select File > Save.
PROJECT MANAGEMENT 128
9.0.0.214 (15.12.2021) ATLAS.ti 9 Windows - User Manual
143.
The project issaved as internal ATLAS.ti file in the ATLAS.ti
library. The default location for the library is the application folder on your computer. See Where Does ATLAS.ti
Store Project Data?
It is possible to either change the default location for the ATLAS.ti library or to create new libraries. See About
ATLAS.ti Libraries.
If you want to save an external copy of your project, you need to export it. See Project Export.
Pin to Favorites
We recommend that you pin all projects that you are currently working on to the Favorites list:
Right-click on a project in the opening screen and select Pin to Favorites.
Hide or Show Projects
If you accumulate many projects over time, you can hide all projects that you do not currently need.
Right-click on a project in the opening screen and select Hide Project.
PROJECT MANAGEMENT 129
9.0.0.214 (15.12.2021) ATLAS.ti 9 Windows - User Manual
144.
All hidden projectsdisplay an icon on the top left of the project button.
If you want to see all projects again, activate the option Show Archived. You find the check-box for this option
above your list of projects.
Below you see two favorite projects and two hidden projects. Favorite projects are always displayed at the top of
the list:
PROJECT MANAGEMENT 130
9.0.0.214 (15.12.2021) ATLAS.ti 9 Windows - User Manual
145.
Renaming a Project
Youcan rename projects from the opening screen, either when you start ATLAS.ti or when closing all projects.
To rename a project:
Select a project on the opening screen. Right-click on a project and select the option
Rename Project.
Deleting a Project
You can delete projects from the opening screen, either when you start ATLAS.ti or when
closing all
To delete a project:
Select a project on the opening screen.
inst
Right-click on a project and select the option Delete Project.
You will be asked to confirm the deletion as this is a permanent action that cannot be
undone.
Password Protection
To set a password for your project, you need to load it first.
Select File > Info (this is the first option on top). Click on the Set Password button and follow the instructions on
the screen.
PROJECT MANAGEMENT 131
9.0.0.214 (15.12.2021) ATLAS.ti 9 Windows - User Manual
146.
ATLAS.ti Scientific SoftwareGmbH does not save your passwords. We cannot access, read or recover your
password. If you cannot remember your password, you can no longer access your project!
PROJECT MANAGEMENT 132
9.0.0.214 (15.12.2021) ATLAS.ti 9 Windows - User Manual
147.
ATLAS.ti Project Datais Saved to a Library
Working with the ATLAS.ti Library
The default location for ATLAS.ti project files is on the C drive. As it is not possible for all users to work on the C
drive, either because there are institutional restrictions, tor the C drive is already full and there is not sufficient
space, there is the possibility to create a user-defined location where all of your ATLAS.ti data is stored. Important
to know
Each user works within her or his own ATLAS.ti library.
Each user can define where the ATLAS.ti library should be located. This location can be on the C: drive or on
any other drive on your computer, on a server, or an external drive.
It is not possible to use a cloud sharing service like Dropbox because the specific way in which such systems
work can jeopardize the integrity of the ATLAS.ti library.
It is possible to work with multiple libraries. Theoretically, you could create a new empty library every time
you start a new project. This, however, requires careful data management on your part as you need to keep
track where all of these different libraries are located.
Changing the Library Location
When you start ATLAS.ti, select Options at the bottom left of your screen. If a project is
already open, you need to close it. You cannot change the location of the library, if a project
is currently open.
inst
Select Application Preferences > ATLAS.ti Library location > Switch Library.
•
•
•
•
ATLAS.TI PROJECT DATA IS SAVED TO A LIBRARY 133
9.0.0.214 (15.12.2021) ATLAS.ti 9 Windows - User Manual
148.
A wizard opensthat guides you through the process. The next choice you need to make is whether you want to
open an existing library, move the library to a different location, or create a new empty library.
Moving the
Library to a Different Location: Chose this option if you want or need to move your current library to a different
location, e.g. because you do no longer want to work on the C drive. It is possible to keep a copy of the library at
the old location. Creating a New Library: This option allows you to create a new library at a location of your choice.
If you already have projects, none of these will be moved over into the new library. To fill this library, you either
create new projects from scratch, or you import project bundle files that you previously exported from other
libraries.
Open an existing library: Chose this option if you work with multiple libraries, and you want to gain access to an
already existing library at a different location.
After you made your choice, click Next. * If you selected to open an existing library: Select
the location for this library
If you selected to move the library: Select the location where you want this library to be. You can keep a
copy of the actual state of the library at the current location. Just keep in mind that this copy is not
updated if you continue your work using the library at the new location.
•
ATLAS.TI PROJECT DATA IS SAVED TO A LIBRARY 134
9.0.0.214 (15.12.2021) ATLAS.ti 9 Windows - User Manual
149.
If you selectedto create a new empty library: Select where this new library shall be created. After
confirming the new location, your opening screen will be empty, and you can begin to fill it with new
projects.
A note from the Help Desk: We know that your project data is very valuable to you and that you do not
want to lose it. Therefore, please select a sensible location for the ATLAS.ti library. For instance: Do not
store it on the desktop. You probably have a folder where you store all project related data. If you cannot or
do not want to use the ATLAS.ti default location, we recommend that you create a sub-folder for your
ATLAS.ti related work within your project folder, and within this sub-folder, a dedicated folder for your
library. Make sure your project folder is included in any automated back-up routine of your computer!
•
ATLAS.TI PROJECT DATA IS SAVED TO A LIBRARY 135
9.0.0.214 (15.12.2021) ATLAS.ti 9 Windows - User Manual
150.
Creating a ProjectBackup
ATLAS.ti 9 projects cannot be used in previous versions.
Please export your projects on a regular basis and store the bundle files in a safe location. In case
something happens to your computer, you still have a copy of your project to fall back on!
To create a backup of your project, you need to export it and save it as project bundle file on your computer, an
external drive, a server or cloud location.
A project bundle file serves as external backup of your project independent of the ATLAS.ti installation on
your computer.
The project bundle file contains all documents that you have added or linked to a project, and the project
file that contains all of your coding, the codes, all memos,comments, networks and links. Large audio or
video files can be excluded from the bundle.
Project bundle files are also used to transfer projects between computers. They can be read by both
ATLAS.ti Mac and Windows. See Project Transfer.
If your project contains linked documents, they can be excluded when creating a project bundle file. See
"Creating Partial Bundles" below.
Exporting a Project
To export your project to either save it as backup or to use it for transferring it to a different computer:
Select File > Export.
inst
Click on the Project Bundle button.
•
•
•
CREATING A PROJECT BACKUP 136
9.0.0.214 (15.12.2021) ATLAS.ti 9 Windows - User Manual
151.
If your projectdoes not contain multimedia files, the Windows File Manager opens.
Select a location for storing the project bundle file.
The default name for the bundle will be the project name plus the name of the currently logged in user and the
date: project name (user name YYYY-MM-DD).
You can rename the project bundle file at this stage, which however does not change the name of the project that
is contained within the bundle.
Think of the project bundle file like a box that contains your project. Putting a different label on the outside
of the box does not change anything that is inside, which is your project with all your coded segments,
comments, memos, networks, etc. and all documents that have been added to it. When you import the
project bundle, the project name after import will still be the original name. If you want to rename the
project file, you need to do this either during the process of importing the project, or on the opening
screen. See Project Management.
CREATING A PROJECT BACKUP 137
9.0.0.214 (15.12.2021) ATLAS.ti 9 Windows - User Manual
152.
Exporting a PartialBundle
If your project contains large multimedia files, you can exclude those. This reduces the size of the bundle file.
When preparing a partial project bundle, make sure you also backup the multimedia files that you excluded from
the bundle. If you import the project at a later stage, you can relink excluded files to the project during or after
import.
CREATING A PROJECT BACKUP 138
9.0.0.214 (15.12.2021) ATLAS.ti 9 Windows - User Manual
153.
Project Transfer
ATLAS.ti desktopproject can currently not be imported into ATLAS.ti Web. It is however possible to import
ATLAS.ti Web projects into the desktop version.
ATLAS.ti 9 projects cannot be used in previous versions.
In order to transfer a project to a different computer, e.g., to share it with team members, you need to create a
project bundle file.
A project bundle file contains all documents that you have added or linked to a project. In addition, it
contains the project file with all codings, codes, memos, comments, networks, and links.
To create a project bundle file:
Select File > Export.
inst
Click on the Project Bundle button.
If your project does not contain multimedia files, the Windows File Manager opens.
Select a location for storing the project bundle file.
The default name for the bundle will be the project name plus the name of the currently logged-in user, and the
date: project name (username YYYY-MM-DD.)
PROJECT TRANSFER 139
9.0.0.214 (15.12.2021) ATLAS.ti 9 Windows - User Manual
154.
You can renamethe project bundle file at this stage. This, however, does not change the name of the project that
is contained within the bundle!
Think of the project bundle file like a box that contains your project. Putting a different label on the outside
of the box does not change anything that is inside. Inside this box are the documents that have been
added to the project, plus the project with codings, codes, comments, memos, networks, etc. When you
import the project bundle, the project name after import will still be the original name. If you want to
rename the project file, you need to do this either during the process of importing the project, or on the
opening screen. See Project Management.
Exporting a Partial Bundle
If your project contains large multimedia files, you can exclude those. This reduces the size of the bundle
file.
If you prepare partial bundle files for project transfer, you can send the multimedia files separately and
relink them during or after import. If you attempt to load an excluded file and ATLAS.ti cannot find it in the
library, it will prompt you to relink the file.
If the excluded multimedia files are not needed at the location where you transfer the project to, the
project can still be imported and used. The excluded multimedia files are listed in the project but cannot be
opened.
If you transfer a partial bundle multiple times, and the multimedia files are available either in the ATLAS.ti
library or the target location or on the hard disk, they can be loaded.
•
•
•
•
PROJECT TRANSFER 140
9.0.0.214 (15.12.2021) ATLAS.ti 9 Windows - User Manual
155.
ATLAS.ti 9 projectscannot be used in previous versions.
PROJECT TRANSFER 141
9.0.0.214 (15.12.2021) ATLAS.ti 9 Windows - User Manual
156.
Creating a ProjectSnapshot
A project snapshot is a copy of the internal ATLAS.ti project file. Reasons for creating a snapshot are:
to preserve certain stages of your project to review it later.
as fall-back version before a merge, in case something turns out different from what you expected, and you
have already saved the merged project. See Project Merge.
as a copy of your project that you want to use as template for another project.
as a copy of your project to prepare for inter-coder agreement analysis. See Inter-coder Agreement.
When creating a snapshot, ATLAS.ti automatically adds the following to the project name: (Snapshot YYYY-MM-
DD hh:min:sec). You can, however, also enter any other name.
To create a snapshot,
Select File > Snapshot.
Accept the default name or enter another unique name, and click Create Snapshot.
Just like ATLAS.ti project files, snapshots are saved internally in the ATLAS.ti environment. A snapshot has the
same ID as the project from which it is created.
•
•
•
•
CREATING A PROJECT SNAPSHOT 142
9.0.0.214 (15.12.2021) ATLAS.ti 9 Windows - User Manual
157.
Where Does ATLAS.tiStore Project Data?
By default, ATLAS.ti projects and all documents that you add to a project are stored in a sub folder called Scientific
Software in the application folder on your computer.
The application folder in Windows is called: AppData and can be found under your user account's home folder.
Within the sub folder Roaming, you find folders from a number of different applications, also for ATLAS.ti.
The AppDataRoaming folder is a hidden folder and can either be accessed by entering the full path name or by
typing %appdata% into the Windows 10 search field. If the user name is "Mary." the full path would be:
C:UsersMaryAppDataRoamingScientific SoftwareATLASti.9
The ATLAS.ti library is a system folder and not meant for user access. Files in this folder cannot be used
outside ATLAS.ti!
If you need to change the default location for the library, see Working with the ATLAS.ti Library.
Default Locations for Files and Text Analysis Models
You can check which default location are used by your installation of ATLAS.ti as follows:
When you start ATLAS.ti, select Options at the bottom left of your screen. If a project is
already open, you need to close it. You cannot change the location of the library, if a project
is currently open.
Select Application Preferences and look for the section ATLAS.ti Default File Location.
WHERE DOES ATLAS.TI STORE PROJECT DATA? 143
9.0.0.214 (15.12.2021) ATLAS.ti 9 Windows - User Manual
158.
Working With Groups
Groupsin ATLAS.ti help you to sort, organize and filter the various entities. Groups are available for documents,
codes, memos, and networks.
Common to all groups are:
An entity can be sorted into multiple groups. For example if you sort a document into the group
gender::female, it can also be sorted into other groups like location::urban, or family status::single.
If you click on a group in a manager, you activate a filter (see below). Then only the items that are in the
selected groups are displayed.
You can combine groups using Boolean operators. See for example Exploring Coded Data.
You can save a combination of groups for further re-use in form of a smart group.
You can set groups as global filter.
There are no groups for quotations, as codes already fulfil this function. Codes group quotations that have
a similar meaning. Therefore instead of groups, you see the codes in the side panel of the Quotation
Manager.
Application of Docume
Often data come from different sources, locations, respondents with various demographic backgrounds etc. To
facilitate the handling of the different types of data, or to compare respondents based on socio-demografic
characteristics, they can be organized into document groups. You can also use document groups for administrative
purposes in team projects if different coders should code different documents. You can then create a group
containing all documents for coder 1, another group containing the documents for coder 2 and so on.
•
•
•
•
•
WORKING WITH GROUPS 144
9.0.0.214 (15.12.2021) ATLAS.ti 9 Windows - User Manual
159.
Another application isthe use of document groups for
analytic comparisons in the Code Document Table.
Document Groups are also useful as global filters for instance for Code Co-occurrence Analysis.
WORKING WITH GROUPS 145
9.0.0.214 (15.12.2021) ATLAS.ti 9 Windows - User Manual
160.
Document groups canalso be added to Networks and you can show which codes have been applied to which
group.
WORKING WITH GROUPS 146
9.0.0.214 (15.12.2021) ATLAS.ti 9 Windows - User Manual
161.
Application of CodeGroups
Code groups can be used to sort and organize codes in the Code Manager. Code groups facilitate the navigation of
codes in the Code Manager as local filter.
Code groups can be used as global filters in analysis.
WORKING WITH GROUPS 147
9.0.0.214 (15.12.2021) ATLAS.ti 9 Windows - User Manual
162.
Code groups canalso be used in the Code Document Table for case comparisons.
Users often mistake code groups as a kind of higher order code, which they are not. They do however can
be quite useful in building a coding system.
Application of Memo Groups
Memo groups come in handy if you have written lots of memos. You could for example group memos by function:
methodological notes, team memos, research diaries, analysis.
WORKING WITH GROUPS 148
9.0.0.214 (15.12.2021) ATLAS.ti 9 Windows - User Manual
163.
If you havemultiple memos that contain answers to one research question, you can group all those memos.
If you have multiple memos that contain input for a particular section in the research report, you may want to
create a memo group for those.
You find more information on working with memos here: Memos and Comments.
Groups as Filters
Groups are listed in the filter area of the document, code, memo and network manager.
Click on one or more groups to filter the list of items. If you want to select multiple groups
hold down the Ctrl key.
Once you have set one or more groups as filter, a yellow bar appears above the entity list
indicated that a) a filter has been set and b) which one.
To reset the filter to see all entities again, click the X on the top right-hand side of the
yellow bar.
It is also possible to run simple AND and OR queries:
As soon as you select more than one group, you see the word any in blue in the filter bar. This means the default
operation is to combine the items of the selected groups with OR.
If you want to filter by the intersection of two or more groups, click on the word "any" and
change it to all. This is the Boolean AND operator.
WORKING WITH GROUPS 149
9.0.0.214 (15.12.2021) ATLAS.ti 9 Windows - User Manual
164.
An example wouldbe to filter by all female respondents who live in an urban region. This requires that you have
grouped the documents by these two criteria:
education::some college
Gender::female The same options are available for all entity types.
•
•
WORKING WITH GROUPS 150
9.0.0.214 (15.12.2021) ATLAS.ti 9 Windows - User Manual
165.
Creating and RenamingGroups
You can create groups in various ways and at various places in the software.
Creating Groups in a Manager
Open the Document Manager, e.g. with a click on the Documents button in the Home tab.
Select several documents and drag-and-drop them into the side panel on the left. Use the
common Windows selection technique (hold down the Ctrl- or Shift key).
Enter a name for the group and click Create.
CREATING AND RENAMING GROUPS 151
9.0.0.214 (15.12.2021) ATLAS.ti 9 Windows - User Manual
166.
Another way tocreate groups in a manager is:
To select a number of entities in a manager, right-click and select the option New Group
from the context menu.
Enter a name for the group and click Create.
Creating Groups in the Project Explorer
Select a number of entities in a branch of the Project Explorer, right-click and select the
option New Group from the context menu.
CREATING AND RENAMING GROUPS 152
9.0.0.214 (15.12.2021) ATLAS.ti 9 Windows - User Manual
167.
Creating Groups ina Group Manager
Open the Group Manager by double-clicking on a group in the Project Explorer.
Alternatively:
In the Home tab, click on the drop-down for documents, codes, memos or networks and
select the respective Group Manager.
In the Group Manager:
Select the button New Group and enter a name.
CREATING AND RENAMING GROUPS 153
9.0.0.214 (15.12.2021) ATLAS.ti 9 Windows - User Manual
168.
Next select onore more items on the right-hand side in the pane: 'Documents / Codes /
Memos / Networks not in group' and move them to the left-hand side 'Documents / Codes
/ Memos / Networks in group' by clicking on the button with the left arrow (<). You can
also double-click each item you want to move.
CREATING AND RENAMING GROUPS 154
9.0.0.214 (15.12.2021) ATLAS.ti 9 Windows - User Manual
169.
Creating Document Groupsin the Query Tool
At times, you first need to code the data to find relevant information like years of working experience, special
skills, attitudes about something, relationship to other people, etc. For this you need an option to create
document groups based on query results.
You can create groups based on queries - thus based on information that you have coded. See Creating Document
Groups From Results.
Renaming a Group
Select a group in the Group Manager and click on the Rename option in the ribbon.
Right-click on a group and select the Rename option from the context menu.
Select a group and press F2. This opens the 'Rename dialogue'.
CREATING AND RENAMING GROUPS 155
9.0.0.214 (15.12.2021) ATLAS.ti 9 Windows - User Manual
170.
Removing Group Members/ Deleting Groups
Removing Group Members
You can remove group members at four different locations:
Project Explorer
Open the branch for a group, select one or more items that you do not want to have in the
group, right click and select Remove from Group from the context menu.
In Managers
Open a Manager and select a group.
Select one or more items in the list that you do no longer want to have in the group, right
click any of the selected items and select Remove from Group from the context menu.
Filter Area in Managers
Open a Manager and select a group.
REMOVING GROUP MEMBERS / DELETING GROUPS 156
9.0.0.214 (15.12.2021) ATLAS.ti 9 Windows - User Manual
171.
Select one ormore items in the list that you do no longer want to have in the group, right
click on the group and select Remove from Group in the context menu.
Removing Group Members in the Group Manager
Open the Group Manager by double-clicking on a group in the Project Explorer.
Alternatively:
In the Home tab, click on the drop-down for documents, codes, memos or networks and
select the respective Group Manager.
inst
Next select on ore more items on the left-hand side in the pane: 'Documents / Codes /
Memos / Networks in group' and move them to the right-hand side 'Documents / Codes /
Memos / Networks not in group' by clicking on the button with the right arrow (>). You can
also double-click each item you want to remove.
Deleting Groups
Select one or more groups in the Project Explorer or the side panel of a manager.
inst
Right-lick and select Delete from the context menu.
It is also possible to delete a group in a Group Manager. In Group Managers you can only delete one group at a
time.
REMOVING GROUP MEMBERS / DELETING GROUPS 157
9.0.0.214 (15.12.2021) ATLAS.ti 9 Windows - User Manual
172.
Importing & ExportingDocument Groups
You can export and import the list of documents and their groups to and from Excel.
Exporting the data gives you an overview of all your document groups and their members. It can also be used as a
starting point to prepare an Excel file for import.
You may want to import a Document Group table, if you already have an Excel file with information about each
document like gender, education levels, location, etc.
The content of the Document Group Table consists of the following:
First column: document name.
Second and subsequent columns: document groups or document attributes
As document groups in ATLAS.ti are dichotomous, the document groups are listed in the columns, and the cells
contain a 0 if the document is not in the group, and a 1 if the document is in the group.
If you do not follow the ATLAS.ti naming conventions (see below), the table will look as follows:
If you use the ATLAS.ti naming convention for document groups: attribute name::attribute label or value, then
ATLAS.ti uses the attribute name as column header and the attribute label or value for each cell. For instance, if
you have the following groups:
education::highschool
education::some college
education::University degree
gender::male
gender::female
has childre::yes
has childre::no
marital status: single
marital status: married
marital status: divorced
number of children:1
number of children:2
....the Excel table looks as follows:
•
•
•
•
•
•
•
•
•
•
•
•
•
•
IMPORTING & EXPORTING DOCUMENT GROUPS 158
9.0.0.214 (15.12.2021) ATLAS.ti 9 Windows - User Manual
173.
Exporting Document Groupsto Excel
Select the Import & Export tab in the ribbon and from there the Document Groups button
with the up arrow.
This opens a File Manager. Select a location for saving the Excel file. Accept the default
name or change it. Select Save.
tip
If you use the naming convention for document groups as shown above, then the table
shows the more conventional format with attributes / variables as column header and the
various values for each variable in the table cells.
Importing Document Groups from Excel
If you want to prepare a table for import, the easiest way is to export a table first. This way you generate a table
that already contains all document names in the order as they occur in ATLAS.ti
Export a document group table (see above).
IMPORTING & EXPORTING DOCUMENT GROUPS 159
9.0.0.214 (15.12.2021) ATLAS.ti 9 Windows - User Manual
174.
Add the documentattributes as column headers. See examples below. * If there are
multiple values for a variable, add the prefix #. * If you do not add a prefix, a document is
assigned to the group if the cell value is 1.
Enter the values for each document in the table cells.
if there is no entry in a cell, the document is not assigned to a group.
if two or more values of the same attribute apply to the document, then enter the values separated by a
coma.
In the following you see two examples:
Document Name #gender #age group likes chocolate #favourite drink
doc 1 male 1 1 cola
doc 2 female 2 milk,beer
doc 3 female 2 1 juice
doc 4 male 1 tea, coffee, cola
doc 5 male 3 1 coffee
Save the table in Excel.
Example Excel table ready for import to ATLAS.ti:
Import Document Groups Table
Select the Import & Export tab in the ribbon and from there the Document Groups button
with the down arrow.
•
•
IMPORTING & EXPORTING DOCUMENT GROUPS 160
9.0.0.214 (15.12.2021) ATLAS.ti 9 Windows - User Manual
175.
This opens aFile Manager. Select the Excel file and click Open.
tip
If you want to add new groups even though a few groups already exist, you can proceed as
described. Just leave existing groups in the table. ATLAS.ti will recognize them and does
not create them anew.
IMPORTING & EXPORTING DOCUMENT GROUPS 161
9.0.0.214 (15.12.2021) ATLAS.ti 9 Windows - User Manual
176.
The ATLAS.ti QuotationLevel
Christine Silver, expert in computer assisted qualitative data analysis software, explains the ATLAS.ti quotation
level as follows:
"When you create a quotation, you’re marking a segment of data that can later be retrieved and reviewed.
You might know, right at that point how and why it’s interesting or meaningful, in which case you can
immediately capture that – by re-naming it, commenting on it, coding it, linking it to e.g. another
quotation, or a memo. If you don’t yet know, you can just create the quotation, and come back and think
about it later, perhaps when you have a better overview of the data set in its entirety and are ready to
conceptualise meaning in relation to your research objectives."
"One of my favourite things about ATLAS.ti is that quotations can be visualised and worked with in a
graphical window, i.e., the ATLAS.ti networks. The content of quotations can be seen within the network,
and quotations can be linked, commented upon, and coded in that visual space. This is very useful if you
like to work visually or are used to analysing qualitative data manually with highlighters, white-boards,
post-it notes etc. Networks can also be used as visual interrogation spaces – for example to review
quotations which have more than one code attached, which is very powerful. Everything you do in the
network is connected throughout the ATLAS.ti project."
The ATLAS.ti quotation level gives you an extra layer of analysis. In ATLAS.ti you are not required to immediately
code your data as in most other CAQDAS software. You can first go through your data and set quotations,
summarize the quotations in the quotation name and write an interpretation in the comment field. See Working
with Quotations. This is useful for many interpretive analysis approach for the process of developing concepts.
Once you have ideas for concepts you can begin to code your idea.
This prevents you from falling into the coding trap, i.e. generating too many codes. Codes that can be applied to
only one or two segments in your data are not very useful. Code names should be sufficiently abstract so that you
can apply them to more than just a few quotations.
You will also see later in the analysis process that you find that none of the further analysis tools like the Code
Document Table or the Code Co-occurrence Talbe seem to be very useful.
If you find yourself generating 1000 or more codes, take a look what you can do with quotations instead. Based on
that develop codes on a more abstract level allowing you to build a well rounded code system.
THE ATLAS.TI QUOTATION LEVEL 162
9.0.0.214 (15.12.2021) ATLAS.ti 9 Windows - User Manual
177.
Creating Quotations inText Documents
When you code data, quotations are created automatically. See Coding Data.You can however also create
quotations without coding. To do so:
Highlight a section in your text, right click and select the option Create Free Quotation.
Alternatively, you can also select the equivalent button in the ribbon.
Once a quotation is created, you see a blue bar in the margin area and an entry in the Quotation Manager and the
Document tree in the Project Explorer.
CREATING QUOTATIONS IN TEXT DOCUMENTS 163
9.0.0.214 (15.12.2021) ATLAS.ti 9 Windows - User Manual
178.
Quotation ID
Each quotationhas an ID, which consists of two numbers:
The ID 8:1 means that the quotation was created in document 8, and it is the first quotation that was
created in this document.
The ID 3:10 means that the quotation comes from document 3, and it is the 10th quotation that was
created in this document.
Quotations are numbered in chronological and not in sequential order. If you want to change this order, see the
next section:
Changing the Chronological Order of Quotations
The quotation ID numbers quotations in the chronological order when they have been created. For various reasons,
at times users want the quotations to be numbered in the sequential order as they occur in the document.
When you delete quotations, the numbering is not automatically adjusted. Instead, they are gaps. Renumbering
the quotations also closes those gaps.
To renumber quotations:
Open the Quotation Manager and select the Renumber Quotations option in the ribbon.
Adding Quotation Names
Being able to name each quotation has a number of useful applications.
It allows you to quickly glance through your quotations in list view.
You can use the name field to paraphrase a quotation as required by some content analysis approaches, or
to write a short summary.
You can use the name field for fine-grained coding (line-by-line Grounded Theory coding; initial coding in
Constructive Grounded Theory, or as required by other interpretative approaches) instead of applying codes.
If you already apply codes during this phase, you will end up with too many codes that are useless for
further analysis. See Building a Code System.
Adding titles to multimedia quotations. See Working with Multimedia Data.
•
•
•
•
•
•
CREATING QUOTATIONS IN TEXT DOCUMENTS 164
9.0.0.214 (15.12.2021) ATLAS.ti 9 Windows - User Manual
179.
To add aname to a quotation, right-click on a quotation in the margin area, the Project
Explorer, the Quotation Manager or in the Quotation Reader and select Rename.
If you select a quotation in the Quotation Manager, you see a preview of the quotation in the panel below
the quotation list. This applies to all data file formats.
CREATING QUOTATIONS IN TEXT DOCUMENTS 165
9.0.0.214 (15.12.2021) ATLAS.ti 9 Windows - User Manual
180.
Resize a Quotation
Modifyingthe length of a quotation is easy.
If you select a quotation, e.g. by clicking on the bar in the margin area, you see a white
circle at the beginning and at the end of the quotation. Move the start or end position to a
different location depending on whether you want to shorten or lengthen the quotation.
This applies to all media types.
CREATING QUOTATIONS IN TEXT DOCUMENTS 166
9.0.0.214 (15.12.2021) ATLAS.ti 9 Windows - User Manual
181.
Creating Quotations inPDF Documents
A text PDF file can contain images as well, like picture, graphs or tables. In ATLAS.ti you can create quotations for
text and images in PDF documents.
Text selection: Select the text just like you do in a Word file. Make sure you place the cursor right next to a letter.
Selecting a graphical element: Like selecting an area in a graphic file, draw a rectangular area with your mouse.
See also Creating Graphic Quotations.
CREATING QUOTATIONS IN TEXT DOCUMENTS 167
9.0.0.214 (15.12.2021) ATLAS.ti 9 Windows - User Manual
182.
Select a segmentin the PDF document, right click and select the option Create Free
Quotation. Alternatively, you can also select the equivalent button in the ribbon.
PDF files can be text or image files. Sometimes users accidentally add an image PDF and wonder why they
can only create graphic quotations and cannot select text. If this happens, you need to re-create the PDF
file, e.g. by letting an OCR scanner running over your PDF image file. In a lot of PDF creators these days
this is an option in the software, no additional physical scan is needed.
How to create quotations in audio and video documents, see Creating Multimedia Quotations.
How to create quotations in image documents, see Creating Image Quotations.
CREATING QUOTATIONS IN TEXT DOCUMENTS 168
9.0.0.214 (15.12.2021) ATLAS.ti 9 Windows - User Manual
183.
Creating Quotations inImage Documents
If you work with pictures, video or geo snapshots, or PDF image documents:
Move the mouse pointer to the upper left corner of the rectangular section that you are
going to create, hold down the left mouse button and drag the mouse to the lower right
corner of the rectangle. Release the mouse button. You have now created a selection, and
the rectangle will be highlighted.
Right click and select the option Create Free Quotation. Alternatively, you can also select
the equivalent button in the ribbon.
inst
To modify an image quotation, just re-size the rectangle.
You can preview graphical quotations in the Quotation Manager; they can be inserted into networks, and
they are included as graphical snippets in reports.
CREATING QUOTATIONS IN IMAGE DOCUMENTS 169
9.0.0.214 (15.12.2021) ATLAS.ti 9 Windows - User Manual
184.
CREATING QUOTATIONS INIMAGE DOCUMENTS 170
9.0.0.214 (15.12.2021) ATLAS.ti 9 Windows - User Manual
185.
Creating Quotations inPDF Documents
A text PDF file can contain images as well, like picture, graphs or tables. In ATLAS.ti you can create quotations for
text and images in PDF documents.
Text selection: Select the text just like you do in a Word file. Make sure you place the cursor right next to a letter.
Selecting a graphical element: Like selecting an area in a graphic file, draw a rectangular area with your mouse.
See also Creating Graphic Quotations.
Select a segment in the PDF document, right click and select the option Create Free
Quotation. Alternatively, you can also select the equivalent button in the ribbon.
warn
PDF files can be text or image files. Sometimes users accidentally add an image PDF and
wonder why they can only create graphic quotations and cannot select text. If this
happens, you need to re-create the PDF file, e.g. by letting an OCR scanner running over
your PDF image file. In a lot of PDF creators these days this is an option in the software, no
additional physical scan is needed.
CREATING QUOTATIONS IN PDF DOCUMENTS 171
9.0.0.214 (15.12.2021) ATLAS.ti 9 Windows - User Manual
186.
Working with MultimediaData
In this section, the following options are discussed:
Creating multimedia quotations
Creating multimedia quotations while listening to the audio file or viewing the video file
Display of multimedia quotations
Coding multimedia quotations
Activating and playing multimedia quotations
Adjusting the size of multimedia quotations
Renaming a multimedia quotation
Capturing video snapshots as image documents for further analysis
Creating Multimedia Quotations
You can also immediately code multimedia files. However, as especially video files contain so much more
information as compared to text, it is often easier to first go through and segment the audio or video file, i.e.
creating quotations before coding.
To create an audio or video quotation, move your mouse pointer on top of the audio
waveform and mark a section by clicking on the left mouse button where you want it to
start. Then drag the cursor to the end position. The times of the end and start positions
are shown, as well as the total length of the segment.
As soon as you let go of the mouse, a quotation is created, and you see the blue quotation boundary in the margin
area
If you want to make a selection first and then create a quotation, you can change the default settings. See
Project Preferences. If you deactivate Automatically create new quotation on selection, to create a
quotation you need to hoover with the mouse over the selection and click Create Quotation.
•
•
•
•
•
•
•
•
WORKING WITH MULTIMEDIA DATA 172
9.0.0.214 (15.12.2021) ATLAS.ti 9 Windows - User Manual
187.
Creating Multimedia Quotationswhile Listening / Watching
You can also create an audio or video quotation while listening to or viewing a document.
For this, you can use the buttons Mark Position and Create Quotation buttons in the
toolbar; or the short-cut keys (see below).
Using the Ribbon Buttons
inst
Play the video. If you find something interesting that you want to mark as a
quotation, click Mark Position. This set the start position. To set the end point and
create a quotation, click Create Quotation.
Continue listening / watching and setting quotations.
Using Short
To mark the start position: use (<) or (,)
To create a quotation: use (>) or (.)
WORKING WITH MULTIMEDIA DATA 173
9.0.0.214 (15.12.2021) ATLAS.ti 9 Windows - User Manual
188.
Which short-cut keyto use depends on your keyboard. Use those keys where you do not have to use Shift.
Play the video. If you find something interesting you want to mark as a quotation, click on
the (,) or the (<) key. This sets the start position.
To set the end position and create a quotation, click on the (.) or (>) key.
A new quotation will be listed in the Quotation Manager, the Project Explorer or Quotation Browser. The
quotation ID consists of the number of the document plus a consecutive count in chronological order by
time when a quotation was created in the document. The quotation ID 15:5 for examples means that this is
a quotation in document 15, and it was the 5th quotation that was created in the document.
After the ID you see the quotation reference, which is the start position of the audio or video quotation.
The name field is empty. You can for instance add a short title for each multimedia quotation, see below.
Depending on the media type, the quotation icon changes.
Audio and video quotations can be easily recognized by their special icon.
Coding Multimedia Quotations
Coding multimedia quotations is not different from coding text or image documents:
Right-click the quotation and select Apply Codes. For further information see: Coding Data.
Activating and Playing Multimedia Quotations
In the Margin Area
To play the quotation, double-click on the quotation bar, or hoover over the audio waveform
with the mouse and click on the play icon.
You can move the play-head with the mouse to any position within an audio or video file.
From other Places
You can double-click on a multimedia quotation in the Project Explorer, the Quotations Browser or the
Quotation Manager to play it in context.
You can preview a multimedia quotation in the preview area of the Quotation Manager.
You can preview a multimedia quotation if it is part of a hyperlink. See Working with Hyperlinks.
•
•
•
•
•
•
WORKING WITH MULTIMEDIA DATA 174
9.0.0.214 (15.12.2021) ATLAS.ti 9 Windows - User Manual
189.
Adjusting the Sizeof Multimedia Quotations
To adjust or change the length of the quotation, drag the start or end position to the
desired position.
Renaming a Multimedia Quotation
When you create audio or video quotation, the name field is empty. You can enter a name for instance to add a
short description of what the audio or video quotation is all about.
Right click on the quotation in the margin area or in the Quotation Manager and select the
Rename option. This allows you to create a meaningful text output of coded audio and
video segments.
Use the comment area to add further information, e.g. describe the segment and offer a
first interpretation
See also Making Use of Quotation Name and Comment for Analytical Purposes.
See Example Reports for an instruction on how to create reports for named and commented multimedia
quotations.
Capturing Snapshots of Video Frames as Image Documents
If you want to analyze particular frames of your video in more detail, you can capture a snapshot.
Move the play head to the desired position in the video.
Click on the camera icon in ribbon, or right-click on the video and select the option Capture
Video Frame.
The snapshot is automatically added as a new image document to your project. See
Creating Quotations im Images for further information on how to work with image files.
WORKING WITH MULTIMEDIA DATA 175
9.0.0.214 (15.12.2021) ATLAS.ti 9 Windows - User Manual
190.
Working with Quotations
MakingUse of the Quotation Names and Comments for Analytical
Purposes
You can use the quotation name field for paraphrasing or summarizing the content of textual quotations, as a title
for video and image quotations, or for entering the location for geo quotations.
The quotation name can also be used for instance for the phase of line-by-line coding in Grounded Theory, or for
initial coding in Constructive Grounded Theory, or for other inductive approaches. Instead of generating too many
codes on a descriptive level, the quotation name can be used for this type of coding.
Open the Quotation Manager into a new tab group next to the document you are currently
working on. See Working with Tabs and Tab Groups.
Create a quotation in the document. This quotation will also be added to the Quotation
Manager.
Right-click on a quotation in the Quotation Manager and select Rename, or select F2, or
select the rename button in the ribbon of the Quotation Manager.
WORKING WITH QUOTATIONS 176
9.0.0.214 (15.12.2021) ATLAS.ti 9 Windows - User Manual
191.
The example belowshows an example where a name was added to add titles for video quotations:
WORKING WITH QUOTATIONS 177
9.0.0.214 (15.12.2021) ATLAS.ti 9 Windows - User Manual
192.
Further interpretations canbe written into the comment field of the quotation. Below you see an example
where this feature was used extensively for a grounded theory analysis.
WORKING WITH QUOTATIONS 178
9.0.0.214 (15.12.2021) ATLAS.ti 9 Windows - User Manual
193.
If you areinterested to read more about this study, you can read the following paper CAQDAS and Grounded
Theory Analysis, or the book chapter: Grounded Theory Analysis and CAQDAS: A Happy Pairing or Remodeling GT
to QDA.
See Example Reports for an instruction on how to create reports for named and commented (multimedia)
quotations.
WORKING WITH QUOTATIONS 179
9.0.0.214 (15.12.2021) ATLAS.ti 9 Windows - User Manual
194.
Reviewing Coded Quotationsand Modify Coding
There are several ways how to review coded quotations:
Double-click on a code anywhere. This opens the Quotation Reader - or gives an option to open the
Quotation Reader.
Open the Quotation Manager and select a code in the side panel.
•
•
WORKING WITH QUOTATIONS 180
9.0.0.214 (15.12.2021) ATLAS.ti 9 Windows - User Manual
195.
Create a queryin the Query tool, a Code Document Table, or a Code Co-occurrence Table and review
quotations in the result lists.
For further information, see Quotation Reader.
Displaying Quotations in Context
Displaying quotations in context means that you can view a quotation that is listed in a browser or a list in the
context of the original data.
Double-click on an entry in the Quotation Manager.
Click on the quotation bar in the margin area.
Double-click on the quotation in the Document sub-branch in the Project Explorer.
Once you have coded data, quotations can also be retrieved via their codes. See Quotation Reader.
Quotations can be activated in networks. See Working With Networks.
Quotations can be activated from a result list of a project search (see Project Search).
Deleting Quotations
To delete a single quotation, right-click on a quotation and select the Delete option from
the context menu.
•
•
•
•
•
•
•
WORKING WITH QUOTATIONS 181
9.0.0.214 (15.12.2021) ATLAS.ti 9 Windows - User Manual
196.
This option isavailable in all browsers, windows and lists where you see quotations, i.e. the Project Explorer, the
Quotation Reader, the Quotation Manager, in a network, or the margin area.
Deleting a quotation does not delete the data itself. Think of quotations like a layer on top of your data. Deleting
this layer does therefore not delete the underlying data. However, all other existing links like links to codes,
memos or hyperlinks will be removed when deleting a quotation.
Changing the Chronological Order of Quotations
The quotation ID numbers quotations in the chronological order when they have been created. For various reasons,
at times users want the quotations to be numbered in the sequential order as they occur in the document.
When you delete quotations, the numbering is not automatically adjusted. Instead, they are gaps. Renumbering
the quotations also closes those gaps.
To renumber quotations:
Open the Quotation Manager and select the Renumber Quotations option in the ribbon.
WORKING WITH QUOTATIONS 182
9.0.0.214 (15.12.2021) ATLAS.ti 9 Windows - User Manual
197.
Coding Data
“Coding meansthat we attach labels to 'segments of data' that depict what each segment is about. Through
coding, we raise analytic questions about our data from […]. Coding distills data, sorts them, and gives us an
analytic handle for making comparisons with other segments of data” (Charmaz, 2014:4).
“Coding is the strategy that moves data from diffuse and messy text to organized ideas about what is going
on” (Richards and Morse, 2013:167).
"Coding is a core function in ATLAS.ti that lets you “tell” the software where the interesting things are in your
data. ... the main goal of categorizing your data is to tag things to define or organize them. In the process of
categorization, we compare data segments and look for similarities. All similar elements can be grouped
under the same name. By naming something, we conceptualize and frame it at the same time" (Friese,
2019).
Creating New Codes without Coding
You can create codes that have not (yet) been used for coding. Such codes are called "free" codes. This can for
example be useful when ideas for codes come to mind during normal coding work and that cannot be applied to
the current segment but will be useful later. Sometimes you also need free codes for expression conceptual
connections in networks. If you already have a list of codes, possibly including code descriptions and groupings
elsewhere, you can use the option: Importing A List Of Codes.
In the Home tab, click on New Entities and from the drop-down menu select New Code(s).
The short-cut key combination is Ctrl+K.
You can also create new codes in the Code Manager.
Click on the button Free Code(s) in the ribbon of the Code Manager.
Coding with a New Code
Open a document and highlight a data segment, i.e., a piece of text, audio or video data, an
area in a graphic document, or a location in a geo document.
Right-click and select Apply Codes, or use the short-cut Ctrl+J, or click on the 'Apply Codes'
button in the ribbon.
CODING DATA 183
9.0.0.214 (15.12.2021) ATLAS.ti 9 Windows - User Manual
198.
Enter a nameand click on the plus button or press enter.
You can continue to add more codes, or simply continue to select another data segment. The dialogue closes
automatically.
for more information on working with data other than text, see Working With Multimedia Data and
Working With Geo Docs.
Display of Coded Data Segments in the Margin Area
The coded segment is displayed in the margin area. A blue bar marks the size of the coded segment (= quotation),
and the code name appears next to it. When coding data in this way, a new quotation is created automatically, and
the code is linked to this quotation.
CODING DATA 184
9.0.0.214 (15.12.2021) ATLAS.ti 9 Windows - User Manual
199.
Applying Existing Codes
Existingcodes can be applied using the Coding Dialogue or via Drag & Drop.
Using the Coding Dialogue
Highlight a data segment, right-click and select Apply Codes, or simply double-click on the
quotation.
Select one of the existing codes, click on the plus button or press Enter. If you type the first
few letters in the entry field, only those codes are presented that match the letter
combination.
Code density is not a value that is calculated by the software. It goes up, when the researcher begins to
link codes to each other. See Working With Networks.
CODING DATA 185
9.0.0.214 (15.12.2021) ATLAS.ti 9 Windows - User Manual
200.
Drag-and-Drop Coding
Drag-and-Drop Codingis possible from the following locations:
the Codes branch from the Project Explorer
the Code Browser in the navigation panel.
the Code Manager
Below you find more Drag-and-Drop options.
To use drag-and-drop coding highlight a data segment, select one or more codes in the
above mentioned lists or windows and drag the code onto the highlighted data segment.
Code Browser in the navigation panel: To open the Code Browser, go to the Home ribbon and select Codes from
the Navigator section. The search field in the Code Browser facilitates handling a longer code list. Rather than
scrolling the list, you enter the first letters of a code.
Code Manager: When using the Code Manager, it is recommended to place it next to the text you are coding into a
new tab group. See Working With Docked And Floated Windows. You can quickly access codes using code groups
to filter the list, or by using the search field. In the Code Manager you can see and edit code comments.
Code In-Vivo
Use in-vivo coding when the text itself contains a useful and meaningful name for a code.
In-vivo coding creates a quotation from the selected text AND uses the selected text as the code name. If the
selected text's boundaries are not exactly what you want for the quotation, modifying the quotation's "spread" is
often the next step after creating the in-vivo code. See Working with Codes > Modifying the length of a coded
segment.
Select a segment in a text document, right-click and select Code in Vivo, or the
corresponding button in the ribbon.
In-Vivo coding can only be applied to textual primary documents.
•
•
•
CODING DATA 186
9.0.0.214 (15.12.2021) ATLAS.ti 9 Windows - User Manual
201.
Quick Coding
Quick Codingassigns the last used code to the current data segment. This is an efficient method for the
consecutive coding of segments using the most recently used code.
Highlight a data segment or click on an existing quotation.
Right click and select Quick Coding from the context menu, or use the short-cut Ctrl+L.
Another option is to click on the Quick Coding button in the ribbon, but this is (admittedly)
less quick.
Document Ribbon when Coding
Apply Codes: Opens the Coding Dialogue.
Code In vivo: In-vivo coding creates a quotation from the selected text AND uses the selected text as the code
name.
Quick Coding: Quick Coding assigns the last used code to the current data segment.
Search & Code: You can access the four Search & Code functions from here:
Focus Group Coding: You can start the Focus Group Coding function from here.
Rename: This allows you to rename a selected quotation.
Delete: Select a code in the margin area or a quotation. Only the quotation will be deleted.
Unlink: You can unlink codes from a quotation, or a hyperlink using this option.
Flip Link: Flips the link of a selected hyperlink.
CODING DATA 187
9.0.0.214 (15.12.2021) ATLAS.ti 9 Windows - User Manual
202.
Relation: Opens theRelation Manager.
Comment: Click the drop-down arrow and select which comment you want to view or edit.
Word Cloud: Creates a word cloud from the document.
Word List: Creates a word list from the document.
Search Document: Searches the content of the document.
Edit: Starts edit mode, so you can modify the content of the document. When selected the ribbon changes, and
you see the available edit options:
Print: Click on this option if you want to print the document as you see it on your screen including the margin area.
After clicking this option, the following printer dialog opens:
Printer: Select if you want to send the output to a printer or whether you want to save it as PDF document.
Orientation: The default selection is 'Landscape', as this is likely the best option to see the document and all codes
in the margin area.
Margin space: Under 'Margin space', you can adjust the width of the margin if you need more or less space.
Pages: You can print all pages, or a page range.
With the 'Previous' and 'Next Page' buttons you can preview all pages.
CODING DATA 188
9.0.0.214 (15.12.2021) ATLAS.ti 9 Windows - User Manual
203.
The print withmargin option is available for text, PDF and image documents.
Keyboard Shortcuts For Coding
Coding Short-Cut
Create Free Code Ctrl+K
Apply Codes Ctrl+J
Quick Coding Ctrl+L
Code In-Vivo Shift + Ctrl + V
More Drag-And-Drop Options
You can drag-and-drop quotations in the Quotation Manager to a code in the side-panel in the Quotation
Manager.
You can drag-and-drop quotations from the Quotation Manager to a code in Code Manager.
You can drag-and-drop one or more codes to a quotation in the Quotation Manager.
You can drag-and-drop one or more codes to a quotation in the Quotation Browser in the Navigation Panel.
You can drag-and-drop quotations from the Quotation Browser to a code in Code Manager.
You can drag-and-drop quotations from the Quotation Browser in the Navigation panel to a code in side
panel of the Quotation Manager.
Display of Codes and Coded Data Segments in the Project Explorer
Under the main Documents branch you see on the first level the quotations including quotation ID and start and
end position. If a quotation is coded, you see the codes on the second level.
Under the main Codes branch, all codes are listed. If codes are linked to other codes, you can expand the code sub
tree further. See linking codes.
•
•
•
•
•
•
CODING DATA 189
9.0.0.214 (15.12.2021) ATLAS.ti 9 Windows - User Manual
204.
The number behinda code, e.g. (1-0) means that the code has been applied 1 time and that it has not yet been
linked to other codes (density = 0). The density remains 0 until the researcher manually links codes to other codes,
mostly in later stages of the analysis, when relationships between codes become apparent. The code list shown in
example 2 is from a more advanced project where links between codes have already been created.
CODING DATA 190
9.0.0.214 (15.12.2021) ATLAS.ti 9 Windows - User Manual
205.
Working with Codes
Modifyingthe Length of a Coded Segment
Select the quotation by clicking on the quotation bar or code in the margin area. Then move
the handle in form of a little white circles to the right or left, or up and down, depending on
whether you want to shorten or lengthen the quotation.
Removing a Coding
This option is the reverse function of coding. It removes the links between codes and quotations. Unlike the delete
function, neither codes nor quotations are removed; only the association between the code, and the quotation is
removed.
In the Margin Area
Right-click on the code in the margin area and select the option Unlink from the context
menu.
WORKING WITH CODES 191
9.0.0.214 (15.12.2021) ATLAS.ti 9 Windows - User Manual
206.
In the CodingDialogue
Double-click on quotation in the margin area. This opens the Coding Dialogue. Click on
Applied Codes to quickly see which codes have been applied to the quotation. Click on the
button with the minus (-) to remove a code.
Replacing a Code via Drag & Drop
If you want to replace a code that is linked to a data segment:
You can drag and drop another code from either the Project Explorer, Code Browser, or the
Code Manager on top of it.
WORKING WITH CODES 192
9.0.0.214 (15.12.2021) ATLAS.ti 9 Windows - User Manual
207.
Adding, Changing andRemoving Code Color
To change the code color, select one or multiple codes in the Code Manager and click on the
Change Color button in the Code tab. Select one of the offered colors.
To remove code color, select one or multiple codes in the Code Manager, click on the Change
Color button in the Code tab and click on Remove color.
Code color can also be modified in a network. See Further Options in Networks.
Renaming a Code
Right-click on a code in the margin area and select the Rename option from the context
menu.
WORKING WITH CODES 193
9.0.0.214 (15.12.2021) ATLAS.ti 9 Windows - User Manual
208.
Other places whereyou can rename a code are:
In the Project Explorer, the Code Browser, or Code Manager, right-click on a code and select
the Rename option. In the Code Manager, you can also click the Rename button in the
ribbon. Another option is to click the F2 key.
Deleting One or Multiple Code(s)
In the Project Explorer, the Code Browser, or Code Manager, right-click on a code and select
the Delete option. In the Code Manager, you can also click on the Delete button in the
ribbon.
About Renaming, Deleting and Unlinking Codes
Renaming and deleting codes are procedures that seem trivial, but understanding the scope of these operations
can be a problem for new users. For both operations you must understand, that there is only ONE code, for
example 'source of happiness: children' in a given project, even if you applied this code many times.
In the margin are, you may see the code appear many times while scrolling through your document. In fact, you
are seeing the codings for this code. Technically speaking, these are links between a quotation represented by a
blue bar and the code, represented by its name and icon.
Removing a coding in the margin area (i.e., unlinking the code) is like erasing a word in the margin of a paper
document with an eraser. It only affects one coding, i.e., one specific occurrence of the code. All other occurrences
of the same code are untouched. The effect of the operation is local.
WORKING WITH CODES 194
9.0.0.214 (15.12.2021) ATLAS.ti 9 Windows - User Manual
209.
By renaming orremoving a code from a project, you are affecting every occurrence of the code throughout the
entire project. The effect is global. Renaming the code will instantly change all the code links in the margin to
reflect the new name. Deleting it will remove all occurrences in the margin (and from all other contexts in which it
was engaged, like networks, groups, etc.).
Duplicating a Code
It is also possible to duplicate codes with all its linkages. The duplicated code is a perfect clone of the original code
including color, comment, code-quotation links, code memo links and code-code links. Duplicating a code can be a
useful option to clean up or modify a code system.
To duplicate a code, open the Code Manager, select one or more codes, right-click and select
the Duplicate Code(s) option from the context menu. Another option is to select the
Duplicate Code(s) button in the ribbon. The clone has the same name as the original code
plus a consecutive number, i.e., (2).
This option is also available in the Network Editor. See Further Options in Networks.
Writing Code Comments
Code comments can be used for various types of purposes. The most common usage is to use them for a code
definition. If you work in teams, you may also want to add a coding rule, or an example quote. If you work
inductively, you can use code comments to write down first ideas of how you want to apply this code. You can also
use it to write up summaries of all segments coded with this code and your interpretation about it. There are
several ways to write a code comment.
In the Code Manager is open, you can use the comment field at the bottom of the window.
•
WORKING WITH CODES 195
9.0.0.214 (15.12.2021) ATLAS.ti 9 Windows - User Manual
210.
In the marginarea, you can double-click on a code to open the editor for writing a comment editor. Another
option is to right-click on a code and select the Edit Comment option from the context menu. You can also
click on the Edit Comment button in the ribbon of the contextual Code tab.
All codes that have a comment shows a little yellow flag, and display a tilde (~) at the end of the code
name.
Creating a Code Book
The recommended option to create a code book is to use the Excel export:
Open the Code Manager, select all codes (e.g. Strg+A) and click on the Excel Export button
in the ribbon.
Select all options that you want to include. Essential options for a code book are codes and
comments. You may also want to include groundedness, density and code groups.
Example Outcome:
•
WORKING WITH CODES 196
9.0.0.214 (15.12.2021) ATLAS.ti 9 Windows - User Manual
211.
Viewing Codes inCloud View or as Bar Chart
Select the Views tab and from there either the Cloud or Bar Chart option.
Code Cloud
Click on the button Cloud to visualize your code list in form of a word cloud:
WORKING WITH CODES 197
9.0.0.214 (15.12.2021) ATLAS.ti 9 Windows - User Manual
212.
If you right-clickon a code, the same context menu opens as in 'Details' view. Thus, in the cloud view you can start
the same actions as in the regular view. You can for instance rename codes, split or merge codes, or open a
network on one or multiple codes.
WORKING WITH CODES 198
9.0.0.214 (15.12.2021) ATLAS.ti 9 Windows - User Manual
213.
Code List asBar Chart
Click on the button Bar Chart to visualize your code list in form of a bar chart.
WORKING WITH CODES 199
9.0.0.214 (15.12.2021) ATLAS.ti 9 Windows - User Manual
214.
The codes inthe bar chart view also have a context menu. Thus, also from here, you can start the same actions as
in standard view. Select multiple codes if you want to merge codes.
WORKING WITH CODES 200
9.0.0.214 (15.12.2021) ATLAS.ti 9 Windows - User Manual
215.
Printing the Code-Cloudor the Bar Chart View
You can print both the 'Cloud' view and the 'Bar Chart'. In order to do so:
Select the Image button from the main Codes tab.
The image will be saved as jpg file in HD resolution 1920 x 1080 and 96 dpi.
WORKING WITH CODES 201
9.0.0.214 (15.12.2021) ATLAS.ti 9 Windows - User Manual
216.
Retrieving Coded Data
VideoTutorial: Retrieving data - Quotation Reader
From the Project Explorer, Code Manager or Code Browser
Double-click a code. This open the Quotation Reader and you can review all codings.
If you prefer to read the data in context, you can dock the Quotation Reader to the right or left-hand side of your
screen in single line format. To do so:
Select the option Dock to Navigation Area in the ribbon:
RETRIEVING CODED DATA 202
9.0.0.214 (15.12.2021) ATLAS.ti 9 Windows - User Manual
217.
Simple Retrieval inthe Margin Area
If you double-click on a code in the margin area, the comment field opens. From there you
can access the quotations coded with the code.
Simple AND and OR Queries in The Quotation Manager
Open the Quotation Manager.
Select a code in the filter area. If you have a long list of codes, you can enter a few letters
into the Search Code field to reduce the list to only the codes you are looking for:
RETRIEVING CODED DATA 203
9.0.0.214 (15.12.2021) ATLAS.ti 9 Windows - User Manual
218.
The list ofquotations only shows the quotations of the selected code. If you click on a quotation, it will be shown
in the preview area. If you double-click, the quotation will be shown in the context of the document.
The yellow bar on top shows the code(s) you are using as filter.
When selecting two or more codes in the side panel, the filter is extended to an OR query: Show quotations coded
with of ANY of the codes.....
Click on the blue underlined any operator. This opens a drop-down, and you can change
between ANY and ALL.
ANY: Show all quotations linked to any of the selected codes.
•
RETRIEVING CODED DATA 204
9.0.0.214 (15.12.2021) ATLAS.ti 9 Windows - User Manual
219.
ALL Show quotationswhere all the selected codes apply. This means that two or more codes have been
applied to the exact same quotation.
If you want to export the results, click on either the Report or Excel Export button in the ribbon. Find more detail
see Creating Reports.
•
RETRIEVING CODED DATA 205
9.0.0.214 (15.12.2021) ATLAS.ti 9 Windows - User Manual
220.
Exploring Coded Data
Toexplore the words that have been used in the quotations linked to one or more codes, you can create a word list
or word cloud. Word lists and word clouds are described in detail in the section Exploring Data.
To create a Word Cloud or Word List, right click on a code or code group in the Project
Explorer and select either the word cloud or word list option from the context menu.
Another option is to use the ribbon button in the Code Manager.
You can also create a Word Cloud or Word List for selected quotations:
Open the Quotation Manager, select one or more codes in the side panel to retrieve their
quotations. Click the Word Cloud or Word List button in the Quotation Manager ribbon.
EXPLORING CODED DATA 206
9.0.0.214 (15.12.2021) ATLAS.ti 9 Windows - User Manual
221.
Merging Codes
You maybegin your coding very close to the data generating lots of codes. In order not to drown in a long list of
codes, you need to aggregate those codes from time to time, which means merging and renaming them to reflect
the higher abstract level. Another reason for merging is that you realize that two codes have the same meaning,
but you have used different labels.
Select two or more codes in the Code Manager and click on the Merge button (or right-click
and select the Merge option from the context menu).
Next, select the target code into which all other codes should be merged, and click on the
Merge Codes button.
A comment is automatically inserted into the target code that provides an audit trail of which codes have been
merged. If the codes that are merged had a comment, these comments are also added to the target code.
MERGING CODES 207
9.0.0.214 (15.12.2021) ATLAS.ti 9 Windows - User Manual
222.
It is alsopossible to use the network editor for merging codes. This provides a visual space where you can
arrange your codes, review, sort and order them and decide which once to merge. See Networks: Further
Options.
MERGING CODES 208
9.0.0.214 (15.12.2021) ATLAS.ti 9 Windows - User Manual
223.
Splitting a Code
Splittinga code is necessary if you have been lumping together many quotations under a broad theme. This is a
suitable approach for a first run through to get an idea about your data. At some point, however, those codes need
to be split up into smaller sub codes.
Select a code that you want to split in the Code Manager and click on the Split Code button
in the ribbon, or select the option Split from the context menu.
In the Split Code tool, you see the list of the quotations coded with the code.
Click on the button New Codes. Enter as many sub codes as you need.
ATLAS.ti automatically creates a prefix that consists of the name of the code you split
followed by a colon (:). After adding all sub codes that you need, click Create.
inst
You can now assign the quotations to one or more sub codes. When you select a quotation,
its content is shown below the list of quotation. Assign the quotations by clicking on the
checkbox of the sub codes that apply. The quotation is automatically unlinked from the
main code that you are splitting.
After you have distributed some or all of the quotations into sub codes, click on Split Code.
Now the sub codes are created, and the quotations are assigned accordingly.
It is not required that you assign all quotations to sub codes. If you are not sure what to do with a quotation, you
can leave it coded with the main code and split it later.
SPLITTING A CODE 209
9.0.0.214 (15.12.2021) ATLAS.ti 9 Windows - User Manual
224.
It is recommendednot to double-code with the main, and the sub code. It takes up unnecessary space in
the margin area. Instead, create a code group of all codes that share the same prefix. This way, you can
access all data of this category by using the code group as filter.
Mutually Exclusive Coding
If you do not want to allow that a quotation is coded with two of the sub codes, activate the option Mutually
Exclusive. This is a requirement for some content analysis approaches and for calculating inter-coder agreement.
See Requirements for Coding.
SPLITTING A CODE 210
9.0.0.214 (15.12.2021) ATLAS.ti 9 Windows - User Manual
225.
Options
Copy Comments: Selectif you want all sub codes to have the same comment as the code you split.
Copy links: Select if you want all sub codes to inherit existing links to other codes or memos.
Mutually exclusive: If activated, you can assign a quotation to only one sub code. This is a requirement for
some content analysis approaches and for calculating inter-coder agreement.
•
•
•
OPTIONS 211
9.0.0.214 (15.12.2021) ATLAS.ti 9 Windows - User Manual
226.
Working With CodeGroups
Code groups help in organizing codes, they make it easy to access specific codes from a long list of codes, and they
allow you to create any kind of filter you need for querying your data.
Code groups can be created in two ways - you can create them in the Code Group Manager, or in the side panel of
the Code Manager.
To create a group in the Code Manager, click on the Home tab and open the Code Manager
by clicking on the Codes button.
Select a few codes and drag them into the filter area on the left-hand side.
After dropping the codes, enter a name for the code group and click on the button Create.
WORKING WITH CODE GROUPS 212
9.0.0.214 (15.12.2021) ATLAS.ti 9 Windows - User Manual
227.
When you clickon the newly created code group, only the codes from this group will show
up in the list on the right-hand side. This allows you to quickly access codes in your list
without having to scroll the list all the time. Above the list of codes, you see a beige bar
that shows by which group(s) you have filtered:
To show all codes again, close the yellow pane that shows up on top of the code list when
selecting a group.
WORKING WITH CODE GROUPS 213
9.0.0.214 (15.12.2021) ATLAS.ti 9 Windows - User Manual
228.
For more informationon how to work with groups, see Working With Groups.
If you are interested in learning about the differences between codes, code groups and smart codes, please view
this video.
WORKING WITH CODE GROUPS 214
9.0.0.214 (15.12.2021) ATLAS.ti 9 Windows - User Manual
229.
Importing a Listof Existing Codes
Importing an already existing code book can be useful for a number of reasons:
To prepare a stock of predefined codes in the framework of a given theory. This is especially useful in the
context of a team project when creating a Master project.
To code in a "top-down" (or deductive) way with all necessary concepts already at hand. This complements
the "bottom-up" orinductive coding stage in which concepts emerge from the data.
You can prepare a code book including code descriptions, code groups and colors in Excel and import the Excel file.
This is how you need to prepare the Excel file:
You can enter headings like Code, Code Definition, Code Group 1, Code Group 2, but you do not have to. The headers
can be in any language. The columns are interpreted in the following order, whether you add headings or not:
column 1: code name
column 2: code description (comment)
column 3: code group 1
column 4: code group 2
all subsequent columns: further code groups
If you color the code names, this color is used in ATLAS.ti as code color.
•
•
•
•
•
•
•
IMPORTING A LIST OF EXISTING CODES 215
9.0.0.214 (15.12.2021) ATLAS.ti 9 Windows - User Manual
230.
To import theExcel file, select the Import & Export tab and next Codebook. From the drop
down menu, select Import from Excel
inst
Select a file. Depending on whether you have inserted headers in the Excel file, activate or
deactivate the option "My data contains headers".
If your project already has codes, you need to decide what ATLAS.ti should do if the list of
codes in the Excel table contains codes that are already in your project. You can overwrite
the existing codes, or ignore the duplicate codes, so that they are not imported again.
tip
You also find the Import / Export Codebook options in the Tools tab of the Code Manager.
Exporting the List
You need to use this option if you want to export a list of codes for re-use in another ATLAS.ti project.
To export all codes with comments and groups, select the Import & Export tab and from
there Export Codebook / Export to Excel.
Decide whether the Excel file should contain headers for codes, comments and groups, and whether to open the
list in Excel immediately. For purposes of creating a code book for a report or appendix, we recommend using the
Export option offered in the Code Manager. This export is already formatted. See Report Examples.
IMPORTING A LIST OF EXISTING CODES 216
9.0.0.214 (15.12.2021) ATLAS.ti 9 Windows - User Manual
231.
Building a CodeSystem
A well-structured code list is important for further analysis, where you look for relationships and patterns in the
data, with the goal of integrating all results to tell a coherent story. If, as in a survey, you only have questions with
the answer categories "yes" and "no" in your questionnaire, your data will only consist of nominal variables. This
means that the analysis is limited and does not go beyond the descriptive level. This is like a code list that consists
of a set of codes whose analysis level remains indefinite.
See also: Creating a coding scheme with ATLAS.ti.
Benefits of a well-structured code list
it creates order
it brings conceptual clarity for yourself and others
it provides a prompt to code additional aspects as you continue to code
it will assist you in identifying patterns
Characteristics of a well-structured code list
Each code is distinct, its meaning is different from the meaning of any other code.
•
•
•
•
•
BUILDING A CODE SYSTEM 217
9.0.0.214 (15.12.2021) ATLAS.ti 9 Windows - User Manual
232.
The meaning ofeach code is described in the code comment.
Each category can be clearly distinguished from other categories.
All sub codes that belong to a category are similar as they represent the same kind of thing. Nonetheless,
each sub code within a category is distinct.
Each code appears only once in the code system.
The code system is a-theoretical. This means the code system itself does not represent a model nor a
theory. The codes merely describe the data, so that the data can easily be accessed through them.
The code system should be logical, so you can find what you are looking for.
The code system contains between 10 and 25 top-level categories.
The code system has no more than two to three levels. Thus, it consists of categories and sub codes, and
possible a dimension like positive / negative, or a time indicator like before / during / after. If dimensions
apply to many codes in the code system, it is better to create separate codes and double-code the data
with the content code plus the dimension.
Below is a bibliography of the articles and authors on which these recommendations are based.
How to Begin Building a Code System
The aim of building a code system is that you can access your data through the codes and that you can
make full use of the analysis tools. For example, knowing you can cross-tabulate codes using the code co-
occurrence table helps to understand why it is important to code in an overlappin
You start by creating codes to catch ideas, the list of code grows. You then begin to sort and order codes into
categories and sub codes making use of the merge and split functions. It is recommended to develop categories
that contain only one level of sub codes (two if necessary). This allows you to flexibly combine different aspects
when querying the data, and to avoid unnecessary long code lists and code labels.
You will find that you have different types and levels of codes:
Structural codes that code speaker units in focus groups
Attribute codes that code sociodemographic attributes of speakers or persons within a document
Codes that indicate a category and codes that are sub codes of a category, and so on.
As there is only one entity for all of these different things - the code - you can indicate different types and levels
using the code label. The table below proposes a syntax that you can use as guideline:
Syntax for Different Types and Levels of Codes
What Syntax for Code Label Example
Initial concept Lower case personal growth
Category UPPER CASE, colored EFFECT
Sub code
Lower case, same as category
color
Effects pos: personal
growth
Concept that does not fit any
category
asterisk (*) label in lower case *scientific evidence
•
•
•
•
•
•
•
•
•
•
•
BUILDING A CODE SYSTEM 218
9.0.0.214 (15.12.2021) ATLAS.ti 9 Windows - User Manual
233.
What Syntax forCode Label Example
Dimension
Lower case + special character,
coloured
/time: during
Sociodemographics prefixed with # #gender: female
speaker units prefixed with @ @Tom
Example
# gender: female
# gender: male
@Tom
@Maria
@Clara
/time: before
/time: during
/time: after
*single code 1
*single code 2
*single code 3
CATEGORY A
category A: sub 1
category A: sub 2
category A: sub 3
CATEGORY B
category B: sub 1
category B: sub 2
category B: sub 3
You see that the prefixes divide your code system into different sections. This helps you to keep organized and to
quickly find what you are looking for. It also allows you to flexibly combine the codes of the different categories or
categories with speakers, attributes and dimensions when querying the data.
BUILDING A CODE SYSTEM 219
9.0.0.214 (15.12.2021) ATLAS.ti 9 Windows - User Manual
234.
Below you seea screenshot showing a structured code list in ATLAS.ti:
The first two codes are abstract codes (= 0 frequency) that are used as modifier codes in networks. By the high
density you can see that they have lot of links to other codes. Combatants and non-combatants are actually
document groups in the analysis project. As you however cannot link groups to --> codes, these codes have been
introduced to show the difference between the two respondent groups in networks.
If you want to read more about the project and how this code list was developed, you can read the following paper:
CAQDAS and Grounded Theory Analysis.
If you have interview data, instead of attribute codes, you use document groups to sort documents by
attributes like gender, age, family status and the like.
tip
Organize your code structure based on conceptual similarities, not observed or theoretical associations, nor
according to how you think your will want to write the result chapters.
Use a separate code for each element of what the text is about, i.e., each code should encompass one
concept only. If there are multiple aspects, the passage can be coded with multiple codes.
BUILDING A CODE SYSTEM 220
9.0.0.214 (15.12.2021) ATLAS.ti 9 Windows - User Manual
235.
Don't worry ifnot all of your codes can be sorted into a category. Some codes will remain single codes. In
order not to "loose" them in the categories, use a special prefix, so they show up in their own section in the
code system.
The Role of Code Groups in Building a Code System
Users are often tempted to use code groups as higher order categories. This defeats the purpose somehow. Code
groups are filters and codes can be assigned to multiple code groups. A code of one category can however only
belong to one and not to multiple categories. This is why code groups do not serve well as higher order codes. If
you want to build categories and sub codes, the recommendation is using the above suggested syntax instead.
Indicate a category by using capital letters.
If you have a lot of low frequency code that you want or need to merge, then code groups are a good way to collect
them. After you have added all low level codes that belong to the same theme / topic / idea, you can set this code
group as filter. This makes it easier to merge the codes. You can then add prefixes, and the category code in capital
letters.
Once you have developed categories with sub codes, you can create a code group for each category for the purpose
of using it as filter. Code groups will allow you to filter by categories, and for further analysis, you can use the code
groups to analyse on the category level rather than the sub code level. See Friese, S. (2019). Qualitative Data
Analysis with ATLAS.ti. London: SAGE Publications.
Moving on
Once the data is coded, you have a good overview of your material and can describe it. You can then take the
analysis a step further by querying the data. The tools that can be used include the code co-occurrence table, the
code document table, the query tool, and the networks.
The goal is to delve deeper into the data and find relationships and patterns. Writing memos is very important at
this stage as much of the analysis does not just happen because you apply a tool. The insights come when reading
the data resulting from a query, and when writing summaries and interpretations.
Literature
The recommendations in this section are based on the following authors:
Bazeley, Pat (2013). Qualitative Data Analysis: Practical Strategies. London: SAGE Publications. Bernard, Russel H.
and Ryan, Gery W. (2010). Analysing Qualitative Data: Systematic Approaches. London: SAGE Publications.
Charmaz, Kathy (2006/2014). Constructing Grounded Theory: A Practical Guide Through Qualitative Analysis.
London: SAGE Publications. Corbin, Juliet and Strauss, Anselm (2008/2015). Basics of Qualitative Research:
Techniques and Procedures for Developing Grounded Theory (3rd and 4th ed.). Thousand Oaks, CA: SAGE
Publications.
Freeman, Melissa (2017). Modes of Thinking for Qualitative Data Analysis. NY: Routledge.
BUILDING A CODE SYSTEM 221
9.0.0.214 (15.12.2021) ATLAS.ti 9 Windows - User Manual
236.
Gibbs, G. (2008).Analysing Qualitative Data. London: SAGE. Guest, G., MacQueen, K.M., and Namey, E.E. (2012).
Applied Thematic Analysis. Los Angeles: SAGE Publications.
Hammersley M, Atkinson P (2007) Ethnography: Principles in Practice. Third edition. London: Routledge.
Johnston, L. (2006). Software and method: Reflections on teaching and using QSR NVivo in doctoral research.
International Journal of Social Research Methodology, 9(5), 379–391.
Miles, Matthew B., Huberman, Michael, Saldaña, Jhonny (2014). Qualitative Data Analysis (3rd ed.) Thousand Oaks,
CA: SAGE Publications.
Morse, J.M. and Richards, L. (2002, 2013). Readme First for a User’s Guide to Qualitative Methods (3rd ed).
Thousand Oaks, CA: SAGE Publications.
Richards, Lyn (2009, 2021, 4ed). Handling qualitative data: A practical guide. London: SAGE Publications.
Saldaña, Jonny (2021). The Coding Manual for Qualitative Researchers. London: SAGE Publications. Spradley, James
P. (2016). The Ethnographic Interview. Waveland Press. Strauss, A. (1987). Qualitative analysis for social scientists.
Cambridge, UK: Cambridge University Press.
Weston, C., Gandell, T., Beauchamp, J., Beauchamp, C., McApline, L. and Wiseman, C. (2001). Analyzing Interview
Data: The Development and Evolution of a Coding System, Qualitative Sociology 24(3): 381-400.
BUILDING A CODE SYSTEM 222
9.0.0.214 (15.12.2021) ATLAS.ti 9 Windows - User Manual
237.
About Code Treesand the Code Forest
Code trees, and the code forest are not hierarchical. Think of them like real trees that have branches that
go to all sides and not only in one direction.
The code trees, and the code forest represent the links you have created between two codes in a tree like
manner. You can link codes via drag & drop to each other, but most linking will be done in the network
editor.
When you link codes to each other, you can choose between symmetric, asymmetric and transitive relations. The
later two are directed relations. If you use a symmetric relation than the two codes point towards each other.
The code forest represent the entire code system. A code tree shows the linkages of one code.
To open the code forest or, click on the Navigator button in the Home tab and select Code
Forest. If you want to open a code tree for a select code, open the Code Manager, select a
code and select Code Tree from the Code Manager ribbon.
Let's assume the following relations among the codes A, B and C have been created:
Code A is part of Code B (transitive relation)
Code B is associated with Code C (symmetric relation)
Code C is property of Code D (asymmetric relation)
are presented as follows in the code forest:
Code D {0-1} Code C {0-2} Code B {0-2} Code A {0-1} Code C {0-2}
The code tree for code A is:
Code A {0-1}
The code tree for code B is:
Code B {0-2} Code A {0-1} Code C {0-2}
The code tree for code C is:
Code C {0-2} Code B {0-2}
The code tree for code D is:
If the code system only consist of those four codes, it is the same as the code forest:
Code D {0-1} Code C {0-2} Code B {0-2} Code A {0-1} Code C {0-2}
As you can see from the example, the code tree and forest do not present your code system hierarchically. Rather,
it is a different way to present the conceptual relationships you have created in networks.
•
•
•
ABOUT CODE TREES AND THE CODE FOREST 223
9.0.0.214 (15.12.2021) ATLAS.ti 9 Windows - User Manual
238.
Excerpt from acode forest
Example for the display of code trees for selected codes
For organizing and sorting your codes hierarchically, we recommend following the guidelines described in the
section How to build a code system.
ABOUT CODE TREES AND THE CODE FOREST 224
9.0.0.214 (15.12.2021) ATLAS.ti 9 Windows - User Manual
239.
The Margin Area
Themargin area in ATLAS.ti is an important working space. It is not only used to display entities linked to your
data like codes, memos, hyperlinks, groups or networks; it is also a space where you can interact with your data,
write and review comments, link and un-link codes, move codes around, replace codes, traverse hyperlinks, and the
like.
Depending on the current activity, you can set various display options.
Margin Display Options
To set the display options, right-click on a white space in the margin area. You have the
following options:
to display codes (default)
to display memos (default)
to display hyperlinks (default)
code groups
memo groups
networks. The network icon will be display if the quotation or code is part of the network.
to show icons (default)
to show user name. This is a useful option when working with a team and different team members code
the same document, e.g. for the purpose of inter-coder agreement analysis.
•
•
•
•
•
•
•
•
THE MARGIN AREA 225
9.0.0.214 (15.12.2021) ATLAS.ti 9 Windows - User Manual
240.
Margin Drag &Drop
All objects populating the margin area support drag & drop. The effect of a drag & drop operation depends on the
entities that are involved as drag sources (those that are dragged) and targets (those onto which entities are
dropped).
A large variety of entities from the margin area can be dropped into the margin area.
Furthermore, entities can also be dragged from other entity managers and browsers. Entities can be dragged from
the margin into other windows, browsers or even other applications like Word. In the latter case, the ATLAS.ti
entity lose their ATLAS.ti specific "objectiveness" but at least they render into something useful, e. g., a formatted
title and rich text comment.
Linking
When a code or memo is dropped on a quotation bar, a new link is created between the
entity and the quotation represented by the bar.
Dragging a quotation bar onto another quotation bar creates a new hyperlink between the
two (see Creating Hyperlinks.
When a margin entity is dropped onto another margin entity it is replaced.
Three operations are accomplished at the same time: the entity is removed from its original quotation, it is linked
to the target quotation, and it replaces the entity it was dropped on (the latter is cut from its quotation).
Copying
When you drag and drop a hyperlink, code or memo in the margin to another quotation
holding down the CTRL-key, then the hyperlink, code or memo is copied.
MARGIN DRAG & DROP 226
9.0.0.214 (15.12.2021) ATLAS.ti 9 Windows - User Manual
241.
Print with Margin
Ifyou want to print a document as you see it on your screen including the margin area,
select the Print option in the Document Ribbon.
Then the following dialog opens:
Printer: Select if you want to send the output to a printer or whether you want to save it as PDF document.
Orientation: The default selection is 'Landscape', as this is likely the best option to see the document and all codes
in the margin area.
Margin space: Under 'Margin space', you can adjust the width of the margin if you need more or less space.
Pages: You can print all pages, or a page range.
With the 'Previous' and 'Next Page' buttons you can preview all pages.
PRINT WITH MARGIN 227
9.0.0.214 (15.12.2021) ATLAS.ti 9 Windows - User Manual
242.
The print withmargin option is available for text, PDF and image documents.
PRINT WITH MARGIN 228
9.0.0.214 (15.12.2021) ATLAS.ti 9 Windows - User Manual
243.
Exploring Text Data
Aquick way to get a feeling for the content of text documents is by creating a word cloud or word list.
Word lists offer word "crunching" capabilities for a simple quantitative content analysis. This feature creates a list
of word frequency counts, and some additional metrics like word length, and percentage of occurrence within or
across all selected entities. Word lists can be exported to Excel.
Word clouds are a method for visually presenting text data. They are popular for text analysis because they make
it easy to spot word frequencies. The more frequent the work is used, the larger and bolder it is displayed. Word
clouds can be exported as image.
Word clouds and word lists can be created for:
documents and document groups
quotations
content of quotations by code and code group
A stop and go list including a list of 'ignorable' characters can be used to control the analysis. Words can also be
temporarily removed from a list or cloud without the need to add them to a stop list.
For information see Creating Word Lists and Clouds..
Creating Word Clouds
To create a word cloud for documents or codes or quotations select one or more items e.g.
in the Project Explorer or in the respective manager.
In the Project Explorer, right-click and select the option Word Cloud. In a manager, select
the Word Cloud option from the ribbon.
you can always add or remove more items of the same entity type to the cloud or list, once the word cloud has
been created.
•
•
•
EXPLORING TEXT DATA 229
9.0.0.214 (15.12.2021) ATLAS.ti 9 Windows - User Manual
244.
Other options are:
toload a document first and select the Word Cloud button in the ribbon.
to open a manager and select the Word Cloud button in the ribbon.
When you select to create a word cloud from one or multiple codes, the word cloud shows the words of the
quotations coded with the selected code(s). If you want your list of codes to be displayed in form of a
cloud, you need to select the View tab in the Code Manager and from there the option 'Cloud'. The size of
the codes in the Code Cloud is related to its frequency. See Working with Codes.
•
•
EXPLORING TEXT DATA 230
9.0.0.214 (15.12.2021) ATLAS.ti 9 Windows - User Manual
245.
When you hooverover a word, its frequency is shown (= token / number of occurrences of a unique word).
Setting the Scope
Once you created a word cloud, you see a side panel on the left. The check-boxes of the currently active entities are
checked. You can check further entities or uncheck already activated entities.
You can also change the entity type. Options are to change between:
documents
•
EXPLORING TEXT DATA 231
9.0.0.214 (15.12.2021) ATLAS.ti 9 Windows - User Manual
246.
document groups
codes
code groups
quotations
Anotherscope option is to enter a search term into the search field to look for a specific document, code, or
quotations that only contain specific words.
World Cloud Ribbon
The Word Cloud ribbon provides several options:
Show Scope: You can activate or deactivate the side panel that allows you to select the scope.
Spiral: Display of the words in a spiral (default).
Typewriter: Display of words from left to right. You can select whether to list the words in alphabetic order, by
frequency of occurrence of by word length in either ascending or descending order.
Sorting: The word cloud can be sorted in alphabetical order, by frequency or word length.
Threshold: My moving the slider from left to right, you can determine that only words with a certain frequency are
displayed. The number of the left-hand side shows the lowest, the number on the right-hand side the highest
occurring frequency.
Exclude: You can exclude single character words, numbers, hyphens and underscores.
Stop / Go Lists: To exclude particular words, you can select stop lists. If only certain words should be displayed, you
can create a Go List. See the section on "Stop and Go Lists" below.
•
•
•
•
EXPLORING TEXT DATA 232
9.0.0.214 (15.12.2021) ATLAS.ti 9 Windows - User Manual
247.
Filter
Ignore Case: Selectthis option, if you do not want to count words separately depending on whether they
contain upper or lower case letters.
Show Inflected Forms: The plural forms of nouns, the past tense, past participle, and present participle
forms of verbs, and the comparative and superlative forms of adjectives and adverbs are known as
inflected forms. If you activate this options, the word cloud only shows the basic form of the word, e.g.
building but not buildings.
Export: You can save a word cloud as graphic file (.jpg).
Filter Tab
Character Filter: In this section you can enter special characters that you do not want to be counted and displayed
in the word cloud. By default, the following characters are excluded:
|"(){}[]<>/#+-_%$&“”´`@^‘„
You can select whether these characters should generally be removed or only at word ends.
If you add or remove characters, or deactivate the restriction to word ends, you can click on the Reload button.
This updates the word cloud.
Context Menu Options
When you right-click on a word, you have the following options:
Remove from Word Cloud
Add to Stop List
Copy to Clipboard
Search in Context
•
•
•
•
•
•
EXPLORING TEXT DATA 233
9.0.0.214 (15.12.2021) ATLAS.ti 9 Windows - User Manual
248.
The option Removefrom Word Cloud temporarily removes the word from the cloud.
If you have selected a stop list (see below), you can add more words to it. The option will be grayed out as shown
in the image above, if no stop list has been selected yet.
The Copy to Clipboard option is useful, if you want to run the auto coding tool based on some words in the word
cloud. See Text Search.
The Search in Context option opens the Project Search and shows the selected word in its context.
EXPLORING TEXT DATA 234
9.0.0.214 (15.12.2021) ATLAS.ti 9 Windows - User Manual
249.
Stop and GoLists
Words in stop lists are words which are filtered out when processing text. Stop words are short function words
that occur very often and which do not convey any particular meaning. Examples are 'the', 'a', 'you', 'is', 'at', 'on'
and 'which'. ATLAS.ti offers predefined stop lists in 35 languages. These stop lists are based on the information
provided by Ranks NL.
In contrast, if you set a word list as Go List, then only the words that are in the list are counted.
Selecting a Stop List
To select a stop list, click on the drop-down button for Exclude
Importing a Stop List
If you have been importing an older version 8 project, the selection list might be empty:
All available stop lists are however already on your computer. They were copied during the installation on ATLAS.ti.
To retrieve them:
EXPLORING TEXT DATA 235
9.0.0.214 (15.12.2021) ATLAS.ti 9 Windows - User Manual
250.
Click on theEdit button and select Import Lists.
This brings you do the directory where all stop lists that come with ATLAS.ti are stored:
C:Users...DocumentsScientific SoftwareATLASti.9Stopwords
Select all lists that you want to use and click Open.
Close the window, return to the word cloud and select a stop list.
Below you see an example for a word cloud where a stop list was applied:
EXPLORING TEXT DATA 236
9.0.0.214 (15.12.2021) ATLAS.ti 9 Windows - User Manual
251.
Cleaning up aWord Cloud
In the word cloud above, there are still a lot of words that distract from the content of the interviews like all
speaker IDs: INT, SHAZ, DEB, AL, STU.
You can either remove the words from the current cloud, or add the words the stop list. Then they are also not
counted in other word clouds that you create later.
To remove a word from a word cloud temporarily, select the word, right-click and select
Remove.
If you want to remove it from all word clouds permanently:
Right-click on a word and select Add to stop list.
EXPLORING TEXT DATA 237
9.0.0.214 (15.12.2021) ATLAS.ti 9 Windows - User Manual
252.
The cleaned upword cloud might look as follows:
Creating a New Stop or Go Lists
In the ribbon in the section Stop/Go Lists, click on the Edit button.
In the next window, select New List from the ribbon.
EXPLORING TEXT DATA 238
9.0.0.214 (15.12.2021) ATLAS.ti 9 Windows - User Manual
253.
Enter a namefor the list and select as list type: Stop List or Go List. Enter an optional
comment to describe the purpose of the list.
Click Create.
To add words to the newly created list, click on th New Word button a few times. Every
time you click, a new field is added where you can enter a word.
EXPLORING TEXT DATA 239
9.0.0.214 (15.12.2021) ATLAS.ti 9 Windows - User Manual
254.
RegEx: You canenter regular expressions, if you want to enter specific terms to the list. If so, you need to tick the
Regex box. Optionally you can write a comment that explains the regular expression.
You can turn a stop list into a go list (or vice versa) by changing the List Type. Other options in the ribbon
are to duplicate and to delete word lists.
Exporting a Stop or Go List
Exporting a stop or go list allows you to:
share it with other users
use it in another project
In the ribbon, click on Export List. A file manager opens. Select a location and enter a name
and click on Save.
•
•
EXPLORING TEXT DATA 240
9.0.0.214 (15.12.2021) ATLAS.ti 9 Windows - User Manual
255.
The list issaved as Excel file.
Creating a User-Defined Stop or Go List in Excel
Importing a user defined list works as follows:
Export an existing list and open it in Excel. It serves as a template.
In Excel, change the name of the list, but leave all the header information as is. If you want
to prepare a go list, enter 'no' in the second column/second row under Stop List.
Now delete all words and replace them with new words, one word per row.
Save the list under a new name and import it.
Creating Word Lists
To create a word list for documents or codes or quotations select one or more items e.g., in
the Project Explorer or the respective manager.
In the Project Explorer, right-click and select the option Word List. In the Managers, select
the Word List option in the ribbon.
EXPLORING TEXT DATA 241
9.0.0.214 (15.12.2021) ATLAS.ti 9 Windows - User Manual
256.
You can alwaysadd or remove more items of the same entity type to the list, once the word list has been created
(see Setting the Scope below).
Other options are:
to load a document first and select the Word List button in the ribbon.
to open a document, quotation or code manager and select the Word List button in the ribbon.
When you select to create a word list from codes, the word list shows the words of the quotations coded
with the selected code(s).
When you hoover over a word, its frequency is shown (= token / number of occurrences of a unique word).
•
•
EXPLORING TEXT DATA 242
9.0.0.214 (15.12.2021) ATLAS.ti 9 Windows - User Manual
257.
Sorting Word Lists
Bedefault, word lists are sorted in alphabetic order by the first column 'Word'. You can also sort by any of the
other columns by clicking on the column header.
Setting the Scope
Once you created a word list, you see a side panel on the left. The check-boxes of the currently active entities are
checked. You can check further entities or uncheck already activated entities.
You can also change the entity type. Options are to change between:
documents
document groups
codes
code groups
quotations
•
•
•
•
•
EXPLORING TEXT DATA 243
9.0.0.214 (15.12.2021) ATLAS.ti 9 Windows - User Manual
258.
Another scope optionis to enter a search term into the search field to look for a specific document, code, or
quotations that only contain specific words.
Word List Ribbon
Show Scope: You can activate or deactivate the side panel that allows you to select the scope.
Show Details: Display of the word counts of each document if you have selected multiple documents.
Show Percent: Display the relative frequency of each word (word count relative to the total number of words in the
document / all selected documents)
Threshold: My moving the slider from left to right, you can determine that for instance only words with a
frequency of at least 10 should be displayed. The number of the left-hand side shows the lowest, the number on
the right-hand side the highest occurring frequency.
Exclude: You can exclude single character words, numbers, hyphens and underscores.
Stop / Go Lists: To exclude particular words, you can select stop lists. If only certain words should be displayed, you
can create a Go List. See the section on "Stop and Go Lists" below.
Filter
Ignore Case: Select this option, if you do not want to count words separately depending on whether they
contain upper or lower case letters.
Show Inflected Forms: The plural forms of nouns, the past tense, past participle, and present participle
forms of verbs, and the comparative and superlative forms of adjectives and adverbs are known as
inflected forms. If you activate this options, the word cloud only shows the basic form of the word, e.g.
building but not buildings.
Excel: You can export the results of the word list as Excel table.
•
•
EXPLORING TEXT DATA 244
9.0.0.214 (15.12.2021) ATLAS.ti 9 Windows - User Manual
259.
There are limitsin terms of how much data can be meaningfully processed, or moreover handled by and displayed
in Excel. Assuming there are 2000 unique words in a document, and you process 100 documents, this results in an
Excel table consisting of 200.000 cells.
Filter Tab
Character Filter: In this section you can enter special characters that you do not want to be counted and displayed
in the word cloud. By default, the following characters are excluded:
|"(){}[]<>/#+-_%$&“”´`@^‘„
You can select whether these characters should generally be removed or only at word ends.
If you add or remove characters, or deactivate the restriction to word ends, you can click on the Reload button.
This updates the word cloud.
Context Menu Options
When you right-click on a word, you have the following options:
Remove from List
Add to Stop List
Copy to Clipboard
Search in Context
•
•
•
•
EXPLORING TEXT DATA 245
9.0.0.214 (15.12.2021) ATLAS.ti 9 Windows - User Manual
260.
The option Removefrom List temporarily removes the word from the list.
If you have selected a stop list (see below), you can add more words to it.
The Copy to Clipboard option is useful, if you want to run the auto coding tool based on some words in the word
list. See Text Search.
The Search in Context option opens the Project Search and shows the selected word in its context.
EXPLORING TEXT DATA 246
9.0.0.214 (15.12.2021) ATLAS.ti 9 Windows - User Manual
261.
Stop and GoLists
Working with Stop and Go Lists are explained in detail here.
EXPLORING TEXT DATA 247
9.0.0.214 (15.12.2021) ATLAS.ti 9 Windows - User Manual
262.
Stop and GoLists
Words in stop lists are words which are filtered out when processing text. Stop words are short function words
that occur very often and which do not convey any particular meaning. Examples are 'the', 'a', 'you', 'is', 'at', 'on'
and 'which'. ATLAS.ti offers predefined stop lists in 35 languages. These stop lists are based on the information
provided by Ranks NL.
In contrast, if you set a word list as Go List, then only the words that are in the list are counted.
Selecting a Stop List
To select a stop list, click on the drop-down button for Exclude
Importing a Stop List
If you have been importing an older version 8 project, the selection list might be empty:
STOP AND GO LISTS 248
9.0.0.214 (15.12.2021) ATLAS.ti 9 Windows - User Manual
263.
All available stoplists are however already on your computer. They were copied during the installation on ATLAS.ti.
To retrieve them:
Click on the Edit button and select Import Lists.
This brings you do the directory where all stop lists that come with ATLAS.ti are stored:
C:Users...DocumentsScientific SoftwareATLASti.9Stopwords
Select all lists that you want to use and click Open.
Close the window, return to the word cloud and select a stop list.
Below you see an example for a word cloud where a stop list was applied:
STOP AND GO LISTS 249
9.0.0.214 (15.12.2021) ATLAS.ti 9 Windows - User Manual
264.
Cleaning up aWord Cloud
In the word cloud above, there are still a lot of words that distract from the content of the interviews like all
speaker IDs: INT, SHAZ, DEB, AL, STU.
You can either remove the words from the current cloud, or add the words the stop list. Then they are also not
counted in other word clouds that you create later.
To remove a word from a word cloud temporarily, select the word, right-click and select
"Rmove"
If you want to remove it from all word clouds permanently:
Right-click on a word and select Add to stop list.
STOP AND GO LISTS 250
9.0.0.214 (15.12.2021) ATLAS.ti 9 Windows - User Manual
265.
The cleaned upword cloud might look as follows:
Creating a New Stop or Go Lists
In the ribbon in the section Stop/Go Lists, click on the Edit button.
STOP AND GO LISTS 251
9.0.0.214 (15.12.2021) ATLAS.ti 9 Windows - User Manual
266.
In the nextwindow, select New List from the ribbon.
Enter a name for the list and select as list type: Stop List or Go List. Enter an optional
comment to describe the purpose of the list.
Click Create.
To add words to the newly created list, click on th New Word button a few times. Every
time you click, a new field is added where you can enter a word.
STOP AND GO LISTS 252
9.0.0.214 (15.12.2021) ATLAS.ti 9 Windows - User Manual
267.
RegEx: You canenter regular expressions, if you want to enter specific terms to the list. If so, you need to tick the
Regex box. Optionally you can write a comment that explains the regular expression.
You can turn a stop list into a go list (or vice versa) by changing the List Type. Other options in the ribbon
are to duplicate and to delete word lists.
Exporting a Stop or Go List
Exporting a stop or go list allows you to:
share it with other users
use it in another project
In the ribbon, click on Export List. A file manager opens. Select a location and enter a name
and click on Save.
•
•
STOP AND GO LISTS 253
9.0.0.214 (15.12.2021) ATLAS.ti 9 Windows - User Manual
268.
The list issaved as Excel file.
Creating a User-Defined Stop or Go List in Excel
Importing a user defined list works as follows:
Export an existing list and open it in Excel. It serves as a template.
In Excel, change the name of the list, but leave all the header information as is. If you want
to prepare a go list, enter 'no' in the second column/second row under Stop List.
Now delete all words and replace them with new words, one word per row.
Save the list under a new name and import it.
Type-Token Ratio
The type-toke ration (TTR) is the relationship between the number of unique words that occur in a text and their
frequencies. The number of unique words in a text is often referred to as the number of tokens. Several of these
tokens are repeated.
The type-token ratio can vary between 0 and 1.
•
STOP AND GO LISTS 254
9.0.0.214 (15.12.2021) ATLAS.ti 9 Windows - User Manual
269.
The more typesthere are in comparison to the number of tokens (the higher the value), the more varied is
the vocabulary. This means there is greater lexical variety in the text.
The type-token ration is calculated as follows:
Type-Token Ratio = (number of types/number of tokens) * 100
In word lists and word clouds, you find the type-token ratio in the status bar at the bottom.
The type/token ratio (TTR) varies very widely in accordance with the length of the text - or corpus of texts
- which is being studied. A 1,000 word article might have a TTR of 40%; a shorter one might reach 70%; 4
million words will probably give a type/token ratio of about 2%.
•
STOP AND GO LISTS 255
9.0.0.214 (15.12.2021) ATLAS.ti 9 Windows - User Manual
270.
Search & Code
Withthe recent advances in deep learning, the ability of algorithms to analyse text has improved considerably.
Creative use of advanced artificial intelligence techniques can be an effective tool for doing in-depth research.
Under the Search & Code tab, ATLAS.ti offers four ways of searching for relevant information in your data that can
then be automatically coded.
text search
expert search with regular expressions
Named Entity Recognition (NER)
Sentiment Analysis
As ATLAS.ti is a tool for qualitative data analysis, the process is not fully automated. Before coding the data, you
can review all results, make modifications or decide not to code certain finds.
Artificial intelligence techniques have been developed for big data analysis. The data corpora usually
handled by ATLAS.ti are considerably smaller. Thus, you cannot expect all results to be perfect. Reviewing
the results will be a necessary component of the analysis process when using these tools. When working
with the tools, you will see that the tools will add another level to your analysis. You find things that you
simply do not see when coding the data manually, or would have not considered to code. We, at ATLAS.ti,
consider manual and automatic coding to be complementary; each enhancing your analysis in a unique
way.
•
•
•
•
SEARCH & CODE 256
9.0.0.214 (15.12.2021) ATLAS.ti 9 Windows - User Manual
271.
Text Search
When usingthis tool, you enter your own search term and can let ATLAS.ti automatically code your data. The tool
offers a number of additional functions that make it more than a simple auto coding tool:
You can select synonyms. Currently only synonyms for words in English are offered.
You can combine multiple search terms using AND and OR, which occur within a sentence or paragraph, or
multiple syllabuses in a word.
You can search for inflected forms, i.e. searching for "run" will also search for running, runs, ran.
You can use wildcards (*)
You can search for exact phrases by entering parentheses as in: „limited liability corporations”.
Carrying out a text search
To open the tool, select the Search & Code tab and from there Text Search.
inst
Select documents or document groups that you want to search and click Continue.
Select whether the base unit for the search and the later coding should be:
paragraphs
sentences
words
•
•
•
•
•
•
•
•
TEXT SEARCH 257
9.0.0.214 (15.12.2021) ATLAS.ti 9 Windows - User Manual
272.
exact match (wildcards can be used)
Enter a search term. If synonyms are available, you can select them from the drop-down
list right to the search entry field.
Currently only synonyms for words in English are offered.
You can add more search terms linking them via AND and OR.
AND: All of the entered search terms must occur in the selected context (paragraph, sentence, word).
OR: Results are returned if any of the search terms occur in the selected context (paragraph, sentence,
word).
Activate the option inflected forms if desired. This option is currently available for English,
German, Spanish, and Portuguese.
•
•
•
TEXT SEARCH 258
9.0.0.214 (15.12.2021) ATLAS.ti 9 Windows - User Manual
273.
Inflected forms: Theplural forms of nouns, the past tense, past participle, and present participle forms of
verbs, and the comparative and superlative forms of adjectives and adverbs are known as inflected forms.
To improve results you can download and install a more comprehensive model. To do so, click on Manage
Models.
To run the search, click on Show Results.
The result page shows you a Quotation Reader indicating where the quotations are when (auto-)coding the data.
If coding already exist at the quotation, it will also be shown.
By clicking on the eye, you can change between small and large previews.
inst
You can auto code all results with one code by selecting Apply Codes.
Enter a code name, or select an existing one, and click the plus icon.
Depending on the area you have selected, either the exact match, the word, the sentence or the paragraph is
coded.
Another options is to review each find and code it by clicking on the coding icon. This opens
the regular Coding Dialogue.
Exact Match Search
An exact match search finds the characters as they are entered into the search field. The search results for
'emotion' could look as follows:
emotions
emotionless
demotion
demotional
If you only want to find "emotion", you need to add parentheses around the search term. See: Exact Phrase Search.
•
•
•
•
TEXT SEARCH 259
9.0.0.214 (15.12.2021) ATLAS.ti 9 Windows - User Manual
274.
Exact Phrase Search
Whenyou want to search using an exact phrase, you simply surround your search expression with quotation
marks. For example, if you want to search for limited liability corporations but only want to retrieve results in
which the terms appear as an exact phrase, type "limited liability corporations" (including the quotation marks)
into the search field.
Your search results will only include data segments that contain the exact phrase - limited liability corporations -
as typed between the quotation marks, but will not include results where the terms are separated by other words,
as in: corporations with limited liability.
For best results, do not include wildcard characters in an exact phrase search unless the wildcard character * is part
of the phrase you are looking for.
For synonyms, ATLAS.ti uses a database provided by TT Software / Databases. ATLAS.ti Scientific
Software GmbH ist not responsible for the content.
TEXT SEARCH 260
9.0.0.214 (15.12.2021) ATLAS.ti 9 Windows - User Manual
275.
Expert Search withRegular Expressions (regex)
GREP is a well-known search tool in the UNIX world. The original GREP tool printed each line containing the search
pattern, hence the acronym GREP (Globally search for a Regular Expression and Print matching lines).
In ATLAS.ti, the results of a GREP search are not printed line-by-line; rather, the text matching the search pattern
is highlighted on the screen, or you can automatically code the results including some surrounding context.
The core of a GREP search is the inclusion of special characters in the search string that control the matching
process. GREP finds instances in your data that match certain patterns.
You can test and debug any regular expression you formulate on this website: https://regex101.com/
Carrying out a text search with Regex
To open the tool, select the Search & Code tab and from there Expert Search.
inst
Select documents or document groups that you want to search and click Continue.
Select whether the base unit for the search and the later coding should be:
paragraphs
sentences
words
the exact match
Enter a search term. You can test your search expression in the text that you see in the
lower half of the screen.
To run the search, click on Show Results.
The result page shows you a Quotation Reader, indicating where the quotations are when
(auto)coding the data. If codings already exist at the quotation, those will also be shown.
By clicking on the eye icon, you can change between small, medium and large previews.
inst
You can auto code all results with one code by highlighting all data segments, e.g. via
Ctrl+A. Then select Apply Codes, enter a code name and click the plus icon. Depending on
the area you have selected, either the exact match, the word, the sentence or the
paragraph is coded.
inst
Another options is to review each find and code it by clicking on the coding icon. This opens
the regular Coding Dialogue.
•
•
•
•
EXPERT SEARCH WITH REGULAR EXPRESSIONS (REGEX) 261
9.0.0.214 (15.12.2021) ATLAS.ti 9 Windows - User Manual
276.
GREP Examples
GREP ExpressionDescription
^ Matches an empty string at the beginning of a line.
$ Matches an empty string at the end of a line.
. Matches any character except a new line.
+
Matches at least one occurrence of the preceding expression or
character.
*
Matches the preceding element zero or more times. For
example, ab*c matches "ac," "abc," "abbbc," etc.
?
Matches the preceding element zero or one time. For example,
ba? matches "b" or "ba."
[]
Matches a range or set of characters: [a-z] or [0-9] or
[aeiou]. For example: [0-9] finds all numeric characters,
while [^0-9] finds all non-numeric character
b Matches an empty string at a word boundary
B Matches an empty string not a word boundary
< Matches an empty string at the beginning of a word
> Matches an empty string at the end of a word
Backspace character disables the
special GREP functionality of the
following character:
GREP Expression Description
d Matches any digit (equivalent to [0-9])
D Matches anything but a digit
s Matches a white-space character
S Matches anything but a white-space character
w Matches any word constituent character
W any character but a word constituent
Character classes
Character
Classes
Description
[:alnum:] Any alphanumeric, i.e., a word constituent, character
[:alpha:] Any alphabetic character
[:cntrl:]
Any control character. In this version, it means any character whose ASCII code is <
32.
[:digit:] Any decimal digit
[:graph:]
Any graphical character. In this version, this mean any character with the code >=
32.
[:lower:] Any lowercase character
[:punct:] Any punctuation character
[:space:] Any white-space character
[:upper:] Any uppercase character
[:xdigit:] Any hexadecimal character
EXPERT SEARCH WITH REGULAR EXPRESSIONS (REGEX) 262
9.0.0.214 (15.12.2021) ATLAS.ti 9 Windows - User Manual
277.
Note that theseelements are components of the character classes, i.e. they have to be enclosed in an
extra set of square brackets to form a valid regular expression. A non-empty string of digits or arbitrary
length would be represented as [[:digit:]]+
Examples of GREP Searches
In the following, a few search examples are presented showing the matching GREP expression in the column on
the right.
The expression man|woman matches "man" and "woman." You could also use (|wo)man to the same effect.
H(a|e)llo matches "Hello" and "Hallo."
H(a|e)+llo matches "Haaaaaallo" as well as "Heeeeeaaaaeaeaeaeaello."
And how about the (angry|lazy|stupid) (man|woman) (walk|run|play|fight)ing with the
gr(a|e)y dog - get the idea?
•
•
•
•
EXPERT SEARCH WITH REGULAR EXPRESSIONS (REGEX) 263
9.0.0.214 (15.12.2021) ATLAS.ti 9 Windows - User Manual
278.
Named Entity Recognition(NER)
In natural language processing, Named Entity Recognition (NER) is a process where a sentence, or a chunk of text
is parsed through to find entities that can be put under categories like person, organization, location, or
miscellaneous like work of arts, languages, political parties, events, title of books, etc.
Currently supported languages are: English, German, Spanish and Portuguese
You can think of it like a special auto coding procedure, where you as the user do not enter a search term. Instead,
ATLAS.ti goes through your data and finds entities for you.
You can select which entities you want to search for:
person
organization
location
miscellaneous (work of arts, languages, political parties, events, title of books, etc.)
After the search is completed, ATLAS.ti shows you what it found, and you can make corrections. In the next step
you can review the results in context and code all results with the suggested codes, or decide for each hit whether
to code it or not.
To open the tool:
Select the Search & Code tab and from there Named Entity Recognition.
inst
Select documents or document groups that you want to search and click Continue.
•
•
•
•
NAMED ENTITY RECOGNITION (NER) 264
9.0.0.214 (15.12.2021) ATLAS.ti 9 Windows - User Manual
279.
Select whether thebase unit for the search and the later coding should be paragraphs or
sentences, and which entity category you want to search for.
inst
ATLAS.ti proposes prefixes for the code label for each category. If you want different ones,
you can change them here.
Manage Models: If you want to improve your results, you can download and install a more comprehensive
model. Currently, it is available for German and English language texts. More languages will be added in the
future. The size of the German model is ~ 230 MB and for the English model ~ 110 MB.
Click on Manage Models if you want to install or uninstall an extended model.
Click Continue to begin searching the selected documents. On the next screen, the search
results are presented, and you can review them.
NAMED ENTITY RECOGNITION (NER) 265
9.0.0.214 (15.12.2021) ATLAS.ti 9 Windows - User Manual
280.
Reviewing Search Results
Ifyou selected to search for all entity types (persons, location, organization and miscellaneous), you can review
them all together, or just focus on one entity at a time. To do so, deactivate all other entity types.
Select all results that you want to code. If a result is interesting but comes up in the wrong
category, you can change the category in the second column of the result list. In the third
column, the suggested code name is listed.
NAMED ENTITY RECOGNITION (NER) 266
9.0.0.214 (15.12.2021) ATLAS.ti 9 Windows - User Manual
281.
Code Name
You havethree options for the code name:
Entity Name: The search hit is used as name without pre-fix. If you select this option, the resulting codes
are listed in alphabetic order in the Code Manager. It is recommended to use this option in combination
with creating code groups for each category.
Category Name: If you use this option, all search hits will be combined under one code using the category
label as name.
Category::Entity: The category name, and the search hit is used as code name (recommended option).
You also have the option to group all codes of a category into a code group. This option is
useful if you selected entity names only, or category plus entity as code name.
Click Show Results to inspect the results in context.
The result page shows you a Quotation Reader indicating where the quotations are when coding the data with the
proposed code. If coding already exist at the quotation, it will also be shown.
By clicking on the eye, you can change between small and large previews.
You can code all results with one of the proposed codes, or with all proposed codes at
once.Alternatively, you can go through, review each data segment and then code it by
clicking on the plus next to the code name.
•
•
•
NAMED ENTITY RECOGNITION (NER) 267
9.0.0.214 (15.12.2021) ATLAS.ti 9 Windows - User Manual
282.
You can codeall results at once by clicking on Apply Proposed Codes, and from there you
either select Apply All Codes, or you select one of the codes from the list.
Depending on the area you have selected at the beginning, either the sentence or the paragraph is coded.
NAMED ENTITY RECOGNITION (NER) 268
9.0.0.214 (15.12.2021) ATLAS.ti 9 Windows - User Manual
283.
The regular CodingDialogue is also available to add or remove codes.
The Search Engine Behind NER
ATLAS.ti uses spaCy as its natural language processing engine. More detailed information can be found here.
Input data gets processed in a pipeline - one step after the other as to improve upon the derived knowledge of the
prior step. Click here for further details.
The first step is a tokenizer to chunk a given text into meaningful parts and replace ellipses etc. For example, the
sentence:
“I should’ve known(didn’t back then).” will get tokenized to: “I should have known ( did not back then ).“
The tokenizer uses a vocabulary for each language to assign a vector to a word. This vector was pre-learned by
using a corpus and represents a kind of similarity in usage in the used corpus. Click here more information.
The next component is a tagger that assigns part-of-speech tags to every token and lexemes if the token is a
word. The character sequence “mine”, for instance, has quite different meanings depending on whether it is a
noun of a pronoun.
Thus, it is not just a list of words that is used as benchmark. Therefore, there is also no option to add your
own words to a list or to see the list of words that is used.
The entity recognizer is trained on wikipedia-like text and works best in grammatically correct, encyclopedia-like
text. We are using modified pre-trained/built-from-the-ground-up models - depending on the language.
NAMED ENTITY RECOGNITION (NER) 269
9.0.0.214 (15.12.2021) ATLAS.ti 9 Windows - User Manual
284.
Sentiment Analysis
Currently supportedlanguages are: English, German, Spanish and Portuguese
Sentiment analysis is the interpretation and classification of emotions (positive, negative and neutral) within text
data using text analysis techniques.
Application Examples
identifying and cataloguing a piece of text according to the tone conveyed by it.
understanding the social sentiment of a brand, product or service.
identifying respondent sentiment toward the subject matter that is discussed in online conversations and
feedback.
analysing student evaluations of lectures, seminars, or study programs.
Sentiment analysis works best on structured data like open-ended questions in a survey, evaluations,
online conversations, etc.
Carrying out a Sentiment Analysis
To open the tool, select the Search & Code tab and from there Sentiment Analysis.
inst
Select documents or document groups that you want to search and click Continue.
•
•
•
•
SENTIMENT ANALYSIS 270
9.0.0.214 (15.12.2021) ATLAS.ti 9 Windows - User Manual
285.
Select whether thebase unit for the search, and the later coding, should be paragraphs or
sentences, and which sentiment you want to search for.
inst
ATLAS.ti proposes code label for each sentiment: Positive / Neutral / Negative. If you want
to use different code names, you can change them here.
tip
Manage Models: If you want to improve your results, you can download and install a more
comprehensive model. Currently, it is available for German and English language texts.
More languages will be added in the future. The size of the German model is ~ 230 MB and
for the English model ~ 110 MB.
Click on Manage Models if you want to install or uninstall an extended model.
Click Continue to begin searching the selected documents. On the next screen, the search
results are presented, and you can review them.
The result page shows you a Quotation Reader indicating where the quotations are when coding the data with the
proposed code. If coding already exist at the quotation, it will also be shown.
SENTIMENT ANALYSIS 271
9.0.0.214 (15.12.2021) ATLAS.ti 9 Windows - User Manual
286.
By clicking onthe eye icon, you can change between small. medium and large previews.
inst
You can code all results with one of the the proposed codes or with all proposed codes at
once; or you can go through review each data segment and then code it by clicking on the
plus next to the code name.
inst
You can code all results at once by clicking Apply Proposed Codes, and from there you
either select Apply All Codes, or you select one of the codes from the list.
Depending on the area you have selected at the beginning, either the sentence or the paragraph is coded.
The regular Coding Dialogue is also available to add or remove codes.
The Search Engine Behind the Sentiment Analysis
We are using spaCy as our natural language processing engine. More detailed information can be found here.
SENTIMENT ANALYSIS 272
9.0.0.214 (15.12.2021) ATLAS.ti 9 Windows - User Manual
287.
Input data getsprocessed in a pipeline - one step after the other as to improve upon the derived knowledge of the
prior step. Click here for further details.
The first step is a tokenizer to chunk a given text into meaningful parts and replace ellipses etc. For example, the
sentence:
“I should’ve known(didn’t back then).” will get tokenized to: “I should have known ( did not back then ).“
The tokenizer uses a vocabulary for each language to assign a vector to a word. This vector was pre-learned by
using a corpus and represents a kind of similarity in usage in the used corpus. Click here more information.
The next component is a tagger that assigns part-of-speech tags to every token and lexemes if the token is a
word. The character sequence “mine”, for instance, has quite different meanings depending on whether it is a
noun of a pronoun.
Thus, it is not just a list of words that is used as benchmark. Therefore, there is also no option to add your
own words to a list or to see the list of words that is used.
The sentiment analysis pipeline is trained on a variety of texts ranging from social media discussions to peoples’
opinions on different subjects and products. We are using modified pre-trained/built-from-the-ground-up models
- depending on the language.
SENTIMENT ANALYSIS 273
9.0.0.214 (15.12.2021) ATLAS.ti 9 Windows - User Manual
288.
Quotation Reader
The QuotationReader allows you to conveniently read quotations coded by a selected code or as a result of a
query. You can modify existing codes, which means add or remove codes. Elsewhere, this has been referred to as
coding on.
In the Quotation Reader, you can:
change between single line, small and large preview
add or modify the quotation name
write a comment for a quotation
apply new or existing codes
remove applied codes
view a quotation in the context of the original document
delete a quotation
•
•
•
•
•
•
•
QUOTATION READER 274
9.0.0.214 (15.12.2021) ATLAS.ti 9 Windows - User Manual
289.
View Options: Dependingon the length of your quotations you can adjust the view mode. If you have very short
quotations, the single line view might be all what you need to see. It is also useful if you have created your own
name for quotations, e.g. to paraphrase textual data or wrote titles for multimedia quotations.
Apply Codes: To change the coding for a quotation, either click on Apply Codes in the ribbon or click on the green
code icon. This opens the coding dialogue, and you use all options that are explained in the section Coding Date.
You can also select multiple quotations and code them with a new or an existing code.
QUOTATION READER 275
9.0.0.214 (15.12.2021) ATLAS.ti 9 Windows - User Manual
290.
View in Context:If you want to see a quotation in the context of the original document, either click on the up
arrow, or the Go to Context button in the ribbon.
QUOTATION READER 276
9.0.0.214 (15.12.2021) ATLAS.ti 9 Windows - User Manual
291.
Rename: Select aquotation and click on Rename to add a name for the quotation or to modify a previously
entered name.
QUOTATION READER 277
9.0.0.214 (15.12.2021) ATLAS.ti 9 Windows - User Manual
292.
Open Network: Ifyou want to see all links of a quotation, select one or multiple quotations, right-click and select
Open Network, or select the Open Network button in the ribbon. See Working with Networks.
QUOTATION READER 278
9.0.0.214 (15.12.2021) ATLAS.ti 9 Windows - User Manual
293.
Select All: Thisoption allows you to quickly add or remove codes from all quotations, or to delete all quotations.
If you select all quotations and then the Apply Codes option, you can add a new code or select an existing one.
When you click on the + button, all quotations are coded with this code.
Writing Comments for Quotations
If you want to write a comment for a quotation, select it and write a comment in the
comment area at the bottom of the Quotation Reader window. Alternatively, right-click
and select Edit Comment from the context menu.
QUOTATION READER 279
9.0.0.214 (15.12.2021) ATLAS.ti 9 Windows - User Manual
294.
Creating a Report
Youcan export all or selected quotations from a Quotation Reader in Excel format. To do so, click on the Excel
button in the ribbon. Learn more about creating reports here.
QUOTATION READER 280
9.0.0.214 (15.12.2021) ATLAS.ti 9 Windows - User Manual
295.
Analyzing Focus Groups
Generally,it can be said that analyzing focus group data is not much different from the analysis of any other kind
of interview data. Most people who ask for specific analytic tools in focus groups do so because they don't have
experience with analyzing other kinds of qualitative data, so they think there must be something unique about
focus groups.
Focus groups are different to a certain extent as there is more interaction. In the vast majority of studies,
researchers are interested in the content of what gets said, rather than the mechanics of how it gets said.
If you are interested in the interaction, then a discourse analysis might be an appropriate method. In addition to
the regular tools you use in ATLAS.ti for data analysis, consider using hyperlinks to explore the interaction
Quotation Level and Hperlinks.
The most widely used analysis methods for interview as well as focus group data are versions of content analysis
and thematic analysis. For some inspiration, take a look at this chapter on focus group analysis.
ATLAS.ti facilitates the coding of speaker units, so that you can compare responses of different speakers or
different group of speakers by attributes like age, gender, etc.
In order for ATLAS.ti to recognize speakers, you need to use speaker IDs or names consistently when transcribing
the data. See Guidelines for Preparing Focus Group Data for more detail.
Focus group auto coding requires text documents in doc, docx, rtf, or txt format. You cannot use PDF
documents with this function.
ANALYZING FOCUS GROUPS 281
9.0.0.214 (15.12.2021) ATLAS.ti 9 Windows - User Manual
296.
Guidelines for PreparingFocus Group Data
There is only one requirement when preparing focus group data: Each speaker or needs to have a unique identifier
and this identifier should be applied consistently throughout the entire transcript.
ATLAS.ti offers two default patterns to recognize speakers:
name: (pattern 1)
@name: (pattern 2)
Using pattern 2 when transcribing data, it is unlikely that ATLAS.ti finds anything but speakers. Searching for
pattern 1, ATLAS.ti also finds things like "for example:....."
•
•
GUIDELINES FOR PREPARING FOCUS GROUP DATA 282
9.0.0.214 (15.12.2021) ATLAS.ti 9 Windows - User Manual
297.
Custom Pattern
You canalso define your own pattern including the use of regular expressions.
This might be useful if you have previously prepared transcripts and speaker IDs have not been used consistently.
For instance, the regular expression: To+(m|n) matches "Toom," "Ton," or "Toon" to find different spellings of the
name 'Tom'.
([A-Z]+): recognizes identifiers consisting of letters from A to Z.
([A-Z]+[0-9]+): recognizes identifiers that consist of a combination of letters and numbers
For more information, see Regular Expressions (GREP).
You can use this functionality to auto code any data that has a specific structure. It does not necessarily
have to be a speaker. It could be a date, a number, or any other type of identifier.
CUSTOM PATTERN 283
9.0.0.214 (15.12.2021) ATLAS.ti 9 Windows - User Manual
298.
Example transcripts
The speakerIDs do not have to be in bold letters. Bold letters are used here only to make it easier for you to see,
which ones are the speaker IDs.
Example A (pattern 1)
Alex: I don't know, I'm the sort, I don't really struggle to make friends cos everyone tells me I've got a big mouth,
and I don't stop talking [laughs]
Tom: So is that how, is that how you met just, just through you striking up a conversation?
Deb: I'm trying to think exactly [laughs] I think that's what it was, we were both in the same research methods
class ...
Example B (pattern 1)
Alex:
I don't know, I'm the sort, I don't really struggle to make friends cos everyone tells me I've got a big mouth, and I
don't stop talking [laughs] .
Tom:
So is that how, is that how you met just, just through you striking up a conversation?
Deb:
I'm trying to think exactly [laughs] I think that's what it was, we were both in the same research methods class.
Example C (pattern 1)
It is also possible to add further information to each speaker like their gender, age group, educational level
etc. This way, also this information will be automatically coded.
Alex: gender male: age group 1: education high school:
I don't know, I'm the sort, I don't really struggle to make friends cos everyone tells me I've got a big mouth, and I
don't stop talking [laughs]
Tom: gender male: age group 2: education high school:
So is that how, is that how you met just, just through you striking up a conversation?
EXAMPLE TRANSCRIPTS 284
9.0.0.214 (15.12.2021) ATLAS.ti 9 Windows - User Manual
299.
Deb: gender female:age group 2: education some college:
I'm trying to think exactly [laughs] I think that's what it was, we were both in the same research methods class.
Example D (pattern 2)
@Alex: I don't know, I'm the sort, I don't really struggle to make friends cos everyone tells me I've got a big mouth,
and I don't stop talking [laughs].
@Tom: So is that how, is that how you met just, just through you striking up a conversation?
@Deb: I'm trying to think exactly [laughs] I think that's what it was, we were both in the same research methods
class.
If your data is not transcribed yet, we recommend using pattern 2 as it is unlikely this pattern will find
sections that are not speaker units.
EXAMPLE TRANSCRIPTS 285
9.0.0.214 (15.12.2021) ATLAS.ti 9 Windows - User Manual
300.
Recommendation
For readability, youmay want to consider starting each speaker unit on a new line.
Additionally, you may want to enter an empty line between speaker units.
Both is not required. When a pattern is recognized the chosen code(s) are applied from the first letter of the
pattern to the start of the next recognized pattern. Therefore, it does not matter whether a new unit starts on a
new line or whether there is an empty line in between.
RECOMMENDATION 286
9.0.0.214 (15.12.2021) ATLAS.ti 9 Windows - User Manual
301.
Auto Coding FocusGroup Speakers
Focus group auto coding requires text documents in doc, docx, rtf, or txt format. You cannot use PDF
documents with this function.
Select a focus group transcript in the Document Manager and select Focus Group Coding
from the Documents ribbon.
Alternatively:
Right-click on a document in the Project Explorer and select Focus Group Coding from the
context menu.
Next, select a pattern for recognizing speaker units. See Preparing Focus Group Data.
AUTO CODING FOCUS GROUP SPEAKERS 287
9.0.0.214 (15.12.2021) ATLAS.ti 9 Windows - User Manual
302.
After selecting apattern, click Next.
ATLAS.ti lists all strings that fit the selected pattern and uses these as code name. If a
colon (:) was used also elsewhere in the transcripts, not all finds are speakers.
Deselect all finds that are not speakers, if any.
Check the suggested codes and modify the names if desired.
Add additional codes, if you want to code the speaker units with multiple codes. Each code
needs to by separated by a semicolon.
If you enter codes that already exist in your code list, they will not be duplicated.
Click on the button Code.
ATLAS.ti codes all speaker units. Once it is done, you see a summary screen.
Double-check the results in context and take a look at the Code Manager. ATLAS.ti also
creates a code group from all codes. If the results are not what you expected, you can undo
all coding at this stage.
AUTO CODING FOCUS GROUP SPEAKERS 288
9.0.0.214 (15.12.2021) ATLAS.ti 9 Windows - User Manual
303.
As coding allspeakers often result in dense coding, we recommend using this function after you have
coded the focus group transcript for content.
AUTO CODING FOCUS GROUP SPEAKERS 289
9.0.0.214 (15.12.2021) ATLAS.ti 9 Windows - User Manual
304.
Multimedia Data (Audio& Video)
When we refer to multimedia data, we mean audio and video files. The difference in terms of displaying auto or
video files is that there is no picture when working with audio files; the mouse clicks in handling audio files are the
same. Therefore, below we describe all steps for both file formats together. For illustration purposes, most figures
show video data.
Adding Multimedia Documents to a Project
As multimedia files, especially video files can be quite sizable, it is recommended to link multimedia files to a
project rather than to import them.
To link audio or video files to a project, in the Home tab click on the dropdown arrow of the
Add Documents button and select Add Linked Video/Audio.
Linked documents remain at their original location and ATLAS.ti accesses them from there. Preferably, these files
should not be moved to a different location. If the files need to be moved, you need to re-link the files to your
project. ATLAS.ti will alert you, if there is an issue, and a file can no longer be accessed. You find a Repair Link
option in the Document Manager under the Tools Tab.
MULTIMEDIA DATA (AUDIO & VIDEO) 290
9.0.0.214 (15.12.2021) ATLAS.ti 9 Windows - User Manual
305.
Display of MultimediaDocuments
Audio wave: On the right-hand side the audio wave is displayed. You can make is smaller or wider by positioning
your mouse on the left-hand side of the audio wave and dragging it either to the right-hand side or the left-hand
side.
Preview images: For video files, preview images are displayed in the document preview and the margin area. When
you add a new video to a project, you do not immediately see the preview images as they first need to be
generated. Depending on the length of the video this may take a few seconds or up to a few minutes.
Preview images are generated from key frames. A key frame is defined as one of the frames in a video, which
provides the best summary of the video content. The key frame rate is a variable that you can set in most
encoding software when creating the video file. A fast key frame rate (with a lower number on the scale, as this
refers to the interval between key frames) means that the video has more frames designated as key frames. A
slower key frame rate means that fewer frames are designated as key frames.
If you've got a typical talking head video or something else with little motion, you can get away with a slow key
frame rate. If you are shooting something with a lot of motion like a sporting event or a dance recital, a faster key
frame rate is necessary. The standard rate is to include a key frame every 5 seconds.
Playhead: The playhead shows the current position in the video or audio file.
MULTIMEDIA DATA (AUDIO & VIDEO) 291
9.0.0.214 (15.12.2021) ATLAS.ti 9 Windows - User Manual
306.
Document preview: Belowthe display area you see a preview of the entire document. You can use it to select the
area that should be displayed in the margin area.
Zoom: In most cases, the space from top to bottom of your computer screen will be too small to meaningfully
display your audio or video file, you can zoom the file. This is done in the full document preview section. For this
you use the two orange lines that you see to the right and left of the full preview. See Zooming the Time Line.
Media Controls
If you move the cursor inside the audio or video pane, the media controls appear, and you can start, stop and
pause the video, skip forward and backwards. You can also start and stop the multimedia file by pressing the
space bar.
From left to right:
Stop: Stops the multimedia file and set the play head to the beginning.
Skip to previous mark: Moves backward to the last mark, which could be the end or beginning of a selection or a
section, or the beginning of the file.
Skip backward: Seek backward in the multimedia file.
Play / Pause
Skip to previous mark: Moves forward to the next mark, which could be the end or beginning of a selection or a
section, or the end of the file.
Skip forward: Seek forward in the multimedia file.
Volume: On or Off
MULTIMEDIA DATA (AUDIO & VIDEO) 292
9.0.0.214 (15.12.2021) ATLAS.ti 9 Windows - User Manual
307.
Click the spacebar to stop and start an audio or video file.
Multimedia Toolbar
As soon as an audio or video file is loaded, the multimedia options will be displayed in the Document tab. If you
hoover over each button with the mouse, a screen tip is displayed explaining each option.
Capture Snapshot: If you want to analyze a particular frame in more detail, you can take a snapshot. If you click on
the snapshot option, the frame will be added as a new image document to your project.
Media Controls: See above.
Volume: Set the volume on slider between 0% (mute) and 100%
Playback Rate: If you want the video to play faster or slower, you can select a playback rate between 0,15 times
the original speed to 8 times the original speed. The current play back rate is shown in the blue status bar at the
bottom of the screen.
MULTIMEDIA DATA (AUDIO & VIDEO) 293
9.0.0.214 (15.12.2021) ATLAS.ti 9 Windows - User Manual
308.
Mark Position: Setsthe start position for a quotation. See Working with Multimedia Files.
Create Quotation: Sets the end position for a quotation and creates a quotation at the same time. See Working
with Multimedia Files.
You can also access the media controls with by right-clicking on the audio or video area.
MULTIMEDIA DATA (AUDIO & VIDEO) 294
9.0.0.214 (15.12.2021) ATLAS.ti 9 Windows - User Manual
309.
Handling Multimedia Data
Zoomingthe Time Line
A quick way to zoom the time line is by putting the mouse pointer onto the preview
images on the right-hand side or the margin area. Hold down the Ctrl-key and scrollthe
mouse wheel.
You can also zoom the timeline using the two orange sliders to select just the section of the audio or video you
want to see in the margin area:
When you move the mouse pointer over the full preview, two orange sliders appear. Move
the right and left slider to the desired position.
Media Controls
If you move the cursor inside the audio or video pane, the media controls appear, and you can start, stop and
pause the video, skip forward and backwards. You can also start and stop the multimedia file by pressing the
space bar.
From left to right:
Stop: Stops the multimedia file and set the play head to the beginning.
Skip to previous mark: Moves backward to the last mark, which could be the end or beginning of a selection or a
section, or the beginning of the file.
Skip backward: Seek backward in the multimedia file.
Play / Pause
Skip to previous mark: Moves forward to the next mark, which could be the end or beginning of a selection or a
section, or the end of the file.
Skip forward: Seek forward in the multimedia file.
Volume: On or Off
HANDLING MULTIMEDIA DATA 295
9.0.0.214 (15.12.2021) ATLAS.ti 9 Windows - User Manual
310.
Click the spacebar to stop and start an audio or video file.
Multimedia View Options
If a multimedia document is loaded, you find a number of additional options on the View tab of the contextual
document ribbon.
Position of the time line: The time line can be positioned at the bottom of the screen horizontally, or vertically
next to the audio wave form.
Audio waveform: You can show or hide the audio waveform or the video previews in both the margin or the zoom
line.
Auto-scroll: If 'auto-scroll margin' is activated the playhead remains in the middle of the screen and everything
else moves (preview images, audio wave form, margin). If 'auto-scroll margin' is deactivated, the playhead moves
from the top to the bottom of the screen. This is a lot smoother on your eye. But it means the playhead moves
outside of the visible area if you have zoomed the video. Which option is more useful depends on what you are
currently doing.
Use Arrow Keys to Navigate
Use the right and left arrow keys, to move the position of the playhead by 1/1000th
increments of the length of the video that is currently displayed in the margin area.
Use the right and left arrow keys + Ctrl, to move the position of the playhead by 1/20th
increments of the length of the video that is currently displayed in the margin area.
HANDLING MULTIMEDIA DATA 296
9.0.0.214 (15.12.2021) ATLAS.ti 9 Windows - User Manual
311.
Keyboard Shortcuts
Action KeyboardShortcut
Pause Play Space
Pause Play Media Play Pause
Pause Play F4
Play P
Play Shift+P
Play Play
Pause Pause
Stop S
Stop Shift+
Stop Media Stop
Skip Back Browser Back
Skip Back Media Previous Track
Skip Forward Browser Forward
Forward Command Media Next Track
Small Step Back Left
Small Step Forward Right
Medium Step Back Ctrl+Left
Medium Step Forward Ctrl+Right
Large Step Back PageUp
Large Step Forward PageDown
Playback Rate Normal Multiply
PlaybackRate Up Plus (+ key on main keyboard)
Playback Rate Up Plus (+ key on numeric keyboard)
Playback Rate Down Minus (- key on main keyboard)
Playback Rate Down Minus (- key on numeric keyboard)
Mark Quotation Start , or < (Depending on your keyboard)
Mark Quotation End + Create Quotation . or > (Depending on your keyboard)
HANDLING MULTIMEDIA DATA 297
9.0.0.214 (15.12.2021) ATLAS.ti 9 Windows - User Manual
312.
Working with MultimediaData
In this section, the following options are discussed:
Creating multimedia quotations
Creating multimedia quotations while listening to the audio file or viewing the video file
Display of multimedia quotations
Coding multimedia quotations
Activating and playing multimedia quotations
Adjusting the size of multimedia quotations
Renaming a multimedia quotation
Capturing video snapshots as image documents for further analysis
Creating Multimedia Quotations
You can also immediately code multimedia files. However, as especially video files contain so much more
information as compared to text, it is often easier to first go through and segment the audio or video file, i.e.
creating quotations before coding.
To create an audio or video quotation, move your mouse pointer on top of the audio
waveform and mark a section by clicking on the left mouse button where you want it to
start. Then drag the cursor to the end position. The times of the end and start positions
are shown, as well as the total length of the segment.
As soon as you let go of the mouse, a quotation is created, and you see the blue quotation boundary in the margin
area
If you want to make a selection first and then create a quotation, you can change the default settings. See
Project Preferences. If you deactivate Automatically create new quotation on selection, to create a
quotation you need to hoover with the mouse over the selection and click Create Quotation.
•
•
•
•
•
•
•
•
WORKING WITH MULTIMEDIA DATA 298
9.0.0.214 (15.12.2021) ATLAS.ti 9 Windows - User Manual
313.
Creating Multimedia Quotationswhile Listening / Watching
You can also create an audio or video quotation while listening to or viewing a document.
For this, you can use the buttons Mark Position and Create Quotation buttons in the
toolbar; or the short-cut keys (see below).
Using the Ribbon Buttons
inst
Play the video. If you find something interesting that you want to mark as a
quotation, click Mark Position. This set the start position. To set the end point and
create a quotation, click Create Quotation.
Continue listening / watching and setting quotations.
Using Short
To mark the start position: use (<) or (,)
To create a quotation: use (>) or (.)
WORKING WITH MULTIMEDIA DATA 299
9.0.0.214 (15.12.2021) ATLAS.ti 9 Windows - User Manual
314.
Which short-cut keyto use depends on your keyboard. Use those keys where you do not have to use Shift.
Play the video. If you find something interesting you want to mark as a quotation, click on
the (,) or the (<) key. This sets the start position.
To set the end position and create a quotation, click on the (.) or (>) key.
A new quotation will be listed in the Quotation Manager, the Project Explorer or Quotation Browser. The
quotation ID consists of the number of the document plus a consecutive count in chronological order by
time when a quotation was created in the document. The quotation ID 15:5 for examples means that this is
a quotation in document 15, and it was the 5th quotation that was created in the document.
After the ID you see the quotation reference, which is the start position of the audio or video quotation.
The name field is empty. You can for instance add a short title for each multimedia quotation, see below.
Depending on the media type, the quotation icon changes.
Audio and video quotations can be easily recognized by their special icon.
Coding Multimedia Quotations
Coding multimedia quotations is not different from coding text or image documents:
Right-click the quotation and select Apply Codes. For further information see: Coding Data.
Activating and Playing Multimedia Quotations
In the Margin Area
To play the quotation, double-click on the quotation bar, or hoover over the audio waveform
with the mouse and click on the play icon.
You can move the play-head with the mouse to any position within an audio or video file.
From other Places
You can double-click on a multimedia quotation in the Project Explorer, the Quotations Browser or the
Quotation Manager to play it in context.
You can preview a multimedia quotation in the preview area of the Quotation Manager.
You can preview a multimedia quotation if it is part of a hyperlink. See Working with Hyperlinks.
•
•
•
•
•
•
WORKING WITH MULTIMEDIA DATA 300
9.0.0.214 (15.12.2021) ATLAS.ti 9 Windows - User Manual
315.
Adjusting the Sizeof Multimedia Quotations
To adjust or change the length of the quotation, drag the start or end position to the
desired position.
Renaming a Multimedia Quotation
When you create audio or video quotation, the name field is empty. You can enter a name for instance to add a
short description of what the audio or video quotation is all about.
Right click on the quotation in the margin area or in the Quotation Manager and select the
Rename option. This allows you to create a meaningful text output of coded audio and
video segments.
Use the comment area to add further information, e.g. describe the segment and offer a
first interpretation
See also Making Use of Quotation Name and Comment for Analytical Purposes.
See Example Reports for an instruction on how to create reports for named and commented multimedia
quotations.
Capturing Snapshots of Video Frames as Image Documents
If you want to analyze particular frames of your video in more detail, you can capture a snapshot.
Move the play head to the desired position in the video.
Click on the camera icon in ribbon, or right-click on the video and select the option Capture
Video Frame.
The snapshot is automatically added as a new image document to your project. See
Creating Quotations im Images for further information on how to work with image files.
WORKING WITH MULTIMEDIA DATA 301
9.0.0.214 (15.12.2021) ATLAS.ti 9 Windows - User Manual
316.
Multimedia Preferences
Under File> Options, you can set project specific preferences for multimedia files:
Autopreview
The effect of Autopreview is that the audio or video quotation immediately starts to play when you activate or
open a function.
When selecting autopreview for documents the multimedia quotation immediately begins to play when
selecting a multimedia document in the Document Manager.
When selecting autopreview for quotations the multimedia quotation immediately begins to play when
selecting a multimedia document in the Quotation Manager.
When selecting autopreview for hyperlinks the multimedia quotation immediately begins to play when
activating a hyperlink.
Preferences for Creating Quotations
The default option is that a multimedia quotation is created as soon as you have made a selection on the audio
wave form. If you prefer to make a selection first before creating a quotation with an additional mouse click,
deactivate this option.
•
•
•
MULTIMEDIA PREFERENCES 302
9.0.0.214 (15.12.2021) ATLAS.ti 9 Windows - User Manual
317.
Memos and Comments
VideoTutorial: Using Memos at project begin
Video Tutorial: Using Memos for data analysis
Memos
"Memos and diagrams are more than just repositories of thoughts. They are working and living documents.
When an analyst sits down to write a memo or do a diagram, a certain degree of analysis occurs. The very act
of writing memos and doing diagrams forces the analyst to think about the data. And it is in thinking that
analysis occurs" (Corbin & Strauss: 118).
"Writing is thinking. It is natural to believe that you need to be clear in your mind what you are trying to
express first before you can write it down. However, most of the time, the opposite is true. You may think you
have a clear idea, but it is only when you write it down that you can be certain that you do (or sadly,
sometimes, that you do not)" (Gibbs, 2005).
As you see from the above quotes, memos is an important task in every phase of the qualitative analysis process.
Much of the analysis 'happens' when you write down your findings, not by clicking buttons in the software.
The ideas captured in memos are often the pieces of a puzzle that are later put together in the phase of report
writing.
Theory-building, often associated with building networks, also involves writing memos.
Memos in ATLAS.ti can be just a text on its own, or can be linked to other entities like quotations, codes, or other
memos.
Typical Usage of Memos
Memos can contain a project description
You can list all research questions in a memo.
You can use memos to write a research diary.
You can use one memo as to do list.
Memos can be used as a bulletin board to exchange information between team members.
You can store definitions, findings or theories from relevant literature in one or more memos.
You can write up your analysis using memos. Those memos will be the building blocks for your research
report.
•
•
•
•
•
•
•
MEMOS AND COMMENTS 303
9.0.0.214 (15.12.2021) ATLAS.ti 9 Windows - User Manual
318.
Memos can alsobe assigned as documents, if you want to code them. See Using Memos as Document .
Differences between Memos and Comments
From a methodological point of view comments are also memos in the sense that comments are also places for
thinking and writing.
In technical terms, in ATLAS.ti there is a distinction between comments and memos, as comments exclusively
belong to one entity. For example, the document comment is part of the document; a code comment belongs to a
particular code and is usually a definition for this code. A quotation comment contains notes or interpretations
about the quotation it belongs to.
Comments are not displayed in browsers separately from the entity to which they are attached.
Quotation comment
Code comment
MEMOS AND COMMENTS 304
9.0.0.214 (15.12.2021) ATLAS.ti 9 Windows - User Manual
319.
Memos
ATLAS.ti memos incomparison can be free-standing.
You can write a comment for a memo, for example: use this memo for section 2 in chapter 4 in my thesis.
Memos have a type attribute. This means you can label them as methodological memo, as theoretical
memo, organizational memo, and the like.
Memos can be linked to quotations, codes and other memos (see Grounded and Density column in the
Memo Manager).
Memos can be grouped.
•
•
•
•
MEMOS AND COMMENTS 305
9.0.0.214 (15.12.2021) ATLAS.ti 9 Windows - User Manual
320.
Typical Usage ofComments
Below some ideas are listed for what you can use comments:
Project comment
project description
Document comment
Meta information about a document: source, where and how you found or generated it
Interview protocols
Information about a respondent like gender, age, profession etc., are best handled by document groups.
There is no need to write this type of information into the comment field.
Quotation Comment
interpretations that only concern a specific data segment
ideas how a quotation might be related to another quotation
summaries for what you hear or see in the multimedia quotation
interpretations of image quotations
notes on a geo position
•
•
•
•
•
•
•
•
MEMOS AND COMMENTS 306
9.0.0.214 (15.12.2021) ATLAS.ti 9 Windows - User Manual
321.
Code Comment
first ideaswhat you mean by a code
a code definition
a coding rule, especially when working in a team
an example of what kind of data can be coded with this code
summary of coded segments
Memo Comment
note to yourself where you want to use the memo in a report
comments from supervisors or team members
links to or notes about relevant literature Network Comment
description of the network
idea how you want to develop it further
Link Comment
Explaining why the two entities are linked in a specific way.
Difference between Memos and Codes
Code names are (or should be) succinct, dense descriptors for concepts emerging during the stage of closely
studying the data. They often reduce complex findings to crisp placeholders and/or theoretically relevant
concepts.
Beginners often stuff lengthy treatises into a code name, blurring the distinction between codes, comments, and
memos and thereby mistaking codes for their more appropriate siblings.
If you find yourself using more than a few words as a code label, consider making use of the quotation name or
comment (see Working with Quotations, or write more extensive thoughts about a code as code comment.
Like codes, memos have names. These names, or titles, are used for displaying memos in browsers, and help to
find specific memos.
Just like code names, a memo's title should be short and concise. Don't confuse the name with its content! The
purpose is to fill the memo with content, which is a longer text that goes beyond just describing the memo title. If
all what you want to write in the memo fits into the title, use a quotation comment instead.
References
Corbin, Juliet and Strauss, Anselm (2008). Basics of Qualitative Research: Techniques and Procedures for
Developing Grounded Theory (3rd and 4th ed.). Thousand Oaks, CA: Sage.
Gibbs, Graham (2005). Writing as analysis. Online QDA.
•
•
•
•
•
•
•
•
•
•
•
MEMOS AND COMMENTS 307
9.0.0.214 (15.12.2021) ATLAS.ti 9 Windows - User Manual
322.
Working with Commentsand Memos
Writing a Comment
You find a field for writing comments in every Entity Manager.
To write a comment, select an item and type something in to the comment field. As soon
as you select another item, the comment is automatically saved.
inst
Changes can also explicitly be saved by clicking on the Save icon int the top right of the
text pane.
All items that have a comment display a yellow post-it within their icon.
If you want to add formatting,
click on the icon with the arrow in the top right-hand corner. This opens a text editor that
offers a number of formatting option.
Alternatively, you can right-click on any entity and select the Edit Comment option from the context menu and
write a comment for the selected entity.
Creating Memos
Memos can be created from the Home tab, or in the Memo Manager.
To create a memo from the Home tab
Click the drop-down menu for New Entities and select Free Memo.
Enter a name for the new memo and click Create.
Depending on your last settings, the memo editor may open as floating or docked window. If you want to change
between floated and docked windows, see Interface Navigation,
To create a memo in the Memo Manager
Open the Memo Manager and select Create Free Memo in the ribbon.
Enter a name for the new memo and click Create.
Begin to write your memo. When you are done, click the Save button and close the window.
WORKING WITH COMMENTS AND MEMOS 308
9.0.0.214 (15.12.2021) ATLAS.ti 9 Windows - User Manual
323.
Changing the MemoType
Memos can be organized, sorted and filtered by the type attribute.
Several standard memo types are offered by ATLAS.ti: commentary, memo and theory. You can add new types or
modify existing ones. The default type is memo.
To change the memo type or create a new one:
Select a memo in the Memo Manager and click on the Set Type button in the ribbon (or
select it from the context menu).
Select one of the existing types, or add a new one.
Click the Set Type.
Opening an Exis
You can access memos from everywhere: the Project Explorer, the Memo Manager, in the margin area if you linked
a memo to a quotation, or from within a network.
If you want to review or continue to work on a memo, just double-click the memo.
Link
Memos can be linked to quotations, codes and other memos. You can link memos per drag & drop basically
anywhere in the program, or visually in networks. See Linking Nodes. Below a few examples are given.
WORKING WITH COMMENTS AND MEMOS 309
9.0.0.214 (15.12.2021) ATLAS.ti 9 Windows - User Manual
324.
Linking Memos toQuotations
The following options are available:
Drag & Drop a memo from the Project Explorer or Memo Manager onto a highlighted quotation, or on a
quotation in the margin area. You can also drag the quotation to the memo.
Drag & Drop a memo from the Project Explorer or Memo Manager to a quotation in a result list (or vice
versa) in the query tool, the Code Document Table, Code Co-occurrence Table, or results from a project
search.
Drag & Drop a memo from the Project Explorer or the Memo Manager to a quotation in the Quotation
Manager (or vice versa).
Link a memo to a quotation (or vice versa) in a network. See Linking Nodes.
Reviewing Quotations Linked to a Memo
To review all quotations linked to a memo, hold down the Ctrl key + double-click. This
opens the Quotation Reader, and you can read all quotations that you have linked to the
memo.
warn
Do not drop a memo onto a code in the margin area. This action will replace the code with
the memo, which in most cases is not the wanted outcome.
Linking Memos
The following options are available:
Drag & Drop a memo from the memo branch in the Project Explorer or the Memo Manager to the code
branch in the Project Explorer (or vice versa).
Drag & Drop a memo from the Memo Manager to a code in the Code Manager (or vice versa).
Link a memo to a code (or vice versa) in a network. See Linking Nodes.
•
•
•
•
•
•
•
WORKING WITH COMMENTS AND MEMOS 310
9.0.0.214 (15.12.2021) ATLAS.ti 9 Windows - User Manual
325.
Linking Memos toMemos
The following options are available:
Drag & Drop a memo to another memo in the memo branch of the Project Explorer.
Drag & Drop a memo to another memo in the Memo Manager.
Link a memo to a memo in a network. See Linking Nodes.
Converting a Memo into a Document
As a lot of the analysis happens while you write memos, in some cases you may wish to convert a memo into a
document as secondary data so that you can code it.
Select a memo in the Memo Manager and click on the Convert to Document button in the
ribbon, or select it from the context menu. Alternatively, right-click on a memo in the
Project Explorer and select the option Convert to Document from the context menu.
The memo is then added to your list of documents.
You can continue to use the memo as memo. The memo comment is not transferred. It is treated independently
of the comment that you may want to write for the memo document.
•
•
•
WORKING WITH COMMENTS AND MEMOS 311
9.0.0.214 (15.12.2021) ATLAS.ti 9 Windows - User Manual
326.
Hyperlinks
Representing the Rhetoricof Data
A network based on text segments that are linked to each other is often referred to as a hypertext. The original
sequential text is de-linearized, broken down into pieces that are then reconnected, making it possible to traverse
from one piece of data to another piece of data regardless of their original positions.
As in ATLAS.ti, you cannot only work with text, this also applies to other data sources like images, audio, video or
geo data.
Cross-references between text passages are very common also in conventional media like books - just think of
religious and juridical texts, literature, journals etc. Footnotes and end notes are another common deviation from
the pure linearity of sequential text. However, in conventional media, not much navigational support is provided
for "traversing" between the pieces of data that reference each other.
This manual for example is a computer-related hypertext application that displays operational information in
suitable small chunks (compared to lengthy printed information), but with a considerable amount of linkage to
other pieces of information.
Another well-known hypermedia structure is the World Wide Web with its textual, graphical and other multimedia
information distributed world-wide.
What are the advantages of direct connections between text segments, compared to the traditional procedures of
qualitative text analysis?
What Codes Can't Do
The code & retrieve paradigm, which is so prevalent for many systems supporting the qualitative researcher, is not
adequate for certain types of analysis. In formal terms, attaching codes to chunks of data creates named sets of
segments with almost no internal structure. This is not to say that partitioning lots of text segments into sets is
not useful. On the contrary, classification leads to manageable amounts of segments that later can be retrieved
with the help of the attached code words. But this may not be the only way you want to look at your data.
The concept of hypertext introduces explicit relations between passages. These links have to be built manually
and result from an intellectual effort. The system cannot decide for you that segment x is in contradiction to
segment y. After the work of establishing the links, you can make semantically richer retrievals like: "Show
statements contrary to statement x." See Manager for Links and Analytic Functions of Networks. A code offers
fast access to sets of data segments that are similar, defined by a simple relation between them, namely
equivalence.
Hypertext allows you to create different paths through the data you are analyzing. For example, you may create a
time line different from the strict sequence of the original text.
Hyperlinks can express more differentiated relationships between quotations, for example:
statement A contradicts / supports / refers to statement B.
•
HYPERLINKS 312
9.0.0.214 (15.12.2021) ATLAS.ti 9 Windows - User Manual
327.
Image quotation Xin document 7 illustrates what has been said in quotation Y in document 12.
The data segment that you can relate to each other can be from the same or different documents.
Mapping Hyperlinks in Networks
ATLAS.ti incorporates procedures for creating and browsing hypertext structures. It allows for two or more
quotations being connected using named relations. See About Relations.
Further, you can create graphical maps - using Networks - to make parts of your hyperspace accessible easily.
Hyperlinks may connect quotations (textual, graphical, multimedia) across documents (inter-textual links) or may
link segments within the same document (intra-textual links). The natural boundary for hyperlinks, like all
structures in ATLAS.ti, is the project.
•
HYPERLINKS 313
9.0.0.214 (15.12.2021) ATLAS.ti 9 Windows - User Manual
328.
Creating Hyperlinks
A hyperlinkis a named linked between two quotations. If, for instance, you notice that one statement in a report
or interview is explaining a previous statement in a bit more detail, you can link the two using the relation
"explains." Or you may find a contradictory or supporting statement. These are just a few of the default relations
that come with the software. If they do not fit what you want to express, you can create user-defined relations in
the Relation Manager. See Creating New Relations.
ATLAS.ti offers a variety of options for creating and traversing hypertext links. Similar to the linking of codes, you
may create hyperlinks in the network editor. See Linking Nodes.
In addition, hypertext links can be created while you work with your documents. How this works is described
below.
Terminology
The start of a hyperlink is called source
The end of a hyperlink is called target.
When creating a hyperlink you first create the link source, next you select the link target and then you select the
relation that defines how these two quotations are linked.
Display of Hyperlinks
In the Margin Area
In the margin area, hyperlink labels show the quotation icon, the name of the relation, the quotation ID and the
first letters of the quotation name. The label is visualized as an arrow. Source links point to the right, target links
to the left.
In the Quotation Manager
All hyper-linked quotations can easily be recognized in the Quotation Manager. All source quotations are marked
with an opening angle bracket <, all target quotations with a closing bracket >. If a quotation is both, source and
target (as the case when creating chains), then both brackets are used as prefix <>.
Symbol Explanation
< Quotation is source of a hyperlink
> Quotation is target of a hyperlink
<> Quotation is both start and target, thus at least two other quotations are linked
•
•
CREATING HYPERLINKS 314
9.0.0.214 (15.12.2021) ATLAS.ti 9 Windows - User Manual
329.
Creating Hyperlinks ina Document
Open a document.
Select a data segment as source for the hyperlink. It can be an existing quotation, or a
highlighted section of your data. Right-click the highlighted document area and select the
option Create Link Source from the context menu.
If you select a data segment as source that was not yet a quotation, ATLAS.ti automatically creates a quotation
from it.
Select an existing quotation as target, or highlight a segment in your data, right click and
select the option Create Link Target.
The list of available relations opens up. Select a relation with a left-click. Now the hyperlink
is created.
CREATING HYPERLINKS 315
9.0.0.214 (15.12.2021) ATLAS.ti 9 Windows - User Manual
330.
If you selecta data segment as target that was not yet a quotation, ATLAS.ti automatically creates a quotation
from it.
If none of the existing relations fit, create a new relation in the Relation Manager. See Defining New Hyperlink
Relations.
After creating a hyperlink, you see the following in the margin area: the hyperlink label show the quotation icon,
the name of the relation, the quotation ID and the first letters of the quotation name. The label is visualized as an
arrow. Source links point to the right, target links to the left.
If you double-click on a hyperlink, the hyperlinked quotation is shown. You have the option to directly jump to the
linked quotation by clicking on the option Go to Quotation.
CREATING HYPERLINKS 316
9.0.0.214 (15.12.2021) ATLAS.ti 9 Windows - User Manual
331.
Creating Hyperlinks inthe Quotation Manager
This method can be applied to connect one or more existing quotations to one target quotation.
Select one or more source quotations in the Quotation Manager (multiple selections can be
done in the standard way).
Hold down the left mouse button and drag the quotation(s) to a target quotation in the
Quotation Manager.
Release the left mouse button. The relation menu opens, and you can specify the relation
to be used for the hyperlinks.
Creating Hyperlinks in the Margin Area
Creating hyperlinks in the margin area is suitable for connecting two quotations that are close to each other:
Select a quotation bar in the margin area.
Hold down the left mouse button and drag the bar onto another quotation bar.
Release the left mouse button. The relation menu opens. Select a relation.
Creating Hyperlinks across Documents
This is a good method if you want to create hyperlinks between two documents.
Load two documents side-by-side. This means you load two documents into different tab
groups. See Working With Tabs And Tab Groups .
Left-click a quotation bar in the margin area of one document and drag it to a quotation
bar in the margin area of the other document. Release the left mouse button, and select a
relation.
CREATING HYPERLINKS 317
9.0.0.214 (15.12.2021) ATLAS.ti 9 Windows - User Manual
332.
Working with Hyperlinks
TraversingHyperlinks
Traversing hyperlinks means you view or jump to the linked quotations. To do so:
Double-click on a hyperlink.
A window pops showing you the content of the linked quotation.
To view the content of the linked quotation, select the option Go to Quotation.
Alternatively, you can also use 'Ctrl + double-click' to immediately jump to a linked quotation.
Modifying Hyperlinks
You can modify existing hyperlinks, i.e. cutting a link, flipping (reversing) a link, or changing the relation at various
places.
In the Margin Area
In the margin area, you can unlink or change the direction of a hyperlink:
Right-click on a hyperlink in the margin area and select either the Unlink, or the Reverse
option from the context menu.
In the Hyperlin
In the Hyperlink Manager, you can unlink or change the direction of a hyperlink, or change the relation.
To open the Hyperlink Manager, go to the Home tab, and click on the Links button.
inst
By default the Link Manger shows the code-code links. To change to hyperlinks, click on the
Hyperlinks button on the right-hand side of the ribbon.
inst
To modify a hyperlink, select it, right-click and chose one of the following options: Cut, Flip
or Change Relation from the context menu.
See also Links Manager.
WORKING WITH HYPERLINKS 318
9.0.0.214 (15.12.2021) ATLAS.ti 9 Windows - User Manual
333.
Modifying Hyperlinks inthe Netwo
Open a network on a hyperlink, e.g. right-click and select Open Network from the context
menu, or click on the Open Network button in the ribbon. See Ad-hoc networks.
inst
In the network editor, right click on a link label and select one of the following options: Flip
Link, Cut Link or Change Relation from the context menu.
For more information see Linking Nodes.
Editing Hyperlink Comments
The links between quotations use fully qualified relations, like the links between codes. As a hyperlink is a "first-
class" entity, you can write a dedicated comment for each hyperlink.
Such a comment could explain why quotation A has been linked to quotation B. Link comments can be accessed,
displayed and edited from three locations: the margin area, the Hyperlink Manager and the Network Editor.
The margin area has the advantage that it is readily available during scrolling through the documents.
The network editor method offers a visual approach to accomplishing this goal.
Editing a Hyperlink Comment in the Margin Area
Right-click a hyperlink in the margin and select the option: Edit Hyperlink Comment.
Editing a Hyperlink Comment in the Hyperlin
Open the Hyperlink Manager.
inst
Select a hyperlink. Edit the comment in text pane below the link list.
Alternatively:
Right-click and select the Edit Comment option in the context menu, or click on the Editor
comment button in the ribbon to open a text editor.
WORKING WITH HYPERLINKS 319
9.0.0.214 (15.12.2021) ATLAS.ti 9 Windows - User Manual
334.
Editing a HyperlinkComment in
Open a network on a hyperlink, e.g. right-click and select Open Network from the context
menu, or click on the Open Network button in the ribbon. See also Ad-hoc networks.
inst
Move the mouse pointer to the link between two quotations, right-click and select Edit
Comment.
Creating New Relations for H
New relations can be defined in the Relation Manager. See Creating New Relations. The procedure for defining or
editing hyperlink relations is equivalent to defining or editing code-code relations.
WORKING WITH HYPERLINKS 320
9.0.0.214 (15.12.2021) ATLAS.ti 9 Windows - User Manual
335.
Querying Data
ATLAS.ti offersseveral tools that support you in querying your data:
Simple Boolean Retrieval.
See Retrieving Coded Data.
Code-Document Table
The Code Document Table is a cross-tabulation of codes or code groups by documents or document groups. It
shows how often a code (codes of a code group) has (have) been applied to a document or document group. See
Code Document Table.
Co-occurrence Analysis
Use the Code Co-occurrence Explorer to explore coded data to get a quick overview where there might be
interesting overlaps. If you are looking for specific co-occurrences and for accessing the quotations of co-occurring
codes, the Code Co-occurrence Table is the better choice. See Code Co-Occurrence Tools.
The Query Tool
The Query Tool finds quotations based on a combination of codes using Boolean, Proximity or Semantic operators.
Example: Show me all quotations where both Code A and Code B have been applied.
Such queries can also be combined with variables in form of documents or document groups. This means that you
can restrict a query to parts of your data like: Show me all quotations where both Code A and Code B have been
applied, but only for female respondents between the age of 21 and 30. See The Query Tool.
Smart Codes
Smart Codes are stored queries. They can be reused and always reflect the current state of coding, e.g. after more
coding has been done or after coding has been modified. They can also be used as part of other query, thus, you
can build complex queries step by step. See Working With Smart Codes.
QUERYING DATA 321
9.0.0.214 (15.12.2021) ATLAS.ti 9 Windows - User Manual
336.
Smart Groups
Like smartcodes, smart groups are stored queries based on groups. The purpose is to create groups on an
aggregate level. For instance, if you have groups for gender, age and location, you can create smart groups that
reflect a combination of these like all females from age group 1 living in city X. See Working With Smart Groups.
Global Filters
Global filters allow you to restrict searches across the entire project. If you set a document group as global filter,
the results in the Codes-Document or Code Co-occurrence Table will be calculated based on the data in the filter
and not for the entire project. Global filters effect all tools, windows, and networks. See Applying Global Filters For
Data Analysis.
QUERYING DATA 322
9.0.0.214 (15.12.2021) ATLAS.ti 9 Windows - User Manual
337.
Available Operators forQuerying Data
Knowing about the available operators is important when using the Code Co-occurrence Tools, the Query Tool,
when creating Smart Codes and Smart Groups. The following types of operators are available:
Boolean operators allow combinations of keywords according to set operations. They are the most common
operators used in information retrieval systems.
Semantic operators exploit the network structures that were built from the codes.
Proximity operators are used to analyze the spatial relations (e.g., distance, embeddedness, overlapping,
co-occurrence) between coded data segments.
Boolean Operators
Video Tutorial: Explaining Boolean Operators
OR, AND, ONE OF and NOT
OR, AND, and ONE OF are binary operators which need exactly two operands as input.
NOT needs only one operand.
Codes, code groups, or smart codes can be used as operands in a query.
AND: ALL of the following are true
The AND operator finds quotations that match ALL the conditions specified in the query. This means you have
applied two or more codes to the same quotation.
Example: All quotations coded with both Earth AND Fire . The AND operator is very selective and often produces
an empty result set as it requires that the selected codes have all been applied to exactly the same data segment.
It produces best results when combined with less restrictive operators or when the overall number of the available
text segments is large.
OR: ANY of the following are true
The OR operator does not really match the everyday usage of OR. Its meaning is At least one of..., including the
case where ALL conditions match. The OR operator retrieves all quotations that are coded with any of the codes
used in the expression.
Example: All quotations coded with Earth OR Fire will produce a result list that contains all quotations coded with
'Earth' and all quotations coded with 'Fire', or coded with both codes.
•
•
•
•
•
•
AVAILABLE OPERATORS FOR QUERYING DATA 323
9.0.0.214 (15.12.2021) ATLAS.ti 9 Windows - User Manual
338.
ONE OF: Exactlyone of the following is true
The ONE OF operator asks that EXACTLY one of the conditions must meet. It translates into the everyday either-
or.
Example: All quotations coded with EITHER 'code A' OR 'code B' (but not with both).
NOT: None of the following are true
The NOT operator tests for the absence of a condition. Technically, it subtracts the findings of the non-negated
term from all data segments available. Given 1000 quotations in the project and 20 quotations assigned to code
'code A', the query NOT Fire retrieves 980 quotations - those which are not coded with 'code A'. The operator can
be used with an arbitrary expression as in the argument NOT ('code A' OR 'code B') which is the equivalent of
neither 'code A' nor 'code B'.
Proximity Operators
Video Tutorial: Proximity Operators and Example Queries
Proximity describes the spatial relation< between quotations. Quotations can be embedded in one another,
one may follow another, etc. The operators in this section exploit these relationships. They require two
operands as their arguments.
Proximity operators differ from the other operators in one important aspect: Proximity operators are non-
commutative. This property makes their usage a little more difficult to learn.
Non-commutativity requires a certain input sequence for the operands. While A OR B is equal to B OR A, this does
not hold for any of the proximity operators: A FOLLOWS B is not equal to B FOLLOWS A. When building a query,
always enter the expressions in the order in which they appear in their natural language manifestation.
Another important characteristic for these operators when using the query tool is the specification of the operand
for which you want the quotations retrieved. A WITHIN B specifies the constraint, but you must also specify if you
want the quotations for the As or the Bs. This is done implicitly by the sequence.
If you enter the query 'A WITHIN B', all quotations coded with A are retrieved. If you enter B WITHIN A, all
quotations coded with B are retrieved. For example, if you want to retrieve all segments in a focus group transcript
where '@speaker: Tom' talks about 'holiday experience' you enter: 'holiday experience' WITHIN '@speaker: Tom' If
you enter: '@speaker: Tom' WITHIN 'holiday experience' You probably don't find anything, as the code '@speaker:
Tom' codes the speaker unit and anything he said is embedded within the speaker unit. If you enter: '@speaker:
Tom' ENCLOSES 'holiday experience' ATLAS.ti retrieves all speaker units of Tom where he talks about holiday
experiences, thus the larger segments that contain something about the holiday experience.
AVAILABLE OPERATORS FOR QUERYING DATA 324
9.0.0.214 (15.12.2021) ATLAS.ti 9 Windows - User Manual
339.
In the QueryTool, you need to enter the code whose content you are most interested in on the right-hand
side of the query. * Quotations enclosing quotations: A ENCLOSES B retrieves all quotations coded with A
that contain quotations coded with B.
Quotations being enclosed by quotations: A being enclosed by B (WITHIN) retrieves all quotations coded
with A that are contained within data segments coded with B.
Overlaps (quotation overlapping at start): A OVERLAPS B retrieves all quotations coded with A that
overlap quotations coded with B
Overlapped by (quotations overlapping at the end): A OVERLAPPED BY B retrieves all quotations coded
with A that are overlapped by quotations coded with B.
Co-Occurs: Often when interested in the relation between two or more codes, you don't really care whether
something overlaps or is overlapped by, or is within or encloses. It this is the case, you simply use the Co-
occurs operator.
Co-occur is essentially a short-cut for a combination of the four proximity operators discussed above, plus the
operator AND. AND is a Boolean operator, but also finds co-occurrence, namely all coded segments that overlap
100%.
The more general co-occurrence operator is quite useful when working with transcripts. In interviews,
people often jump back and forth in time or between contexts, and therefore it often does not make much
sense to use the very specific embedding or overlap operators. With other types of data they are however
quite useful. Think of video data where it might be important whether action A was already going on
before action B started or vice versa. Or if you have coded longer sections in your data like biographical
time periods in a person's life and then did some more fine-grained coding within these time periods. Then
the WITHIN operator comes in very handy. The same applies when working with pre-coded survey or focus
group data. Using WITHIN, you can for instance find all data segments coded with 'topic x' WITHIN
'question 5'; or all data segments coded with 'code A' WITHIN 'speaker unit: Tom'.
Semantic Operators
The operators in this section exploit code-code links that have been previously established by linking codes via
drag-and-drop in the Code Manager, or in a network. See Linking Nodes. While Boolean-based queries are
extensional and simply enumerate the elements of combined sets (e.g., Love OR Kindness), semantic operators
are intentional, as they already capture some meaning expressed in appropriately linked concepts.
Only transitive code-code relations are processed when using semantic operators. See About Relations.
The UP operator looks at all directly linked codes, and their quotations at higher levels - all parents of a
code.
The DOWN operator traverses the network from higher to lower concepts, collecting all quotations from
any of the sub codes.
•
•
•
•
•
•
AVAILABLE OPERATORS FOR QUERYING DATA 325
9.0.0.214 (15.12.2021) ATLAS.ti 9 Windows - User Manual
340.
The SIBLING operatorfinds all quotations that are connected to the selected code or any other
descendants of the same parent code.
•
AVAILABLE OPERATORS FOR QUERYING DATA 326
9.0.0.214 (15.12.2021) ATLAS.ti 9 Windows - User Manual
341.
Code-Document Table
You canuse the Code-Document Table for within and across documents or group comparisons by relating codes or
code groups and documents or document groups to each other.
The table cells contain:
frequency count of the number of codings. This can be different from the number of quotations, if a
quotation is coded by multiple codes. Counted is each link between a code and a quotation.
word count of the quotations coded by the selected code or code group.
Running an Analysis in the Code-Document Table
In the Home ribbon, select the Analyze tab and from there the Code Document Table.
Select codes or code groups for the table rows. The selected codes / code groups are added
to the table.
Select documents or document groups for the table columns. The selected documents /
document groups are added to the table.
How to make selections: To select an item, you need to click the check-box in front of it. It is also possible
to select multiple items via the standard selection techniques using the Ctrl or Shift-key. After
highlighting multiple items, push the space bar to activate the check boxes of all selected items, or right
click and chose Check Selected.
•
•
CODE-DOCUMENT TABLE 327
9.0.0.214 (15.12.2021) ATLAS.ti 9 Windows - User Manual
342.
How to readthe table
By default, the codes / code groups are displayed in the left column, and the documents / document groups in the
top row.
Left column
Next to each code, the number indicates how often the code is applied in the entire project.
Next to a code group, you see two numbers: The first one tells you how many codes are in the group, the
second numbers gives you the number of codings. This is different from the number of quotations, as
multiple codes from the same code group could be linked to the same quotation.
Top row
Below a document, you see the total number of quotations in each document.
Below a document group, you see two numbers: the first one tells you how many documents are in the
document group, and the second number gives you the number of quotations for all documents in the
group.
The additional information you get for each selected row or column item allows you to better evaluate the
numbers inside the table cells. If the value in the table cell is 10, but the code overall was applied 100
times, this leads to a different interpretation as if the code was only applied 12 times in the entire project.
Table cells
The results in the table cells show how often each selected code was (or the codes of a code group were)
applied in each document or document group. Counted are the number of codings, unless you select to
count words (see options).
If you click on a cell in the table, the quotation content is shown in the Quotation Reader on the left-hand
side.
Below the table a Sankey Diagram is shown. You can see both at the same time, or view either the table or
the Sankey Diagram. See below.
Code-Document Table Options
Show Lists: If you only want to see the table and not the selection lists, deactivate this option. This is useful of
you have a small screen.
Show Table / Show Sankey diagram: You can display both the table and the Sankey Diagram, or only the table or
the Sankey diagram.
•
•
•
•
•
•
•
CODE-DOCUMENT TABLE 328
9.0.0.214 (15.12.2021) ATLAS.ti 9 Windows - User Manual
343.
Colors: You canchoose among three colors for the table cells (blue, red and green), a color map, and no coloring. If
you select a color or the color map, the table cells are colored in different shades.
Refresh: If you make modifications to your codings while the table is open, you can click the Refresh option to
update the results.
Row Totals: Display the row total table (default).
Column Totals: Display the column total in the table (default).
Normalize: If documents are of unequal length, or document groups of unequal size, the absolute frequencies
might be misleading as a measure of comparison. Indicative are the total number of quotations in a document or
document group (see first row).
If you normalize the data the number of codings are adjusted. As benchmark, the document / document group
column or row with the highest total is used. For example, if you compare two documents, and the total number
of codings for the first document is 100 and for the second document it is 50, then all codings of the second
document are multiplied by 100/50 = 2. See Code Document Table: Normalizing Data.
Binarize: This option reduces all cell values to 0 and 1. It shows whether a code, or codes of a code group, occur or
do not occur in a document, or a document group. If they occur a black dot is shown; if not, the cell is empty. This
makes it easier to identify patterns in the data.
When you export the table to Excel, the dots are turned into 1s and the empty cells into 0s. This allows, for
example, a discriminant analysis to be carried out in a statistical program.
Absolute Frequencies: The table cells show the number of codings. This is the number of times a code is linked to
a quotation. For single codes the number of codings is the same as the number of quotations, but for code groups
it can differ if codes that are in the same code group have been applied to the same quotation.
CODE-DOCUMENT TABLE 329
9.0.0.214 (15.12.2021) ATLAS.ti 9 Windows - User Manual
344.
Relative Frequencies:
Column Rel.-Frequencies:The table cells show relative frequencies based on the column cells. The total of
each column will add up to 100%.
Row Rel.-Frequencies: The table cells show relative frequencies based on the row cells. The total of each
row will add up to 100%.
Table Rel.-Frequencies: Display relative frequencies based on all codes used in the table. The totals of all
row and column codes will add up to 100%.
Count Codings: Count the number of times a code has been applied to a quotation. Please note, the number of
codings can be higher than the number of quotations if code groups are used as you can apply multiple codes to
one quotation.
Count Words: Count the words of the quotations coded by the selected code, or the codes of the selected code
group.
Compress: This is a quick way to remove all rows or columns that only show empty cells. This is the same as
manually deactivating codes or documents that yield no results. Thus, you cannot "uncompress" a table.
Codes as Rows: Display all selected codes / code groups in the rows of the table.
Codes as Columns: Display all selected codes / code groups in the columns of the table.
Details: You can deactivate the quotation count that is shown after each code/code group, or below each
document / document group.
Export: You can export the table to Excel.
•
•
•
CODE-DOCUMENT TABLE 330
9.0.0.214 (15.12.2021) ATLAS.ti 9 Windows - User Manual
345.
View Tab
Show Lists:If you only want to see the table and not the selection lists, deactivate this option.
Refresh: If you make modifications to your codings while the table is open, you can click the Refresh option to
update the results.
Autosize Columns: Adjust the size of the columns automatically so that the full label is shown.
Freeze first Column: Set if you do not want the auto size option to affect the first column.
Set Column Size: You can manually set the column size. 100 means that the column is as wide as the full label.
CODE-DOCUMENT TABLE 331
9.0.0.214 (15.12.2021) ATLAS.ti 9 Windows - User Manual
346.
Code-Document Table: RelativeFrequencies
Relative frequencies are useful for comparing code distributions across or within documents or document groups,
as percentages are easier to comprehend.
If documents are of unequal length, or if document groups have an unequal number of members, it is
recommended to normalize the counts as absolute counts may distort the results. See Data
Normalization.
Within Group Comparison: Column Relative Frequencies
The table shows data from a survey with open-ended questions where people evaluate the computer game
Minecraft. You can download the project here. Three groups are compared, parents who do not play the game
themselves, parents who play and others who play, but are not parents. You must read this table from top to
bottom along the columns. It shows the distribution of the selected codes within the three document groups. A
quick glance of the heat map indicates that people who play (parents or others) mention more benefits than
parents who do not play. The latter group appears more concerned with the downsides of playing a computer
game, especially with the social and emotional dangers. Players mention very few downsides.
Whether you need to select row or column relative frequencies depends on which way around the table is
displayed. If documents/document groups are listed as rows and the codes as columns, you use row
relative frequencies for a within group comparison.
Across Group Comparisons: Row Relative Frequencies
EXAMPLE WITH NORMALIZATION
CODE-DOCUMENT TABLE: RELATIVE FREQUENCIES 332
9.0.0.214 (15.12.2021) ATLAS.ti 9 Windows - User Manual
347.
In the followingexample, from the Children & Happiness Ssample project Document 3 is about twice as long as
document 5. Thus, the number of codings regarding a specific topic can be expected to be higher in document 3. If
we compare how often positive and negative effects of parenting were mentioned in both documents,
normalizing the data will give a more accurate picture.
Looking at the data without normalization it looks like that the readers of the NYTM article mention much fewer
positive and negative effects of parenting. After normalization, this interpretation needs to be adjusted. The
reader of the NYTM article mentioned more negative effects of parenting as compared to the readers of parenting
blog (55% as compared to 45%) and only slightly less positive effects (47% as compared to 53%).
Total Relative Frequencies
If you select total relative frequencies, the calculation is based on the total number of codings of all selected codes
in the table.
In the example below, these are 178. When comparing how much readers of the parenting blog and the NYTM
article have written about reason for having and not having children, then the distribution is as follows:
readers of the parenting blog have given 68 / 178 = 60% of the reasons for having children and 32% of the
reasons for not having children
readers of the NYTM article have contributed 44% of the reasons for having children and 44% of the
reasons for not having children (the data have been normalized). Thus, comparatively, the readers of the
NYTM articles have given quite a bit more reasons for not having children, which fits the results reported
above that they also wrote more about negative effects of parenting.
You can display all values: absolute frequencies and all relative frequencies in one table by selecting all
options. It depends on the purpose for which you want to use the table. For interpreting the data, it is
probably easier if you look at each of the relative frequency counts separately. For a comprehensive report
for an appendix, you may want to export the table with all options included.
•
•
CODE-DOCUMENT TABLE: RELATIVE FREQUENCIES 333
9.0.0.214 (15.12.2021) ATLAS.ti 9 Windows - User Manual
348.
Code-Document Table: Normalization
Ifdocuments are of unequal length, or document groups of unequal size, the absolute frequencies might be
misleading as a measure of comparison. If you conduct interviews, and some interviews are only half an hour long
and others 2 hours, the chance someone talks about certain issues and how often during the interview is higher in
the long interviews. Thus, if you were to compare absolute numbers, the results might just reflect the different
durations of the interviews. The same applies if you analyse reports. If one report is 25 pages long and another 100
and the full reports are coded, absolute frequencies are not a valid measure for comparison. The total number of
quotations in a document, or a group of documents (see first row) can help you to decide whether normalization of
the data is appropriate.
If you normalize the data the number of codings are adjusted. As benchmark, the document / document group
column or row with the highest total is used. For example, if the total number of codings for a document is 100
and for another document it is 50, then all codings of the second document are multiplied by 100/50 = 2.
As normalization often results in uneven numbers, it is useful to work with relative rather than absolute
frequencies. See Relative Frequencies.
CODE-DOCUMENT TABLE: NORMALIZATION 334
9.0.0.214 (15.12.2021) ATLAS.ti 9 Windows - User Manual
349.
Binarize the Resultsof a Code-Document Table
At times, you might only be interested to see whether a code occurs in a document or not.
To activate this option, click Binarize in the ribbon of the Code Document Table.
The table will show black dots if a code or codes from a code group have been applied to a
document or document group. If it has not been applied, the cell is empty.
The row and column totals count the number of yes / no occurrences. Such a table can for instance be used for
discriminant analysis in a statistical program.
If you export the table to Excel, the Excel table shows 1s and 0s. This allows, for example, a discriminant analysis
to be carried out in a statistical program.
BINARIZE THE RESULTS OF A CODE-DOCUMENT TABLE 335
9.0.0.214 (15.12.2021) ATLAS.ti 9 Windows - User Manual
350.
Visualizing the Code-DocumentTable: Sankey Diagram
Data Visualization is a great way to simplify the complexity of understanding relationships among data. The
Sankey Diagram is one such powerful technique to visualize the association of data elements. Originally, Sankey
diagrams were named after Irish Captain Matthew Henry Phineas Riall Sankey, who used this type of diagram in
1898 in a classic figure showing the energy efficiency of a steam engine. Today, Sankey diagrams are used for
presenting data flows and data connections across various disciplines.
Video Tutorial: Sankey Diagrams in ATLAS.ti Windows
Sankey diagrams allow you to show complex processes visually, with a focus on a single aspect or resource
that you want to highlight.
They offer the added benefit of supporting multiple viewing levels. Viewers can get a high level view, see
specific details, or generate interactive views.
Sankey diagrams make dominant factors stand out, and they help you to see the relative magnitudes and/
or areas with the largest contributions.
In ATLAS.ti, the Sankey diagram complements the Code Document Table. As soon as you create a table, a Sankey
diagram visualizing the data will be shown below the table.
•
•
•
VISUALIZING THE CODE-DOCUMENT TABLE: SANKEY DIAGRAM 336
9.0.0.214 (15.12.2021) ATLAS.ti 9 Windows - User Manual
351.
The row andcolumn entities of the table are represented in the Sankey model as nodes and edges, showing the
flow between each pair of nodes. In the Code Document table, the connecting pairs can consist of:
codes - documents
codes - document groups
code groups - documents
code groups - document groups
For each table cell containing a value, an edge is displayed between the diagram nodes. The thickness of the edges
resemble the cell values of the table. Cells with value 0 are not displayed in the Sankey view.
The key to reading and interpreting Sankey Diagrams is to remember that the width is proportional to the
quantity represented.
If you only want to see the table, or the Sankey diagram:
You can select what you want to see by making a selection in the ribbon at the top left-
hand side. If you need more space on your screen for the diagram, you can deactivate the
selection lists under the View tab.
Layout
The Sankey diagram, similar to the network editor, applies a layout for its nodes and consequently to the edges
connecting nodes to create an easy to comprehend visualization of the data. This basic layout places the selected
entities (nodes in Sankey terminology) into vertical „layers“ with the row entities placed to the left and the column
entities to the right. If nodes have incoming as well as outgoing links in the currently visible set of nodes, they will
be placed in intermediate lanes or layers. In many situations, the initial layout already meets the researchers
requirements. However, there are some options to modify the initial layout.
Swapping columns and rows for the table will also affect the Sankey diagram and result in a 180° rotation.
•
•
•
•
VISUALIZING THE CODE-DOCUMENT TABLE: SANKEY DIAGRAM 337
9.0.0.214 (15.12.2021) ATLAS.ti 9 Windows - User Manual
352.
Interactivity
To display thequotations represented by the link between two edges, click on the connecting edge. This
has the same effect as clicking a table cell. You see the quotations displayed in the Quotation Reader to the
right.
The label of the edges show the numbers that you also see in the table cells, which are by default the
number of codings in the document or document group.
To support finding the correct link, moving the mouse highlights the hovered edges. After selecting an
edge, the unselected edges are dimmed to further increase the visibility of the edge under consideration.
Selecting a node will highlight this node as well as all its incoming and outgoing edges. This makes it easy
to spot areas of connectivity.
You can also use the nodes label for selection, differing only by doing a „single-handed“ multi-selection
which otherwise would require pressing the Ctrl-key.
Removing edges
To unscramble a potentially cluttered diagram, you can remove selected nodes or edges by
pressing the Delete key on your keyboard. You can undo this via Ctrl-Z.
The same may be accomplished by modifying the selection lists, but this is a bit „heavier“, and it may not be clear
which entities need to be deselected.
Fit to Window
When the Sankey diagram is created (concurrently with the respective tools’ table) it may display a bit too tiny in
its reserved window pane. There are several options to fix this: Switch off the table view and the selection lists,
maximize the project window or float the tool with the diagram. The Sankey diagram itself will not resize to the
freed space automatically. Click button Fit-to Window to fit the current diagram to the available window area.
Refresh Layout
This will also move nodes to their original places if moved in the meantime. The edges will also be recalculated for
best entanglement. This option can also be activated by double clicking the diagrams background.
•
•
•
•
•
VISUALIZING THE CODE-DOCUMENT TABLE: SANKEY DIAGRAM 338
9.0.0.214 (15.12.2021) ATLAS.ti 9 Windows - User Manual
353.
Auto Layout
This optionis activated by default. It will instantly recompute the diagram’s layout if:
Nodes are moved
Nodes are removed
Edges are removed
Respect Node Placement
You might not always be happy when the nodes you shifted to other locations are instantly moved back to their
original locations. To prevent this, you either need to disable the Auto Layout or select Respect Node Placement.
Note, that the Respect Node Placement option will not let you place nodes to arbitrary positions but will
find a nearest lane and relayout the diagram to make it nice looking again.
Shortcut: Double click the diagram background while pressing the left Shift key.
Rotate Diagram
Sometimes the horizontal left-to-right layout may not always give the most optimal visualization of your data
(depending on available screen space, monitor size). Click this button to toggle between a vertical (top-down) and
the original horizontal layout.
Shortcut: Double click the diagram background while pressing the left Ctrl key.
Display Icons
This display the entities type icons preceding the labels. This makes most sense when the diagram contains
multiple types of entities as in the Code Document Table. By default, this option is not activated.
Link Color Mode
The coloring of the links and edges between the nodes can be set to:
Use the color of the source node (either the user provided color for codes, or the type dependent color of
other entities.
Use the color of the target node
•
•
•
•
•
VISUALIZING THE CODE-DOCUMENT TABLE: SANKEY DIAGRAM 339
9.0.0.214 (15.12.2021) ATLAS.ti 9 Windows - User Manual
354.
Use a colorgradient starting with the source and ending with the target color. This is the default. It makes
tracking the endpoint of an edge quite comfortable. Shortcut: Double click the diagram background while
pressing the left Alt key.
Use a gray shade independent of any node coloring.
Shortcut: Double click the diagram background while pressing the left Alt key.
Dark / Light Background
This toggles a light and a dark background, just for aesthetics.
Shortcut: Double click the diagram background while pressing the left Ctrl and Shift key.
Print Diagram
Creates an output of the current diagram respecting both the selected background, and the visual selection state
of both nodes and edges. The printout will not contain any quotations. Printing can also create high quality PDFs if
an appropriate printer driver is installed.
Miscellaneous
The diagram is integrated into the table tools and responds to certain options:
Compress, that is removing empty rows or columns, will remove corresponding elements in the diagram.
Clustering can reduce the number of co-occurrences and thus influences the size of the edges in the
diagram.
Swapping rows and columns reverts the original layout by 180°.
Useful Links
Using sankey diagrams to tell a story with data
Visualizing customer journey with sankey diagram
A sankey diagram says more than a 1000 pie charts
What, Why and How of sankey diagrams
Using colors effectively in sankey diagrams
•
•
•
•
•
•
•
•
•
•
VISUALIZING THE CODE-DOCUMENT TABLE: SANKEY DIAGRAM 340
9.0.0.214 (15.12.2021) ATLAS.ti 9 Windows - User Manual
355.
Code Co-Occurrence Tools
Theco-occurrence tools search for codes that have been applied either to the same quotation or to overlapping
quotations. Using these tools you can find out which topics are mentioned together or close to each other.
The co-occur operator is a combination of the WITHIN, ENCLOSES, OVERLAPS, OVERLAPPED BY and the AND
operator. By default, the table searches for all co-occurrence, but you can also ask more specifically only for AND
occurrences. An 'AND' occurrence means that two codes code exactly the same quotation. See available operators
for further information.
The results depend on how you have coded the data. If you want to examine the proximity of certain issues, then
you have to code overlapping segments, or create one quotation and apply multiple codes.
If issues that you want to code occur very close to each other in the data, the recommendation is to create
one quotation and apply two or more codes to it. If these issues are spread over a long paragraph or
section, the recommendation is to create multiple overlapping quotations so that the precision of coding is
higher.
Code Co-occurrences can be displayed in a tree view, see Code Co-Occurrence Explorer, or as a data matrix, see
Code Co-Occurrence Table.
The Explorer in addition to code co-occurrences also displays documents and their codes.
CODE CO-OCCURRENCE TOOLS 341
9.0.0.214 (15.12.2021) ATLAS.ti 9 Windows - User Manual
356.
The Code Co-OccurrenceExplorer
Use the Code Co-occurrence Explorer to explore coded data to get a quick overview where there might be
interesting overlaps. If you are looking for specific co-occurrences and for accessing the quotations of co-
occurring codes, the Code Co-occurrence Table is the better choice.
To open the tool, select the Analyze tab and click Co-oc Explorer.
The Code Co-occurrence Explorer can also be loaded from the Home tab into the navigator
on the left hand side by clicking on the drop-down arrow of the Navigator button.
inst
Open the branches by clicking on the arrow in front the root for Codes. Or, right click and
select one of the Expand options.
On the first level all codes are listed. If you expand the tree further, you see all co-occurring codes. On the third
level, you can access the quotations of the co-occurring codes.
If you double-click on a quotation, it is displayed in the context of the document.
THE CODE CO-OCCURRENCE EXPLORER 342
9.0.0.214 (15.12.2021) ATLAS.ti 9 Windows - User Manual
357.
The Document Tree
Thedocument tree shows all codes that have been applied to a document. If you expand the tree further, you see
the quotation coded by these codes.
THE CODE CO-OCCURRENCE EXPLORER 343
9.0.0.214 (15.12.2021) ATLAS.ti 9 Windows - User Manual
358.
The Code Co-OccurrenceTable
The Co-occurrence Table in comparison to the Code Co-occurrence Explorer shows the frequencies of co-occurrence
in form of a matrix similar to a correlation matrix that you may know from statistical software.
To open the tool, select the Analyze tab and click Co-Oc Table.
Next you need to select the codes that you want to relate to each other:
Select codes from the first list for the table columns, and codes from the second list for the
table rows. To select an item, you need to click the check-box in front of it. It is also
possible to select multiple items via the standard selection techniques using the cmd or
shift-key. After highlighting multiple items, push the space bar to activate the checkboxes
of all selected items.
Another option is to right-click and chose Check Selected from the context menu. Other options are:
THE CODE CO-OCCURRENCE TABLE 344
9.0.0.214 (15.12.2021) ATLAS.ti 9 Windows - User Manual
359.
How to Readthe Table
First column / first row: The number below and behind each code shows how often the code is applied in
the entire project. This helps you to better evaluate the number of co-occurrences in the table cells.
The number in the cell indicates the number of hits, how often the two code co-occur. This means that the
number of co-occurring 'events' and not the number of quotations are counted. If a single quotation is
coded by two codes or if two overlapping quotations are coded by two codes, this counts in both cases as a
single co-occurrence.
If you click on a cell, the quotations of the corresponding row and column codes are displayed next to the
table in the Quotation Reader.
Below the table, the Sankey Diagram is shown. You can view both at the same time or deselect either the
table or the Sankey Diagram in the ribbon.
If the Show Coefficient option is activated, you see an additional number ranging between 0 and 1 that
indicates the strength of the relation between a pair of codes. You see...
a yellow dot in the top right of a cell, if the ratio between the codes frequencies exceeds a threshold
of 5. See Distortion due to unequal frequencies.
a red dot, if the C-index exceeds the 0 - 1 range. See Out of Range.
an orange dot is simply a mixture of the red and yellow conditions.
The quotation reader always displays two lists of quotations: the quotations of the column code, and the
quotations of the row code.
•
•
•
•
•
◦
◦
◦
THE CODE CO-OCCURRENCE TABLE 345
9.0.0.214 (15.12.2021) ATLAS.ti 9 Windows - User Manual
360.
Code Co-Occurrence TableRibbon
Show Lists: If you only want to see the table and not the selection lists, deactivate this option.
Show Table / Show Sankey diagram: You can display both the table and the Sankey Diagram, or only the table or
the Sankey diagram.
Refresh: If you make modifications to your codings while the table is open, you can click the Refresh option to
update the results.
Colors: You can choose among three colors for the table cells (blue, red and green), the ATLAS.ti color palette
(default), and no coloring. If you select a color, or the ATLAS.ti color map, the table cells are colored in different
shades.
Show count: Show the number of co-occurrences (=number of hits, see above: How to read the table).
Show Coefficient: The c-coefficient gives you an indication of the strength of the relationship between the pair of
codes. See C-Coefficient for more detail.
Cluster quotations: Activate this option, if you want to count embedded quotations only once. If code 'A' codes a
larger segment and within this segment, there are three quotations coded with a code 'B', the number of co-
occurrences is 3. With clustering activated, the count is 1.
Use AND operator: If you activate this option, the table values are calculated based on an 'AND' occurrence and not
the more general code 'co-occurrence' operator. See the section on Proximity Operators for further detail.
Rows => Columns: Select to switch row and column codes.
Compress: This is a quick way to remove all rows or columns that only show empty cells. This is the same as
manually deactivating codes that yield no results. Thus, you cannot "uncompress" a table.
Auto Size Columns: Adjust the size of the columns automatically so that the full label is shown.
THE CODE CO-OCCURRENCE TABLE 346
9.0.0.214 (15.12.2021) ATLAS.ti 9 Windows - User Manual
361.
Freeze first column:Set if you do not want the auto size option to affect the first column.
Set Column Size: You can manually set the column size. '100' means that the column is as wide as the full label.
Details: If activated, you see the total number of times the code has been applied to a quotation. This helps you to
better evaluate the numbers in each cell. The interpretation is likely different if the number of hits is 10 and if each
of the codes have been applied 50 or only 15 times.
Export: You can export the table to Excel.
If Show Count is selected, only the number of co-occurrences are exported.
If Show Coefficient is selected, only the c-coefficient and not the absolute number of hits are exported.
If you have selected both, both are exported.
The table approach reduces the analysis to a pairwise comparison. If you need a higher order co-occurrence
based on three or more codes, you can create smart codes and use them in the table.
•
•
•
THE CODE CO-OCCURRENCE TABLE 347
9.0.0.214 (15.12.2021) ATLAS.ti 9 Windows - User Manual
362.
Visualizing the CodeCo-Occurrence Table: Sankey
Diagram
Data Visualization is a great way to simplify the complexity of understanding relationships among data. The
Sankey Diagram is one such powerful technique to visualize the association of data elements. Originally, Sankey
diagrams were named after Irish Captain Matthew Henry Phineas Riall Sankey, who used this type of diagram in
1898 in a classic figure showing the energy efficiency of a steam engine. Today, Sankey diagrams are used for
presenting data flows and data connections across various disciplines.
Video Tutorial: Sankey Diagrams in ATLAS.ti Windows * Sankey diagrams allow you to show complex
processes visually, with a focus on a single aspect or resource that you want to highlight.
They offer the added benefit of supporting multiple viewing levels. Viewers can get a high level view, see
specific details, or generate interactive views.
Sankey diagrams make dominant factors stand out, and they help you to see the relative magnitudes and/
or areas with the largest contributions.
In ATLAS.ti, the Sankey diagram complements the Code Co-occurrence Table. As soon as you create a table, a
Sankey diagram visualizing the data will be shown below the table.
The row and column entities of the table are represented in the Sankey model as nodes and edges, showing the
strength of co-occurrence between the pairs of nodes. In the Code Co-occurrence table, the connecting pairs are
codes for both rows and columns.
•
•
VISUALIZING THE CODE CO-OCCURRENCE TABLE: SANKEY DIAGRAM 348
9.0.0.214 (15.12.2021) ATLAS.ti 9 Windows - User Manual
363.
For each tablecell containing a value, an edge is displayed between the diagram nodes. The thickness of the edges
resemble the cell values of the table. Cells with value 0 are not displayed in the Sankey view.
The key to reading and interpreting Sankey Diagrams is to remember that the width is proportional to the
quantity represented.
You can select what you want to see by making a selection in the ribbon at the top left-hand side. If you need
more space on your screen for the diagram, you can also deactivate the selection lists under the View tab.
Layout
The Sankey diagram, similar to the network editor, applies a layout for its nodes and consequently to the edges
connecting nodes to create an easy to comprehend visualization of the data. This basic layout places the selected
entities (nodes in Sankey terminology) into vertical „layers“ with the row entities placed to the left and the column
entities to the right. If nodes have incoming as well as outgoing links in the currently visible set of nodes, they will
be placed in intermediate lanes or layers. In many situations, the initial layout already meets the researchers
requirements. However, there are some options to modify the initial layout.
Swapping columns and rows for the table will also affect the Sankey diagram and result in a 180° rotation.
Inte
To display the quotations that are responsible for the co-occurrence of two entities, click on the connecting
edge. This has the same effect as clicking a table cell. You see the quotations displayed in the Quotation
Reader to the right.
If you hover over an edge, you see the number that is also displayed in the table cell, which are the number
of times the pair of codes co-occur.
To support finding the correct link, moving the mouse highlights the hovered edges. After selecting an
edge, the unselected edges are dimmed to further increase the visibility of the edge under consideration.
Selecting a node will highlight this node as well as all its incoming and outgoing edges. This makes it easy
to spot areas of connectivity.
•
•
•
•
VISUALIZING THE CODE CO-OCCURRENCE TABLE: SANKEY DIAGRAM 349
9.0.0.214 (15.12.2021) ATLAS.ti 9 Windows - User Manual
364.
You can alsouse the nodes label for selection, differing only by doing a „single-handed“ multi-selection
which otherwise would require pressing the Ctrl-key.
Removing edges
To unscramble a potentially cluttered diagram, you can remove selected nodes or edges by
pressing the Delete key on your keyboard. You can undo this via Ctrl-Z.
The same may be accomplished by modifying the selection lists, but this is a bit „heavier“,
and it may not be clear which entities need to be deselected.
Fit to Window
When the Sankey diagram is created (concurrently with the respective tools’ table) it may display a bit too tiny in
its reserved window pane. There are several options to fix this: Switch off the table view and the selection lists,
maximize the project window or float the tool with the diagram. The Sankey diagram itself will not resize to the
freed space automatically. Click button Fit-to Window to fit the current diagram to the available window area.
Refresh Layout
This will also move nodes to their original places if moved in the meantime. The edges will also be recalculated for
best entanglement. This option can also be activated by double clicking the diagrams background.
Auto Layout
This option is activated by default. It will instantly recompute the diagram’s layout if:
Nodes are moved
Nodes are removed
Edges are removed
•
•
•
•
VISUALIZING THE CODE CO-OCCURRENCE TABLE: SANKEY DIAGRAM 350
9.0.0.214 (15.12.2021) ATLAS.ti 9 Windows - User Manual
365.
Respect Node Placement
Youmight not always be happy when the nodes you shifted to other locations are instantly moved back to their
original locations. To prevent this, you either need to disable the Auto Layout or select Respect Node Placement.
Note, that the Respect Node Placement option will not let you place nodes to arbitrary positions but will
find a nearest lane and relayout the diagram to make it nice looking again.
Shortcut: Double-click the diagram background while pressing the left Shift key.
Rotate Diagram
Sometimes the horizontal left-to-right layout may not always give the most optimal visualization of your data
(depending on available screen space, monitor size). Click this button to toggle between a vertical (top-down) and
the original horizontal layout. Shortcut: Double click the diagram background while pressing the left Ctrl key.
Display Icons
This display the entities type icons preceding the labels. This makes most sense when the diagram contains
multiple types of entities as in the Code Document Table. By default, this option is not activated.
Link Color Mode
The coloring of the links and edges between the nodes can be set to:
Use the color of the source node (either the user provided color for codes, or the type dependent color of
other entities.
Use the color of the target node
Use a color gradient starting with the source and ending with the target color. This is the default. It makes
tracking the endpoint of an edge quite comfortable. Shortcut: Double-click the diagram background while
pressing the left Alt key.
None: Use a gray shade independent of any node coloring.
Shortcut: Double click the diagram background while pressing the left Alt key.
Dark / Light Background
This toggles a light and a dark background, just for aesthetics.
Shortcut: Double click the diagram background while pressing the left Ctrl and Shift key.
•
•
•
•
VISUALIZING THE CODE CO-OCCURRENCE TABLE: SANKEY DIAGRAM 351
9.0.0.214 (15.12.2021) ATLAS.ti 9 Windows - User Manual
366.
Print Diagram
Creates anoutput of the current diagram respecting both the selected background, and the visual selection state
of both nodes and edges. The printout will not contain any quotations.
Printing can also create high quality PDFs if an appropriate printer driver is installed.
Miscellaneous
The diagram is integrated into the table tools and responds to certain options:
Compress, that is removing empty rows or columns, will remove corresponding elements in the diagram.
Clustering may reduce the number of co-occurrences and thus affects the size of edges in the diagram.
Swapping rows and columns reverts the original layout by 180°.
Useful Links
Using sankey diagrams to tell a story with data
Visualizing customer journey with sankey diagram
A sankey diagram says more than a 1000 pie charts
What, Why and How of sankey diagrams
Using colors effectively in sankey diagrams
•
•
•
•
•
•
•
•
VISUALIZING THE CODE CO-OCCURRENCE TABLE: SANKEY DIAGRAM 352
9.0.0.214 (15.12.2021) ATLAS.ti 9 Windows - User Manual
367.
Code Co-occurrence Coefficient
Thec-coefficient indicates the strength of the relation between two codes.
This option can be activated in the ribbon of the Code Co-occurrence Table.
The range of the c-coefficient is between 0 and 1:
0 mean codes do not co-occur
1 means these two codes co-occur wherever they are used
The calculation of the c-coefficient is based on approaches borrowed from quantitative content analysis. It is
calculated as follows:
c = n12 / (n1 + n2 - n12)
n12 = number of co-occurrences for code n1 and n2
The c-coefficient is useful when working with larger amounts of cases and structured data like open-ended
questions from surveys. If you use the c-index, pay attention to the additional colored hints. As your data
base is qualitative, the c-coefficient is not the same as for instance a Pearson correlation coefficient and
therefore also no p-values are provided.
Distortion due to unequal frequencies
An inherent issue with the c-index and similar measures is that it is distorted by code frequencies that differ too
much. In such cases the coefficient tends to be much smaller than the potential significance of the co-occurrence.
For instance, if you had coded 100 quotations with code 'A' and 10 with code 'B', and you have 5 co-occurrences,
then the c-coefficient is:
c = 5/(100 + 10 - 5) = 5/105 = 0.048
A coefficient of only 0.048 may slip your eye easily, although code B appears in 50% of all its applications with
code A.
If one of the codes of one pair has been applied more than 5 times than the other code, a yellow dot appears in
the top right of the table cell. So whenever a cell shows the yellow marker, it should invite you to look into the co-
occurrences of this cell despite a low coefficient.
When you hover with the mouse over a cell, a pop-up note displays the ratio of the two codes.
•
•
CODE CO-OCCURRENCE COEFFICIENT 353
9.0.0.214 (15.12.2021) ATLAS.ti 9 Windows - User Manual
368.
Out
The c-index assumesseparate non-overlapping text entities. Only then can we expect a correct range of
values.
The coefficient can exceed the 0 - 1 range it is supposed to stay with, if there is redundant coding. Let's take a look
at the following example:
A quotation 1 is coded with codes A and B
an overlapping quotation 2 is coded with Code B.
Then quotation 1 counts for 1 co-occurrence event and the overlapping quotation 2 for another. This results in a
value of twice the allowed maximum:
c = 2/(1 + 2 - 2) = 2
All cells displaying an out-of-range number (> 1) show a red dot in the top right corner.
In case the c-coefficient exceeds 1, you need to do some cleaning-up and eliminate the redundant codes.
See Finding Redundant Codings .
Summary of Color Indicators
Yellow dot: Unequal quotation frequencies - the ration between the frequencies of the code and row code exceeds
the threshold of 5.
Red dot: The C-index exceeds the 0 - 1 range.
Orange dot: The orange dot is simply a mixture of the red and yellow conditions.
•
•
CODE CO-OCCURRENCE COEFFICIENT 354
9.0.0.214 (15.12.2021) ATLAS.ti 9 Windows - User Manual
369.
The Query Tool
TheQuery Tool is used for retrieving quotations using the codes they were associated with during the process of
coding. The simplest retrieval of this kind - search for quotations with codes- is what you frequently do by double-
clicking ona Code in the Code Manager or a code browser. See Retrieving Coded Data. This may already be regarded
as a query, although it is a simple one. The Query Tool is more complex in that it can be used to create and process
queries that include a variety of combinations of codes.
A query is a search expression built from operands (codes and code groups) and operators (Boolean, proximity or
semantic operators) that define the conditions that a quotation must meet to be retrieved, for example "All
quotations coded with both codes A and B".
A query can be built incrementally which is instantaneously evaluated and displayed as a list of quotations. This
incremental building of complex search queries gives you an exploratory approach toward even the most complex
queries.
To open the Query Tool:
Select the Analyze tab and click Query Tool.
The query tool ribbon contains all available operators for querying data, plus a few options that help you build a
query. At the left-hand side you see the list of codes and code groups that can be used as operands in a query. The
main space is reserved for displaying the query and the results. At the top right-hand side you find a number of
different output options to create a report of the query results.
Remember the results of a query in the query tool are always quotations.
THE QUERY TOOL 355
9.0.0.214 (15.12.2021) ATLAS.ti 9 Windows - User Manual
370.
How to Builda Query Using Boolean Operators
Video Tutorial Creating a Boolean OR query in the Query Tool
The examples shown are based on the Children & Happiness sample projects part 1. You can download and
import it, if you want to follow along.
Example 1
Open the Query Tool by selecting the Analyze tab and from there click Query Tool.
Question
The aim is to find all statements where people wrote about the two positive effects of parenting: 'fulfillment' and
'life is richer'.
Next, select the operator OR from the ribbon. It will be added into the white field.
As OR needs two arguments, you see two nodes with a red dot that can be filled with
codes or code groups. You recognize the active node by the blue frame. Double-click on a
code or code group to fill it. You can also drag and drop a code or code group to the node, or
click on the Add button in the ribbon. The results of this first part of the query will
immediately be displayed in the result pane.
HOW TO BUILD A QUERY USING BOOLEAN OPERATORS 356
9.0.0.214 (15.12.2021) ATLAS.ti 9 Windows - User Manual
371.
Click on thesecond node to activate it and enter a second code or code group. If you
double-click a third code or code group, it will be added to the OR query. Another double-
click will add a fourth node to the term, and so on.
HOW TO BUILD A QUERY USING BOOLEAN OPERATORS 357
9.0.0.214 (15.12.2021) ATLAS.ti 9 Windows - User Manual
372.
Inspecting the Resultsof a Query
If you click on an operator node, the quotations resulting from the query will be displayed in the bottom pane. If
you click on any other node in the query, the respective results of the selected node will be shown.
The results of a query are shown in the Quotation Reader. The full functionality of the quotation reader is
also available here.
If you want to read the results in a detached Quotation reader, click on the burger menu
and select the option Open in new window:
HOW TO BUILD A QUERY USING BOOLEAN OPERATORS 358
9.0.0.214 (15.12.2021) ATLAS.ti 9 Windows - User Manual
373.
The status barat the bottom of the screen shows the total number of quotations this query results in
If you click on any one of the node in a query, the respective results of this node will be shown:
HOW TO BUILD A QUERY USING BOOLEAN OPERATORS 359
9.0.0.214 (15.12.2021) ATLAS.ti 9 Windows - User Manual
374.
Options of theResult Pane
If you click on the Eye icon, you can change the view mode. Available options are:
single line
small preview
large preview
show quotation comments
show margin
When you click on the Burger icon you can export the results of the query to Excel.
Removing or Modifying a Query
To delete a query, click on the operator node and select Delete in the ribbon, or the Delete
key on your keyboard.
If you only want to delete an argument (i.e. a code or code group) from the query, click on
the respective node and then on the Delete button in the ribbon, or the Delete key on your
keyboard.
If you want to change the operator, click on the Change Operator button in the ribbon.
Changing operators is only available for Boolean queries.
Example 2
In this example, we show how to build a query with two Boolean operators.
Question
•
•
•
•
•
HOW TO BUILD A QUERY USING BOOLEAN OPERATORS 360
9.0.0.214 (15.12.2021) ATLAS.ti 9 Windows - User Manual
375.
The aim isto find all statements coded with:
("children = level of happiness" OR "children > happiness")
that have also been coded with codes of the code group "sources of happiness".
Select the operator OR from the ribbon.
Add the two codes "children = level of happiness" and "children > happiness" into the two
empty nodes as described above.
Select the operator AND to extend the query. The result of the first query is now one of the
two arguments needed. Activate the empty node by clicking on it and add the code group
"sources of happiness".
Activate the empty node by clicking on it and add the code group "sources of happiness".
HOW TO BUILD A QUERY USING BOOLEAN OPERATORS 361
9.0.0.214 (15.12.2021) ATLAS.ti 9 Windows - User Manual
376.
You can readthe query as follows: Find all statements where people wrote that children either make them more
happy, or they experience equal level of happiness and where they also mentioned a source of happiness. This
query yields one quotation as result.
You can rotate the layout of a query by clicking on the Rotate Layout button in the ribbon.
If you selected the wrong Boolean operator, you can exchange it by clicking on Change Operator in the
ribbon. This saves you from rebuilding the query from scratch if you made a mistake.
HOW TO BUILD A QUERY USING BOOLEAN OPERATORS 362
9.0.0.214 (15.12.2021) ATLAS.ti 9 Windows - User Manual
377.
How to Builda Query using Proximity Operators
Video Tutorial: Proximity Operators and Example Queries
The examples shown are based on the Children & Happiness sample projects part 1. You can download and
import it, if you want to follow along.
Example 1
Open the Query Tool by selecting the Analyze tab and from there click Query Tool.
Question
Is positive and negative perception of parenthood related to the attitude whether having children contribute to
happiness?
These aspects are captured by the code groups: "positive effects of parenting" and "negative effects of parenting",
and the codes "children > happiness" and "children < happiness"
Select the operator Co-occurs in the ribbon.
As all proximity operators need two arguments, you see two nodes with a red dot that can be filled with codes or
code groups. You recognize the active node by the blue frame.
HOW TO BUILD A QUERY USING PROXIMITY OPERATORS 363
9.0.0.214 (15.12.2021) ATLAS.ti 9 Windows - User Manual
378.
Select the code"children > happiness" to fill the node on the left-hand side. You can also
drag and drop a code or code group to the node, or click on the Add button in the ribbon.
The results of this first part of the query will immediately be displayed in the result pane.
Select the code group "Positive effects of parenting" to fill the node on the left-hand side.
The result of this query are 8 quotations.
The status bar at the bottom of the screen shows the total number of quotations this query results in.
You can read the query as follows:
Remember that the position of the code or code group in a query with proximity operators matters. The
quotations displayed in the result pane are those quotations linked to the code (or argument) on the left-hand
side of the query. Note that the Co-occurs icon shows a black and white field. The black field represents the
quotations that are shown (see image).
If you got the arguments the wrong way around, you can swap them by clicking on the Swap button in the
ribbon.
To see how the attitude "children > happiness" relate to "Negative effects of parenting",
select the code group "Positive effects of parenting" and Delete it from the query.
HOW TO BUILD A QUERY USING PROXIMITY OPERATORS 364
9.0.0.214 (15.12.2021) ATLAS.ti 9 Windows - User Manual
379.
Replace it withthe see code group "Negative effects of parenting". The result will be 0
quotations.
Next, test whether there is a relation between the attitude "children < happiness" and a
negative perception of parenting by replacing the code on the left-hand side:
HOW TO BUILD A QUERY USING PROXIMITY OPERATORS 365
9.0.0.214 (15.12.2021) ATLAS.ti 9 Windows - User Manual
380.
Example 2
In thefollowing example, two proximity operators are used in one query.
Question Do respondents who mentioned positive effects of parenting also mention negative aspects?
As mentioned positive and negative effects do not necessary co-occur directly, the task is to find both aspects in
the larger context of the entire comment written by each person. This larger context has been coded with the code
"blog comment".
Select the operator Encloses in the ribbon. Enter the code "Blog comment" on the left-hand
side, and the code group "Positive effects of parenting" on the right-hand side.
Next, select the operator Co-occurs from the ribbon. The first query now becomes one of
the arguments for the second part of the query. Add the code group "Negative effects of
parenting" to the empty node.
The result shows 11 quotations (if you check the status bar on your screen). As the code "blog comments" has been
entered on the left-hand side, each results reflects one comment. So we know that 11 respondents have been
writing about both positive and negative effects of parenting.
HOW TO BUILD A QUERY USING PROXIMITY OPERATORS 366
9.0.0.214 (15.12.2021) ATLAS.ti 9 Windows - User Manual
381.
You can rotatethe layout of a query by clicking on the Rotate layout button in the ribbon.
Inspecting the Results of a Query
If you click on an operator node, the quotations resulting from the query will be displayed in the result pane. If you
click on any other node in the query, the respective results of the selected node will be shown.
The results of a query are shown in the Quotation Reader. The full functionality of the quotation reader is
also available here.
Options of the Result Pane
If you click on the Eye icon, you can change the view mode. Available options are:
single line
small preview
large preview
show quotation comments
show margin
When you click on the Burger icon you can export the results of the query to Excel.
Removing a Query or an Argument
To delete a query, click on the operator node and select Delete in the ribbon, or the Delete
key on your keyboard.
If you only want to delete an argument (i.e. a code or code group) from the query, click on
the respective node and then on the Delete button in the ribbon, or the Delete key on your
keyboard.
•
•
•
•
•
HOW TO BUILD A QUERY USING PROXIMITY OPERATORS 367
9.0.0.214 (15.12.2021) ATLAS.ti 9 Windows - User Manual
382.
HOW TO BUILDA QUERY USING PROXIMITY OPERATORS 368
9.0.0.214 (15.12.2021) ATLAS.ti 9 Windows - User Manual
383.
How to Builda Query using a Mix of Operators
The examples shown are based on the Children & Happiness sample projects part 1. You can download and
import it, if you want to follow along.
The instructions below are not as detailed, as it is assumed that you have read the examples for Boolean Queries
and Proximity Queries.
Example 1
Question: Find all blog comments written by people who have one child AND who expressed the ambivalence of
parenthood that contain a statement that having children made them happier.
The AND query needs to be embedded within the co-occurrence query:
Select the operator AND in the ribbon.
Add code or code groups to the empty nodes via double-click or drag and drop (here:
"#fam: 1 child" and "parenthood: ambivalence").
Select the operator Co-occurs and enter a code/code group to the empty node (here:
"children: > happiness"). Since the first AND query makes up the argument for the left-
hand side of the query, the final query finds all quotations that are co-occurring with the
quotations of the first argument.
Remember that the position of the code or code group in a query with proximity operators matters. The
quotations displayed in the result pane are those quotations linked to the code (or argument) on the left-
hand side of the query.
HOW TO BUILD A QUERY USING A MIX OF OPERATORS 369
9.0.0.214 (15.12.2021) ATLAS.ti 9 Windows - User Manual
384.
You can readthe query as follows: Find all blog comments written by people who have one child AND who
expressed the ambivalence of parenthood that contain a statement that having children made them happier.
To explore the data further, you can exchange the single nodes of the query, for example to see whether there are
also comments that match the same criteria for people with two children; or to find comments where people with
1 / 2 or more children write that having children made them less happy.
If you got the arguments the wrong way around, you can swap them by clicking on the Swap button in the
ribbon.
HOW TO BUILD A QUERY USING A MIX OF OPERATORS 370
9.0.0.214 (15.12.2021) ATLAS.ti 9 Windows - User Manual
385.
Example 2
The aimis to find all blog comments written by people who have expressed that children make them happy, that
are NOT coded with the code 'parenthood: ambivalence'
Here we have to define two conditions that both must apply:
Blog comments that enclose statements that children mean > happiness.
All quotations that have not been coded with 'parenthood: ambivalence' As both conditions must be true,
we need to use the AND operator to combine them:
Select the operator NOT in the ribbon.
Add code or code groups to the empty node via double-click or drag and drop (here:
"parenthood: ambivalence")
Select the operator AND and instead of adding a code or code group to the empty node,
extend the query by selecting the operator Encloses.
Add a code/code group to the empty nodes (here: "blog:comment" and "children: >
happiness"). Here it matters again which code/code group is entered on the right or left-
hand side of this sub query.
You can read the query as follows: Find all blog comments written by people who have expressed that children
make them happy, that are NOT coded with the code 'parenthood: ambivalence'
To explore the data further, you can exchange for instance the code 'children: > happiness' with 'children: <
happiness'.
•
•
HOW TO BUILD A QUERY USING A MIX OF OPERATORS 371
9.0.0.214 (15.12.2021) ATLAS.ti 9 Windows - User Manual
386.
HOW TO BUILDA QUERY USING A MIX OF OPERATORS 372
9.0.0.214 (15.12.2021) ATLAS.ti 9 Windows - User Manual
387.
Restrict a Queryto Sub Groups in your Data
Video Tutorial: Query Tool with Scope
Opening the Scope Tool
If you want to restrict a search to a particular document or document group, e.g. because you are interested in
comparing male and female respondents, you need to open the scope tool.
Click on Edit Scope in the ribbon of the query tool.
After selecting the Edit Scope option, an additional region opens on the left-hand side. The ribbon also changes.
You can select a document or document group to restrict a search, or you can build a query using Boolean
operators if you need a combination of documents or document groups, e.g. all female respondents who have
children. Creating a query consisting of documents or document groups works in the same way as creating a code
query. See Example Boolean Query.
Select a single document/document group or build a Boolean query. The result pane in the
Scope area shows all quotations of the documents you have set as scope. The filtered
results are shown on the left-hand side below the code query.
Changing the Scope
To change the scope, click on the Delete button in the scope tool.
Closing the Scope Tool
To close the scope tool, click again on Edit Scope in the ribbon.
To see the results of a restricted search, always look at the list of quotations below the code query on the
left-hand side of the Query Tool window.
RESTRICT A QUERY TO SUB GROUPS IN YOUR DATA 373
9.0.0.214 (15.12.2021) ATLAS.ti 9 Windows - User Manual
388.
Storing the Resultsof a Query
You can store the results of a query as a smart code for further re-use. You can learn more about smart codes here
After you have created a query, click on the Save Smart Code button in the Query Tool tab.
inst
Enter a name for the smart code and click Create.
warn
A smart code always contains the quotations of the entire project. If you set a scope to
restrict the query to certain document or document groups, this is not saved in the smart
code!
You can now review all quotations of this query, e.g. in the Code or Quotation Manager, at any time. If you make
some changes in your coding, the smart code will always give you the up-to-date results.
Smart codes can be recognized by the gray dot at the bottom left-hand side of the code icon. See Working With
Smart Codes for further information.
If a query result delivers the quotations that are necessary to answer a research question, a smart code can
be a convenient way to store this result. This can be reflected in the name of the smart code, e.g. Research
question 3: Positive & negative views on parenting.
STORING THE RESULTS OF A QUERY 374
9.0.0.214 (15.12.2021) ATLAS.ti 9 Windows - User Manual
389.
Creating Document Groupsfrom Results
When you add documents to a project, it is easy to create document groups based on sample characteristics like
gender, age, profession, location, etc.
At times, you first need to code the data to find relevant information like years of working experience, special
skills, attitudes about something, relationship to other people, etc. For this you need an option to create
document groups based on query results.
Create a query. See for instance Example Boolean Query. Make sure your mouse pointer
selects the query and not a quotation n the result list. Click on the New Document Group
button in the ribbon and enter a name for the new group.
ATLAS.ti creates a new group from all documents that yield quotation results based on the
query.
The query might be as simple as just selected one code.
For instance, if you have coded for work experience:
work experience: 0 - 5 years
work experience: 6 - 10 years
work experience: 10 - 15 years
work experience: > 15 years
You would simply add the code 'work experience: 0 - 5 years' and click on the Create Document Group button to
create a document group of all respondents who have a work experience of 0 - 5 years. Then you add the code
'work experience: 6 - 10 years' and create a document group, and so on.
•
•
•
•
CREATING DOCUMENT GROUPS FROM RESULTS 375
9.0.0.214 (15.12.2021) ATLAS.ti 9 Windows - User Manual
390.
Query Tool Reports
ExcelReport
To export the list of quotations that result from a query to Excel, click on the 'burger menu'
(next to the eye) on the top right-hand side of the quotation list.
Text Report
To create a text report, click on the Report button in the ribbon. The drop-down menu
offers the following options:
Report: This is a report that you can customize. It is explained in more detail in the section Creating
Reports.
List: This report only includes the quotation ID, name, reference and document name. This is a useful
report option if you work with audio and video data that have no textual content. It is also useful if you
worked intensively with the quotation level and added your own quotation names and comments. See
Quotation Level.
List With Comments: Same as 'list' plus quotation comments.
Full Content: Includes the full content of text and image quotations, plus the full quotation reference, any
codes, memos and hyperlinks that apply.
Content plus Comments: Same as 'full content' plus quotation comments.
•
•
•
•
•
QUERY TOOL REPORTS 376
9.0.0.214 (15.12.2021) ATLAS.ti 9 Windows - User Manual
391.
Smart and SnapshotEntities
A smart entity in ATLAS.ti is always a query. You can create smart entities for codes and groups.
In the Code Manager you can create smart codes using the operator OR. This is useful if you need a combination of
two or more codes for data analysis. In the Query Tool, a smart code can be used to store query results. Smart
groups can be created in the Group Managers. They are especially useful for document groups when used as
variables. They allow you to create combination of variables.
The reason for naming such codes and groups smart is because they change along with your project. If you change
any of the codings of a code that is part of a smart code, this will be reflecting in the smart code when retrieving
its quotations. If you add or remove documents that are members of the groups that make up a smart group, the
smart group retrieves those documents that reflect the current state of your project.
Every time you click on a smart code or smart group, the underlying query is run, and you see the up to date
results.
A snapshot entity turns a smart entity into a regular code or code group. You can think of it like a snapshot you
take with a camera - it preserves the current moment. Thus, snapshot entities do no longer change automatically.
SMART AND SNAPSHOT ENTITIES 377
9.0.0.214 (15.12.2021) ATLAS.ti 9 Windows - User Manual
392.
What are SmartCodes?
Smart Codes are a convenient way to store queries. They are very similar in look and feel to normal codes,
with one important difference: instead of hardwired connections to quotations smart codes store a query
to compute their virtual references whenever needed.
Smart codes automatically change their behavior during the analysis. If you have a smart code based on a
query like: (Code A | Code B) COOCCUR Code C), and you add or delete quotations linked to either Code A, B
or C, then the smart code will automatically be adjusted.
As a smart code is a query, it cannot be used for coding. For the same reason, smart codes are not displayed
in the margin area.
Smart codes are displayed in the Code Manager. They can be recognized by a gray dot at the bottom left of
the code icon.
If you double-click on a smart code, you can retrieve all quotations that are the result of the underlying
query.
You can change the query that is underlying a smart code by editing the query.
Smart codes can be used in code groups, networks, and, last but not least, as powerful operands in queries,
allowing you to incrementally build complex queries.
Smart codes can be transferred into a regular code by creating a snapshot code.
What you cannot do with Smart Codes
As smart codes are not directly associated with quotations, certain restrictions apply.
Coding: You cannot link a smart code directly to a quotation. Therefore, smart codes are not shown in the
list of codes when coding your data. Drag & drop operations from code lists to other lists are not possible.
Merging: You cannot merge a smart code with other codes.
You cannot include a code group in the query for the smart code and assign the smart code to this code
group later. This would create a cyclical structure and is therefore not allowed.
•
•
•
•
•
•
•
•
•
•
WHAT ARE SMART CODES? 378
9.0.0.214 (15.12.2021) ATLAS.ti 9 Windows - User Manual
393.
Working With SmartCodes
Creating an ORed Smart Code in the Code Manager
If you only need a simple OR combination of two or more codes as smart code, the easiest way is to use the Code
Manager.
Open the Code Manager, select two or more codes, right-click and select the Create Smart
Code option from the context menu or the ribbon.
tip
If you wonder why an OR combination is useful rather than just merging the codes, at
times you want to keep the codes as regular codes in the code list. If you merge codes, only
the merged codes remains. For example, if you code the speakers in a focus group
transcript, you can create smart codes for all male and female speakers without losing the
code for each individual speaker. If you add these attributes to each speaker unit, the
margin becomes very cluttered. Smart codes are not displayed in the margin.
Creating a Smart Code in the Quotation Manager
You can also create smart codes in the Quotation Manager. There you can combine codes using the Boolean
operators AND and OR. See Available Operators for Querying Data > Boolean Operators.
Use AND to:
narrow your results
tell the database that ALL search terms must apply. This means that the smart code only retrieves
quotations that are linked to all codes in the query. In other words, the quotation is coded with multiple
codes.
Use OR to:
connect two or more similar concepts
broaden your results, telling the database that ANY of the search terms apply. This means the smart code
retrieves all quotations of all codes in the query. It is additive.
Open the Quotation Manager and select two or more codes in the side panel.
inst
The default operator in the yellow filter bar above the quotation list is 'ANY' (shown in blue
letters). If you want to change, click on it and select the 'ALL' operator. You need to click
next to it, not directly on it.
inst
To save the results as smart code, click on the Smart Code button in the ribbon; or right-
click on any of the selected codes in the side panel and select the option Create Smart Code
•
•
•
•
WORKING WITH SMART CODES 379
9.0.0.214 (15.12.2021) ATLAS.ti 9 Windows - User Manual
394.
from the contextmenu.
inst
Enter a name or use the default name and click Create.
Creating a Smart Code in the Q
Open the Query Tool and build a query.
To save the query, click the Save Smart Code button in the ribbon, enter a name and click
Create.
Editing a S
If you want to see the query that is underlying a smart code, of if you want to modify the query, you can edit the
smart code.
Open the Code Manager, select the smart code and in the ribbon click on the button Edit
Smart Code.
This opens the query tool where you can review and modify the smart code. See How to
build a query.
You cannot delete a code, if it is part of a smart code query. If you want to remove a code that is part of a
smart code query, you first must delete the smart code. If you do not want to lose the results stored by the
smart code, you can turn it into a snaptshot code before deleting it.
WORKING WITH SMART CODES 380
9.0.0.214 (15.12.2021) ATLAS.ti 9 Windows - User Manual
395.
What are SmartGroups
Smart Groups are very similar in look and feel to normal groups, with one important difference: instead of
hardwired connections to their members, smart groups store a query to compute their virtual references
whenever needed.
Although also an option for code, memo and network groups, the most common application for smart groups are
smart document groups. They allow you to combine two or variables. For instance gender and location. This
requires that you have document groups for the basis variables. Here for gender: male and female and for location:
urban and rural. If you need the combination of gender and location more often, a good way to do this is to create
smart groups:
female respondents from urban areas
female respondents from rural areas
male respondents from urban areas
male respondents from rural areas
For creating smart groups Boolean operators are used. See Available Operators for Querying Data > Boolean
Operators for further information.
A reason for creating a smart group is to apply them as global filter. See Applying Global Filters For Data
Analysis. Another application is to add them to a network and display document group - code
connections.
•
•
•
•
WHAT ARE SMART GROUPS 381
9.0.0.214 (15.12.2021) ATLAS.ti 9 Windows - User Manual
396.
Working With SmartGroups
A reason for creating a smart group is to apply them as global filter. See Applying Global Filters For Data
Analysis. Another application is to add them to a network and display document group - code
connections.
Creating a Smart Group
To create a new smart group, open a Manager and select two or more groups. Click on New
Smart Group in the ribbon, or right-click select this option from the context menu.
inst
Accept the suggested name or enter a new one, and click Create.
tip
Smart entities can be recognized by the little gray circle at the bottom left of the icon.
Editing a Smart Group
Smart groups can only be edited in their respective group managers.
Go to the Home ribbon, click on the drop-down of the appropriate entity and select [ ]
Groups.
inst
Select the smart group you want to edit and click Edit Smart Group in the ribbon.
This opens the Smart Group Editor that looks similar to the query tool.
The following operators are available:
OR: combines all selected groups and forms a larger group AND: creates a smart group consisting of the
intersection of the selected groups like 'female respondents from urban areas'. ONE OF (Exactly one of the
following is true): creates a smart group only containing members that are unique to each group and do not occur
in any of the other selected groups. Example: In the sample project Evaluation of a computer game, respondents
evaluate the game in different ways. If you want to find those respondents who either evaluate the game as being
creative or educational (and not both), you can use the one of operator.
IMAGE
NOT (None of the following are true): creates a smart group excluding the members of the selected group.
Example: The sample project children and happiness contains two document groups that have been created based
on the issues coded in the data. These are: documents that contain codings on positive and negative effects of
parenting. There are some documents that only contain codings on positive effects, others that only contain
codings on negative effects, and yet some that contain both. If you want to find only those documents that
contain codings on positive effects, you can create the following smart document group:
WORKING WITH SMART GROUPS 382
9.0.0.214 (15.12.2021) ATLAS.ti 9 Windows - User Manual
397.
NOT negative effectsAND positive effects.
IMAGE
See how to build a query for further information on how to understand and modify the query of a smart
group.
WORKING WITH SMART GROUPS 383
9.0.0.214 (15.12.2021) ATLAS.ti 9 Windows - User Manual
398.
What are SnapshotCodes and Groups?
Snapshot Codes
A snapshot code transforms a smart code into a regular code. This code preserves the current state of a smart
code at the moment of its creation, like taking a photograph that captures the moment, and creates direct links to
all quotations.
A snapshot code is displayed in the margin area.
A snapshot code can be used for coding.
You can create a snapshot code from a smart code. This can be useful for data analysis when you build queries.
Another application is to use this option for fixing code systems when code groups have been used as categories.
This often leads to underdeveloped code systems, long list of codes and limited use of the further analysis tools.
To fix this, you first need to turn all code groups into smart codes using the query tool. Then you create snapshot
codes from these smart codes, transforming the code groups into regular codes. In the next step, the members of
the code groups can be turned into sub codes by adding prefixes and merged as appropriate. See Building a Code
System.
Snapshot Groups
A snapshot group transforms a smart group into a regular group. This group preserves the current state of a
smart group at the moment of its creation, like taking a photograph that captures the moment, and creates direct
links to all members.
Application: It can for example be useful if you want to remove documents from a project that are part of a smart
group. As long as they are part of the smart group, this is not possible. In order not to lose the combination of
documents as defined by the smart group, you can turn it into a snapshot group, delete the smart group and then
delete the document(s) that you no longer want from the project.
•
•
WHAT ARE SNAPSHOT CODES AND GROUPS? 384
9.0.0.214 (15.12.2021) ATLAS.ti 9 Windows - User Manual
399.
Creating Snapshots
You cancreate snapshots from smart codes and smart groups.
Creating a Snapshot Code
Open the Code Manager and select a smart code. Click on the button Create Snapshot in
the ribbon.
The default name for the snapshot code is the name of the smart code plus the suffix [SN
1]; [SN 2] if you create second snapshot code of the same smart code and so on.
Creating a Snapshot Group
Open the Group Manager either by selecting the option in the ribbon of the respective
manager, or from the drop-down of the entity type button in the Home ribbon.
Select the smart group and then Create Snapshot from the ribbon.
CREATING SNAPSHOTS 385
9.0.0.214 (15.12.2021) ATLAS.ti 9 Windows - User Manual
400.
Working with GlobalFilters
Global filters are a powerful tool to analyze your data. As compared to local filters that you can invoke in each
manager, global filters have an effect on the entire project.
Currently, all groups can be set as global filter.
Creating a Global Filter
Creating a global filter means creating a group.
Code Groups as Global filter
In the Project Explorer, and the Code Browser only the codes of the code group set as global filter are
shown.
•
WORKING WITH GLOBAL FILTERS 386
9.0.0.214 (15.12.2021) ATLAS.ti 9 Windows - User Manual
401.
When coding onlythe codes of the code group set as global filter are shown.
•
WORKING WITH GLOBAL FILTERS 387
9.0.0.214 (15.12.2021) ATLAS.ti 9 Windows - User Manual
402.
In the marginarea only the codes of the code group set as global filter are shown.
In the code manager only the codes of the code group set as global filter are shown.
•
•
WORKING WITH GLOBAL FILTERS 388
9.0.0.214 (15.12.2021) ATLAS.ti 9 Windows - User Manual
403.
In all selectionlists of all analysis tools only the codes of the code group set as global filter are shown.
Code groups as global filters are very useful in networks when you use the options: Add Neighbors and Add
Co-occurring Codes. Then only the codes of the code group set as global filter are added.
In a network, all codes that are not in the code group set as global filter are faded out.
•
•
•
WORKING WITH GLOBAL FILTERS 389
9.0.0.214 (15.12.2021) ATLAS.ti 9 Windows - User Manual
404.
Document Groups asGlobal Filter
Document groups as global filter affect the list of documents and quotations. Thus, the list of quotations shown
in the quotation manager or as results of queries is reduced to those documents that are in the filter.
When retrieving quotations with a double-click on a code in the code manager, the quotation reader will
only show quotations from the documents that are in the filter.
In the Code-Document Table, it allows you to add a layer to the analysis. If for instance you compare the
frequency of codes by respondents with different educational levels, you can set a document group as
global filter to refine the analysis to only male respondents.
If you run a Code Co-occurrence Analysis it will apply to all data in your project. If you want to restrict the
analysis, to only a particular group of respondents or type of data, you can set a document group as global
filter.
In a network, all documents that are not in the document group set as global filter are faded out.
Memo Groups as Global Filter
Memo groups as filters affect the list of memos you see in the memo manager and all selection lists.
Only memos that are in the memo group set as global filter are shown in the margin area.
In a network, all memos that are not in the memo group set as global filter are faded out.
Network Groups as Global Filter
Network groups as filters affect the list of networks you see in the network manager and all selection lists.
In the margin area, only networks that are in the network group set as global filter are shown.
In a network, all networks that are not in the network group set as global filter are faded out.
•
•
•
•
•
•
•
•
•
•
WORKING WITH GLOBAL FILTERS 390
9.0.0.214 (15.12.2021) ATLAS.ti 9 Windows - User Manual
405.
Setting a GlobalFilter
Global filters can be set in the Project Explorer on the left and in each manager.
Right-click on a group and select the option Set Global Filter.
In the ribbon of the
Managers, you can also set and remove global filters in the Search & Filter tab.
Display Of Global Filters
If a global filter is set, all affected managers, browsers, lists and tools show a colored bar on top indicating which
filter has been set.
global document filters are blue.
global quotations filters are orange.
global code filters are green.
global memo filters are magenta.
global network filters are purple
•
•
•
•
•
WORKING WITH GLOBAL FILTERS 391
9.0.0.214 (15.12.2021) ATLAS.ti 9 Windows - User Manual
406.
Activating / DeactivatingGlobal Filters
While a global filter is active, you can temporarily deactivate it by clicking on the check-box
in the global filter bar you see above each filtered list or table.
Changing a Glob
To change a global filter, right-click on a different group of the same type and set it as
global filter. This will automatically deactivate the currently active filter.
Removing a Global Filter
To remove a global filter, click on the x on the right-hand side of the global filter bar.
Another option is to right-click on the group you have filtered and select Clear Global Filter
from the context menu.
WORKING WITH GLOBAL FILTERS 392
9.0.0.214 (15.12.2021) ATLAS.ti 9 Windows - User Manual
407.
Creating a GlobalFilter
Creating a global filter means creating a group.
Document groups as global filter, filter documents and their quotations.
Code groups as global filter, filter codes.
Memo groups as global filter, filter memos.
Network groups as global filter, filter networks.
•
•
•
•
CREATING A GLOBAL FILTER 393
9.0.0.214 (15.12.2021) ATLAS.ti 9 Windows - User Manual
408.
Setting a GlobalFilter
Global filters can be set in the Project Explorer on the left, and in each Manager.
Right-click on a group in the Document Group section of the Project Explorer and select the
option Set Global Filter.
In the ribbon of the Managers, you can also set and remove global filters in the Search &
Filter tab.
Display Of Globa
If a global filter is set, all affected managers, browsers, lists and tools show a colored bar on top indicating which
filter has been set.
global document filters are blue.
global quotations filters are orange.
global code filters are green.
global memo filters are magenta.
global network filters are purple
Activating / Deactivating Global Filters
While a global filter is active, you can temporarily deactivate it by clicking on the check-box
in the global filter bar that you see above each filtered list or table.
Changing a Global Filter
To change a global filter, right-click on a different group of the same type and set it as
global filter. This will automatically deactivate the currently active filter.
Removing a Global Filter
To remove a global filter, click on the x on the right-hand side of the global filter bar.
Another option is to right-click on the group you have filtered and select Clear Global Filter
from the context menu.
•
•
•
•
•
SETTING A GLOBAL FILTER 394
9.0.0.214 (15.12.2021) ATLAS.ti 9 Windows - User Manual
409.
Removing / Changing/ Activating / Deactivating a
Global Filter
If you change a global filter, the currently active filter is automatically reset (see below).
Removing a Global Filter
Click on the x on the right-hand side of the global filter bar.
Another option is to right-click on the group you have filtered and select Clear Global Filter
from the context menu.
Changing a Glob
To change a global filter, right-click on a different group of the same type and set it as
global filter. This will automatically deactivate the currently active filter.
Activating or Deactivating Global Filters
While a global filter is active, you can temporarily deactivate it by clicking on the check-box
in the global filter bar you see above each filtered list or table.
REMOVING / CHANGING / ACTIVATING / DEACTIVATING A GLOBAL FILTER 395
9.0.0.214 (15.12.2021) ATLAS.ti 9 Windows - User Manual
410.
Global Filters inthe Code Co-occurrence Table
The images below show two code co-occurrence tables. The first one shows the relationship between the attitude
towards having a child and reported effects of parenting for the entire data set. The second table shows the same
codes, but only for one data source.
GLOBAL FILTERS IN THE CODE CO-OCCURRENCE TABLE 396
9.0.0.214 (15.12.2021) ATLAS.ti 9 Windows - User Manual
411.
Global Filters inthe Code Document Table
The images below show two Code Document Tables. The first table shows various reasons for not having children
across respondents with different educational levels. The second table adds a second variable (gender: male) and
shows the results for all male respondents across different educational levels.
GLOBAL FILTERS IN THE CODE DOCUMENT TABLE 397
9.0.0.214 (15.12.2021) ATLAS.ti 9 Windows - User Manual
412.
ATLAS.ti Networks
Video Tutorial:Visualizations in Building the Understanding
Visualization can be a key element in discovering connections between concepts, interpreting your findings, and
effectively communicating your results. Networks in ATLAS.ti allow you to accomplish all three of these important
objectives. These small segments of your larger web of analysis are modeled using the network editor, an intuitive
work space we also like to think is easy on the eye.
The word network is a ubiquitous and powerful metaphor found in many fields of research and application. Flow
charts in project planning, text graphs in hypertext systems, cognitive models of memory and knowledge
representation (semantic networks) are all networks that serve to represent complex information by intuitively
accessible graphic means. One of the most attractive properties of graphs is their intuitive graphical presentation,
mostly in form of two-dimensional layouts of labeled nodes and links.
In contrast with linear, sequential representations (e.g., text), presentations of knowledge in networks resemble
more closely the way human memory and thought is structured. Cognitive "load" in handling complex
relationships is reduced with the aid of spatial representation techniques. ATLAS.ti uses networks to help
represent and explore conceptual structures. Networks add a heuristic "right brain" approach to qualitative
analysis.
The user can manipulate and display almost all entities of a project as nodes in a network: quotations, codes, code
group, memos, memo groups, other networks, documents, document groups and all smart entities.
If you are interested in learning more about network theory and how it is applied in ATLAS.ti, you can watch the
following video: Did you ever wonder what's behind the ATLAS.ti network function.
ATLAS.TI NETWORKS 398
9.0.0.214 (15.12.2021) ATLAS.ti 9 Windows - User Manual
413.
Nodes And Links
Theterm network is formally defined within graph theory, a branch of discrete mathematics, as a set of nodes (or
"vertices") and links. A node in a network may be linked to an arbitrary number of other nodes.
The number of links for any one node is called its degree; e.g., a node with a degree of zero is not linked at all.
Another simple formal property of a network is its order: the number of its nodes. You may make practical use of
the degree of nodes by using it as a sorting criterion in the codes list window. The column 'Density' in the Code
Manager represents the degree of a code.
Directed and Non-Directed Links
Links are usually drawn as lines between the connected nodes in graphical presentations of networks.
Furthermore, a link between two nodes may be directed or not. A directed connection is drawn with an arrow. With
directed links, source and target nodes must be distinguished. The source node is where the link starts, and the
target node is where it ends: the destination to which the arrow points.
Links are created either implicitly (e.g., when coding a quotation, the quotation is "linked" to a code), or explicitly
by the user. See Linking Nodes.
Strictly speaking, code-quotation associations ("codings") also form a network . However, you cannot name these
links, the code is simply associated with a quotation through the act of coding. In a network you can visualize
these links. In ATLAS.ti all unnamed links are referred to as second class links, all named links are referred to as
first-class links.
First and Second-Class Links
First-class links are links based on relations. They are entities by themselves, with names, authors, comments,
and other properties. They are available for a code -code links and quotation-quotation links. The latter are also
called hyperlinks. See Working With Hyperlinks.
Second-class links are links that do not have individual properties; These are the links between quotations and
codes, all links to memos, all links between a group and its members.
Why Groups Cannot be Linked
Groups cannot be linked as by definition, they are not mutually exclusive. You can add a document to as many
document groups as you want. This also applies to code groups. A code can be a member of multiple code groups.
Groups are filters. Code groups are at times regarded by users as a higher order category, which they are not. See
Building a Code System for further detail.
In order to compare and analyze documents by certain criteria like socio-demographics, you add them to document
groups like gender::male / female, family status::single / married / separated / divorced, etc. This allows you also
NODES AND LINKS 399
9.0.0.214 (15.12.2021) ATLAS.ti 9 Windows - User Manual
414.
to combine certaincriteria, e.g. to run an analysis for all female respondents that are married. See Working with
document groups and Working with Smart Groups.
Likewise, the purpose of code groups is to be used as filters. A useful filter could be all codes of a category, but
also all codes that are relevant for a certain research questions, or all codes that could be classified as coding a
strategy, or a consequence or a context across different categories.
So you might have a code group containing codes A, B, C and D, and another code group containing codes B, D, E
and F. If you now were to relate these two code groups to each other, you end up with circular or illogical relations.
NODES AND LINKS 400
9.0.0.214 (15.12.2021) ATLAS.ti 9 Windows - User Manual
415.
Relations
ATLAS.ti allows youto establish named links to more clearly express the nature of the relationships between
concepts. With named links, you may express a sentence like "a broken leg causes pain" by two nodes (the source
node "broken leg" and the target node "pain") connected with a named link ("causes" or "is-cause-of").
The name of a link is displayed in the network editor as a label attached to the link midway between the two
connected nodes.
Six pre-set relations are available in ATLAS.ti. These standard relations can be substituted, modified, or
supplemented by user-defined relations.
Link vs. Relation
It is important to understand the difference between a relation (or a link type) and the link itself: There is only one
"is part of" relation, but potentially many links that can use it. Another way to think of links and relations is to
view links as instances of relations. Links are informed about the characteristics of relations, which define their
styles. If a characteristic of a relation is changed (e.g., line width, color, symbol), these changes are propagated to
all links using it.
ATLAS.ti Default Relations
The default relations that come with the software are listed in the table below. C1 and C2 are source and target
nodes, respectively.
Relation Name short name symbolic name width color Property
is-associated-with R == 1 Black Symmetric
is-part-of G [] 1 Black Transitive
is-cause-of N => 1 Black Transitive
contradicts A <> 1 Black Symmetric
is-a Isa 0 2 Black Transitive
noname 1 Black Symmetric
is-property-of P *} 1 Black Asymmetric
Some of these characteristics directly affect the display of links, while others affect processing (e.g., search
routines, automatic layout). A link between concepts is displayed in a network editor by a line with the relation's
label. You can choose from three different labels (name, short and symbolic). The relation property affects both
the display and processing capabilities of a relation. All transitive and asymmetric relations are symbolized in the
network editor with an arrow pointing toward the target code. Symmetric relations are displayed as a line with
two arrows pointing to both ends of the link.
The following properties are user-definable: the labels, the width and color of the line linking two nodes, the
property, and the preferred layout direction.
The preferred layout direction affects the layout of a network when opening an ad hoc network.
RELATIONS 401
9.0.0.214 (15.12.2021) ATLAS.ti 9 Windows - User Manual
416.
Formal Properties -Some Definitions
Symmetric Relationship
A relation R is symmetric if it holds for all A and B that are related via R. A is related to B if, and only if, B is related
to A.
Examples:
A is married to B (in most legal systems)
A is a fully biological sibling of B
A is a homophone of B
QDA Examples:
walking the talk is associated with role model
having a clear vision is related to performance orientation
communicating well is associated with empowerment
Transitives Relationship
If A has a relation R to B, and B has a relation R to C, then A has a relation R to C.
A typical transitive relation is the is-cause-of relation:
If C1 is-cause-of C2 and C2 is-cause-of C3, it follows that C1 is-cause-of C3. Transitive relations enable semantic
retrieval. See Available Operators > Semantic Operators.
Examples:
A is the same as B. B is the same as C. Hence a = c.
A is a descendant of B. B is a descendant of C. Hence, C is also a descendant of A.
A less than B. B less than C. Hence, a < c.
The following are examples for relations that are not transitive:
mother(x,y) is not a transitive relation
sister(x,y) is a transitive relation (if all are females)
brother (x,y) is a transitive relation (if all are males)
QDA Examples: In qualitative data analysis, transitive relations can occur, but more likely are asymmetric relations
(see below).
Context::nice weather results in happy people around me. Happy people around me results in I am a happy person.
Hence: context::nice weather results in I am a happy person.
At least this must be the conclusion if you are using a transitive relation.
•
•
•
•
•
•
•
•
•
•
•
•
RELATIONS 402
9.0.0.214 (15.12.2021) ATLAS.ti 9 Windows - User Manual
417.
Asymmetric Relations
A graphis asymmetric if:
for every edge, there is not an edge in the other direction, then the relation is asymmetric
loops are not allowed in an asymmetric digraph
If x has a relation R to y, but y does not have a relation R to x.
Examples:
Martin is a child of Marilyn: If Martin is the child of Marilyn, then Marilyn cannot be the child of Martin.
QDA Examples:
If we use the same example as above, but instead define the relation results in being an asymmetric one, then
you do not infer that nice weather is necessarily related to you being a happy person, or that you being a happy
person has any effect on the weather. The later would be the case if you used a symmetric relation.
The relations in the following example are defined as asymmetric relations: Supportive environment motivates
learning & development results in higher job satisfaction. This does not imply that a supportive environment
results in higher job satisfaction.
•
•
•
RELATIONS 403
9.0.0.214 (15.12.2021) ATLAS.ti 9 Windows - User Manual
418.
The Network Editor
Thenetwork editor offers an intuitive and powerful method to create and manipulate network structures. It favors
a direct manipulation technique: You can literally "grab" codes, quotations, memos, or other entities using your
cursor and move them around the screen as well as draw and cut links between them.
Networks have certain important characteristics:
Networks can be given names under which they are stored and accessed inside the project.
Networks can be commented.
Networks are displayed and edited in the network editor.
Networks allow individual layouts of the nodes.
As a node, a single entity can be a member of any number of networks.
An entity, e.g. a specific code, can only appear once in any network.
Networks allow for a flexible but logically consistent display of links and relations, so there are a few constraints to
keep in mind:
If code A is linked to code B using the relation is associated with, then every network that contains code A
and code B will necessarily include the relation is associated with between the two.
Furthermore, as only one link can exist between any two nodes at any given time, no network will display
any other relation between those two nodes.
•
•
•
•
•
•
•
•
THE NETWORK EDITOR 404
9.0.0.214 (15.12.2021) ATLAS.ti 9 Windows - User Manual
419.
If you wantto link code A and code B in different ways in different networks, you need to work with "dummy"
codes that modify a relation. For example:
A specific context X results in emotion A leading to behaviour B, then linking A to B directly would be false:
Emotion A ---- leading to ----> Behavior B
However, you can express it like this:
Emotion A ---- if ----> context X -----leading to -----> Behaviour B
'Context X' is a dummy code as it did not already exist in the code system. It needed to be added in order to
express a relationship that emerges while you were working with and interpreting the data.
In order to visualize such relationships, you have the option to create new codes in the network editor. These will
show up in your list of codes with 0 groundedness and a density of 1 or more, depending on their connectedness in
the network.
Node Types
The following object classes can be displayed and edited as nodes within the network editor.
Codes as Nodes
Codes are probably the most prominent objects in ATLAS.ti networks. They provide the main ingredients for
models and theories.
Memos as Nodes
Memos in networks are often an important supplement to code networks.
Several theoretical memos can be imported into a network to map out their relationship. The visual layout
provides comfortable territory for moving from memo to memo, in order to read and contemplate each individually
and the relationship(s) between them.
Documents as Nodes
Documents as nodes are useful for case comparisons paired with the option to add code neighbors.
Documents as nodes make a nice graphical content table for graphical documents when selecting the preview.
The icons for document nodes vary by media type.
Quotations As Nodes
Quotations and codes have one thing in common, which is different for the other entities. They can link to each
other (quotations to quotations and code to codes) with fully qualified "first class" links. See Nodes and Link.
THE NETWORK EDITOR 405
9.0.0.214 (15.12.2021) ATLAS.ti 9 Windows - User Manual
420.
The inclusion ofquotations in a network supports the construction and inspection of hyperlink structures. The
icons for quotation nodes vary by media type.
Groups as Nodes
Displaying groups, and their members in networks are useful to present all members that are part of the group.
The links between a group and its members are depicted by a dotted red line. The line property cannot be changed.
Network as Nodes
Networks as nodes allow the inclusion of networks in other networks. They cannot be linked to anything, but via
the context menu you can open the network in a separate network editor.
If you double-click on a network node, its comment is displayed and from there you can click to open it. This is for
instance useful if you are running out of space on your screen. Instead of trying to represent everything in one
network, you can create several networks that build on each other. Via a network node in a network, you can
continue to tell the story you want to tell.
THE NETWORK EDITOR 406
9.0.0.214 (15.12.2021) ATLAS.ti 9 Windows - User Manual
421.
Network View Options
Thedisplay characteristics of the nodes can be altered in a variety of ways.
To change the node or link style, select the View tab in a network editor.
Overview: If you select this option, a schematic overview of the network is shown.
Fit to Window: This option adjusts the network to fit the size of the currently opened network editor.
Grid: The grid helps you to position nodes.
Snap: Snapping allows an object to be easily positioned in alignment with grid lines, guide lines or another object,
by causing it to automatically jump to an exact position when the user drags it to the proximity of the desired
location.
Link Label: You can define three labels for each relation:
(relation) name
short name
symbolic name
See Creating & Modifying Relations. Depending on what you want to see in your network, you can switch the label
that is shown. If you change to a different label, this applies to all relations in the network.
Node Styles: Nodes can be displayed in four different styles:
simple
flat (default)
gradient
shadow
Instead of describing the various looks, go ahead and try out each style and select the one that you like best or
that is most suitable for the task at hand.
Some of these options you also find in the Layout/Style section in the main Network ribbon.
Style
Comments: If activated the comments of all nodes that have comments are displayed.
•
•
•
•
•
•
•
NETWORK VIEW OPTIONS 407
9.0.0.214 (15.12.2021) ATLAS.ti 9 Windows - User Manual
422.
Code-Document Connections: Attimes it is interesting to see which codes have been applied to a document, or a
document group. When coding the data, you apply codes to quotations, which are part of documents, but you do
not directly apply codes to a document. Therefore, there are no direct links between documents and codes. In
order to see those connections, you need to activate this option.
Code-Document and Code-Document Group connections are shown as blue lines.
Preview: You can activate a preview for documents, quotations and memos. Audio and video documents or
quotations can be played in the preview window. If you only want to see the preview of selected entities, right-
click the entity and select the Preview option from the context menu.
In ATLAS.ti Windows, there is no preview for audio and video quotations in networks.
Frequencies: If activated it displays the groundedness and density of code and memo nodes in the network.
Groundedness: It shows how many quotations are linked to a code or memo.
Density:
Number of code - code connections.
Number of codes and memos a memo is connected to.
Number of codes a quotation is coded to.
Show Node Icons: The node type icon can be switched on and off for all nodes. The small image used as a node
icon increases the distinctiveness of the nodes, especially when a mixture of node types exists in a network.
Nonetheless, when space runs low, you may prefer to switch off the icons.
•
•
◦
◦
◦
NETWORK VIEW OPTIONS 408
9.0.0.214 (15.12.2021) ATLAS.ti 9 Windows - User Manual
423.
Network Editor -Layout And Routing Options
You can select among twelve automatic layout options. The results of the automatic layout procedure are typically
quite usable and provide a good starting point for subsequent manual refinement. They can be combined with
four routing options that are responsible for an optimal placement of the links.
The Layout and routing options are available from the Network Editor via the main Network Tab, and the
View Tab. By moving nodes to different positions, you can modify an initial layout created by the
automatic layout procedure. For precision placement of nodes, use the Grid and Snap option under the
View Tab.
Layout Options
Perpendicular Layout: Orthogonal layouts allow the edges of the graph to run horizontally or vertically, parallel to
the coordinate axes of the layout. It produces compact drawings with no overlaps, few crossings, and few bends.
Orthogonal Tree Layout: Same as the standard perpendicular layout, but larger sub trees are processed using a
specialized tree layout algorithm, which is better suited for tree-like structures.
Circular Layout: The circular layout places the nodes on a circle, choosing carefully the ordering of the nodes
around the circle to reduce crossings and place adjacent nodes close to each other. It emphasizes group and tree
structures within a network. It creates node partitions by analyzing the connectivity structure of the network, and
arranges the partitions as separate circles. The circles themselves are arranged in a radial tree layout fashion. This
algorithm suits social network analysis quite well.
NETWORK EDITOR - LAYOUT AND ROUTING OPTIONS 409
9.0.0.214 (15.12.2021) ATLAS.ti 9 Windows - User Manual
424.
Circular Single CycleLayout: This is similar to the circular layout, only subgroups are not created and all nodes are
placed on a single circle. Useful for creating an overview and for shallow hierarchies.
Organic Layout: The organic layout style is based on the force-directed layout paradigm. When calculating a
layout, the nodes are considered to be physical objects with mutually repulsive forces, like, e.g., protons or
electrons. The connections between nodes also follow the physical analogy and are considered to be springs
attached to the pair of nodes. These springs produce repulsive or attractive forces between their end points if they
are too short or too long. The layout algorithm simulates these physical forces and rearranges the positions of the
nodes in such a way that the sum of the forces emitted by the nodes, and the edges reaches a (local) minimum.
Resulting layouts often expose the inherent symmetric and clustered structure of a graph, they show a well-
balanced distribution of nodes and have few edge crossings.
Radial Layout: When applying the radial layout style, the nodes of a graph are arranged on concentric circles. The
layout calculation starts by conceptually reducing the graph to a tree structure whose root node is taken as the
center of all circles. Each child node in this tree structure is then placed on the next outer circle within the sector of
the circle that was reserved by its parent node. All edges that were initially ignored are re-established, and the
radii of the circles are calculated taking the sector sizes needed by each whole sub tree into account. This layout
style is well suited for the visualization of directed graphs and tree-like structures.
Hierarchical Layout: The hierarchical layout style aims to highlight the main direction or flow within a directed
graph. The nodes of a graph are placed in hierarchically arranged layers such that the (majority of) edges of the
graph show the same overall orientation, for example, top-to-bottom. Additionally, the ordering of the nodes
within each layer is chosen in such a way that the number of edge crossings is small.
Hierarchical Layout (Top-Bottom): Prefers to place nodes downwards from top to bottom along directed
links.
Hierarchical Layout (Bottom-Top): Prefers to place nodes upwards from bottom to top along directed links.
Hierarchical Layout (Left-Right): Prefers to place nodes from left to right along directed links.
Hierarchical Layout (Right-Left: Prefers to place nodes from right to left along directed links.
Tree Layout: The tree layout is designed to arrange directed and non-directed trees that have a unique root node.
All children are placed below their parent in relation to the main layout direction. A child-parent relation in
ATLAS.ti is defined via a transitive. Before applying the layout all nodes compromising a strict tree are removed
and added after the tree layout by connecting them with curved edges. Tree layout algorithms are commonly used
for visualizing relational data. The layout algorithm starts from the root and recursively assigns coordinates to all
tree nodes. In this manner, leaf nodes will be placed first, while each parent node is placed centered above its
children.
Random Layout: Randomly places the nodes every time this layout is invoked.
•
•
•
•
NETWORK EDITOR - LAYOUT AND ROUTING OPTIONS 410
9.0.0.214 (15.12.2021) ATLAS.ti 9 Windows - User Manual
425.
Routing
The positions ofthe nodes in the network are not altered by rerouting the edges.
Orthogonal Routing: This is a versatile and powerful layout algorithm for routing a diagram's edges using vertical
and horizontal line segments only. The positions of the diagram's nodes will remain fixed. Usually, the routed
edges will not cut through any nodes or overlap any other edges.
Poly Line Edge Routing: Polyline edge routing calculates polyline edge paths for a diagram's edges. The positions
of the nodes in the diagram are not altered by this algorithm. Edges can be routed orthogonally, i.e., each edge
path consists of horizontal and vertical segments, or octilinear. Octilinear means that the slope of each segment
of an edge path is a multiple of 45 degree.
Organic Routing: This algorithm routes edges organically to ensure that they do not overlap nodes and that they
keep a specifiable minimal distance to the nodes. It is especially well suited for nonorthogonal, organic or cyclic
layout styles.
Straight Routing: Draw the links between nodes as straight lines without any consideration of node and edge
crossing.
The routing layout is not saved. If you close the network and open it again, the routing is lost, and you
have to select a routing option again. If you are happy with the layout and want to keep the network as it,
you need to export it.
NETWORK EDITOR - LAYOUT AND ROUTING OPTIONS 411
9.0.0.214 (15.12.2021) ATLAS.ti 9 Windows - User Manual
426.
Network Editor -Further Options
Changing Code Color
Select a code node. In the main network ribbon, click on the dropdown arrow below the
color palette and select a color.
Merge Codes
Select all code nodes that should be merged into another code. If you select multiple code
notes, hold down the Ctrl-key.
Select the Nodes tab and click on the Merge button. Move the mouse pointer to the node
with which you want to merge the selected code(s). You will see a light green frame around
this node. When you left-click on the node, all other selected code nodes will be merged.
NETWORK EDITOR - FURTHER OPTIONS 412
9.0.0.214 (15.12.2021) ATLAS.ti 9 Windows - User Manual
427.
Duplicate Codes
A duplicatedcode is an exact clone of the original code including color, comment, code-quotation links, code memo
links and code-code links. Duplicating a code can be a useful option to clean up or modify a code system.
Select one or more codes in a network, select the Nodes tab and from there Duplicate
Code(s) option. Duplicated codes have the same name plus a consecutive number, i.e. (2).
Create Groups
You can also create groups in networks. As everywhere else in the software, a group consists of entities of the
same type. Thus, you can create a document group base don document nodes, a code group based on code nodes,
a memo group based on memo nodes, and a network group based on network nodes. It is not possible to create a
group that contains different entity tpyes.
Select one or more nodes of the same entity type and click the New Group option in the
Nodes tab.
Enter a name for the group and click Create. The group will be added to the network, and
the linkages to its members are displayed.
Traversing Hyperlinks in Networks
To expand the hyperlinks you see in a network, or to see which other entities are linked to a hyperlinked quotation,
you can import its neighbors:
Right-click on a hyperlink and select Import Neighbors > Quotations.
NETWORK EDITOR - FURTHER OPTIONS 413
9.0.0.214 (15.12.2021) ATLAS.ti 9 Windows - User Manual
428.
Basic Network Procedures
Twomethods for creating networks are available. The first one creates an empty network, and you begin to add
entities as sequential steps. The other method creates a network from a selected entity and its neighbors.
Creating a New Network
In the Home tab open the drop-down menu for New Entities and select New Networks.
inst
Enter a name for the network and click Create. Another option is to open the Network
Manager with a click on the Networks button and select New Network in the ribbon of the
Network Manager.
Adding Nodes to
You can add nodes via the option Add Nodes or via drag-and-drop.
Adding Nodes Using the Selection List
Select the Nodes tab in the ribbon and from there the Add Nodes button.
This opens a selection list that is docked to the left-hand side of the network. At the
BASIC NETWORK PROCEDURES 414
9.0.0.214 (15.12.2021) ATLAS.ti 9 Windows - User Manual
429.
bottom of theselection list you see the comments of an entity. The search fields helps you
to find faster what you are looking for.
inst
Select the entity type and then the entities that you want to add to the network. Double-
click to add the entity to a network; or drag-and-drop the selected entities to the network;
or click on the Add button.
Adding Nodes via Drag &
You can add nodes by dragging entities into the network editor from entity managers, group managers, the
margin, the project explorer, or any of the browsers.
Open a network and position it for example next to the Project Explorer.
Select the node(s) you want to import into the network and drag-and-drop them into the
editor.
Selecting Nodes
Selecting nodes is an important first step for all subsequent operations targeted at individual entities within a
network.
Selecting a Single Node
Move the mouse pointer over the node and left-click.
All previously selected nodes are deselected.
Selecting Multiple Nodes
Method 1
Hold down the Ctrl key on your keyboard, move the mouse pointer over the node and left
click. Repeat this for every node you want to select.
Method 2
This method is very efficient if the nodes you want to select fit into an imaginary
rectangle.
Move the mouse pointer above and left to one of the nodes to be selected. Hold down the
left mouse button and drag the mouse pointer down and right to cover all nodes to be
selected with the selection marquee. Release the mouse button.
BASIC NETWORK PROCEDURES 415
9.0.0.214 (15.12.2021) ATLAS.ti 9 Windows - User Manual
430.
Opening Ad-hoc Networks
Anad-hoc network is when you open a network on an entity. This will show the entity in a network with all of its
directly linked neighbors, except when you open a network for a document or multiple items. In the latter two
cases, only the selected entities open in a network. More nodes can be added to such networks using different
techniques. See Adding Nodes To Network and Adding Neigbors.
OPENING AD-HOC NETWORKS 416
9.0.0.214 (15.12.2021) ATLAS.ti 9 Windows - User Manual
431.
Select an entityin the margin area, a manager, the project explorer or any browser, right-
click and select Open Network. Another option is to select the Open Network button in the
ribbon. It is available if you select an entity in a manager.
The nodes are initially placed using a default layout procedure, but can be rearranged manually or using any of the
other layout procedures. See Layout And Routing.
OPENING AD-HOC NETWORKS 417
9.0.0.214 (15.12.2021) ATLAS.ti 9 Windows - User Manual
432.
Each time anetwork is opened on a selected entity, a new network is created. There is no need to save it,
as you can easily display it at any time by opening it again. If, however, you rearranged the nodes and want
to preserve the new layout, or if you add or remove nodes, then you need to save it explicitly: To do so, in
the main Network ribbon select Save and enter a name for the network. Saved networks can be selected
from the Project Explorer, the Network Manager, and the Networks Browser.
OPENING AD-HOC NETWORKS 418
9.0.0.214 (15.12.2021) ATLAS.ti 9 Windows - User Manual
433.
Linking Nodes andEntities
There are several ways to link nodes:
Linking via Drag & Drop
Select a node. A white dot appears in the top left corner of the node. Click on the white dot
with the left mouse button and drag the mouse pointer to the node that you want to link.
Release the left mouse button on top of the node. If you link codes to codes or quotations
to quotations, a list of relation opens. Select a relation.
The two nodes are now linked to each other. In case you linked two codes or two quotations to each other, the
relation name is displayed above the line.
If none of the existing relations is suitable, select New Relation Type and create a new relation. The new
relation will immediately be applied to the link.
LINKING NODES AND ENTITIES 419
9.0.0.214 (15.12.2021) ATLAS.ti 9 Windows - User Manual
434.
Linking Two NodesUsing the Ribbon Icon
Select a node in a network and click on the Link button in the ribbon.
A black line appears. Move the end on top of another node and left-click.
If you link codes to codes or quotations to quotations, a list of relation opens. Select a
relation.
You need to use the method for linking if you want to link more than two nodes at a time.
When you link two codes to each other, the Density counts goes up. For instance, if six source codes are
linked to one target code, the density for the target code is 6; If the source codes have no other links, then
their density count is 1. The density count for memos counts the connection to other memos and codes. If
a memo is linked to two codes and one other memo, its density is 3.
Linking Three or More Nodes
Select all nodes that you want to link to one other node. See Basis Network Proecdures >
Selecting Nodes for further information on how to select multiple nodes.
In the ribbon, click on the Link button. A black line appears. Move the end on top of the
node you want the other nodes to be linked with and left-click. If you link codes to codes or
LINKING NODES AND ENTITIES 420
9.0.0.214 (15.12.2021) ATLAS.ti 9 Windows - User Manual
435.
quotations to quotations,a list of relation opens. Select a relation. Only one relation for all
links can be selected.
Editing a Link
Move the mouse pointer to the line and left-click. The selected link label will be displayed
boxed.
Right-click and open the context menu, or select the available options in the ribbon.
Open Network: opens a new network for the two nodes linked by this link.
Edit Comment: Use the comment field to explain why these two nodes are linked-
Flip Link: Use this option if you want to change the direction of a transitive or asymmetric link.
Cut Link: removes the link between the two nodes
Change Relation: Select a different relation from the list of available relations or create a new one and
apply it.
•
•
•
•
•
LINKING NODES AND ENTITIES 421
9.0.0.214 (15.12.2021) ATLAS.ti 9 Windows - User Manual
436.
For second classlinks that do not have a name, only the cut link option is available.
LINKING NODES AND ENTITIES 422
9.0.0.214 (15.12.2021) ATLAS.ti 9 Windows - User Manual
437.
Cutting Multiple Links
Selectone or more nodes (= source) whose connections to another node (= target) you
want to remove.
Click the Cut Links button in the ribbon and move the mouse pointer over the target node.
If you do the target node is boxed, and the links to be cut are colored in orange. Click the
left mouse button on the target node.
The links between nodes in a network are real connections between the entities. Therefore, creating and
removing links should not be regarded as solely "cosmetic" operations. Links make permanent changes to
the project.
Linking Codes to Codes, Quotations to Quotations, Memos to Memos in
Managers and Browsers
Quotations, codes and memos can also be linked to each other in the Manager, the Project Explorer, or the
respective entity browsers.
Select one or more source items in the list pane of the Manager, in the respective sub-
branches of the Project Explorer, or in the entity browsers and drag them to the target item
in the same pane.
Select a relation from the list of relations in case you link two codes or two quotations, or
select New Relation Type and create a new relation.
LINKING NODES AND ENTITIES 423
9.0.0.214 (15.12.2021) ATLAS.ti 9 Windows - User Manual
438.
Linking Entities ofDifferent Types
When you code your data reading through a document, listening to audio data, viewing an image or video file, you
are linking codes to quotations. This can also be done via drag & drop from the Project Explorer or any of the entity
browsers to the list of codes or quotations in a manager.
This also applies to linking memos to codes, or memos to quotations.
LINKING NODES AND ENTITIES 424
9.0.0.214 (15.12.2021) ATLAS.ti 9 Windows - User Manual
439.
Creating & ModifyingRelations
User-defined relations are available for code-code and quotation-quotation links. All other links cannot be named.
New relations are created in the Relation Manager. You can define how a relation should look like in terms of color,
width and line style. Further you can select the layout direction and the property. The property defines whether a
relation is directed (transitive, asymmetric), or non-directed (symmetric). See About Relations.
Creating New Relations
Go to the Home tab, click on the drop-down arrow in the Links button and select Relations.
Another option is to select the Relation Manager button in the ribbon of a network.
There are two Relations Managers, one for code-code relations and one for hyperlinks (quotation-quotation
relation):
On the left-hand side in the ribbon of the relation manager, select either Code-Code
Relations or Hyperlink Relations.
Click on the button New Relation.
Enter a name for the relation, select a color and a property. Then click Create. If you need
more information on relation properties, see About Relations.
CREATING & MODIFYING RELATIONS 425
9.0.0.214 (15.12.2021) ATLAS.ti 9 Windows - User Manual
440.
New relations arestored together with the project in which they are used. Thus, you can create a unique
set of relations for each project.
Editing Existing Relations
To modify an existing relation, open the Relation Manager: Go to the Home tab, click on the
drop-down arrow in the Links button and select Relations. Another option is to select the
Relation Manager button in the ribbon of a network.
On the left-hand side in the ribbon of the relation manager, select either Code-Code
Relations or Hyperlink Relations.
Select the relation that you want to modify and change its properties like the line color, the
line width, the line style, layout direction or property. You can also rename the relation. You
find all options in the ribbon of the Relation Manager.
If the relation you are modifying is already in use by the currently loaded project, the changes will take immediate
effect and are stored along with the project when saving it.
CREATING & MODIFYING RELATIONS 426
9.0.0.214 (15.12.2021) ATLAS.ti 9 Windows - User Manual
441.
Analytic Functions inNetworks
The add neighbors option allows you to construct a connected network step-by-step. It imports all direct
neighbors of the selected nodes into the network.
When applying it to document nodes, it is the visual equivalent to the Code Document Table.
When applying it to hyperlinks, it allows you to bring into a network all connected quotations.
When applying it to codes, you can successively bring in connected codes to support data modelling and
theory building.
The add co-occurring codes option is the visual equivalent of the Code Co-occurrence Tools. It allows you to
explore code co-occurrence spatially, which is different from looking at numbers in a table, and different from
exploring code co-occurrence in a Sankey diagram. The recommendation is to use these functions in combination
to look at data from different perspectives in the sense of a triangulation. For both options it is often useful to set
a global filter first as otherwise too many items are imported. This results in a very crowded network that might
look nice but is of little analytical value. See Applying Global Filters.
Add Node Neighbors
Select one or more nodes, right-click and select the option Add Neighbors from the context
menu and then the type of entity that you want to import. You also find the 'Add
Neighbors' option in the Nodes ribbon of the network editor.
Depending on the entity type, possible neighbors are:
Documents
Quotations
Codes
Memos
Groups
You will always see the complete list, but only applicable neighbors are shown in bold and can be selected. The
option all common imports only those that are applicable.
Application Example: Comparing Cases
Adding code neighbors to a document node, or a document group node allows creating case-based network. You
can ask questions like: Which of the codes have been applied in which document or document groups. ATLAS.ti
draws a blue lines between the codes, and the documents / document groups in which they occur. Make sure that
Show Code-Document Connections is selected in the View options.
•
•
•
•
•
•
•
•
ANALYTIC FUNCTIONS IN NETWORKS 427
9.0.0.214 (15.12.2021) ATLAS.ti 9 Windows - User Manual
442.
Adding codes todocument group nodes
Adding documents to code nodes
Code Co-Occurrence in Networks
Co-occurring codes are those that code the same or overlapping quotations. When importing co-occurring codes,
ATLAS.ti checks all five possible ways that a code can co-occur:
quotations coded with a code A overlap quotations coded with a code B
quotations coded with a code A are overlapped by quotations coded with a code B
quotations coded with a code A occur within quotations coded with a code B
•
•
•
ANALYTIC FUNCTIONS IN NETWORKS 428
9.0.0.214 (15.12.2021) ATLAS.ti 9 Windows - User Manual
443.
quotations coded witha code A enclose quotations coded with a code B
quotations coded with a code A code the same quotations coded with a code B
See Available Operators > Proximity Operators.
Select one or more codes in a network editor, right-click and select Add Co-occurring Codes.
This option is also available from the Nodes ribbon.
tip
In order to achieve meaningful results, it is often useful to set a code group as global filter
first. Think about which concepts you want to relate to each other and add those to a code
group. See Applying Global Filters.
If you have no idea which codes co-occur, and you first want to explore possible co-occurrences in your
data, the Code Co-occurrence Explorer is the more appropriate tool.
•
•
ANALYTIC FUNCTIONS IN NETWORKS 429
9.0.0.214 (15.12.2021) ATLAS.ti 9 Windows - User Manual
444.
Exporting Networks
Networks canbe saved as graphic file, or exported as XPS or PDF file, or printed.
Saving a Network as Graphic File
Open the network.
In the ribbon of the network, select the Export tab and then Export Bitmap.
When saving the file, you can choose among the following graphic file formats:
*.png
*.jpg
*.gif
*.tif
*.bmp
Saving a Network in the Microsoft XPS format
The XPS format is Microsoft’s alternative to PDF.
To save a network in the Microsoft XPS format, select the Export XPS option.
Saving a Network in PDF format
If you want to create a PDF file, a PDF writer needs to be installed on your computer (e.g. Adobe).
To create a PDF file from your network, select the Print option and chose your PDF Writer
as printer.
•
•
•
•
•
EXPORTING NETWORKS 430
9.0.0.214 (15.12.2021) ATLAS.ti 9 Windows - User Manual
445.
Team Work
The kindof team work supported is asynchronous shared coding and analyzing. This means if you have a lot of
data you can spread the coding work across different team members. Each team member codes parts of the data,
and the work of all coders is put together via merging the various sub projects.
Each team member needs to work on his or her copy of the project. The location where the project data for
each user is stored can be selected. However, this is always a personal, not a shared space. See Working
with ATLAS.ti Libraries.
When working on a team project, team members must not edit documents (unless everyone works in
different documents). If team members edit the same documents, these cannot be merged; instead they
are duplicated. If document editing is necessary, this needs to be done by the project administrator in the
Master project!
Workflow
The project administrator sets up a Master project. See Creating a New Project.
The project administrator adds documents to the project and possibly a list of codes.
The project administrator saves the project and exports it. This means creating a project bundle file
All team members import the project bundle file and begin their work.
To combine the work of all team members, each team member creates a project bundle file and sends it to
the project administrator.
1.
2.
3.
4.
5.
TEAM WORK 431
9.0.0.214 (15.12.2021) ATLAS.ti 9 Windows - User Manual
446.
The project administratormerges all sub projects and creates a new Master file.
The project administrator exports the new Master file and distributes it to all team members. See Transfer
Projects.
The team members continue their work.
This cycle continues. If new documents need to be added to the project, this needs to be done by the project
administrator. A good time for doing this is after merging and before creating the new Master file.
You find step-by-step instructions here:
for project administrators
for team members
Important to Know
If all team members should work on the same documents, it is essential that only the project administrator
is setting up the project adding all documents. Otherwise, the documents are duplicated or multiplied
during the process of merging. See Adding Documents.
Team members must not edit documents. If they do, the edited documents cannot be merged, and you end
up with duplicates. If document editing is necessary, this needs to be done by the project administrator in
the Master project!
The location of where ATLAS.ti stores project related data can be determined by each user. See Working
with ATLAS.ti Libraries.
Document libraries CANNOT be shared. Each person always works with her/his own copy of the data set
within her/his own environment of ATLAS.ti.
Our support team will reject any repair requests that are caused by attempts to share libraries.
6.
7.
8.
•
•
•
•
•
•
TEAM WORK 432
9.0.0.214 (15.12.2021) ATLAS.ti 9 Windows - User Manual
447.
User Accounts
ATLAS.ti automaticallycreates a user account based on the name that you use on your computer.
To check who is currently logged in:
Select the Tool tab and select Manage Users.
The currently logged-in user is displayed in bold letters:
Change the Current User
Select the Tool tab and select Manage Users.
Select the User you who should be indicted as creator /modifier in the project from this
moment onward and click Set as Current User.
USER ACCOUNTS 433
9.0.0.214 (15.12.2021) ATLAS.ti 9 Windows - User Manual
448.
Creating a newuser account
A reason for creating a new user account is if two persons on a team have the same name, or if you want to use a
different name than the automatically assigned name.
Select the Tools tab and select Manage Users.
Click on the button New User, enter a name and click Create.
After creating a new account, select the Switch User option from the ribbon to log in using the new name.
Switching user accounts
Select the Tools tab and select Switch Users.
Select another user from the list.
When merging projects that come from different computers and that use the same username, the
username will be duplicated, e.g., Tom and Tom (2). This means you can still distinguish the two users.
However, it may be a bit cumbersome to always remember who is who.
USER ACCOUNTS 434
9.0.0.214 (15.12.2021) ATLAS.ti 9 Windows - User Manual
449.
Merging Users
Reasons forwanting to merge users:
If you are using two computers, and you import a project from computer A into computer B, this results in
the duplication of your own username. ATLAS.ti adds a (2) behind the duplicate username.
You want to run and inter-coder agreement analysis and realize that there is something wrong with the
usernames of the coders.
To merge two users drag the username that you want to get rid of onto the username that
you want to keep.
•
•
USER ACCOUNTS 435
9.0.0.214 (15.12.2021) ATLAS.ti 9 Windows - User Manual
450.
Setting Up aTeam Project
When you work in a team with shared document and codes, you need to start with a MASTER project that
contains all documents and codes that you want to share with the team. See Work Flow. If all team
members start independently, you end up with duplicate documents and codes after merging the projects.
The
instructions are organized by the various tasks involved when working in a team. Below you find operating
instructions for project administrator. For team member instructions, see Tasks for Team Members.
Tasks of the Project Administrator
Creating and distributing the project
If you open ATLAS.ti, select the New Project button from the Welcome Screen.
Alternatively:
If a project is already open, select File > New > Create New Project.
Inst
Enter a project name and click Create.
Next, add everything that should be shared by the team:
add documents. See Adding documents to a project.
create document groups. See Working with groups.
•
•
SETTING UP A TEAM PROJECT 436
9.0.0.214 (15.12.2021) ATLAS.ti 9 Windows - User Manual
451.
add codes andcode groups. You can prepare a list of codes including code descriptions, code groups and
colors in Excel and import the Excel file. See Importing A List Of Codes.
If a common set of codes and code groups is to be used, they must be added to the project at this stage. If
each team member were to add codes and code groups individually to each sub-project, all codes and
groups are multiplied during the merge.
To save a project, click on the Save icon in the Quick Access toolbar, or select File > Save
(Short-cut: Ctrl+S).
Inst
To export the project for distribution to all team member, select File > Export. See also
Project Transfer.
Inst
Distribute the project bundle file to all team members: e.g. via email, a folder on a server
that everyone can access, or also via a cloud link or cloud folder.
The project bundle file shows the ATLAS.ti icon, has the file extension .atlproj and can be read by both ATLAS.ti
Windows and Mac. The default name of the bundle is the
project name + author and date. Renaming the bundle does not change the name of the project contained within
the bundle. Think of the project bundle file as a box that contains your ATLAS.ti project plus all documents that
you want to analyze. Putting a different label on the outside of the box will not change the name of the project
file, which is contained inside the box. Ask each team member to change the name of the project file when
importing the project bundle, i.e. adding their name or initial to the project name, so that the projects of the
various team members can easily be identified.
Project bundle files can be shared via a cloud services like Dropbox, OneDrive, GoogleDrive, etc. Another
option is to upload the project bundle file to a server of your choice and send a link to all team members so
that they can download the file.
•
SETTING UP A TEAM PROJECT 437
9.0.0.214 (15.12.2021) ATLAS.ti 9 Windows - User Manual
452.
Team Project: Tasksfor Team Members
As a team member you must not edit documents in a team project. If you do, the document cannot be
merged later on, instead it will be duplicated. If text needs to be modified, this needs to be done in the
Master Project by the project administrator.
ATLAS.ti automatically creates a user account based on your computer login when you start ATLAS.ti.
Check your user name before you start working. Is this the name you want to use in the
team project? If not, modify the name or create a new user account and log in with the new
account. See User Accounts.
As team member, you receive a project bundle from the project administrator.
Save the project bundle file on your computer, or personal space on a server.
Open ATLAS.ti and select the Import Project button. If another project is currently open,
select File > New > Import Project.
inst
Rename the project by adding your name or initials to the project name. This is important
for the project administrator later when he or she merges the projects of all team
members. If you forget this step, see below how you can rename a project after having
imported it.
TEAM PROJECT: TASKS FOR TEAM MEMBERS 438
9.0.0.214 (15.12.2021) ATLAS.ti 9 Windows - User Manual
453.
If this isthe second or third time around that you import the Master project, the project
name with the added coder name/initials already exists. ATLAS.ti will recognize this and
offers the following two choices:
Keep current project as a snapshot.
Overwrite existing project.
As you previously exported your project to send it to the project administrator, you already have a backup of your
project. Therefore, it will be OK in most cases to overwrite the existing project.
Make the appropriate choice and click Import.
After you have done some work on the project, you need to send it back to the project administrator for merging.
This is what you need to do:
Select File > Export > Project Bundle. See Project Transfer.
The name of the exported bundle file will include your user name and the date, e.g. 'Project
X_Tom (TM 2020-04-30)'.
Continue the cycle of project exchange and merging between project administrator and
team members as needed.
Renaming Projects after Import
If you forgot to rename the project when importing it, you can change the name after it has been imported. You
need to do this in the opening screen after starting ATLAS.ti or after closing all projects.
•
•
TEAM PROJECT: TASKS FOR TEAM MEMBERS 439
9.0.0.214 (15.12.2021) ATLAS.ti 9 Windows - User Manual
454.
On the openingscreen, right click on the project that you want to rename and select
Rename Project.
If the project is already open, you need to close it to return to the opening screen.
TEAM PROJECT: TASKS FOR TEAM MEMBERS 440
9.0.0.214 (15.12.2021) ATLAS.ti 9 Windows - User Manual
455.
Merging Projects
The Masterproject is the project into which another project, called the Import project is merged. The Master
project has to be loaded first before invoking the Merge Project option.
The default option is to unify all entities that are identical, and to add all other items that do not yet exist in the
Master project.
You can only merge ATLAS.ti desktop and ATLAS.ti Web projects if the projects contain different
documents and codes!
Identical Entities Explained
When an entity is created in ATLAS.ti - regardless if it is a document, a code, a quotation, a memo, a network, a
group, or a comment - this entity receives a unique ID, comparable to a fingerprint.
When merging projects, ATLAS.ti compares the IDs of the various entities. If they have the same ID, they are
unified. If the ID is not the same, they are added. Thus, the name of an entity is not the decisive factor.
For example: If a user Tom has created a code with the name sunshine, and a user Anne also has created a code
with the same sunshine in her project, these two codes are not identical as they have been created on different
computers and in different project. Therefore, they will have a different ID.
If you merge Tom's and Anne's project, the merged project will contain two codes: sunshine and sunshine (2). If the
meaning of both codes is the same, and you want to keep one sunshine code only, you can merge the two codes
manually. See also Housekeeping below.
Groups are Additive
A Group B with documents {1, 2, 3} in the Master project merged with a Group B containing documents {3, 4} in the
Import project will result in Group B= {1, 2, 3, 4}) in the merged project.
MERGING PROJECTS 441
9.0.0.214 (15.12.2021) ATLAS.ti 9 Windows - User Manual
456.
Entities with andwithout Comments
If there is a code C in the Master project that has no comment, and a code C in the Import project that has a
comment, the merged procedure will add this comment to the merged project.
In the case of an unsolvable conflict - code C in the Master project has a comment, and code C in the Import project
also has a comment - the user can define which of the two conflicting entities will win.
MERGING PROJECTS 442
9.0.0.214 (15.12.2021) ATLAS.ti 9 Windows - User Manual
457.
If the commentof the Master project should be kept, you need to select the option Keep. If the comment of the
Import project should be kept, you need to select the option Override.
Currently you can only decide for all conflicts whether the Master project should "win", or the import
project.
Handling of Deleted Entities
It is not possible to "subtract" entities.
If one team member has deleted a code or some codings, and these entities still exist in another project, the
merged project will contain those codes or codings again.
MERGING PROJECTS 443
9.0.0.214 (15.12.2021) ATLAS.ti 9 Windows - User Manual
458.
If you wantto clean up a project, this is best done in a fresh Master-project after merging and before distributing
the new Master-file to all team members.
MERGING PROJECTS 444
9.0.0.214 (15.12.2021) ATLAS.ti 9 Windows - User Manual
459.
How to Merge
TheMerge Tool reunites projects that were originally divided for analytical or economic reasons. It brings together
the contributions of different members of a research team.
Before you merge, the recommendation is that you import all project bundle files first and take a look at
the projects. If a conflict arises during the process of merging, you need to decide whether to keep the
version in the Master or the Import project. If you do not know what is contained in import project, you
cannot make an informed decision. Principally, it is possible to merge project bundle files without
importing them prior to merging.
To begin the merge process:
Open the Master project.
Select File > Merge.
You have the option to select either a project, or a project bundle file.
If you have previously imported the bundle files of all team members, select Merge Project,
otherwise Merge Project Bundle.
Select a project from the list offered by ATLAS.ti, or load a project bundle file.
If you have a long list of projects, just enter the first few letters of the project name into the Search field.
HOW TO MERGE 445
9.0.0.214 (15.12.2021) ATLAS.ti 9 Windows - User Manual
460.
You have theoption to create a snapshot of the current project before merging. There may be times, when you
want or need to go back to an older version of your project. The default name for snapshot project is: project name
(Snapshot--date-time).
After selecting a project or project bundle, click on the Merge button.
ATLAS.ti checks the two projects for identical and different items. After this process is completed, you see a Pre-
Merge Summary.
If there are no conflicts, you can proceed with merging the two projects by clicking Merge.
HOW TO MERGE 446
9.0.0.214 (15.12.2021) ATLAS.ti 9 Windows - User Manual
461.
If there areconflicts between the Master project, and the project that you import, you can solve the conflict in two
ways:
Keep: the Master project 'wins', and the changes made in the Import project are ignored.
Override: the version in the Master project will be overridden, and the changes made in the Import project
'win'. If all team members have been coding different documents, merge conflicts are unlikely to occur.
A conflict could arise, for instance, if someone changed the code colour, comment or code name. As project
administrator, you will have to decide whether to accept these changes or not. In the example below the code color
for a number of codes and two code labels are different in the Master and Import project. The project
administrator has decided to keep the changes from the import project and selected Override. All entries in the
column Import are shown in bold as this is what will used in the merged project.
•
•
HOW TO MERGE 447
9.0.0.214 (15.12.2021) ATLAS.ti 9 Windows - User Manual
462.
HOW TO MERGE448
9.0.0.214 (15.12.2021) ATLAS.ti 9 Windows - User Manual
463.
You currently cannotchose for each conflict how to solve it. All conflicts need to be solved by either
selecting the strategy 'keep', or the strategy 'override'.
inst
After merging, check the final merge report, and the merged project for plausibility. If you are satisfied
with the results, save the project. If not, you can always select Undo.
If applicable, continue with merging the next sub-project or project bundle file.
A common mistake is that team members set up their own projects, adding documents and codes. This
will result in duplicated documents and codes after merging. Issues around duplicated codes you can solve
yourself by merging those codes (see below Housekeeping). You can however not merge duplicated
documents. Please follow the recommended workflow described under Team Work.
HOW TO MERGE 449
9.0.0.214 (15.12.2021) ATLAS.ti 9 Windows - User Manual
464.
Housekeeping
After merging allprojects, the project administrator may need to perform some housekeeping work, such as:
cleaning up the code list
adding or modifying code groups
adding a memo with information for the team
adding new documents and document groups
Merging Duplicate Codes
You need to do some housekeeping if you find duplicate codes in the merged project. This can happen, for
instance, if team members independently have added codes that have the same name. As these codes have been
created in different projects, they have different IDs and therefore they are added, not merged. The naming
convention for duplicate codes is as follows:
code A
code A (2)
Duplicate codes can be merged as follows:
Open the Code Manager. Highlight the codes that you want to merge, right click and select
the Merge Codes option from the context menu, or click on the Merge Codes button in the
ribbon.
Merging Users
If you realize that usernames have been duplicated during the merge process, you can merge them as follows:
Select the Tools tab and from there Manage Users.
To merge two users drag the username that you want to get rid of onto the username that
you want to keep.
•
•
•
•
•
•
HOW TO MERGE 450
9.0.0.214 (15.12.2021) ATLAS.ti 9 Windows - User Manual
465.
Inter-coder Agreement (ICA)
Youcan test inter-coder agreement in text, audio and video documents. Image documents are not
supported. This also applies to image quotations in text PDF documents.
As you need to start from a common Master project when setting up a project for ICA analysis, you cannot
check for inter-coder agreement if one of the coders is using the Web version. All coders need to use the
desktop version (Mac or Windows). For a more detailed explanation, see Merging Projects.
Why It Matters
The purpose of collecting and analyzing data is that researchers find answers to the research questions that
motivated the study in the first place. Thus, the data are the trusted ground for any reasoning and discussion of
the results. Therefore, the researchers should be confident that their data has been generated taking precaution
against distortions and biases, intentional or accidental, and that the mean the same thing to anyone who uses
them. Reliability grounds this confidence empirically (Krippendorff, 2004).
Richards (2009) wrote: "But being reliable (to use the adjective) beats being unreliable. If a category is used in
different ways, you will be unable to rely on it to bring you all the relevant data. Hence, you may wish to ensure that
you yourself are reliably interpreting a code the same way across time, or that you can rely on your colleagues to use
it in the same way" (p. 108).
There are two ways to rationalize reliability, one routed in measurement theory, which is less relevant for the type
of data that ATLAS.ti users have. The second one is an interpretivist conception of reliability. When collecting any
type of interview data or observations, the phenomena of interest usually disappears right after it has been
recorded or observed. Therefore, the analyst's ability to examine the phenomena relies heavily on a consensual
reading and use of the data that represent the phenomena of interest. Researchers need to presume that their
data can be trusted to mean the same to all of their users.
This means "that the reading of textual data as well as of the research results is replicable elsewhere, that
researchers demonstrably agree on what they are talking about. Here, then, reliability is the degree in which
members of a designated community agree on the readings, interpretations, responses to, or uses of given texts or
data. [...] Researchers need to demonstrate the trustworthiness of their data by measuring their reliability"
(Krippendorff, 2004, p. 212).
Testing the reliability of the data is a first step. Only after establishing that the reliability is sufficiently high, it
makes sense to proceed with the analysis of the data. If there is considerable doubt what the data mean, it will be
difficult to justify the further analysis and the results of this analysis.
ATLAS.ti's inter-coder agreement tool lets you assess the agreement of how multiple coders code a given body of
data. In developing the tool we worked closely together with Prof. Klaus Krippendorff, one of the leading experts
in this field, author of the book Content Analysis: An Introduction of Its Methodology, and the originator of the
Krippendorff's alpha coefficient for measuring inter-coder agreement.
INTER-CODER AGREEMENT (ICA) 451
9.0.0.214 (15.12.2021) ATLAS.ti 9 Windows - User Manual
466.
The need forsuch a tool as an integrated element in ATLAS.ti has long been evident and has been frequently
requested by users. By its nature, however, it could not and cannot be a magic "just click a button and hope for the
best" solution kind of tool. If you randomly click on any of the choices that ATLAS.ti offers to calculate an inter-
coder agreement coefficient, ATLAS.ti will calculate something. Whether the number you receive will be
meaningful and useful depends on how you have set up your project and the coding.
This means if you want to test for inter-coder agreement, it requires at least a minimal willingness to delve into
the basic theoretical foundations of what inter-coder agreement is, what it does and can do, and what it cannot
do. In this manual, we provide some basics, but this cannot be a replacement for reading the literature and coming
to understand the underlying assumptions and requirements for running an inter-coder agreement analysis.
Please keep in mind that the inter-coder agreement tool crosses the qualitative-quantitative divide. Establishing
inter-coder agreement has its origin in quantitative content analysis (see for instance Krippendorff, 2018; Schreier,
2012). If you want to apply it and want to adhere to scientific standards, you must follow some rules that are
much stricter than those for qualitative coding.
If you want to develop a code system as a team, yes, you can start coding independently and then see what you
get. But this approach can only be an initial brainstorming at best. It cannot be used for testing inter-coder
agreement.
A good time for checking inter-coder agreement is when the principal investigator has built a stable code system
and all codes are defined. Then two or more additional coders that are independent of the person who developed
the code system code a sub-set of the data. This means, this is somewhere in the middle of the coding process.
Once a satisfactory ICA coefficient is achieved, the principal investigator has the assurance that his or her codes
can be understood and applied by others and can continue to work with the code system.
Literature
Guba, Egon G. and Lincoln, Yvonna S. (2005). Competing paradigms in qualitative research, in Denzin, N. and
Lincoln, Y.S. (eds) The Sage Handbook of Qualitative Research, 191–225. London: Sage.
Harris, Judith, Pryor, Jeffry and Adams, Sharon (2006). The Challenge of Intercoder Agreement in Qualitative
Inquiry. Working paper.
Krippendorff, Klaus (2018). Content Analysis: An Introduction to Its Methodology. 4th edition. Thousand Oaks, CA:
Sage.
MacPhail, Catherine, Khoza, Nomhle, Abler, Laurie and Ranganathan, Meghna (2015). Process guidelines for
establishing Intercoder Reliability in qualitative studies. Qualitative Research, 16 (2), 198-212.
Rolfe, Gary (2006). Validity, trustworthiness and rigour: quality and the idea of qualitative research.
Methodological Issues in Nursing Research, 304-310.
Richards, Lyn (2009). Handling Qualitative Data: A Practical Guide, 2nd edn. London: Sage.
Schreier, Margrit (2012). Qualitative Content Analysis in Practice. London: Sage.
INTER-CODER AGREEMENT (ICA) 452
9.0.0.214 (15.12.2021) ATLAS.ti 9 Windows - User Manual
467.
ICA - RequirementsFor Coding
If you are not yet familiar with the coding process in ATLAS.ti, please see Coding Data
Sources for unreliable data are intra-coder inconsistencies and inter-coder disagreements.
To detect these, the coding process needs to be replicated. Replicability can be assured when several
independently working coders (at least two) agree:
on the use of the written coding instruction
by highlighting the same textual segments to which the coding instructions apply
by coding them using the same codes, or by identifying the same semantic domains that describe them
and code them using the same codes for each semantic domain.
Semantic Domains
A semantic domain is defined as a set of distinct concepts that share common meanings. You can also think about
them as a category with sub codes.
Examples of semantic domains are:
EMOTIONS
emotions: joy
emotions: excitement
emotions: surprise
emotions: sadness
emotions: anger
emotions: fear
STRATEGIES
strategies: realize they are natural
strategies: have a Plan B
strategies: adjust expectations
strategies: laugh it off
strategies: get help
ACTOR
actor: partner
actor: mother
actor: father
actor: child
actor: sibling
actor: neighbour
actor: colleague
•
•
•
•
•
•
•
•
•
•
•
•
•
•
•
•
•
•
•
•
•
ICA - REQUIREMENTS FOR CODING 453
9.0.0.214 (15.12.2021) ATLAS.ti 9 Windows - User Manual
468.
Each semantic domainembraces mutually exclusive concepts indicated by a code. If you code a data segment
with 'emotions: surprise', you cannot code it also 'emotions: fear'. If both are mentioned close to each other, you
need to create two quotations and code them separately. You can however apply codes from different semantic
domains to one quotation. See multi-valued coding below.
Semantic domains are context dependent
At times, it might be obvious from the domain name what the context is. The sub code 'good listener' in the
image above belongs to the context 'Characteristics (of friendschip)', and it is not about conversations with work
colleagues. If the context is still unclear and could be interpreted in different ways, you need to make it
unambiguous in the code definition.
Semantic domains need to be conceptually independent
Conceptual independence means:
a sub code from one domain is only specific for this domain. It does not occur in any other domain.
thus, each code only occurs once in the code system
This is also a rule that you should generally apply when building a code system. See Developing a Code System.
Therefore, as semantic domains are logically or conceptually independent of each other, it is possible to apply
codes from different semantic domains to the same or overlapping quotations. For instance, In a section of your
data, you may find something on the benefits of friendship, and some emotional aspects that are mentioned. As
these codes come from different semantic domains (BENEFITS and EMOTIONS), they can both be applied.
•
•
ICA - REQUIREMENTS FOR CODING 454
9.0.0.214 (15.12.2021) ATLAS.ti 9 Windows - User Manual
469.
Developing the CodeSystem and Semantic Domains
Semantic domains can be developed deductively or inductively. In most studies applying a qualitative data analysis
approach, development is likely to be inductive. This means, you develop the codes while you read the data step by
step. For example, in an interview study about friendship, you may have coded some data segments 'caring for
each other', 'supporting each other' and 'improve health and longevity'. Then you realize that these codes can be
summarized on a higher level as 'BENEFITS OF FRIENDSHIP'. Thus, you set up a semantic domain BENEFITS with
the sub codes:
benefits: caring for each other
benefits: supporting each other
benefits: improve health and longevity
You continue coding and come across other segments that you code 'learning from each other'. As this also fits
the domain BENEFITS, you add it to the domain by naming it:
benefits: learning from each other
And so on. This way you can build semantic domains step by step inductively while developing the code system.
Once the code system is ready, and the code definitions are written in the code comment fields, you can prepare
the project for inter-coder agreement testing. At this stage, you can no longer expand a semantic domain. See
Project Setup.
When developing a code system, the aim is to cover the variability in the data so that no aspect that is relevant for
the research question is left-out. This is referred to as exhaustiveness. On the domain level this means that all
main topics are covered. On the sub code level, this means that the codes of a semantic domain cover all aspects
of the domain, and the data can be sorted in the available codes without forcing them. An easy way out is to
include a catch all 'miscellaneous' code for each domain into which coders can add all data that they think does not
fit anywhere else. However, keep in mind that such catch-all codes will contribute little to answering the research
questions.
Rules for Applying Codes
codes from one domain need to be applied in a mutually exclusive manner.
codes from multiple semantic domains can be applied to the same or overlapping data segments.
Mutual exclusiveness: You can only apply one of the sub codes of a semantic domain to a quotation or to
overlapping quotations. Using the same code colour for all codes of a semantic domain will help you to detect
possible errors.
If you find that you have coded a quotation with two codes from the same semantic domain, you can fix it by
splitting the quotation. This means, you change the length of the original quotation and create one new
quotation, so you can apply the two codes to two distinct quotations.
•
•
•
•
•
•
ICA - REQUIREMENTS FOR CODING 455
9.0.0.214 (15.12.2021) ATLAS.ti 9 Windows - User Manual
470.
If codes withina semantic domain are not applied in a mutually exclusive manner, the ICA coefficient is
inflated - and in the current implementation of the tool cannot be calculated!
Multi-Valued Coding: This means that you can apply multiple codes of different semantic domains to the same
quotation. For instance, a respondent talks about anger in dealing with her mother and mentions that she had to
adjust expectations, this can be coded with codes from the three semantic domains EMOTIONS; ACTOR and
STRATEGIES.
Coding with codes from multiple semantic domains will allow you to see how the various semantic domains are
related for other analyses than inter-coder agreement. For example, what kind of emotions are mentioned in
relation to which actor and which strategies are used to deal with them. For this you can use the code co-
occurrence tools. See Code Co-Occurrence Tools.
Instructions for Coders
An important requirement for inter-coder agreement analysis is the independence of the coders. Thus, the person
who has developed the code system cannot be one of the coders whose coding goes into the ICA analysis. In
addition to the principal investigator who develops the code system, two or more persons are needed who apply
the codes.
The coders will receive a project bundle file from the principal investigator (see Project Setup). It is recommended
to provide the coders with the following instruction:
When importing the project that you receive from the principal investigator, add your name or initials to the
project name.
•
ICA - REQUIREMENTS FOR CODING 456
9.0.0.214 (15.12.2021) ATLAS.ti 9 Windows - User Manual
471.
After opening theproject, double check your user name.
Apply all codes of a semantic domain in a mutual exclusive manner.
If fitting you can apply codes from multiple semantic domains to the same or overlapping quotations.
Do not make any changes to the codes - do not alter the code definition, do not change the code name, or
the code color.
If you do not understand a code definition, or find a code label not fitting, create a memo and name it
'Comments from coder name'. Write all of your comments, issues you find and ideas you have into this
memo.
Do not consult with other coders. This is important for your coding to remain unbiased. The data must be
coded by all coders independently.
Once you are done coding, create a project bundle file and send it back to the principal investigator.
•
•
•
•
•
•
•
ICA - REQUIREMENTS FOR CODING 457
9.0.0.214 (15.12.2021) ATLAS.ti 9 Windows - User Manual
472.
How Agreement andDisagreement is Measured
The coefficients that are available measure the extent of agreement or disagreement of different coders.
Based on this measure one can infer reliability, but the coefficients do not measure reliability directly.
Therefore: what is measured is inter-coder agreement and not inter-coder reliability.
Agreement is what we measure; reliability is what we infer from it.
Suppose two coders are given a text and code it following the provided instructions. After they are done, they give
you the following record of their coding:
There is agreement on the first pair of segments in terms of length and location (agreement: 10 units).
On the second pair they agree in length but not in location. There is agreement on an intersection of the
data (agreement; 12 units, disagreement: 2 + 2 units).
In the third pair, coder 'A' finds a segment relevant, which is not recognized by coder 'B' (disagreement: 4
units).
The largest disagreement is observed in the last pair of segments. Coder 'A' takes a narrower view than
coder 'B' (agreement: 4 units, disagreement: 6 units).
In terms of your ATLAS.ti coding, you need to think of your document as a textual continuum. Each character of
your text is a unit of analysis for ICA, starting at character 1 and ending for instance at character 17500. For audio
and video documents, the unit of analysis is a second. Images can currently not be used in an ICA analysis.
The quotation itself does not go into the analysis, but the characters or seconds that have been coded. In other
words, if each coder creates quotations, it is not a total disagreement if they have not highlighted the exact same
segment. The part of the quotations that overlap go into the analysis as agreement; the other parts as
disagreement.
Another option is to work with pre-defined quotations. So that coders only need to apply the codes. For more
information see Project Setup.
You can test inter-coder agreement in text, audio and video documents. Image documents are not
supported. This also applies to image quotations in text PDF documents.
•
•
•
•
HOW AGREEMENT AND DISAGREEMENT IS MEASURED 458
9.0.0.214 (15.12.2021) ATLAS.ti 9 Windows - User Manual
473.
Example Application
Why aremany business instilling a DevOps culture into their organization? written by: Jessica Diaz, Daniel López-
Fernández, Jorge Perez and Ángel González-Prieto.
HOW AGREEMENT AND DISAGREEMENT IS MEASURED 459
9.0.0.214 (15.12.2021) ATLAS.ti 9 Windows - User Manual
474.
Methods For TestingICA
“An inter-coder agreement coefficient measures the extent to which data can be trusted to represent the
phenomena of analytical interest that one hopes to analyze in place of the raw phenomena” (Krippendorff,
2019).
ATLAS.ti currently offers three methods to test inter-coder agreement:
Simple percent agreement
Holsti Index
Krippendorff's family of alpha coefficients.
All methods can be used for two or more coders. As the percent agreement measure, and the Holsti index do not
take into account chance agreement, we recommend the Krippendorff alpha coefficients for scientific reporting.
Percent Agreement
Percentage Agreement is the simplest measure of inter-coder agreement. It is calculated as the number of times
a set of ratings are the same, divided by the total number of units of observation that are rated, multiplied by 100.
The benefits of percentage agreement are that it is simple to calculate, and it can be used with any type of
measurement scale. Let's take a look at the following example: There are ten segments of text and two coders
only needed to decide whether a code applies or does not apply:
Example Coding of Two Coders
Segments 1 2 3 4 5 6 7 8 9 10
Coder 1 1 1 0 0 0 0 0 0 0 0
Coder 2 0 1 1 0 0 1 0 1 0 0
1 = agreement, 0 = disagreement
This is how you calculate it:
PA = 6 / 10
PA = 0.6 = 60%
Coder 1 and 2 agree 6 out of 10 times, so percent agreement is 60%.
•
•
•
METHODS FOR TESTING ICA 460
9.0.0.214 (15.12.2021) ATLAS.ti 9 Windows - User Manual
475.
One could arguethat this is quite good. This calculation, however, does not account for chance agreement
between ratings. If the two coders were not to read the data and would just randomly coding the 10 segments. we
would expect them to agree a certain percentage of the time by chance alone. The question is: How much higher is
the 60% agreement over the agreement that would occur by chance?
The agreement that is expected by mere chance is 56% = (9.6 +1.6)/20. If you are interested in the calculation,
take a look at Krippendorff (2004, p. 224-226. The 60% agreement now does not look so impressive after all.
Statistically speaking, the performance of the two coders is equivalent to having arbitrarily assigned 0s and 1s to 9
of the 10 segments, and only 1 of the 10 segments is reliably coded.
For calculating percent agreement you can add single codes in place of semantic domains.
Holsti Index
The Holsti index (Holsti, 1969) is a variation of the percent agreement measure for situations where coders do not
code precisely the same data segment. This is the case if coders set their own quotations/. Like Percent
Agreement, also the Holsti index does not take into account chance agreement.
The formula for the Holsti Index is:
The results for Percentage agreement and the Holsti Index are the same when all coders code the same data
segments.
Cohen's Kappa
We acknowledge that Cohen’s Kappa is a popular measure, but we opted for not implementing it because of the
limitations identified in the literature.
*"It is quite puzzling why Cohen’s kappa has been so popular in spite of so much controversy with it. Researchers
started to raise issues with Cohen’s kappa more than three decades ago (Kraemer, 1979; Brennan & Prediger, 1981;
Maclure & Willett, 1987; Zwick, 1988; Feinstein & Cicchetti, 1990; Cicchetti & Feinstein, 1990; Byrt, Bishop & Carlin,
1993). In a series of two papers, Feinstein & Cicchetti (1990) and Cicchetti & Feinstein (1990) made the following
two paradoxes with Cohen’s kappa well-known: (1) A low kappa can occur at a high agreement; and (2) Unbalanced
marginal distributions produce higher values of kappa than more balanced marginal distributions. While the two
paradoxes are not mentioned in older textbooks (e.g. Agresti, 2002), they are fully introduced as the limitations of
kappa in a recent graduate textbook (Oleckno, 2008). On top of the two well-known paradoxes aforementioned,
Zhao (2011) describes twelve additional paradoxes with kappa and suggests that Cohen’s kappa is not a general
measure for interrater reliability at all but a measure of reliability under special conditions that are rarely held.
Krippendorff (2004) suggests that Cohen’s Kappa is not qualified as a reliability measure in reliability analysis
since its definition of chance agreement is derived from association measures because of its assumption of raters’
METHODS FOR TESTING ICA 461
9.0.0.214 (15.12.2021) ATLAS.ti 9 Windows - User Manual
476.
independence. He arguesthat in reliability analysis raters should be interchangeable rather than independent and
that the definition of chance agreement should be derived from estimated proportions as approximations of the
true proportions in the population of reliability data. Krippendorff (2004) mathematically demonstrates that
kappa’s expected disagreement is not a function of estimated proportions from sample data but a function of two
raters’ individual preferences for the two categories."* (Xie, 2013).
In addition, Cohen's kappa can only be used for 2 coders, and it assumes an infinite sample size. See also the
article in our research blog: Why Cohen's Kappa is not a good choice.
METHODS FOR TESTING ICA 462
9.0.0.214 (15.12.2021) ATLAS.ti 9 Windows - User Manual
477.
Krippendorff's Family ofAlpha Coefficients
The family of alpha coefficients offers various measurement that allow you to carry out calculations at different
levels. They can be used for more than two coders, are sensitive to different sample sizes and can be used with
small samples as well.
Alpha binary
At the most general level, you can measure whether different coders identify the same sections in the data to be
relevant for the topics of interest represented by codes. All text units are taken into account for this analysis,
coded as well as not coded data.
You can, but do not need to use semantic domains at this level. It is also possible to enter a single code per
domain. You get a value for alpha binary for each code (or each semantic domain) in the analysis, and a global
value for all codes (or all domains) in the analysis.
The global alpha binary value might be something you want to publish in a paper as an overall value for inter-coder
agreement for your project.
The values for each code or semantic domain provide feedback which of the codes / domains are satisfactory in
terms of inter-coder agreement, and which are understood in different ways by the different coders. These are
codes / domains you need to improve and test gain, albeit with different coders.
If you work with pre-defined quotations, the binary coefficient will be 1 for a semantic domain if only codes
of the same semantic domain have been applied, regardless which code within the domain has been
applied.
The value for global alpha binary will always be 1 when working with pre-defined quotations as all coded
segments are the same.
cu-alpha
The cu-alpha/Cu-alpha coefficients can only be used on combination with semantic domains. They cannot
be used to test agreement/disagreement for single codes!
Another option is to test whether different coders were able to distinguish between the codes of a semantic
domain. For example, if you have a semantic domain called 'type of emotions' with the sub codes:
emotions::contentment
emotions::excitement
emotions::embarrassment
•
•
•
KRIPPENDORFF'S FAMILY OF ALPHA COEFFICIENTS 463
9.0.0.214 (15.12.2021) ATLAS.ti 9 Windows - User Manual
478.
emotions::relief
The coefficient givesyou an indication whether the coders were able to reliably distinguish between for instance
'contentment' and 'excitement', or between 'embarrassment' and 'relief'. The cu-alpha will give you a value for the
overall performance of the semantic domain. It will however not tell you which of the sub codes might be
problematic. You need to look at the quotations and check where the confusion is.
The cu-alpha coefficient can only be calculated if the codes of a semantic domain have been applied in a
mutually exclusive manner. This means only one of the sub codes per domain is applied to a given
quotation. See also Requirements for Coding.
Cu-alpha
Cu-alpha is the global coefficient for all cu-alphas. It takes into account that you can apply codes from multiple
semantic domains to the same or overlapping quotations. See multivalued coding. Thus, Cu-alpha is not just the
average of all cu-alphas.
If codes of a semantic domain 'A' have been applied to data segments that are coded with codes of a semantic
domain 'B', this does not affect the cu-alpha coefficient for either domain A or B, but it effects the overall Cu-
alpha coefficient.
You can interpret the Cu-alpha coefficient as indicating the extent to which coders agree on the presence or
absence of the semantic domains in the analysis. Formulated as a question: Could coders reliably identify that
data segments belong to a specific semantic domain, or did the various coders apply codes from other semantic
domains?
In the calculation for both the cu- and Cu-alpha coefficient, only coded data segments are included in the analysis.
Calculation of Krippendorff's Alpha
For a full mathematical explanation on how the alpha coefficients are calculated see ICA Appendix.
The basic formula for all Krippendorff alpha coefficients is as follows:
alpha = 1 - observed disagreement (Do)) / expected disagreement (De)
whereby 'De' is the expected disagreement
by chance.
•
KRIPPENDORFF'S FAMILY OF ALPHA COEFFICIENTS 464
9.0.0.214 (15.12.2021) ATLAS.ti 9 Windows - User Manual
479.
α = 1indicates perfect reliability. α = 0 indicates the absence of reliability. The units and the values assigned to
them are statistically unrelated. α < 0 when disagreements are systematic and exceed what can be expected by
chance.
When coders pay no attention to the text, which means they just apply the codes arbitrarily, their coding has no
relationship to what the text is about, then the observed disagreement is 1. In other words, the observed
disagreement (Do) equals the maximum expected disagreement (De), which is 1. If we enter this in the formula,
we get:
α= 1 – 1/1 = 0.000.
If on the other hand, agreement is perfect, which means observed disagreement (Do) = 0, then we get:
α= 1 – 0 / expected disagreement = 1.000.
To better understand the relationship between actual, observed and expected agreement, let's take a look at the
following contingency table:
In the example above, the tables represent a semantic domain with five codes. The matrices with perfect and
expected agreement/disagreement serve as a benchmark what could have been if agreement either was perfect
or if coders had applied the codes randomly. There are two matrices for expected agreement/disagreement
indicating that statistically speaking there are many possibilities for a random attribution of the codes.
The black numbers show agreement, the red numbers disagreement.
In the contingency table for observed agreement, we can see that the coders agree in applying code 4. There are
no red numbers, thus no disagreement.
There is some disagreement about the application of code 2. Agreement is 38% percent. In 2 % of the cases, code
1 was applied instead of code 2.
There is a bit more confusion regarding the application of code 5. The coders have also applied code 1 and code 3.
If this were a real life example, you would take a look at the code definitions for code 5 and code 2 and ask yourself
why coders had difficulties to apply these codes in a reliable manner. The coefficient, however, is acceptable. See
Decision Rules.) There is no need for re-testing.
KRIPPENDORFF'S FAMILY OF ALPHA COEFFICIENTS 465
9.0.0.214 (15.12.2021) ATLAS.ti 9 Windows - User Manual
480.
References
Banerjee, M., Capozzoli,M., McSweeney, L., Sinha, D. (1999). Beyond kappa: A review of interrater agreement
measures. The Canadian Journal of Statistics, Vol. 27 (1), 3-23.]
Cohen, Jacob (1960). A coefficient of agreement for nominal scales. Educational and Psychological Measurement.
20 (1): 37–46. doi:10.1177/001316446002000104.
Holsti, O. R. (1969). Content analysis for the social sciences and humanities, Reading, MA: Addison-Wesley.
Krippendorff, Klaus (2004/2012/2018). Content Analysis: An Introduction to Its Methodology. 2ed /3rd /4th
edition. Thousand Oaks, CA: Sage.
Zwick, Rebecca (1988). Another look at interrater agreement. Psychological Bulletin, 103, 347-387.
Xie, Q. (2013). Agree or disagree? A demonstration of an alternative statistic to cohens kappa for measuring the
extent and reliability of agreement between observer. In Proceedings of the Federal Committee on Statistical
Methodology Research Conference, The Council of Professional Associations on Federal Statistics, Washington,
DC, USA, 2013.
KRIPPENDORFF'S FAMILY OF ALPHA COEFFICIENTS 466
9.0.0.214 (15.12.2021) ATLAS.ti 9 Windows - User Manual
481.
Sample Size andDecision Rules
A number of decisions have to be made when testing for inter-coder agreement. For instance, how much data
material needs to be used, how many instances need to be coded with any given code for the calculation to be
possible, and how to evaluate the obtained coefficient.
Sample size
The data you use for the ICA analysis needs to be representative of the total amount of data you have collected,
thus of those data whose reliability is in question. Furthermore, the number of codings per code needs to be
sufficiently high. As a rule of thumb, the codings per code should at least yield five agreements by chance.
Krippendorff (2019) uses Bloch and Kraemer's formula 3.7 (1989:276) to obtain the required sample size. The table
below lists the sample size you need when working with two coders:
the three smallest acceptable reliabilities α min: 0.667 / 0.800 / 0.900
for four levels of statistical significance: 0.100 / 0.050 / 0.010 / 0.005
for semantic domains up to 10 codes (=probability pc):
Example: If you have a semantic domain with 4 codes and each of the codes are equally distributed (pc = 1/4 =
0,25), and if the minimum alpha should be 0.800 at a 0.05 level of statistical significance, you need a minimum of
139 codings for this semantic domain. For a lower alpha of 0.667, you need a minimum of 81 codings at the same
level of statistical significance.
It applies to 2 coders, and for semantic domains up to 10 sub-codes. If you have more than two coders, more than
10 sub-codes in a domain, or an unequal distribution within a domain, you need to adjust the equation and
calculate the needed sample size yourself.
More than two coders: You need to and multiply Z square by the number of coders.
•
•
•
•
SAMPLE SIZE AND DECISION RULES 467
9.0.0.214 (15.12.2021) ATLAS.ti 9 Windows - User Manual
482.
More than 10sub-codes per domain: You need to adjust the value for pc. The value for pc = 1/number of
sub-codes.
Unequal distribution of codings within a domain: By 4 codes in a semantic domain, the estimated
proportion pc of all values c in the population is 0.250 (¼); by 5 codes, it is 0,200 (1/5); by 6 codes 0,167
(1/6) and so on. If the distribution of your codes in a semantic domain is unequal, you need to make a new
estimate for the sample size by using a pc in the formula that is correspondingly less than 1/4, 1/5, 1/6 and
so on.
You can see the corresponding z value from a standard normal distribution table. For a p-value of 0,05, z =
1,65.
Acceptable Level of Reliability
The last question to consider is when to accept or reject coded data based on the ICA coefficient. Krippendorff
(2019) recommends:
Strive to reach α = 1,000, even if this is just an ideal.
Do not accept data with reliability values below α = 0.667.
In most cases, you can consider a semantic domain to be reliable if α ≥ 0.800.
Select at least 0.05 as the statistical level of significance to minimize the risk of a Type 1 error, which is to
accept data as reliable if this is not the case.
Which cut-off point you choose always depends on the validity requirements that are placed on the research
results. If the result of your analysis affects or even jeopardizes someone's life, you should use more stringent
criteria. A cut-off point of α = 0.800 means that 80% of the data is coded to a degree better than chance. If you
are satisfied with α = 0.500, this means 50% of your data is coded to a degree better than chance. The sounds a
bit like tossing a coin and playing heads or tails.
•
•
•
•
•
•
SAMPLE SIZE AND DECISION RULES 468
9.0.0.214 (15.12.2021) ATLAS.ti 9 Windows - User Manual
483.
Setting Up aProject for Inter-coder Agreement Analysis
You can test inter-coder agreement in text, audio and video documents. Image documents are not
supported. This also applies to image quotations in text PDF documents.
When you want to run an inter-coder agreement analysis, you are working in a team. Therefore, you need to know
how to set up a team project, distribute and collect team projects for merging. Please read the chapter on Team
Work for further information. Here, you find the information that is specific to inter-coder agreement analysis
only.
As you need to start from a common Master project, you cannot perform an ICA analysis if one of the
coders is using the Web version. All coders need to use the desktop version (Mac or Windows). For further
information see Merging Projects.
Instructions for the Principal Investigator (PI)
The PI develops the code system adding clear definitions for each code. This means, the PI has likely coded
the data as well. See also Requirements for Coding. This is the Master Project.
Based on the master project, the PI creates a sub-project for the ICA analysis. This is easiest be done by
creating a project snapshot. Usually, the coders for the ICA analysis code 10-20% of the material. Another
approach is the number of codings you need to achieve a certain level of significance. See Sample Size and
Decision Rules.
The PI deletes all documents from the snapshot project that coders should not code. See Document
Management.
Option A
Next, the PI can either remove all quotations, so that the snapshot project for the coders only contain the
documents that need to be coded, and the codes with the definitions. The coders then need to find and mark text
segments they find relevant and apply one or more codes from the list. This option is best used for longer
documents where you are interested in seeing whether other coders find the same passages relevant for a given
topic. For example, you have a number of reports, and the aim is to identify all segments related to business
•
•
•
SETTING UP A PROJECT FOR INTER-CODER AGREEMENT ANALYSIS 469
9.0.0.214 (15.12.2021) ATLAS.ti 9 Windows - User Manual
484.
strategies, labour lawsand gender issues. If this is the question of interest, it is necessary that all coders set
quotations themselves (Option A: Delete all Quotations).
The PI deletes all quotations: Open the Quotation Manager, select all quotations and click
on the Delete button.
The PI saves the project, creates a project bundle file and sends it to the coders.
Option B
Another option is to leave the quotations in the project, but to remove all codings. This
means, the coders get a project that contains the documents to be coded, pre-defined
quotations and a list of codes. This is useful if the aim is to see whether different coders
understand the codes in the same way and apply them to the same data segments. This
assures that the code system is replicable and that also others see the same or similar
things in the data as the principal investigator (Option B: Remove all codings).
inst
The PI removes only the codings: Open the Document Manager, select all documents,
click on the Tools tab and from there select Remove codings.
inst
The PI saves the project, creates a project bundle file and sends it to the coders.
Instructions f
An important requirement for inter-coder agreement analysis is the independence of the coders. Thus, the person
who has developed the code system cannot be one of the coders whose coding goes into the ICA analysis.
It is recommended to provide the coders with the following instructions.
As coder, you receive a project bundle file from the principal investigator.
When importing the project, add your name or initials to the project name.
After opening the project, double-check your user name.
Open the Code Manager and familiarize yourself with the code system. Read all code definitions.
Depending on the aim of the analysis and how the project was set up, you either need to set your own
quotations and apply the codes; or you need to apply codes to pre-defined quotations.
•
•
•
•
•
SETTING UP A PROJECT FOR INTER-CODER AGREEMENT ANALYSIS 470
9.0.0.214 (15.12.2021) ATLAS.ti 9 Windows - User Manual
485.
When applying codes,never apply more than one code from a specific semantic domain to a single or
overlapping quotations. This is referred to as mutual exclusive coding.
If fitting you can apply codes from multiple semantic domains to the same or overlapping quotations
(multi-valued coding).
Do not make any changes to the codes - do not alter the code definition, do not change the code name, or
the code color.
If you do not understand a code definition, or find a code label not fitting, create a memo and name it
'Comments from coder (yourname)'. Write all of your comments, issues you find and ideas you have into
this memo.
Do not consult with other coders. This is important for your coding to remain unbiased. The data must be
coded by all coders independently.
Once you are done coding, create a project bundle file and send it back to the principal investigator.
Continues Workflow
Once the coders are done with they work, they prepare a project bundle file and send it back to the PI.
The PI imports the project bundle files from each coder, checks the work of each coder and reads the memo
they have written (if any).
Next the projects need to be merged. See Merging projects for ICA analysis.
Then the PI can run the ICA analysis.
•
•
•
•
•
•
•
•
•
•
SETTING UP A PROJECT FOR INTER-CODER AGREEMENT ANALYSIS 471
9.0.0.214 (15.12.2021) ATLAS.ti 9 Windows - User Manual
486.
Merging Projects ForICA Analysis
The following instructions assume 2 independent coders. If you work with more coders, you have to repeat the
merge process. You can only merge two projects at a time.
We recommend that you import the project bundle files of coder 1 and 2 before merging them for
inspection. Did the coders do what they were supposed to do? Did they send you the correct project?
Project bundle files can also be merged directly. However, if a merge conflict occurs you may not know why
because you have not looked inside the projects you are merging.
Open the project of coder 1 and create a snapshot. Name the copy something like 'Project
for ICA XY coder 1 and 2'. Merge the project of coder 2 into this version of the project.
Close the project of coder 1 and open the snapshot.
Before the project merge, set the project into inter-coder mode:
Select Analyze / Enable Intercoder Mode.
Select File / Merge and select the project of coder 2 to be merged. This is the import
project. Follow the instructions on the screen. There should be no merge conflicts. For more
detail see Project Merge.
When you set up the project correctly and all coders did what they were supposed to do, then there should
be no merge conflict!
After merging in ICA mode, The codings of all coders will become visible.
Open one document and take a look at the margin area. If you see the same codes applied
to the same quotations, this is good. It means the two coders agree.
Click on the View tab and instead of displaying the code icons, select Show User.
Now you see coder icons. Each coder is indicated by a different color. Hover over the coder icon to see the name of
the coder.
The ability to see who has coded what in the margin area is useful for some purposes, e.g., if you want to discuss
data segments where coders did not agree. However, there is no need to manually check all codings in the margin.
For this you can run the inter-coder agreement analysis. See Running an Inter-coder Agreement Analysis.
A coding is the link between a code and a quotation. In ICA mode, you can see which coder has applied
which code to a quotation.
MERGING PROJECTS FOR ICA ANALYSIS 472
9.0.0.214 (15.12.2021) ATLAS.ti 9 Windows - User Manual
487.
Running an ICAAnalysis
A good time to have your coding checked by other coders is when you have built a stable code system and
all codes are defined. This means, this is somewhere in the middle of the coding process. Once a
satisfactory ICA coefficient is achieved, the principal investigator has the assurance that his or her codes
can be understood and applied by others and can continue to work with the code system.
Click the Analyze tab and select the option Inter-coder Agreement.
inst
Click on the Add Coder button and select two or more coders.
inst
Click on the Add Documents button and select the documents that should be included in
the analysis. Only those documents are listed that have been coded by all selected coders.
Click on the Add Semantic Domain button and add one or more codes to the domain.
Alternatively, you can drag and drop codes from the Project Explorer or the code list into
the semantic domain field.
inst
Repeat this process for each semantic domain.
If you are not sure, what a semantic domain is, you find more information here.
Whether you add semantic domains or only a single code in place of a domain, this has an effect on the
type of analysis you can run. If you only add one code per semantic domain, you cannot calculate Cu/cu-
alpha coefficients. See Methods for Testing ICA.
After you have added coders, documents and codes, your screen looks similar to what is shown in:
RUNNING AN ICA ANALYSIS 473
9.0.0.214 (15.12.2021) ATLAS.ti 9 Windows - User Manual
488.
The documents arerepresented by a line for each coder and code. If you have added multiple documents
into the analysis, you see a black vertical line that marks the beginning of the next document.
The quotations for the code are marked on the line in the same color as the coder icon.
To the right of each coder line you see some descriptive statistics: The coder Sabine (blue) has applied the
code "activities clubbing / going for a drink" 8 times. The number of characters that are coded with this
code are 1057 out of a total of 172.407 characters in all three selected documents, which is 0,6%.The coder
Susanne (blue) has applied the code "activities clubbing / going for a drink" 11 times. The number of
characters that are coded with this code are 1331 out of a total of 172.407 characters in all three selected
documents, which is 0,8%.
If you click on one of the lines, only the quotations of the selected code and coder are shown in the
Quotation Reader on the right-hand side.
If you click on the line for the semantic domain, all quotations of the semantic domain are shown in the
Quotation Reader.
•
•
•
•
•
RUNNING AN ICA ANALYSIS 474
9.0.0.214 (15.12.2021) ATLAS.ti 9 Windows - User Manual
489.
You can removecoders, codes or documents from the analysis by clicking on the red x.
Calculating an ICA Co
To calculate ICA, click on the button Agreement Measure in the ribbon and select one of
the four methods.
See Methods For Testing ICA for more detail.
Selecting the Krippendorff's Cu /cu-alpha coefficient for the above example, yields the
following results:
RUNNING AN ICA ANALYSIS 475
9.0.0.214 (15.12.2021) ATLAS.ti 9 Windows - User Manual
490.
Tools
The following toolsare available:
The Redundant Codings Analyzser
Project Search
The redundant codings analyzer finds overlapping quotations that have been coded with the same code. You may
have coded a long segment, e.g. from paragraph 5 to 15 and then a shorter segment within this section from
paragraph 7 to 8, not realizing you have attached the same code already to the surrounding segment. This leads to
confusing or even false results if you are counting segments. The redundant codings analyzer finds these
segments, and you can correct it.
The project search tool allows you to search through all entities in your project. You can specify whether you want
to search for a word or expression in all entities, or only in documents, only in codes, on in memos, only in the
names, only in the comments, etc. Search terms can include regular expressions.
•
•
TOOLS 476
9.0.0.214 (15.12.2021) ATLAS.ti 9 Windows - User Manual
491.
Project Search
Use theProject Search tool to search for text and patterns in all elements of your project, not only in the
documents that you added. The search can be restricted to certain fields, like name, author, date, comments, and
content. Search terms can contain regular expressions (GREP). See Regular Expressions (GREP).
To open the tool select Tools and from there the Project Search option.
Select the entities you want to search in. You can also restrict the search to items created
by a specific user.
Enter a search term. If you use regular expression, activate the Use GREP option. You can
also select whether a search term should be case senstive or not.
To start the search, click Enter or the search icon.
The results of the search are listed in an interactive list, where you can click on a specific hit and you will be able to
see the term within its larger context.
All entities that do not include the search term are grayed out.
When you double-click on a result, it will be displayed in your project.
Searching in Selected Entities
If you only want to search for instance in the comments of codes, click on Show None and
then activate the entity type and elements you are interested in, e.g. code and comment.
Refining a Search
If you want to refine an existing search, click on the Search tab in the Text Search Result window and enter a
modified search and press Enter or the Search icon.
PROJECT SEARCH 477
9.0.0.214 (15.12.2021) ATLAS.ti 9 Windows - User Manual
492.
Finding Redundant Codings
Redundantcodings are overlapping or embedded quotations that are associated with the same code. Such
codings can result from normal coding but may occur unnoticed during a merge procedure when working in teams.
The Codings Analyzer finds all redundant codings and offers appropriate procedures to correct it. An example of a
redundant coding is shown below.
To find all redundant codings, select Find Redundant Codings under the Tools & Support
tab, or open the Code Manager and select the options from the Tools tab there.
The upper pane lists all codes for which redundant codings were found. The Redundancy
column displays the number of pairs of redundant quotations found for the codes. If you
select one of the codes, the redundant quotations are listed in pairs, in the middle pane. If
you select a pair, you see a preview of the quotation in the bottom pane. Double-clicking on
a listed quotation displays it in context.
You can correct the redundancy in the following ways:
Unlink from Left Quotation removes he selected code from the quotation shown on the left-hand side.
Merge Quotations melts the two quotations shown on the right- and left-hand side. All references to and from
the merged quotation are "inherited" by the other. If the two quotations overlap, the resulting quotation includes
all data from both quotations.
Unlink from Right Quotation removes the selected code from the quotation shown on the right-hand side.
If you hover over a quotation you see some information about the Connectivity of the quotation: number of
connections to codes (=codings), number of connections to other quotations (=hyperlinks), and number of
connections to memos (=memo links). The connectivity information provides an additional clue about the best
action how to resolve the redundancy.
If you see a quotation listed more than once, it means that three or more quotations are involved in a redundant
coding. You will notice that merging one pair of quotations may have the effect that other pairs are removed from
the list as well, as the redundancy assertion does not hold any longer for the remaining pairs of quotations for this
code.
FINDING REDUNDANT CODINGS 478
9.0.0.214 (15.12.2021) ATLAS.ti 9 Windows - User Manual
493.
Creating Reports
ATLAS.ti offersuser configurable reports in Word, PDF or Excel format. This means you can decide what should be
displayed in the report. You find a report option in each browser at the top right-hand side in the ribbon.
If there is no ribbon option, and you want to export quotations from a result of a query, look for the burger menu:
In addition, predefined reports are available in the Query Tool under the Report button. If you hover over an option
with your mouse, the screen tip explains what each of the report contains.
Tables can be exported as Excel file. See Code Document Table and Code Co-Occurrence Table.
CREATING REPORTS 479
9.0.0.214 (15.12.2021) ATLAS.ti 9 Windows - User Manual
Create Word /PDF Reports
Creating Report from the Code Manager
If you want a text report of quotations for selected codes, then creating a report form the Code Manager is the
best option.
Open the Code Manager. Select one or multiple codes or set a code group as filter if you do
not want to create a report for all codes.
Select a filter option: If you selected some codes or set a code group as filter, you can still
change and export all codes.
You can group the report by:
By "smartness" means that quotations of smart codes are listed first in the report.
When you select a grouping option, further options are presented to you, e.g. whether you want to also export the
comment of the code group or document.
CREATE WORD / PDF REPORTS 481
9.0.0.214 (15.12.2021) ATLAS.ti 9 Windows - User Manual
496.
If a selectedcode is in multiple code groups, then the quotations for this code will occur multiple times in
the report.
Next select what should be included in report. When selecting Groups, Quotations, Memos
or Codes, you can select further options. To do so, click on the small triangle before the
item to open the branch. For Quotations for instance 'Content' is already pre-selected. You
may further want to select to also include quotation comments, other linked codes or
memos in the report.
After you made your selections, click Create Report to open the report. It is a read-only
report. You can save it as rtf file or copy and paste it into a Word document.
CREATE WORD / PDF REPORTS 482
9.0.0.214 (15.12.2021) ATLAS.ti 9 Windows - User Manual
497.
Creating Reports fromthe Quotation Manager
Open the Quotation Manager. Select one or multiple quotations or set one or more codes
as filter if you do not want to create a report for all quotations.
Select a filter option: If you selected a few quotations or set a code as filter, you can still
change and export all quotations.
You can group the report by:
CREATE WORD / PDF REPORTS 483
9.0.0.214 (15.12.2021) ATLAS.ti 9 Windows - User Manual
498.
When you selecta grouping option, further options are presented to you, e.g. whether you want to also include
the comment of the code group or document.
Note, if you group by documents or code groups, and a document or code is in multiple groups, then the
quotation will occur twice or more times in the report. The same applies if a quotation is coded by multiple
codes. If you group by codes, the quotation will be listed under each code that applies.
Next select what should be included in report:
When selecting Codes, Memos or Hyperlinks, you can select further options. To do so, click
on the small triangle before the item to open the branch.
CREATE WORD / PDF REPORTS 484
9.0.0.214 (15.12.2021) ATLAS.ti 9 Windows - User Manual
499.
After you madeyour selections, click Create Report to open the report. It is a read-only
report. You can save it as rtf or PDF file or copy and paste it into a Word document.
Below each quotation you see the codes that have been applied.
Document Reports
You may for example print a report that lists all documents with their comments.
Open the Document Manager. Select one or multiple documents or set a document group
as filter if you do not want to create a report for all documents.
CREATE WORD / PDF REPORTS 485
9.0.0.214 (15.12.2021) ATLAS.ti 9 Windows - User Manual
500.
Select a filteroption: If you selected some documents or set a document group as filter,
you can still change and export all documents.
You can group the report by:
When you select a grouping option, further options are presented to you, e.g. whether you want to include the
comment of the entity you group by.
If you group by document groups and a document is in multiple document groups, the document will occur
multiple times in the report. If you group by codes, then the document will be listed under each code that
applies, and so on.
Next select what should be included in report:
CREATE WORD / PDF REPORTS 486
9.0.0.214 (15.12.2021) ATLAS.ti 9 Windows - User Manual
501.
When selecting Groups,Quotations or Codes, you can select further options. To do so, click
on the small triangle before the item to open the branch.
After you made your selections, click Create Report to open the report. It is a read-only
report. You can save it as rtf file or copy and paste it into a Word document.
CREATE WORD / PDF REPORTS 487
9.0.0.214 (15.12.2021) ATLAS.ti 9 Windows - User Manual
502.
Memo Reports
A usefulmemo report could be a report of all memos with their comments, or a report of a memo with all linked
quotations.
Open the Memo Manager. Select one or multiple memos or set a memo group as filter if
you do not want to create a report for all memos.
Select a filter option: If you selected some memos or set a memo group as filter, you can
still change and export all documents.
You can group the report by:
When you select a grouping option, further options are presented to you, e.g. whether you want to include the
comment of the entity you group by.
If a selected memo is in multiple memo groups, then the memos will occur multiple times in the report.
Next select what should be included in report:
CREATE WORD / PDF REPORTS 488
9.0.0.214 (15.12.2021) ATLAS.ti 9 Windows - User Manual
503.
When selecting Groups,Memos, Codes or Quotations, you can select further options. To do
so, click on the small triangle before the item to open the branch.
After you made your selections, click Create Report to open the report. It is a read-only
report. You can save it as rtf file or copy and paste it into a Word document.
CREATE WORD / PDF REPORTS 489
9.0.0.214 (15.12.2021) ATLAS.ti 9 Windows - User Manual
504.
CREATE WORD /PDF REPORTS 490
9.0.0.214 (15.12.2021) ATLAS.ti 9 Windows - User Manual
505.
Creating Excel Reports
Inevery manager you find a button to create an Excel report. A frequently used report for example is a Quotation
Report by Codes. This is how you can generate such a report:
Report: All Quotations for a Code
Open the Quotation Manager. Select a code in the filter area on the left.
Click on the Excel Export button and select the following options:
ID
Select Quotation Name only when you have renamed the quotation.
Document
Quotation Content
Quotation Comment (optional)
Select Codes if you want to see other codes that have been applied to a quotation
Reference (start and end position of the quotation in the document)
•
•
•
•
•
•
•
CREATING EXCEL REPORTS 491
9.0.0.214 (15.12.2021) ATLAS.ti 9 Windows - User Manual
506.
For further examplessee Report Examples
CREATING EXCEL REPORTS 492
9.0.0.214 (15.12.2021) ATLAS.ti 9 Windows - User Manual
507.
Info Sheet forExcel Reports
All Excel reports have an additional sheet that shows meta information like the type of the report, the project
name, date of export and name of exporting user.
The info sheets for reports based on the Code Document- and the Code Co-occurrence Table, and Inter-coder
Agreement Analysis contain further information.
abbreviations that are use
Code Document Table: Information about which relative frequency count is used
Code Co-occurrence Table: whether the c-coefficient was selected
ICA reports: coder names
Info Sheet in Excel
•
•
•
•
CREATING EXCEL REPORTS 493
9.0.0.214 (15.12.2021) ATLAS.ti 9 Windows - User Manual
508.
Example Reports
Report: AllQuotations for Multiple Codes
Open the Quotation Manager. Select multiple codes by holding down the Ctrl-key in the
filter area on the left.
Click on the Excel Export button and select whatever should be included in the table:
Select ID
Select Quotation Name only if you have renamed quotations.
Select Document (optional: you may recognize the document by the quotation ID)
Select Quotation Content
Select Comment (in case you have been writing lots of quotation comments)
Select Codes if you want to see other codes that have been applied to a quotation
Select Reference = start and end position of the quotation in the document
•
•
•
•
•
•
•
EXAMPLE REPORTS 494
9.0.0.214 (15.12.2021) ATLAS.ti 9 Windows - User Manual
509.
Activate the Groupby Codes option so that ATLAS.ti creates different sheets for each code
in the Excel table.
Report: Code Book
Open the Code Manager and select all codes.
EXAMPLE REPORTS 495
9.0.0.214 (15.12.2021) ATLAS.ti 9 Windows - User Manual
510.
Click Excel Reportin the ribbon and select the following options:
Code
Comment
optional: Grounded (code frequency) / Density (number linkages to other codes)
Code Group
•
•
•
•
EXAMPLE REPORTS 496
9.0.0.214 (15.12.2021) ATLAS.ti 9 Windows - User Manual
511.
Code Book inExcel
Report: Documents and their Codes
Open the Document Manager and select all documents that you want to export with their
codes.
Click Excel Report in the ribbon and select the following options:
EXAMPLE REPORTS 497
9.0.0.214 (15.12.2021) ATLAS.ti 9 Windows - User Manual
Excel Report: Documentsand their Codes
Report: for Multimedia Data
If you have utilized the quotation level when working with multimedia data and have replaced the default
quotation name with summaries of what can be seen or heard in the multimedia quotation, this is how you create
a useful report:
Select multimedia quotations in the Quotation Manager.
inst
Select the Excel Report button in the ribbon and select the following options:
EXAMPLE REPORTS 499
9.0.0.214 (15.12.2021) ATLAS.ti 9 Windows - User Manual
514.
The report willshow an overview of all the titles you have created for your image, audio or video segments and the
comments you have written. Plus, it provides the exact position within the multimedia file.
EXAMPLE REPORTS 500
9.0.0.214 (15.12.2021) ATLAS.ti 9 Windows - User Manual
515.
Exporting Documents
You canexport all documents that you have added to an ATLAS.ti project.
PDF and multimedia files (audio, video, images) are exported in their original format.
Text documents are exported as Word (docx) files. The formatting of the exported document may differ
from the original, as all text documents are converted to html when they are imported.
To export documents:
Open the Document Manager and select all documents that you want to export.
Select the Tools tab in the Document ribbon, and from there the Document Export button.
To Print a Text Document / Save it in
Load the document and select the Print button in the ribbon. On the next window you can
select whether you want to print the document or save it in PDF format.
•
•
EXPORTING DOCUMENTS 501
9.0.0.214 (15.12.2021) ATLAS.ti 9 Windows - User Manual
516.
Data Export ForFurther Statistical Analysis
ATLAS.ti is intended primarily for supporting qualitative reasoning processes. On the other hand, especially with
large amounts of data, it is sometimes useful to analyze the data using statistical approaches. ATLAS.ti can
export your data in form of a syntax file for SPSS®, and a generic Excel format that can be imported to packages
like R, SAS, STATA as well as SPSS.
The basic components for statistics are cases and variables. The statistic export function in ATLAS.ti treats codes
as variables and data segments (quotations) as cases.
The notion of a "case" here is rather fine-grained and differs from the common understanding of this term.
Usually cases in qualitative research refer to persons, interviews, or documents. We chose to treat the smallest
unit as a case for the statistical export, to ensure that no data is lost. Broader information, e.g., which document
or document group a quotation belongs to, is coded into the various variables.
In contrast to the dichotomous treatment of codes within ATLAS.ti, you can use codes for further statistical
analysis as ordinal or interval scaled variables by using a specific code-naming convention.
Scaled vs. Dichotomous Codes
Within ATLAS.ti, a code is always dichotomous, because it either refers to a given quotation ("1"), or it does not
("0"). Each case (= quotation) can, in respect to the codes, be described as a vector of 0's and 1s. The concept of
scaled codes/variables requires a special syntax.
If you for instance want to code for three different levels of evaluating something: very good, good, neither god or
bad, bad, very bad, A special naming convention (name%value) is necessary to let ATLAS.ti identify scaled codes
from dichotomous codes. When coding the data, the code category needs to look as follows:
EVALUATION
evaluation%1 very bad
evaluation%2 bad
evaluation%3 neither good or bad
evaluation%4 good
evaluation%5 very good
This notation allows the system to construct one variable from all codes with the same prefix. The variable name
will be "evaluation", and the values for this variable are:
1 very bad
2 bad
3 neither good or bad
4 good
5 very good
Instead of the % as separator, you can also choose a different separator. If so, you need to indicate this when
preparing the SPSS syntax file.
•
•
•
•
•
•
•
•
•
•
DATA EXPORT FOR FURTHER STATISTICAL ANALYSIS 502
9.0.0.214 (15.12.2021) ATLAS.ti 9 Windows - User Manual
517.
You can usestring or numerical values; anything that follows the special symbol is interpreted as a value.
Keep in mind that ordinal codes only have meaning in the context of the statistic program you are using. Within
ATLAS.ti, the differently valued codes are treated like every other code - as 0 or 1: has been applied, or has not
been applied.
Do not assign more than one scaled variable value to the same quotation. Although ATLAS.ti permits an
arbitrary number of codes to be attached to a quotation, this would not make much sense with mutually
exclusive values of scaled variables. If you do so, the SPSS generator will simply ignore additional values
after processing the first one it finds for a given quotation. Since it cannot be guaranteed which value will
be detected first, this will most likely produce unpredictable results.
DATA EXPORT FOR FURTHER STATISTICAL ANALYSIS 503
9.0.0.214 (15.12.2021) ATLAS.ti 9 Windows - User Manual
518.
SPSS Syntax Export
ATLAS.tican export your coded data in form of an SPSS syntax file as plain ASCII text file. This allows you to
modify the syntax before running it in SPSS.
When transforming your data into numbers, codes and code groups become variables and all quotations become
cases. Additional variables like document numbers, document groups and document type indicating where a
quotation belongs to and document groups allow you to aggregate your data in SPSS.
Creating a Syntax File
From the Import & Export tab select SPSS Job.
The SPSS Job Generation Window opens. You have the following options:
Use separate file: When checked, the data matrix is written to a separate file. This is mandatory if the size
of the matrix exceeds a certain size. SPSS cannot handle large data sets within a syntax file. For regular
size projects, leave this option unchecked.
•
SPSS SYNTAX EXPORT 504
9.0.0.214 (15.12.2021) ATLAS.ti 9 Windows - User Manual
519.
Specify the nameof the data set. This name is used as the file name and as the FILE reference from the
DATA LIST section. You only need to enter a name here if you generate separate data files.
Create a fresh data file during next run can be unchecked if the data has not changed since it was last
created. This may save some processing time.
Include quotation's author. Check if you want to export an additional variable that indicates the author for
each quotation. This is for example useful if you want to use SPSS to calculate inter-coder reliability.
The value separator is % by default, but can be changed to something else. See Naming Convention For
Scaled Codes.
Create task section. Enable this option if you want templates for procedures included at the end of the
syntax file.
Create SAVE OUTFILE instruction. Enable this option if you want SPSS to save the data as *.sav file after
running the syntax file.
Specify all desired properties and click Create.
You can now run the file in SPSS, or make some changes to the syntax file before you run
it.
The Syntax File Explained
The output of the SPSS generator is a complete SPSS syntax file containing variable definitions, optionally the
data matrix and some default jobs statements:
VARIABLE LABELS are taken from code and code group names.
VALUE LABELS for variables created from codes are:
Yes (1) - code is assigned
No (0) - code is not assigned
Every case (quotation) is described by the codes that are attached it to, the document,the position in the
document (start and end position), author, media type and date of creation.
Start and End Positions
There are two variables for the start position (SY and SX) and two variables for the end position (EY and EX) for a
quotation. Depending on the media type, they are used for different start and end coordinates.
Data
Type
SY (start) SX (start) EY (end) EX (end)
Text
(rich
text)
paragraph
Column
character,
quotation
based
paragraph
Column
character,
quotation
based
•
•
•
•
•
•
•
•
SPSS SYNTAX EXPORT 505
9.0.0.214 (15.12.2021) ATLAS.ti 9 Windows - User Manual
520.
Data
Type
SY (start) SX(start) EY (end) EX (end)
PDF page
character
count, page
based
page
character
count, page
based
Audio --- milliseconds --- milliseconds
Video --- milliseconds --- milliseconds
Image
SX and SY indicate
the position of the
upper left hand
corner of the image
EX and EY indicate
the position of the
lower right hand
corner of the image
Geo --- --- --- ---
Creation Date
The date of creation is shown in the unix timestamp format. You can convert it into human readable time by using
a converter, for instance: https://www.epochconverter.com/
Variable Labels
An example:
VARIABLE LABELS D 'Document'.
VARIABLE LABELS QU 'Q-Index'.
VARIABLE LABELS SY 'Start y-Pos'.
VARIABLE LABELS SX 'Start x-Pos'.
VARIABLE LABELS EY 'End y-Pos'.
VARIABLE LABELS EX 'End x-Pos'.
VARIABLE LABELS TI 'Creation Date'.
VARIABLE LABELS C1 'Audio'.
VARIABLE LABELS C2 'just a name'.
VARIABLE LABELS C3 'Evaluation'.
VARIABLE LABELS C4 'Buddha'.
VARIABLE LABELS C5 'Code name with more than 40 characters'.
VARIABLE LABELS C6 'Fish'.
VARIABLE LABELS C7 'Geo Code'.
VARIABLE LABELS C8 'Octopus'.
VALUE LABELS C1 to C2 1 'YES' 0 'NO'.
VALUE LABELS C3 0 'NO' 1 'bad' 2 'good' 3 'not so good'.
SPSS SYNTAX EXPORT 506
9.0.0.214 (15.12.2021) ATLAS.ti 9 Windows - User Manual
521.
VALUE LABELS C4to C8 1 'YES' 0 'NO'.
VARIABLE LEVEL C3 (ORDINAL).
Document Type Declaration.
IF (D = 5) MediaType = 1.
IF (D = 4) MediaType = 2.
IF (D = 6) MediaType = 3.
IF (D = 1) MediaType = 4.
IF (D = 3) MediaType = 5.
IF (D = 2) MediaType = 6.
VALUE LABELS
1 'text'
2 'PDF'
3 'graphic'
4 'audio'
5 'video'
6 'geo'
Treatment of Code Groups
Code groups in SPSS jobs count how many of the codes in the code group have been assigned to the quotation.
Code groups are named: CG1, CG2 and so on.
Calculation: COMPUTE CG1 = C10 + C11 + C12 + C13 + C14 + C15.
VARIABLE LABELS CG1 'name of code group'.
Scaled codes are ignored in the computation of code groups variables. See Export for further Statistical Analysis.
Treatment of Document Groups
For each case (= quotation) there is a document and document group variable. If the document a quotation is part
of also belongs to a document group, the value for the document group is 1.
Calculation: COMPUTE DG1 = 0. IF (D = 5 or D = 4) DG1 = 1.
VARIABLE LABELS DG1 'DG_Document group name'.
•
•
•
•
•
•
SPSS SYNTAX EXPORT 507
9.0.0.214 (15.12.2021) ATLAS.ti 9 Windows - User Manual
522.
Generic Export forfurther Statistical Analysis
If you are using statistical software like SAS, STATA or R; or do not want to run a syntax file in SPSS, you can
create a generic export. The generic format needs to be imported using the Excel import option of the software
you are using.
To prepare a generic export, select the Import & Export tab and from there Statistical Data.
The exported file contains the following data:
CASENO: each quotation is a case
D: document number
Document name: name of the document
Media type: type of document
quote_start: start position of a text quotation
quote_end: end position of a text quotation
start_time: start position of
end_time: end position of an audio- or video quotation
SY / SX / EY / EX:coordinates of an image quotation
DG_name: quotation occurring in a document of the document group
code: assigned / not assigned to the code
CG_name: assigned / not assigned to a code of the code group
To import the data for instance to RStudio, select File/Import Data Set in RStudio.
•
•
•
•
•
•
•
•
•
•
•
•
GENERIC EXPORT FOR FURTHER STATISTICAL ANALYSIS 508
9.0.0.214 (15.12.2021) ATLAS.ti 9 Windows - User Manual
523.
QDPX - UniversalData & Project Exchange
The QDPX data format allows for full project exchange with other CAQDAS packages. This is a major step toward a
new degree of freedom in research and opens new dimensions for all practitioners of qualitative data analysis.
"We are very excited to see that - after fifteen years of ATLAS.ti being the only manufacturer to steadfastly
champion universal data exchange - other software makers are now coming around to seeing the benefit of
not holding users' data hostage any longer.
ATLAS.ti responded to the wishes of researchers early on by offering an open, application-independent export
format for universal use. This long-standing commitment to academic openness and the free flow of ideas is
now being recognized as an important value in itself.
I am convinced that being able to move projects seamlessly between different applications will be of great
benefit to the research community. We are extremely proud to have been pioneers of this movement, and we
are looking forward to the many advancements it will bring!" Thomas Muhr, March 18, 2019.
What is QDPX
ATLAS.ti is a founding member of the Rotterdam Exchange Format Initiative (REFI), the consortium that designs
and governs the interoperability standard QDPX. At the heart of the matter, QDPX is an XML-based structured
data format that permits not only long-term product storage and product-independent archival of qualitative
research projects, but also aims at the exchange of projects between different software products.
ATLAS.ti has long championed the idea of universal exchangeability of qualitative research data between different
applications and was the first manufacturer to introduce a full XML project export in their software as early as
2004. The idea of a universal data export was always a very obvious feature for us, considering the immense value
that is added to data that have been processed, analyzed, and structured in the qualitative analysis process.
In the past fifteen years, we have demonstrated through many exemplary applications the additional value the
data has when used and re-purposed through direct transformation into visually oriented presentations formats
like web pages, printable reports, or ebooks, or other data formats like .rtf, csv, or sql. Despite the wide spectrum
of these sample applications, they barely scratch the surface of what further powerful uses will still be possible in
the future.
QDPX - UNIVERSAL DATA & PROJECT EXCHANGE 509
9.0.0.214 (15.12.2021) ATLAS.ti 9 Windows - User Manual
524.
The most immediatebenefit of QDPX quite obviously lies in the fact that it enables users of various QDA software
products to migrate their research projects between different packages. As more manufacturer join the initiative
and implement the new standard, its usefulness to researchers will doubtlessly grow exponentially.
Why is QDPX Great for You?
Find below some general arguments for QDPX and descriptions of some of its practical benefits:
Because I don't like to be locked in a specific QDAS solution, particularly if there are problems with it; I don't
want my data to be held hostage. Interoperability nudges me through the point of sale because I'm less
worried that I'll be stuck in something I don't like.
Now I can move to another software for reasons beyond my control (e.g., funding, new employer, new
mandates).
The data and coding may be the same, but I want to use different types of output/representation/
visualisation that are available in one program but not another.
I'm working on my dissertation, and I want to use software XY. My committee members, however, are more
familiar with software Z. No problem. I'll just transfer my data over at a few key phases, so they can
understand and comment on the database, or the output and reports. Moreover, I might be able to
demonstrate why software XY was the better choice for my project.
As a researcher who has become familiar with a particular CAQDAS package as a result of the product that
is available to me through a site license at my institution, I need to be able to continue working with my
research data in a different product if I move to an institution that has a different site license.
Funding bodies increasingly look favorably on proposals that involve multiple research partners. This poses
issues for users working in different institutions, who are familiar with or have access to different products.
As a researcher I therefore need to be able to exchange my analysis between my product and those of my
co-researchers. This will significantly facilitate collaborative research. For example, I want to collaborate
with teams in three different countries; but they are all experts in a different program. In my grant proposal
I want to be able to say that this is no problem and part of the reason I should be funded.
Each QDAS package has its own particular strengths. Users often need to be able to undertake an analytic
task which is not supported by their chosen product, or is enabled in a more appropriate way for their needs
in another product. As a researcher being able to move to an alternative product in order to undertake a
specific task would facilitate higher quality research.
Find further information on the standard, find more information here.
•
•
•
•
•
•
•
QDPX - UNIVERSAL DATA & PROJECT EXCHANGE 510
9.0.0.214 (15.12.2021) ATLAS.ti 9 Windows - User Manual
525.
Exporting a Projectin QDPX Format
Select File / Export and then the QDPX Project Bundle option.
QDPX - UNIVERSAL DATA & PROJECT EXCHANGE 511
9.0.0.214 (15.12.2021) ATLAS.ti 9 Windows - User Manual
526.
Appendix
The following informationhas been compiled for the appendix:
System Requirements
Language Settings
Service Packs & Patches - Live Update
Preference Settings
Get In Touch
Useful Resources: Here you find links to the ATLAS.ti website, the Helpdesk, video tutorials, manuals in
PDF format to download, the research blog and publications on the use of ATLAs.ti, including an article by
Prof. Krippendorff about the implementation of inter-coder agreement in ATLAS.ti.
•
•
•
•
•
•
APPENDIX 512
9.0.0.214 (15.12.2021) ATLAS.ti 9 Windows - User Manual
527.
Language Settings
ATLAS.ti recognizedthe language or your Operating System and will set the language accordingly. Currently the
following user interface languages are available:
English
German
Spanish
Portuguese
Simplified Chinese
For all other OS languages that are not listed above, the default language is English.
Changing the Display Language
To change the user interface language, select File > Options > Application Preferences >
Display Language.
System Requirements
The system requirements are:
macOS 10.13 High Sierra or higher
min. 8 GB RAM
10 GB space on the hard drive
•
•
•
•
•
•
•
•
LANGUAGE SETTINGS 513
9.0.0.214 (15.12.2021) ATLAS.ti 9 Windows - User Manual
528.
Options
Application Preferences
You havethe following options:
Changing the Display Language
Change the location where ATLAS.ti stores data. See Switching Libraries.
Manage Models for the embedded AI tools. See Named Entity Recognitionand Sentiment Analysis.
Project Preferences
The following settings are available:
You can specify which lists and managers should be automatically opened when starting the program
For lists and the Project Explorer you can specify whether they should be opened docked, or floated, or
whether ATLAS.ti should remember their last state.
For Managers you an specify whether they should be opened docked, or floated, or whether ATLAS.ti
should remember their last state.
For multimedia files you can specify whether the previews for documents, quotations or hyperlinks should
automatically begin to play.
When creating multimedia quotations a quotation is immediately created when selecting a data segment.
If you prefer to create quotations manually, you can change the behaviour here.
•
•
•
•
•
•
•
•
LANGUAGE SETTINGS 514
9.0.0.214 (15.12.2021) ATLAS.ti 9 Windows - User Manual
529.
Service Packs &Patches - Live Update
Program updates (patches and service packs) are regularly available to update your installation. The program
downloads and installs these service packs automatically.
Provided you have administrative rights to your computer, ATLAS.ti checks for new service packs upon start up
(this requires an Internet connection). If a new service pack is found, you will be informed and asked to install it.
To update ATLAS.ti manually, go to File > Options > ATLAS.ti > Check for Updates.
SERVICE PACKS & PATCHES - LIVE UPDATE 515
9.0.0.214 (15.12.2021) ATLAS.ti 9 Windows - User Manual
530.
Useful Resources
The ATLAS.tiWelcome Screen contains links to manuals, sample projects and video tutorials. The News sections
informs you about current developments, updates that are released, interesting papers we have come across, use
cases, and our newsletter.
The ATLAS.ti Website
https://atlasti.com/
The ATLAS.ti website should be a regular place to visit. Here you will find important information such as video
tutorials, additional documentation of various software features, workshop announcements, special service
providers, and announcements of recent service packs and patches.
Getting Support
https://support.atlasti.com
From within ATLAS.ti, select Help > Online Resources / Contact Support. Or access the Support Center directly via
the above URL.
ATLAS.ti 9 - What's New
What's New in ATLAS.ti 9
This document is intended specifically for users who already have experience using the previous version.
Video Tutorials
If you like to learn via video tutorials, we offer a range of videos covering technical as well as methodological
issues.
ATLAS.ti 9 Video Tutorials
Sample Projects
You can download a number of different sample projects from our website. Currently English and Spanish
language projects are available. The projects feature different types of data sources:
text
PDF
•
•
USEFUL RESOURCES 516
9.0.0.214 (15.12.2021) ATLAS.ti 9 Windows - User Manual
531.
image
video
geo data
.... anddifferent data types:
interview transcripts
reports
online data
evaluation data
survey
literature review
You can use them for yourself to get to know ATLAS.ti, or you can use them for teaching purposes. If available,
also the raw data are provided.
PDF Manuals
ATLAS.ti 9 Full Manual and other documentations.
Research Blog
The ATLAS.ti Research Blog plays a very important role in the development and consolidation of the international
community of users. Consultants, academics, and researchers publish short and practical articles highlighting
functions and procedures with the software, and recommending strategies to successfully incorporate ATLAS.ti
into a qualitative data analysis process. We invite you to submit short articles explaining interesting ways of
making the best use of ATLAS.ti, as well as describing how you are using it in your own research. To do so,
please contact us.
Inter-coder Agreement in ATLAS.ti by Prof. Krippendorff
We have been closely working with Prof. Krippendorff on the implementation to make the original Krippendorff
alpha coefficient useful for qualitative data analysis. This for instance required an extension and modification of
the underlying mathematical calculation to account for multi-valued coding.. You can download an article written
by Prof. Krippendorff about the implementation of the alpha family of coefficients in ATLAS.ti.
Publications
Friese, Susanne (2019). Qualitative Data Analysis with ATLAS.ti. London: Sage. 3. edition.
Friese, Susanne (2019). Grounded Theory Analysis and CAQDAS: A happy pairing or remodelling GT to QDA?
In: Antony Bryant and Kathy Charmaz (Eds.). The SAGE Handbook of Current Developments in Grounded
Theory, 282-313. London: Sage.
•
•
•
•
•
•
•
•
•
•
•
USEFUL RESOURCES 517
9.0.0.214 (15.12.2021) ATLAS.ti 9 Windows - User Manual
532.
Friese, Susanne (2018).Computergestütztes Kodieren am Beispiel narrativer Interviews. In: Pentzold,
Christian; Bischof, Andreas & Heise, Nele (Hrsg.) Praxis Grounded Theory. Theoriegenerierendes empirisches
Forschen in medienbezogenen Lebenswelten. Ein Lehr- und Arbeitsbuch, S. 277-309. Wiesbaden: Springer
VS.
Friese, Susanne, Soratto, Jacks and Denise Pires (2018). Carrying out a computer-aided thematic content
analysis with ATLAS.ti. MMG Working Paper 18-0.
Friese, Susanne (2016). Grounded Theory computergestützt und umgesetzt mit ATLAS.ti. In Claudia Equit
& Christoph Hohage (Hrsg.), Handbuch Grounded Theory – Von der Methodologie zur Forschungspraxis (S.
483-507). Weinheim: Beltz Juventa.
Friese, Susanne (2016). Qualitative data analysis software: The state of the art. Special Issue: Qualitative
Research in the Digital Humanities, Bosch, Reinoud (Ed.), KWALON, 61, 21(1), 34-45.
Friese, Susanne (2016). CAQDAS and Grounded Theory Analysis. Working Papers WP 16-07
McKether, Will L. and Friese, Susanne (2016). Qualitative Social Network Analysis with ATLAS.ti: Increasing
power in a blackcommunity.
Friese, Susanne & Ringmayr, Thomas, Hrsg (2016). ATLAS.ti User Conference proceedings: Qualitative Data
Analysis and Beyond. Universitätsverlag TU Berlin. https://depositonce.tu-berlin.de/bitstream/
11303/5404/3/ATLASti_proceedings_2015.pdf
Paulus, Trena M. and Lester, Jessica. N. (2021). Doing Qualitative Research in a Digital World. Thousand
Oaks, CA: Sage.
Paulus, Trena M., Lester, Jessica. N. and Dempster, Paul (2013).Digital Tools for Qualitative Research.
Thousand Oaks, CA: Sage.
Silver, Christina and Lewins, Ann (2014). Using Software in Qualitative Research. London: Sage.
Konopásek, Zdenék (2007). [Making thinking visible with ATALS.ti: computer assisted qualitative analysis
as textual practices 62 paragraphs. (http://nbn-resolving.de/urn:nbn:de:0114-fqs0802124)
Woolf,Nicholas H. and Silver, Christina (2018). Qualitative Analysis Using ATLAS.ti: The Five Level QDA
Method. New York: Routledge.
•
•
•
•
•
•
•
•
•
•
•
•
USEFUL RESOURCES 518
9.0.0.214 (15.12.2021) ATLAS.ti 9 Windows - User Manual
533.
Get In Touch
ReportingA Problem
Select the Help tab and from there Report Problem.
The problem report goes straight to our technical team. Please use this option to report technical issues.
Be sure to include a description of the problem that allows our technicians to reproduce the issue, and do not
forget to enter a valid email address.
Sending Suggestions
We are interested in reading about your ideas and suggestions you may have. Please feel free to use this as a wish
list. While we cannot grant all wishes, knowing about what you need will help us to continuously improve the
program to fit your needs.
Select the Help tab and from there Send Suggestions.
Stay updated with the latest news on product updates, special offers, new training materials, or interesting
articles and links we find. We are also happy to hear from users via these channels. Stop by and let us know about
your projects and experience with ATLAS.ti!
Twitter
Facebook
LinkedIn
Instagram
The ATLAS.ti YouTube channel offers a variety of video materials:
Overview of the software functionality
Recorded webinars
Video tutorials that help you to learn the software.
Videos are available in English and Spanish.
•
•
•
•
•
•
•
GET IN TOUCH 519
9.0.0.214 (15.12.2021) ATLAS.ti 9 Windows - User Manual
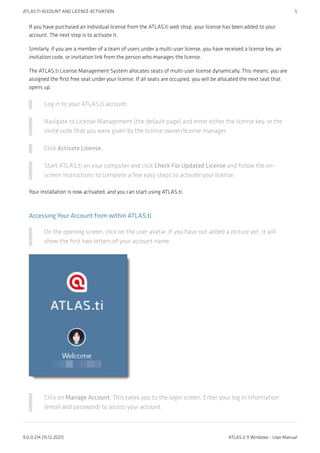
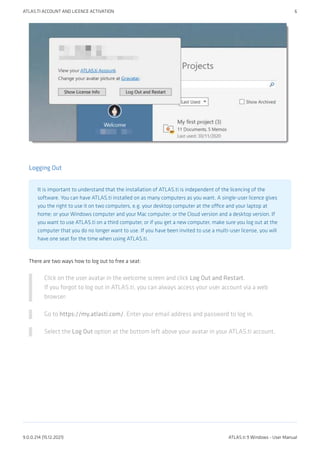
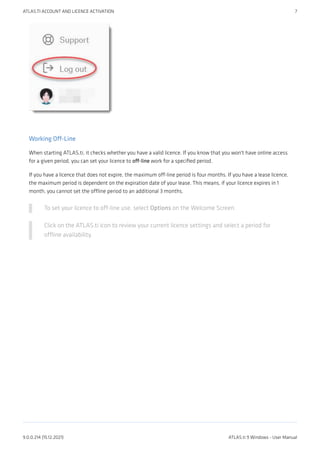
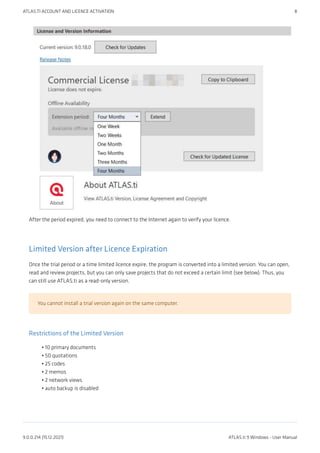
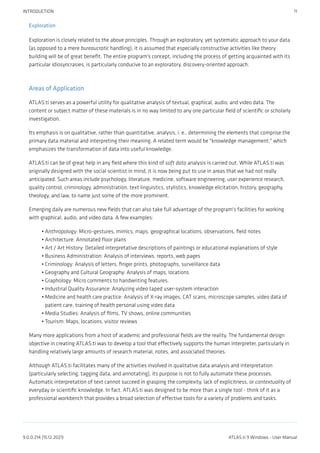
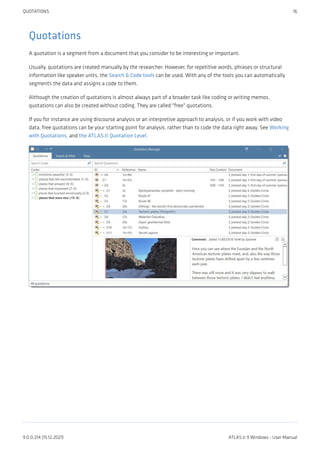
![Codes
The term code is used in many different ways. First, we would like to define what that term means in qualitative
research, and then in ATLAS.ti.
Coding means that we attach labels to segments of data that depict what each segment is about. Through
coding, we raise analytic questions about our data from […]. Coding distils data, sorts them, and gives us an
analytic handle for making comparisons with other segments of data.
Charmaz (2014:4)
Coding is the strategy that moves data from diffuse and messy text to organized ideas about what is going
on.
(Richards and Morse, 2013:167)
From a Methodological Perspective
Codes capture meaning in the data.
Codes serve as handles for specific occurrences in the data that cannot be found by simple text-based
search techniques.
Codes are used as classification devices at different levels of abstraction in order to create sets of related
information units for the purpose of comparison.
The length of a code should be restricted and should not be too verbose. If textual annotations are what
you want, you should use quotation comments instead.
Keep code names brief and succinct. Use the comment pane for longer elaborations.
•
•
•
CODES 17
9.0.0.214 (15.12.2021) ATLAS.ti 9 Windows - User Manual](https://image.slidesharecdn.com/atlas-220501063737/85/ATLAS-ti_ManualWin-v9-pdf-31-320.jpg)
![Memos
Writing is an important part of analysis in qualitative research. When using software, it is easy to fall into the code
trap. Always remember that coding the data is only a means to an end, to think, retrieve, and query data (Corbin
and Strauss, 2015; Richards, 2009; Richards and Morse, 2013).
Memos are abit more than just a short scribbled note in the margin area:
Memos [...] are working and living documents. When an analyst sits down to write a memo or do a diagram,
a certain degree of analysis occurs. The very act of writing memos and doing diagrams forces the analyst to
think about the data. And it is in thinking that analysis occurs (Corbin and Strauss, 2008: 118).
Writing is thinking. It is natural to believe that you need to be clear in your mind what you are trying to
express first before you can write it down. However, most of the time, the opposite is true. You may think you
have a clear idea, but it is only when you write it down that you can be certain that you do (or sadly,
sometimes, that you do not) (Gibbs, 2005).
Memos thus represent analytic work in progress, and you can use some of the writing later as building blocks for
your research report (see Friese, 2019). It is probably not by accident that Juliet Corbin includes a lot about memo
writing in the third edition of Basics of Qualitative Research; she wants to show readers how it can be done. In a
talk at the CAQD 2008 Conference about the book, she linked the poor quality of many of today’s qualitative
research projects to a failure to use memos. Along the same lines, Birks et al. (2008) devotes an entire journal
article to memo writing, criticizing the limited exploration of its value in most qualitative methodologies.
Freeman (2017) states that it is one of the challenges facing novice researchers to understand that writing is
inseparable from analysis. We would like to encourage you do it: write a lot already while you code and later when
you query the data. If you do it, you will find out why it is useful - but you've got to do it. As Freeman put it: The
challenge for novice researchers is: “Needing to do analysis to understand analysis” (2017:3).
When you need more input regarding how to write memos see, for example, the third edition of Basics of
Qualitative Research by Corbin and Strauss (2008/2014), Wolcott (2009), Charmaz (2014) or Friese (2019).
MEMOS 19
9.0.0.214 (15.12.2021) ATLAS.ti 9 Windows - User Manual](https://image.slidesharecdn.com/atlas-220501063737/85/ATLAS-ti_ManualWin-v9-pdf-33-320.jpg)
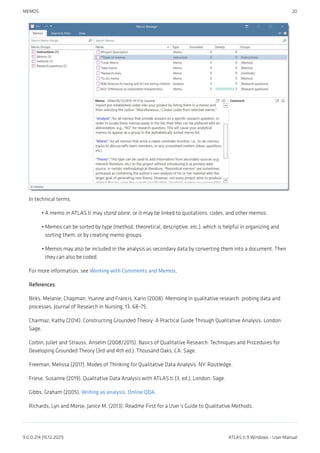
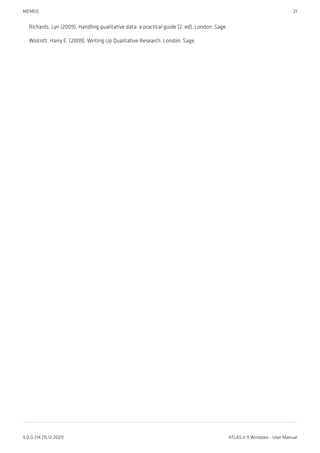
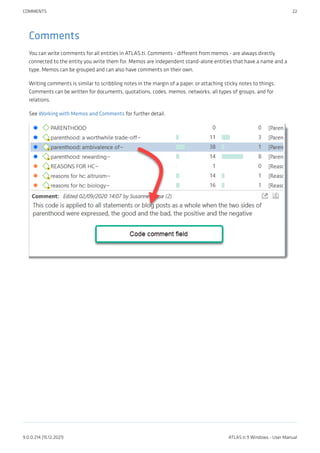
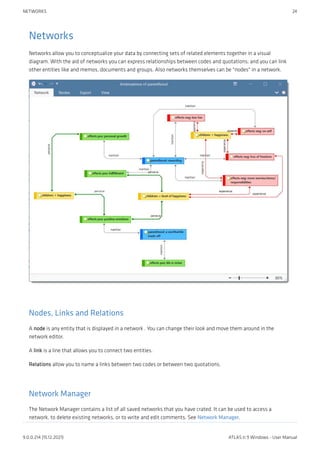
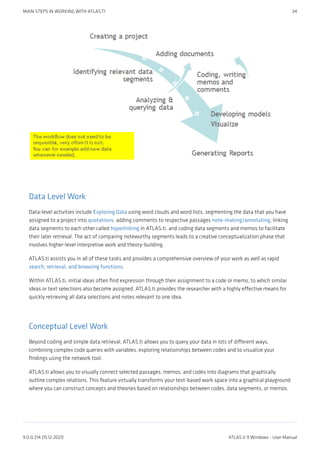
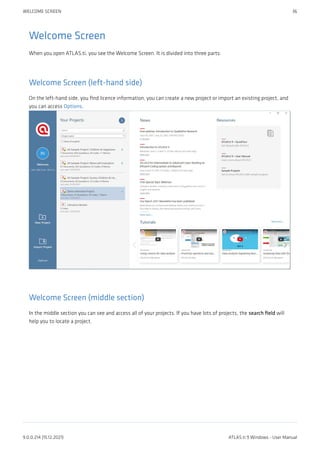
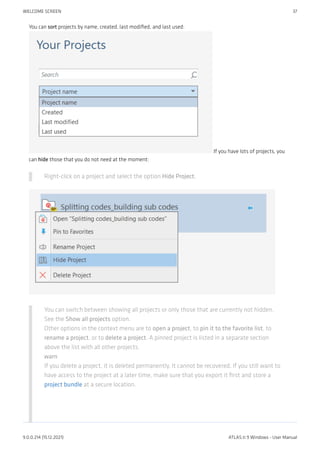
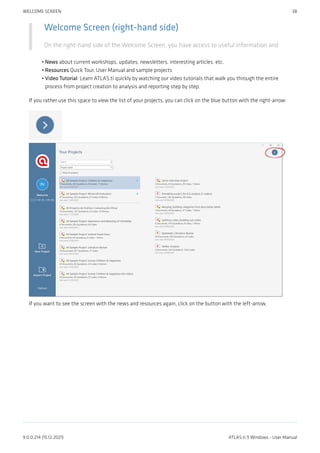
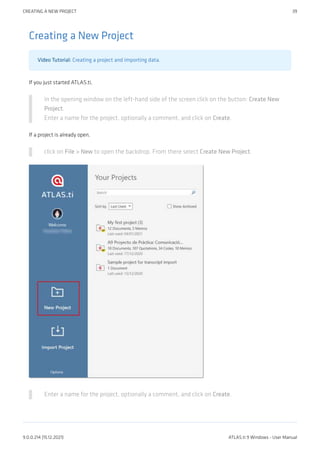
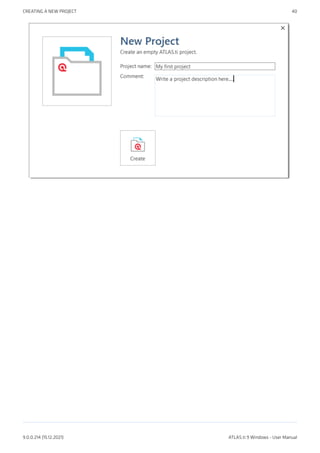
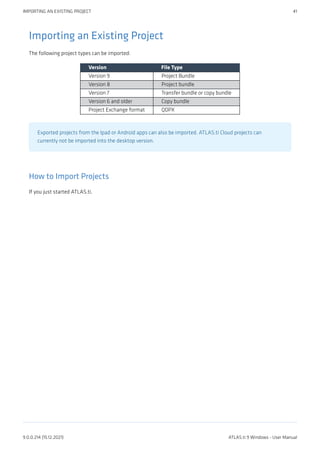
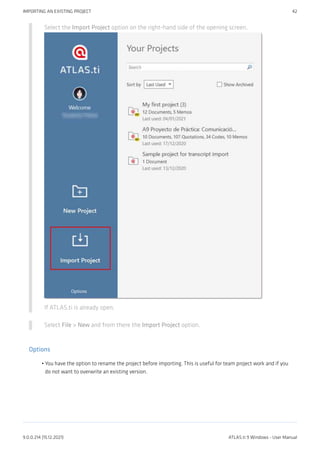
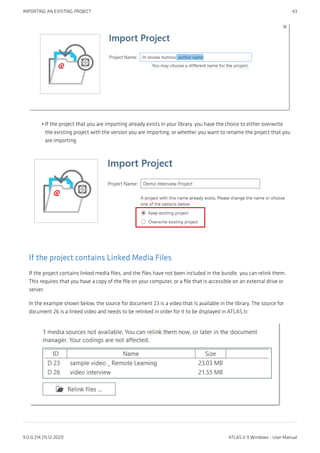
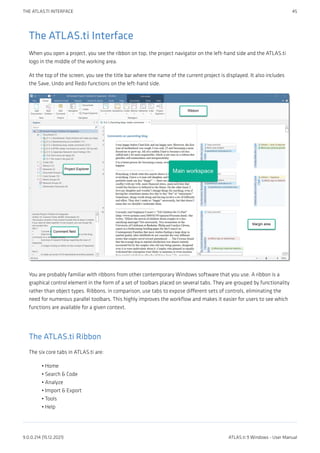
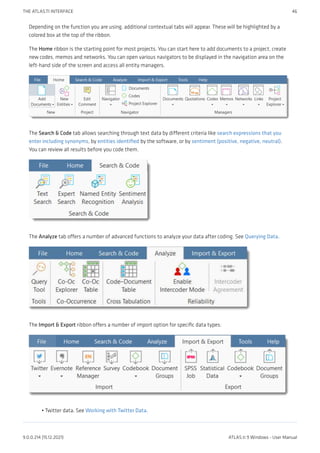
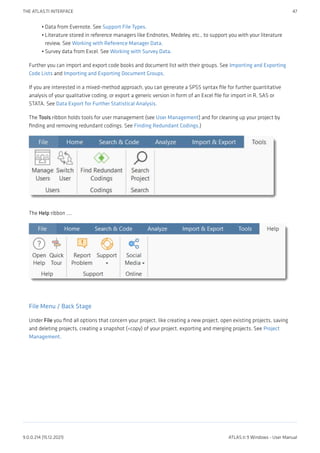
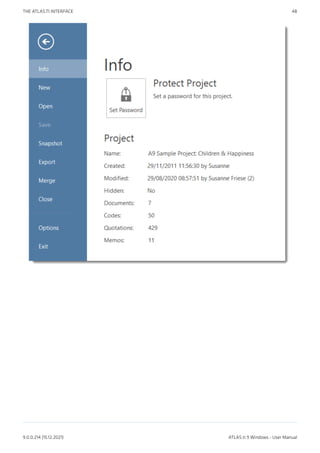
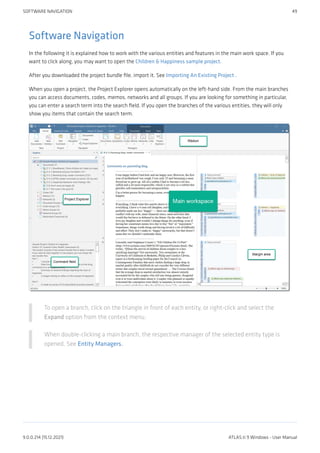
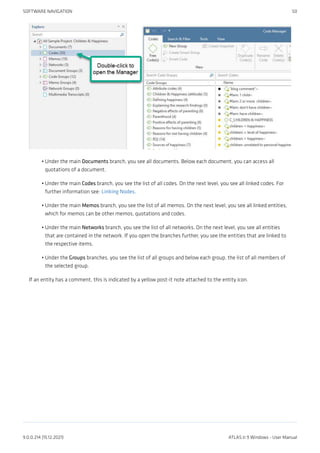
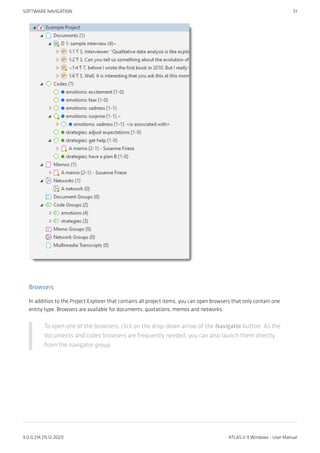
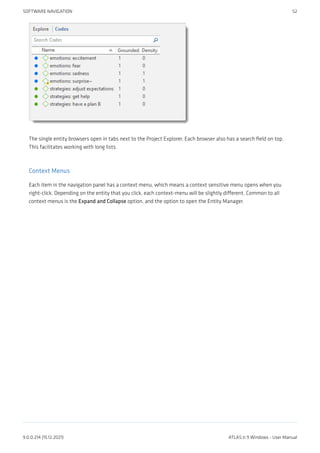
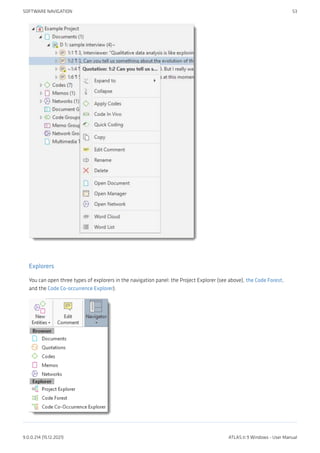
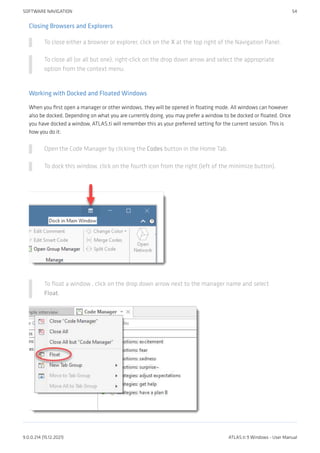
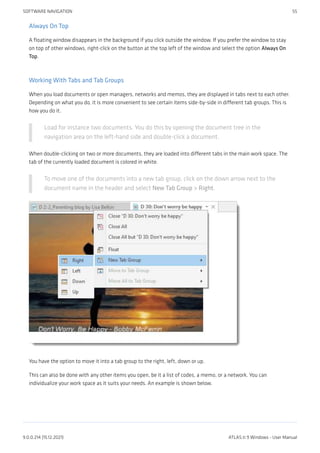
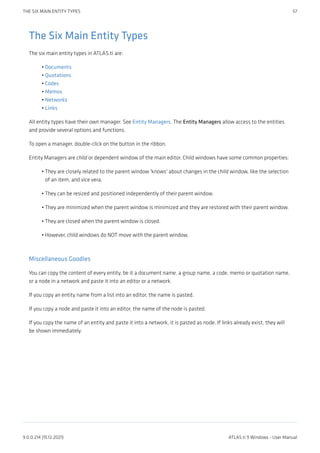
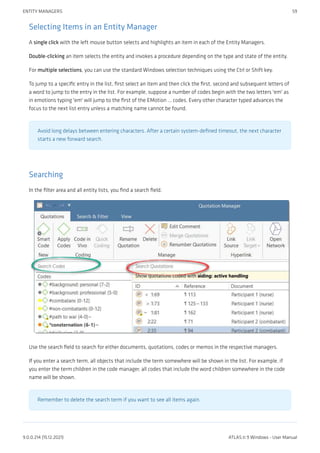
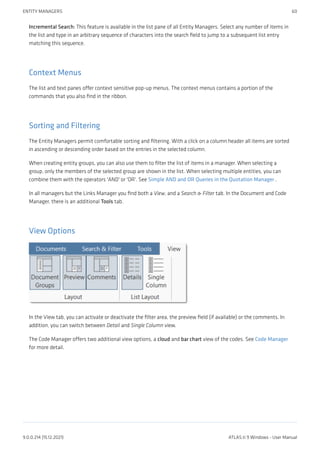
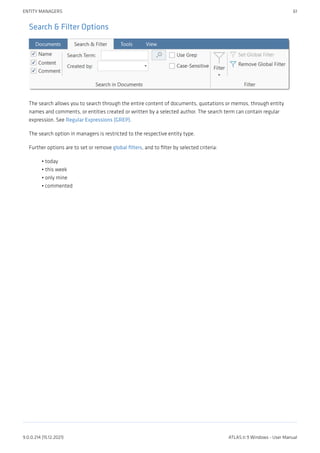
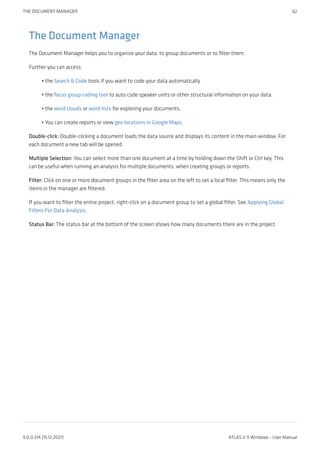
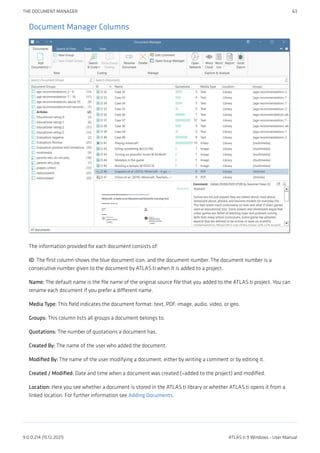
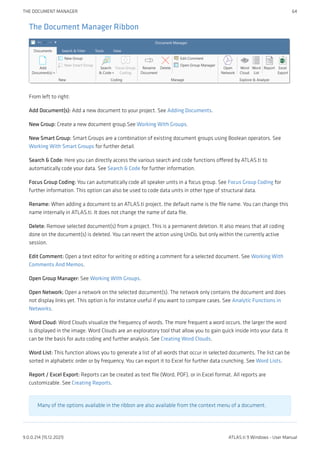
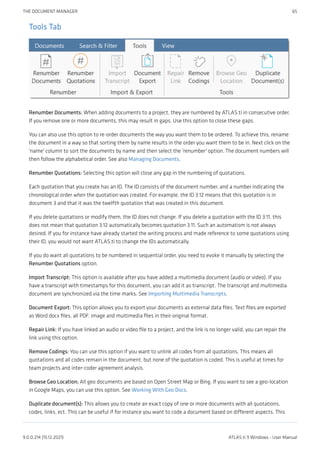
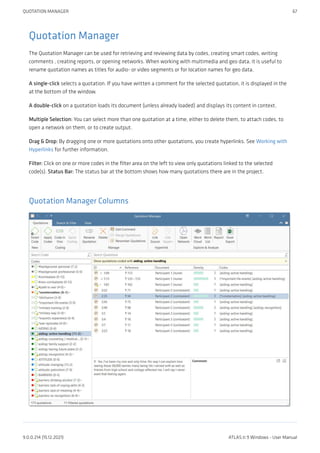
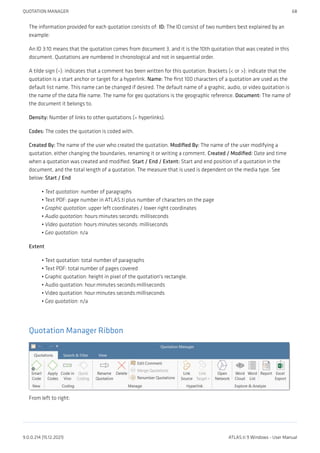
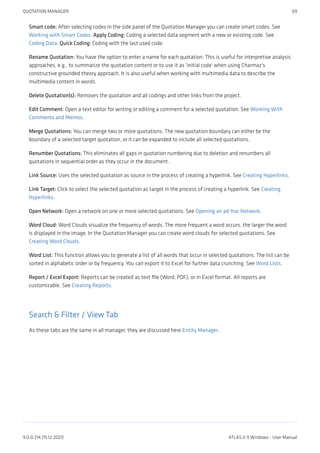
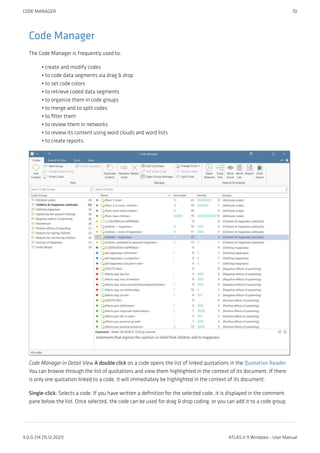
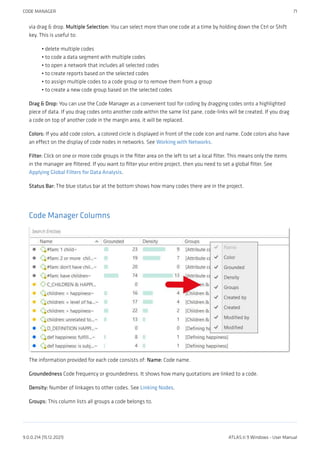
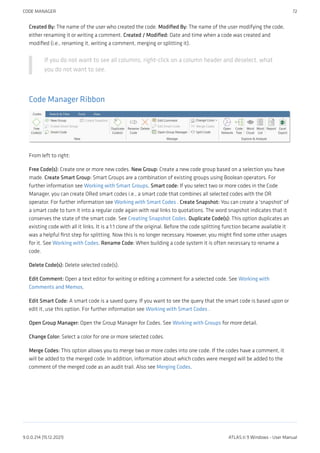
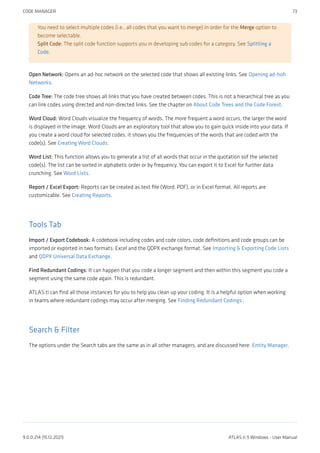
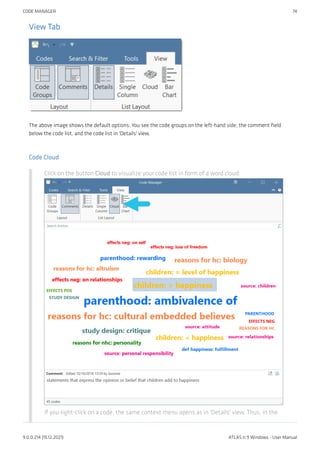
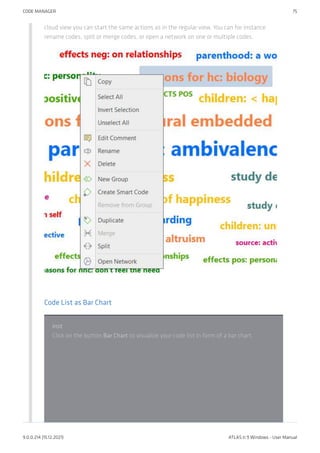
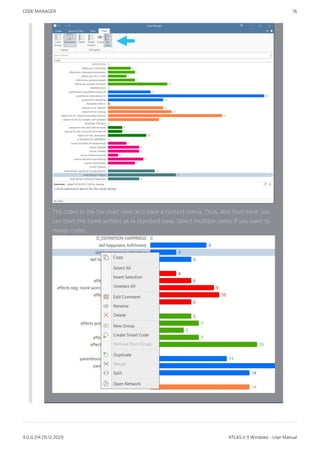
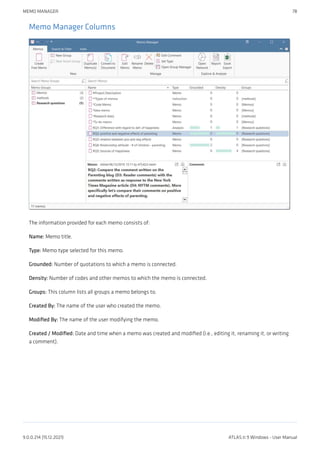
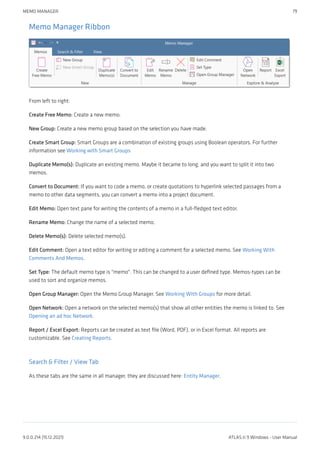
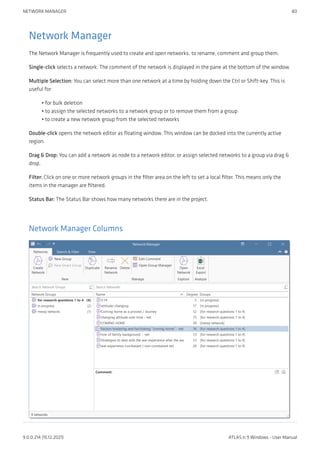
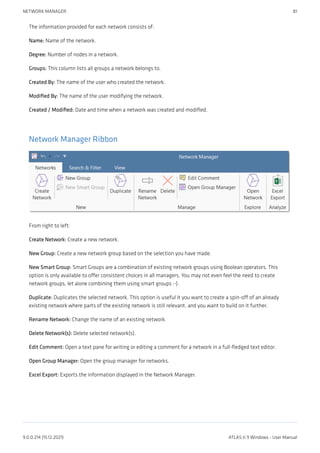
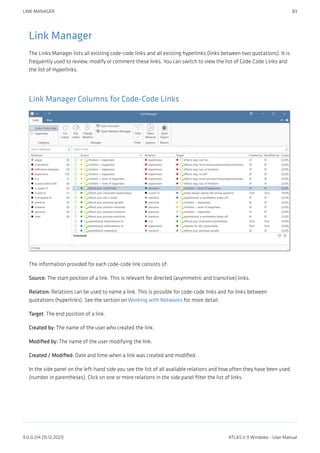
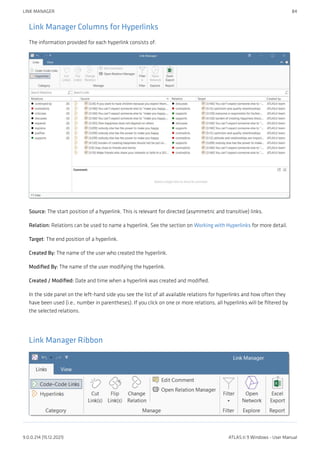
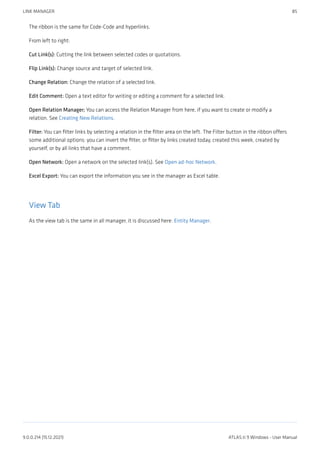
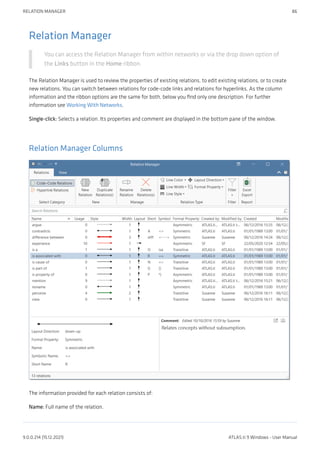
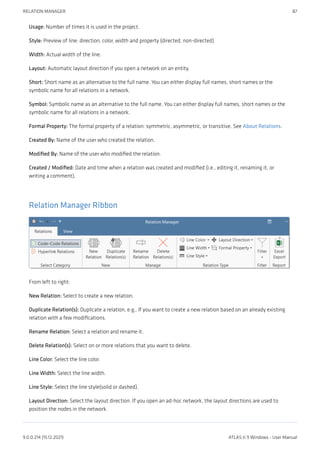
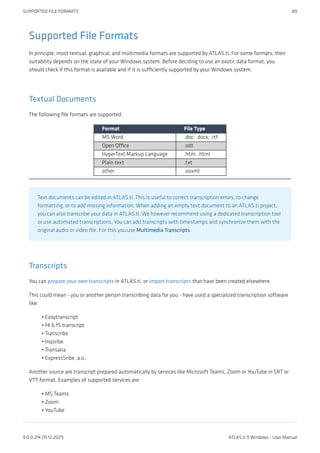

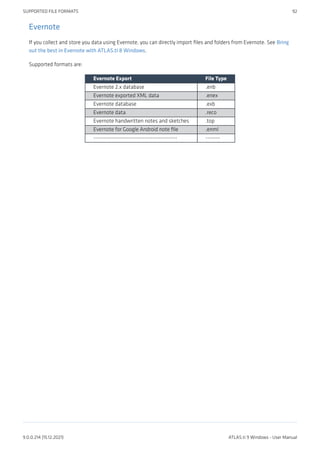
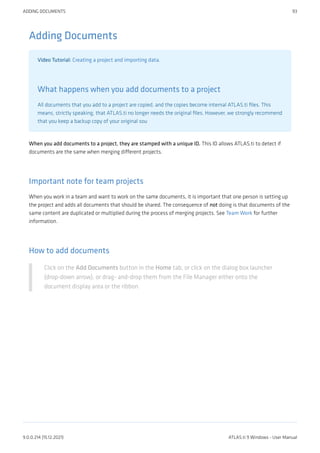
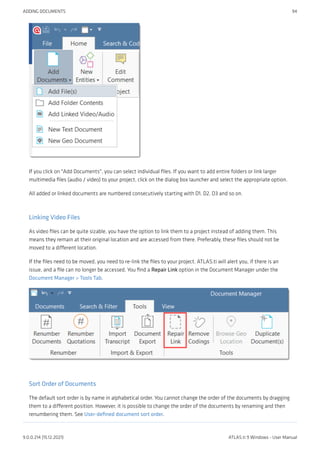
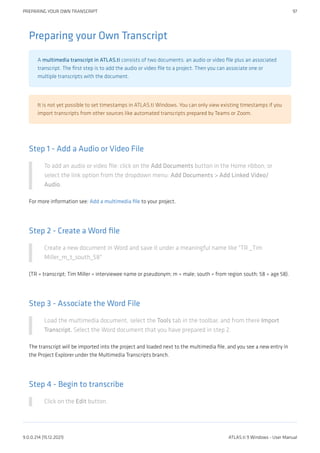
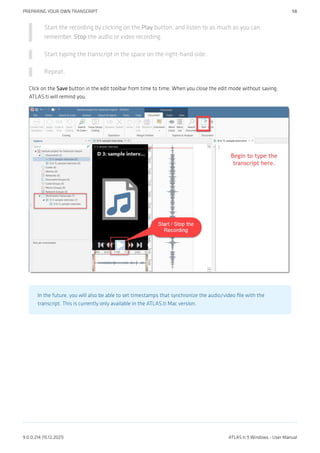
![Importing Transcripts in RTF or Word format
A multimedia transcript in ATLAS.ti consists of two documents: an audio or video file plus an associated
transcript. The first step is to add the audio or video file to a project. Then you can associate one or
multiple transcripts with the document.
The different transcription programs use various formats for time stamps. ATLAS.ti supports the following:
Transcription Software Format of time stamps
Easytranscript, f4 & f5transcript #hh:mm:ss-x#
Transcribe [hh:mm:ss]
HyperTRANSCRIBE, Inqscribe, Transcriva [hh:mm:ss.xx]
HyperTRANSCRIBE, Inqscribe, Transcriva [hh:mm:ss.xxx]
Transana (h:mm:ss.xx)
Transcriber Pro hh:mm:ss
This is how you import an existing transcript:
Step 1 - Add an Audio or Video File
To add an audio or video file: click on the Add Documents button in the Home ribbon; or
select the link option from the dropdown menu: Add Documents > Add Linked Video/
Audio.
For more information see: Add a multimedia file to your project.
Step 2 - Associate a Transcript
Load the multimedia document, select the Tools tab in the toolbar, and from there Import
Transcript.
inst
Select the transcript that belongs to the audio or video file and click Open. Currently,
IMPORTING TRANSCRIPTS IN RTF OR WORD FORMAT 99
9.0.0.214 (15.12.2021) ATLAS.ti 9 Windows - User Manual](https://image.slidesharecdn.com/atlas-220501063737/85/ATLAS-ti_ManualWin-v9-pdf-113-320.jpg)
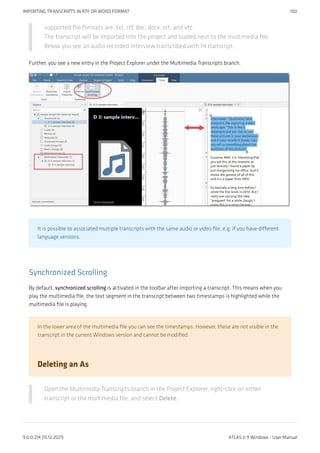
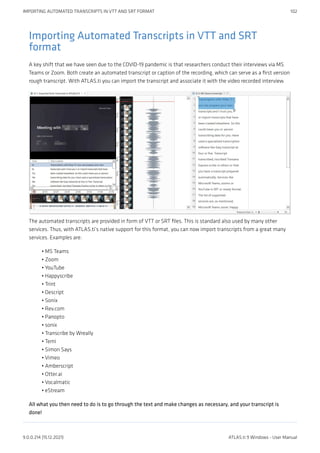
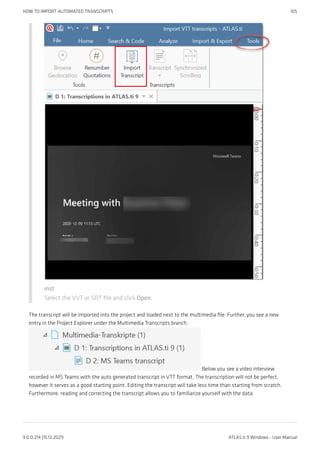
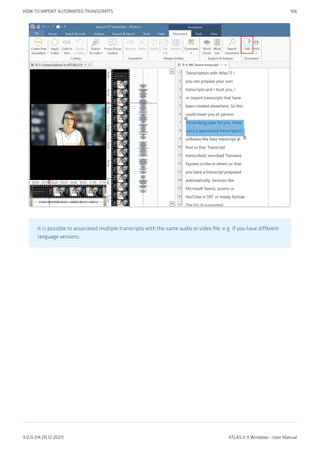
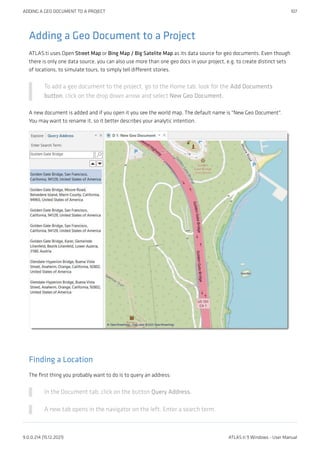
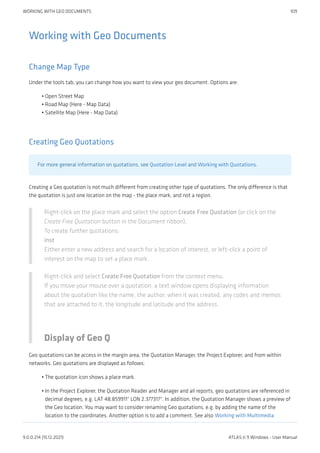
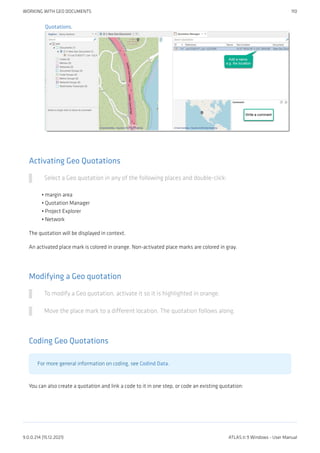
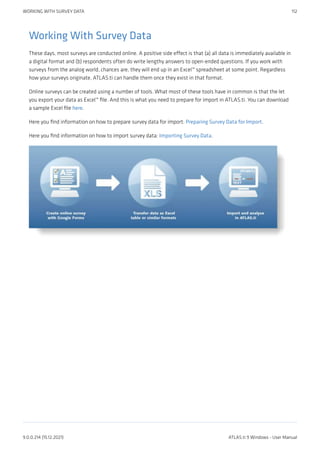
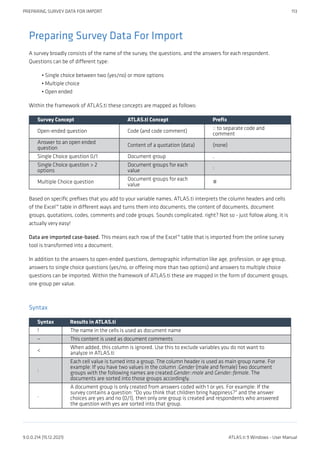
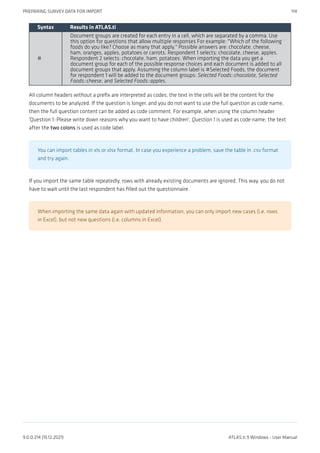
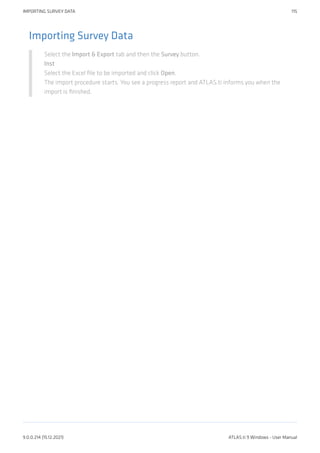
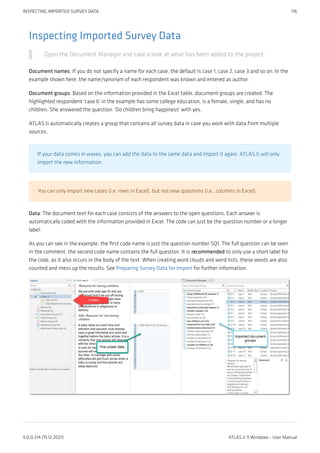
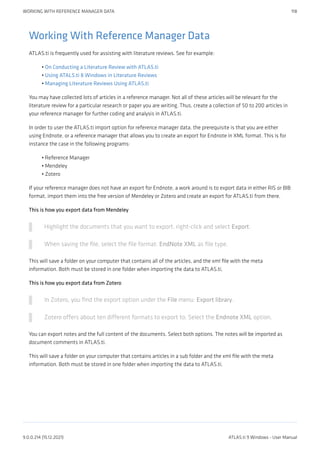
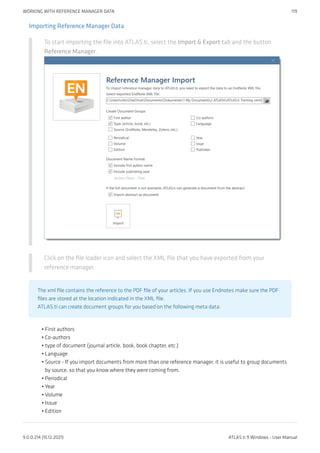
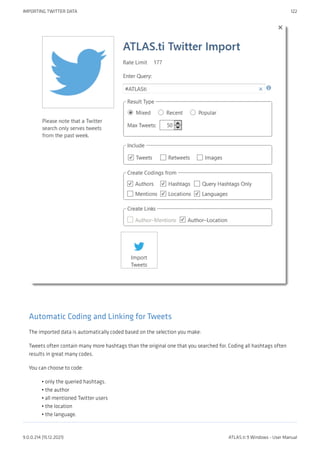
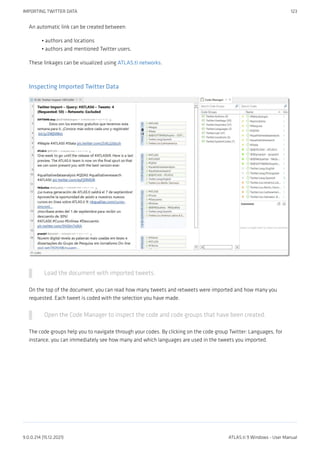
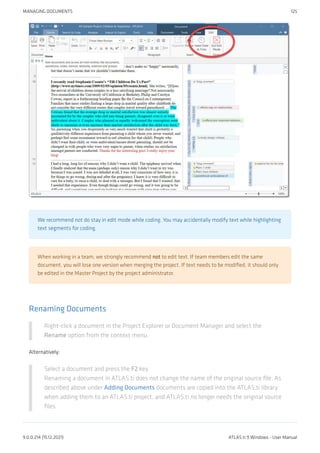
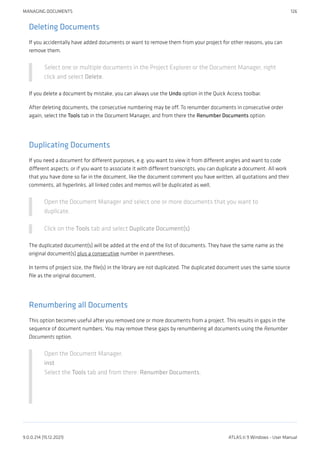
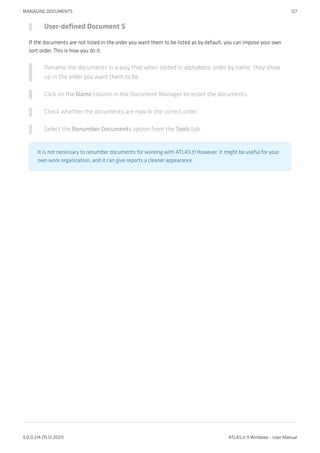
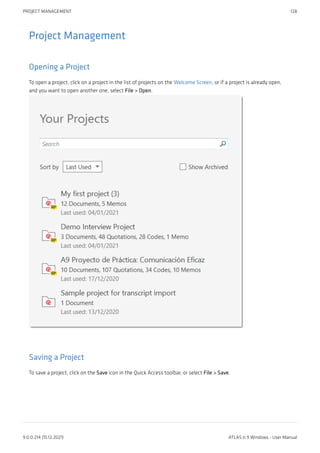
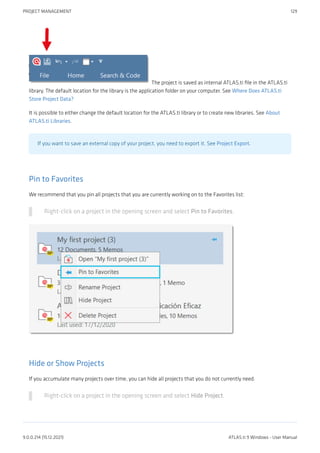
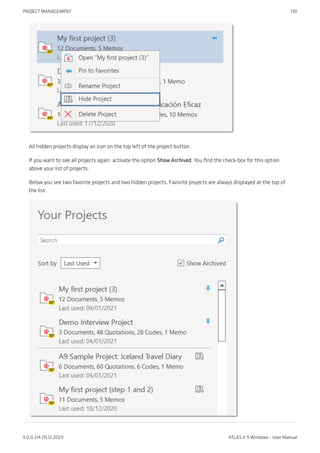
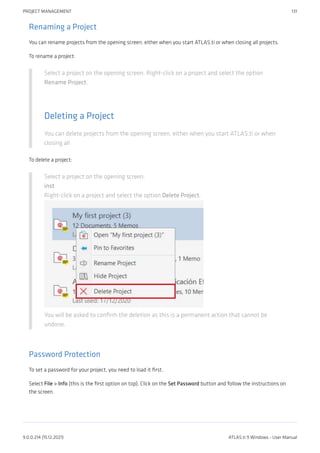
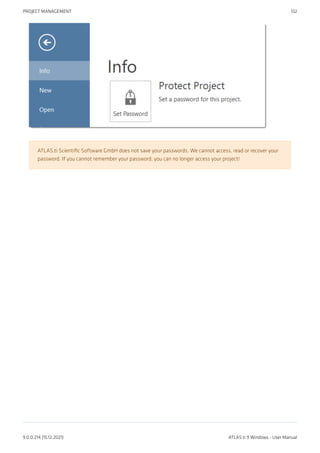
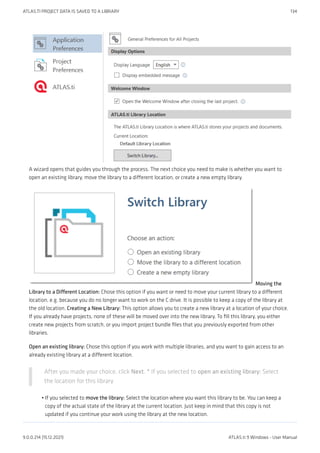
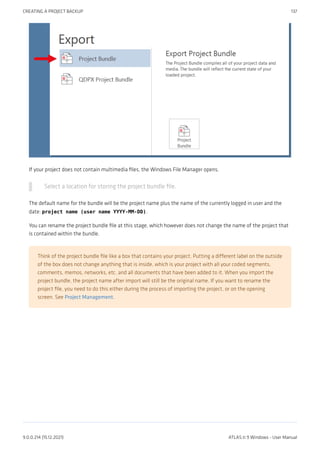
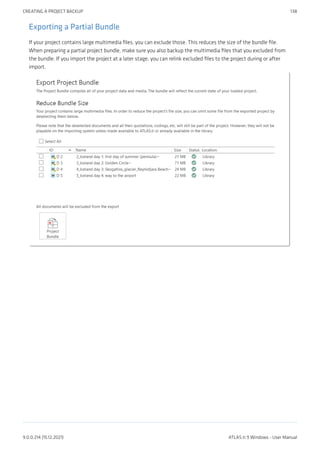
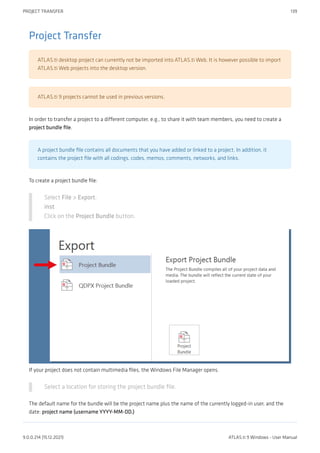
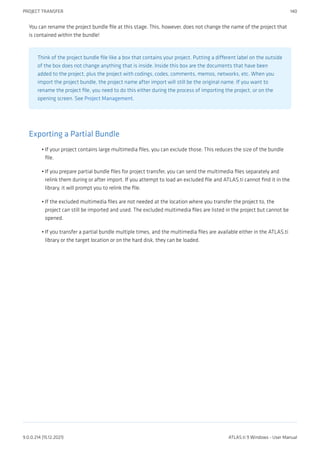
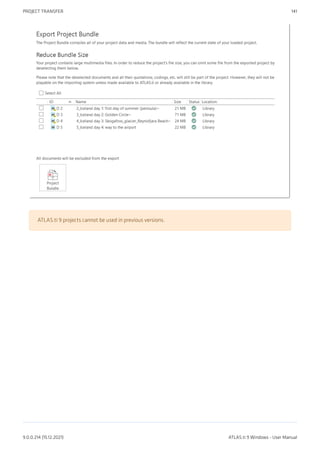
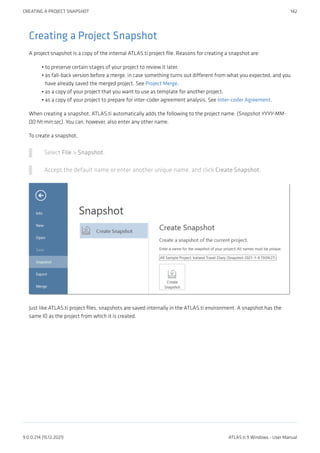
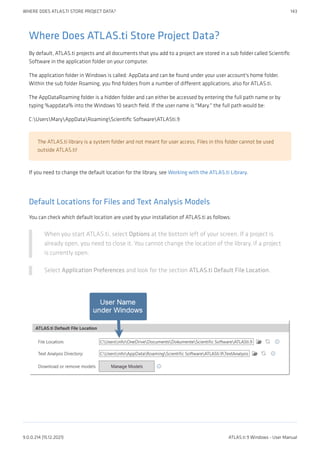
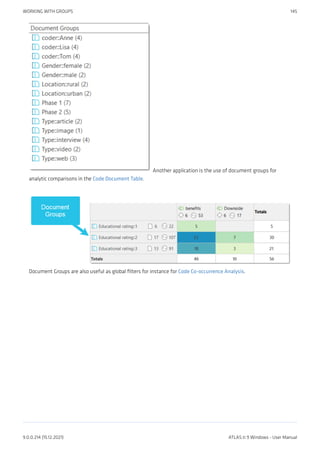
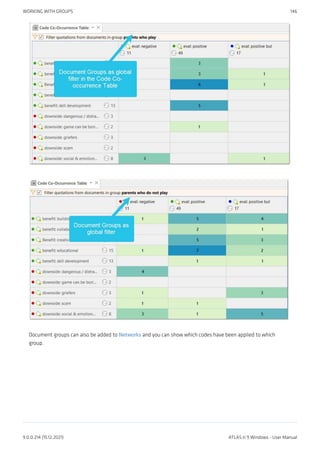
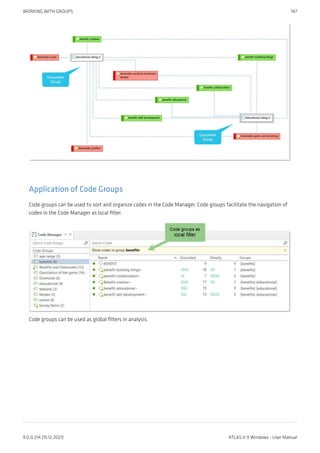
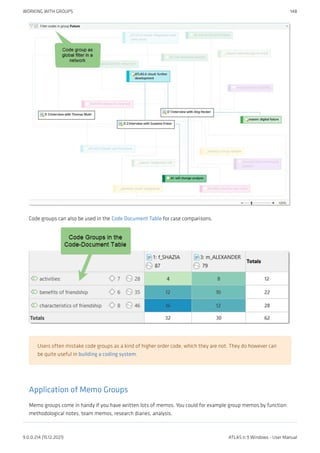
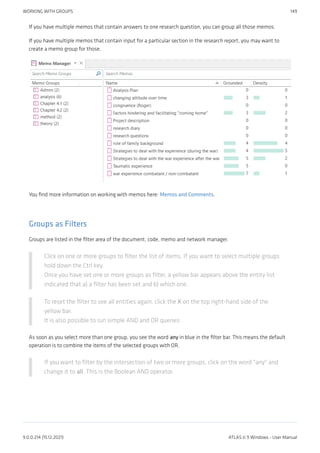
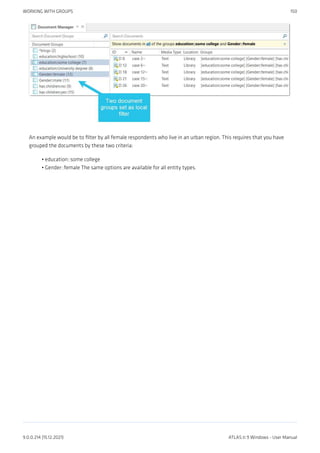
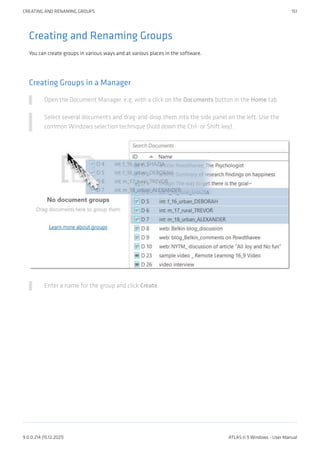
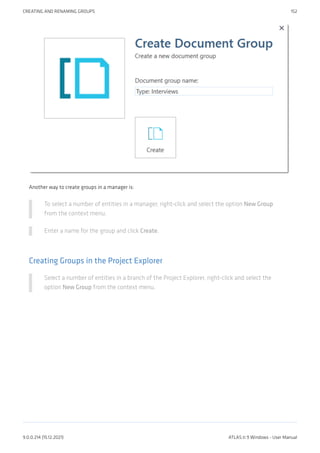
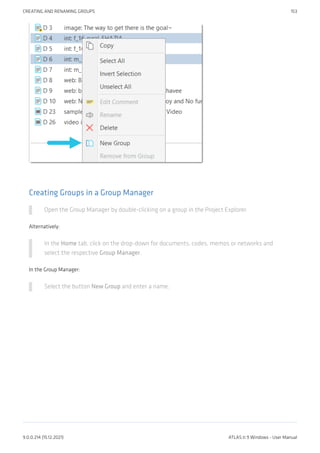
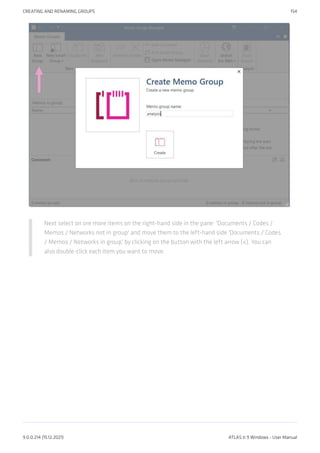
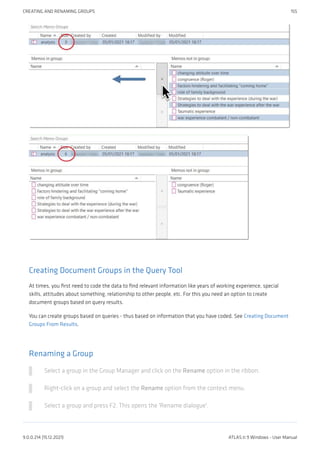
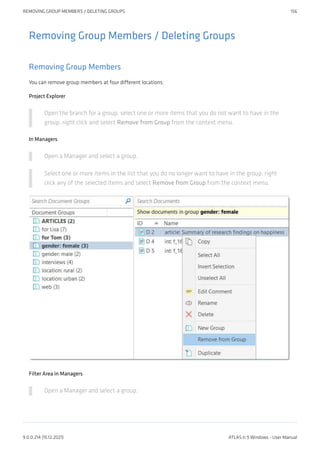
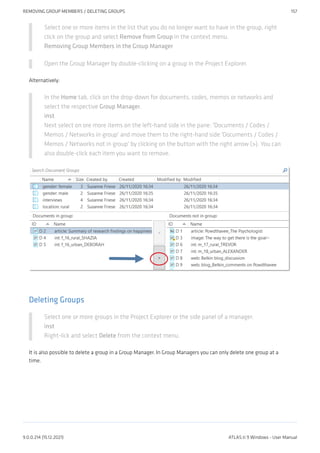
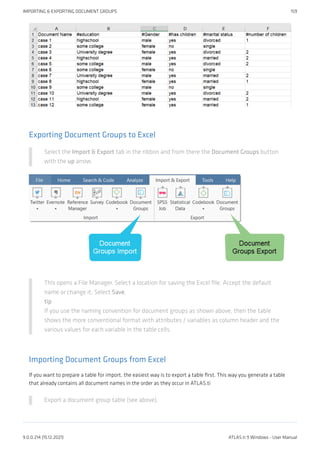
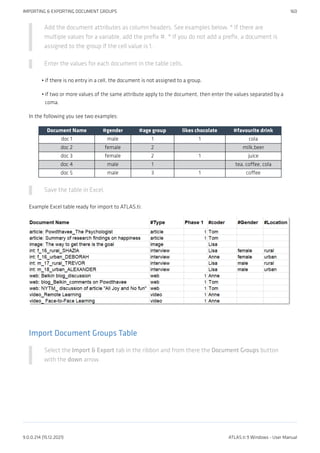
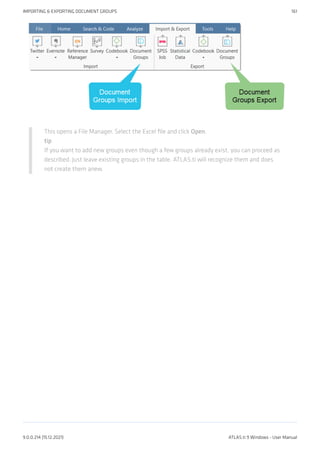
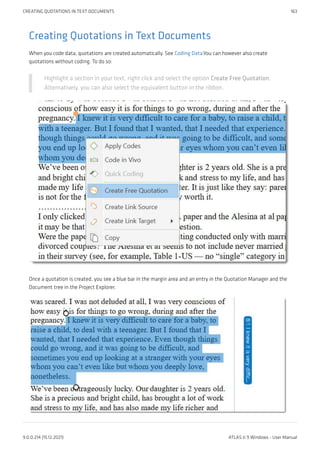
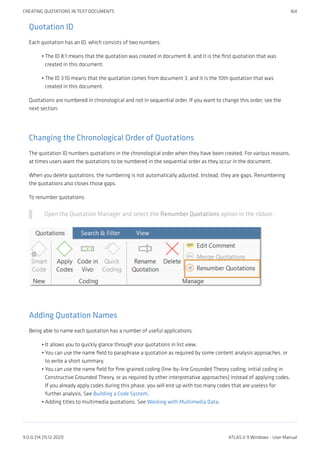
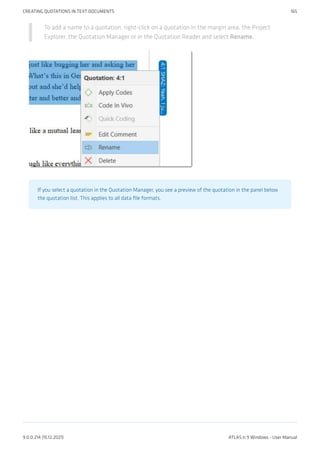
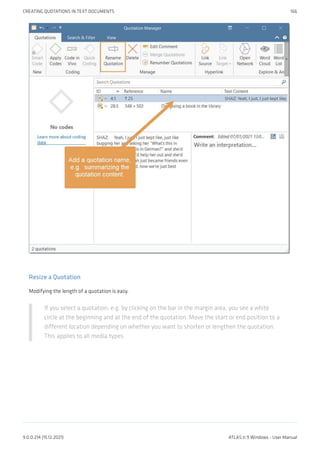
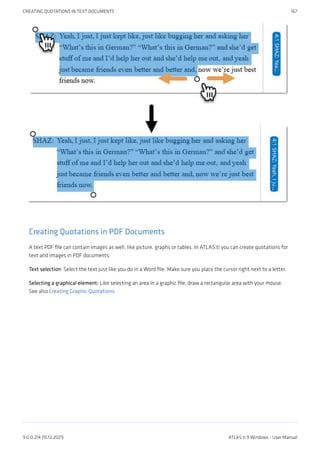
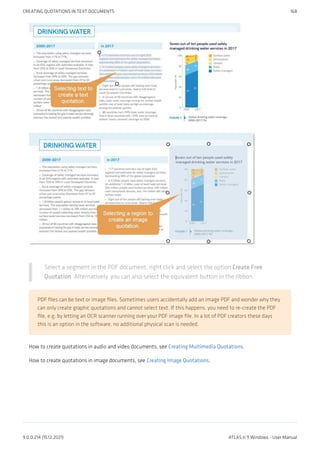
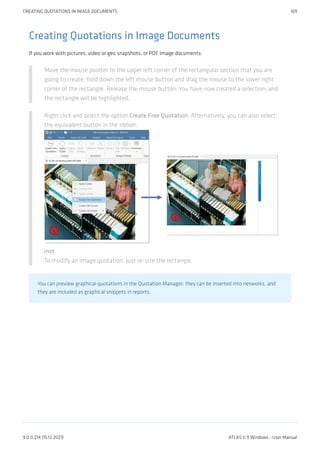
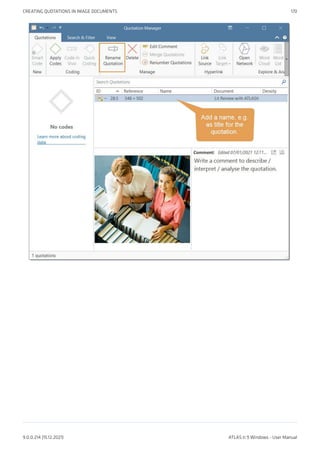
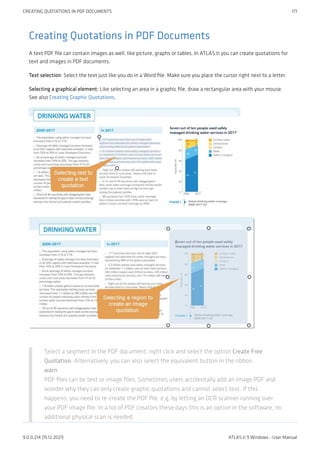
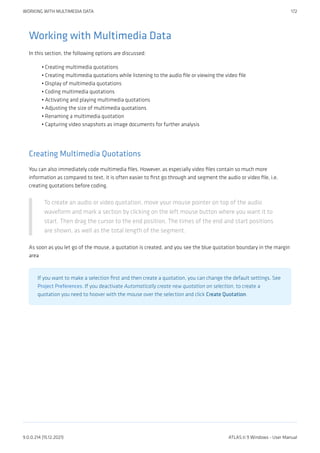

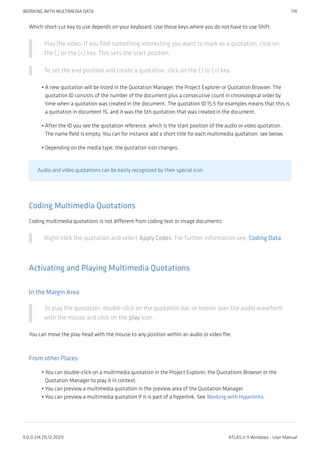
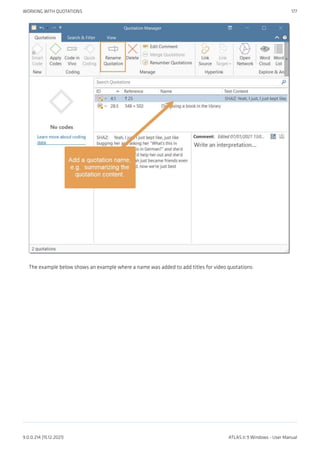
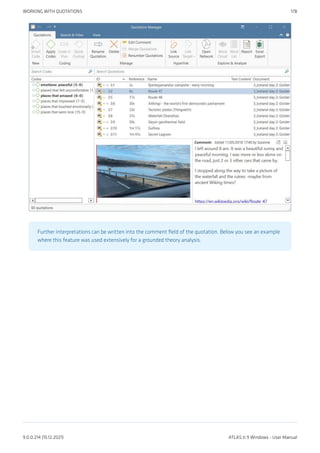
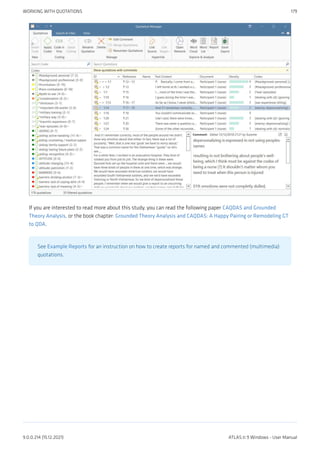
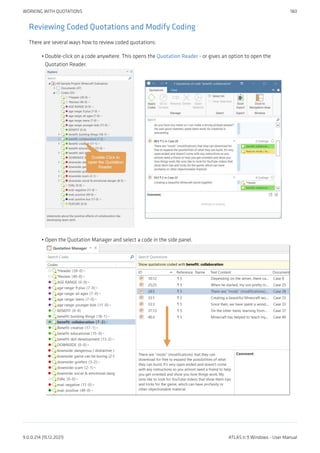
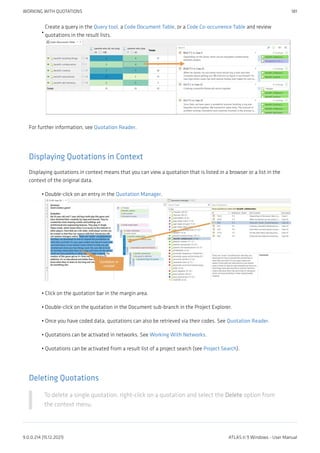
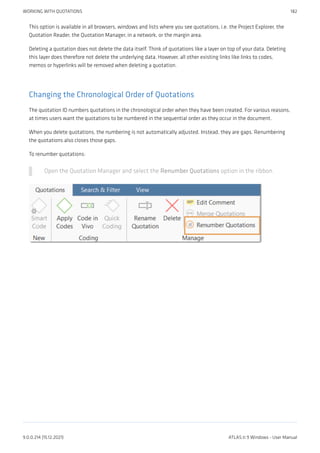
![Coding Data
“Coding means that we attach labels to 'segments of data' that depict what each segment is about. Through
coding, we raise analytic questions about our data from […]. Coding distills data, sorts them, and gives us an
analytic handle for making comparisons with other segments of data” (Charmaz, 2014:4).
“Coding is the strategy that moves data from diffuse and messy text to organized ideas about what is going
on” (Richards and Morse, 2013:167).
"Coding is a core function in ATLAS.ti that lets you “tell” the software where the interesting things are in your
data. ... the main goal of categorizing your data is to tag things to define or organize them. In the process of
categorization, we compare data segments and look for similarities. All similar elements can be grouped
under the same name. By naming something, we conceptualize and frame it at the same time" (Friese,
2019).
Creating New Codes without Coding
You can create codes that have not (yet) been used for coding. Such codes are called "free" codes. This can for
example be useful when ideas for codes come to mind during normal coding work and that cannot be applied to
the current segment but will be useful later. Sometimes you also need free codes for expression conceptual
connections in networks. If you already have a list of codes, possibly including code descriptions and groupings
elsewhere, you can use the option: Importing A List Of Codes.
In the Home tab, click on New Entities and from the drop-down menu select New Code(s).
The short-cut key combination is Ctrl+K.
You can also create new codes in the Code Manager.
Click on the button Free Code(s) in the ribbon of the Code Manager.
Coding with a New Code
Open a document and highlight a data segment, i.e., a piece of text, audio or video data, an
area in a graphic document, or a location in a geo document.
Right-click and select Apply Codes, or use the short-cut Ctrl+J, or click on the 'Apply Codes'
button in the ribbon.
CODING DATA 183
9.0.0.214 (15.12.2021) ATLAS.ti 9 Windows - User Manual](https://image.slidesharecdn.com/atlas-220501063737/85/ATLAS-ti_ManualWin-v9-pdf-197-320.jpg)
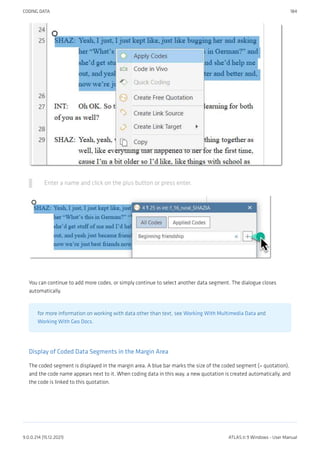
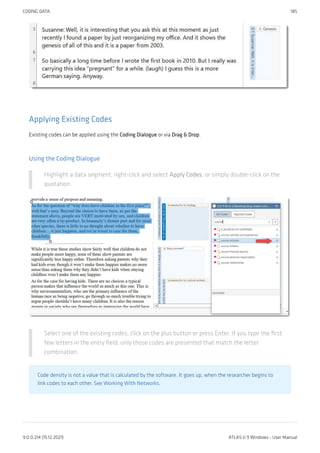
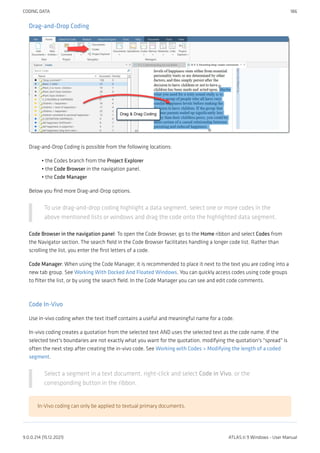
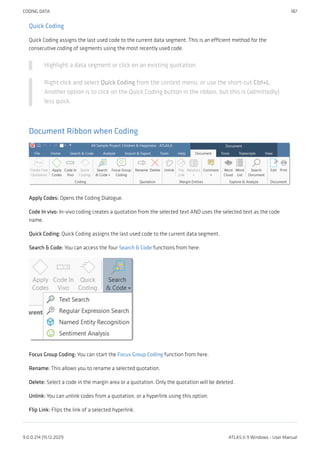
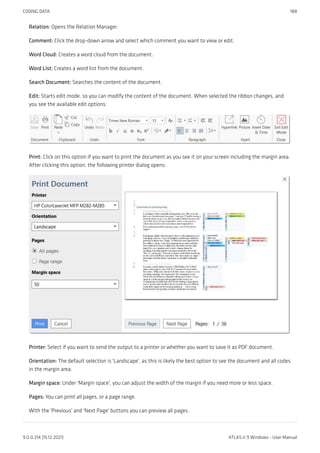
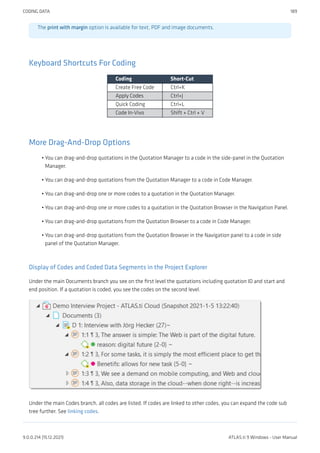
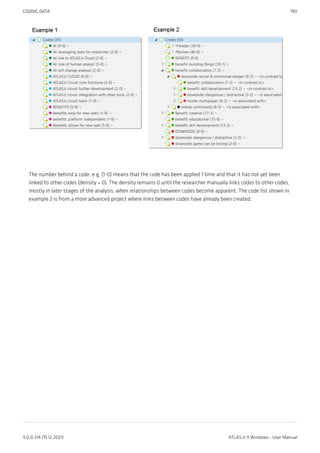
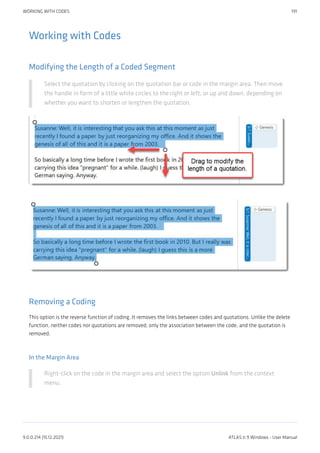
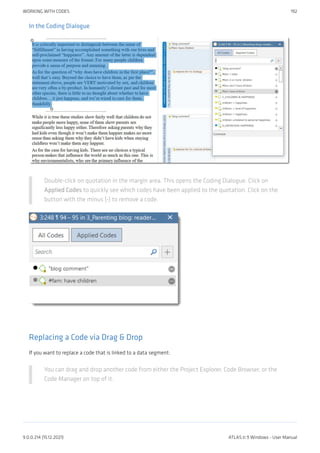
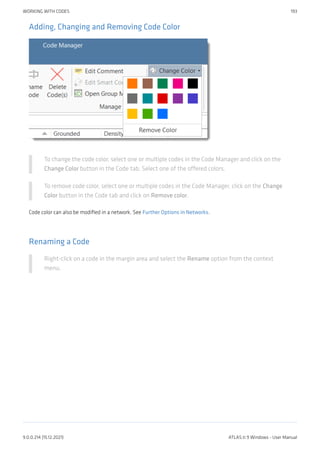
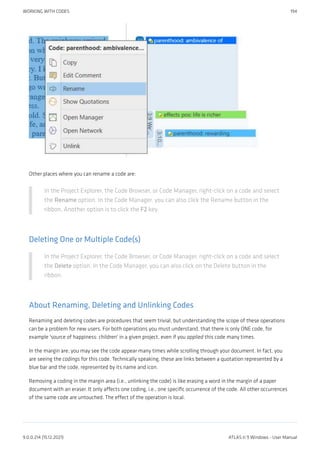
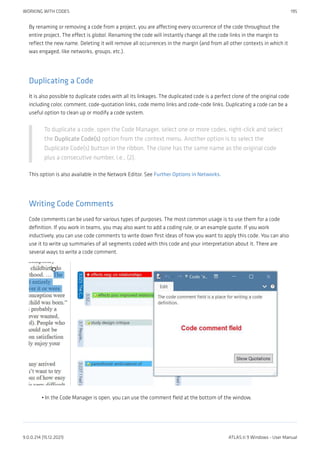
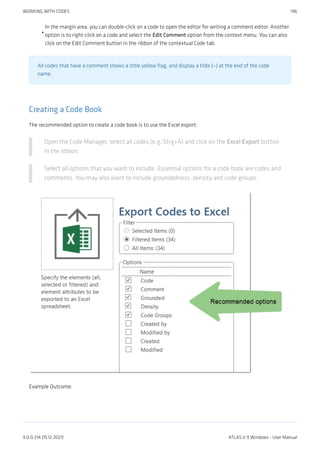
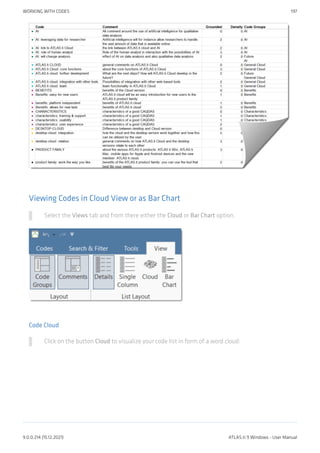
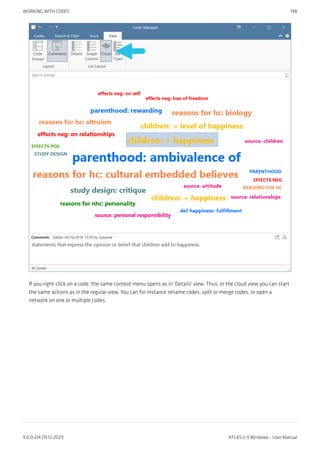
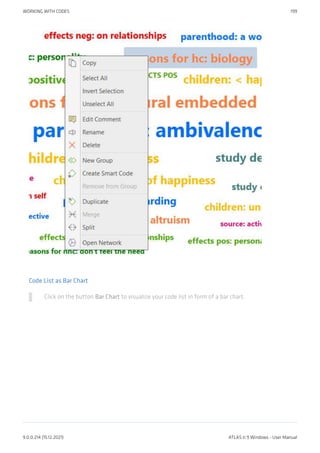
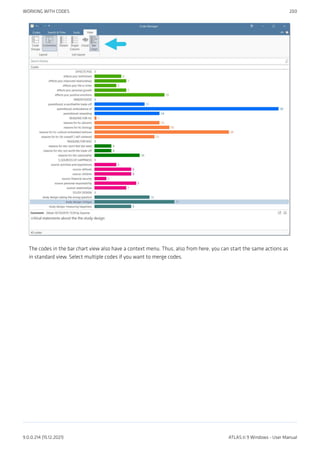
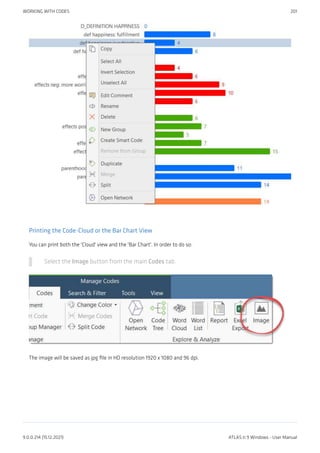
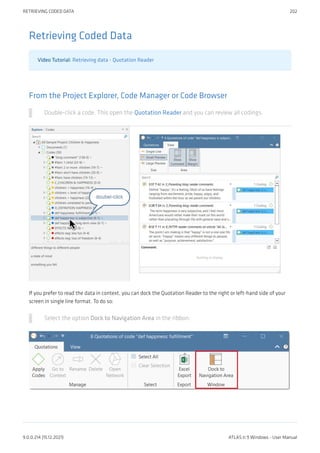
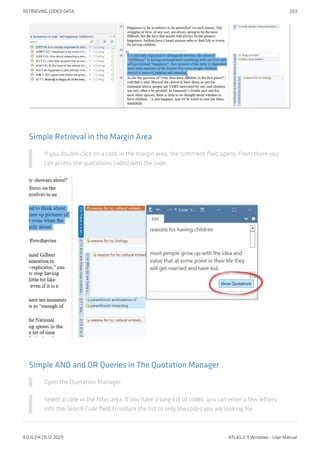
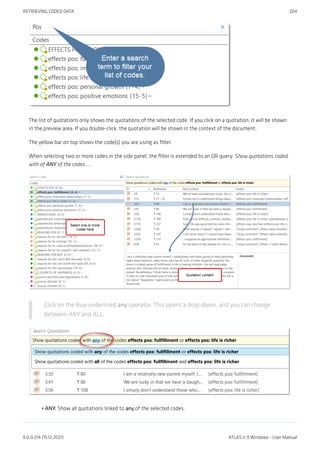
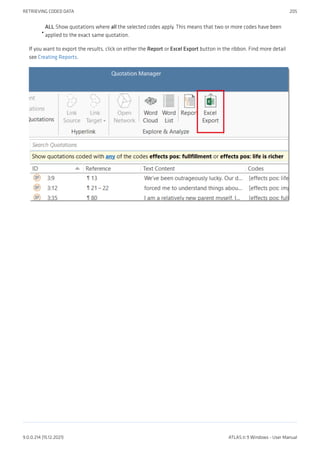
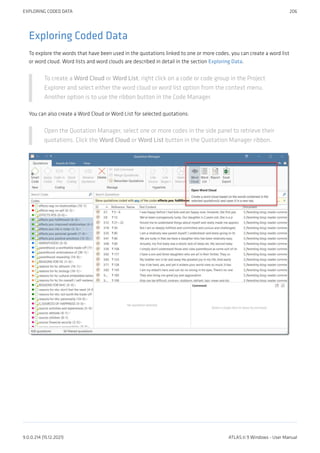
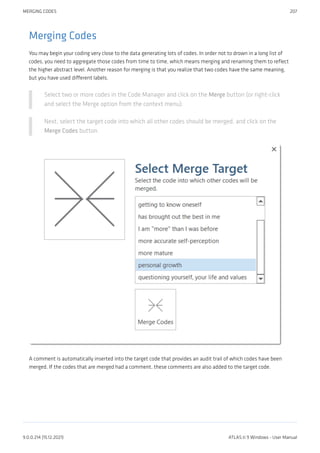
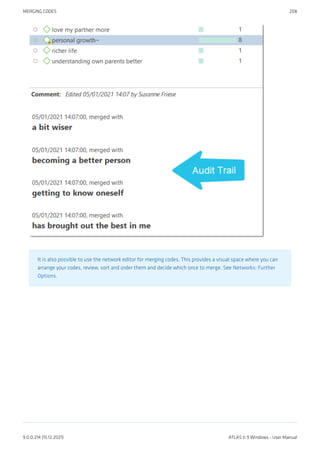
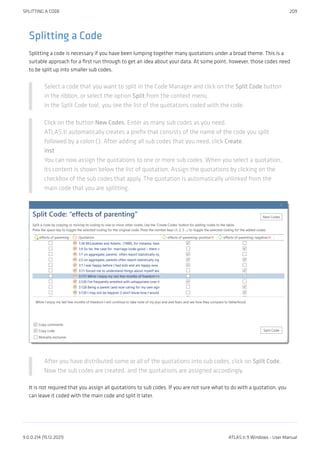
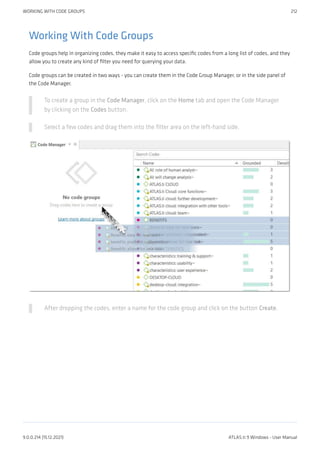
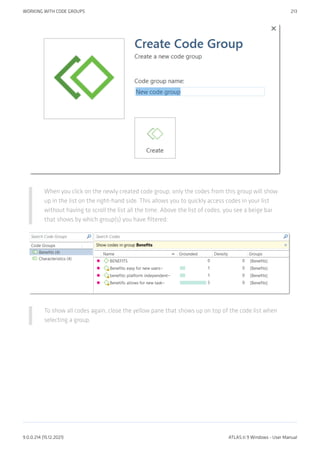
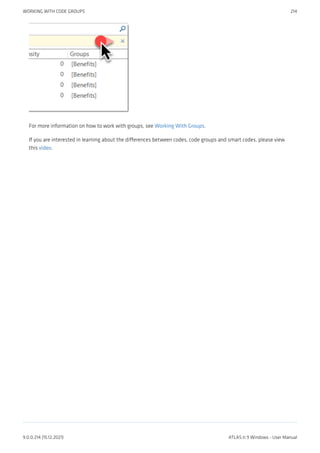
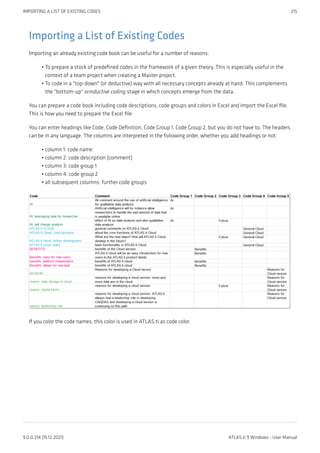
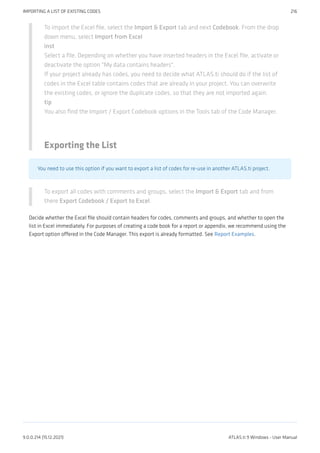
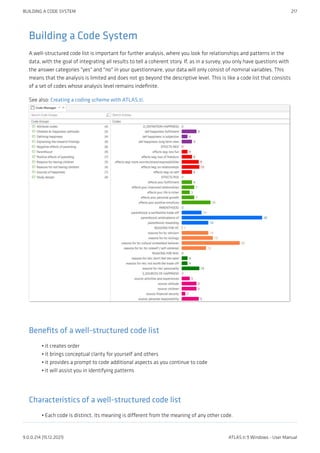
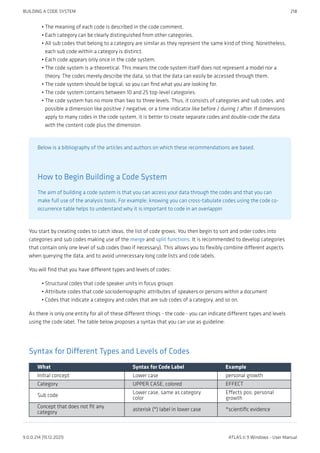
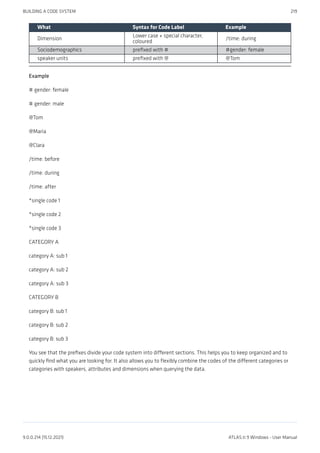
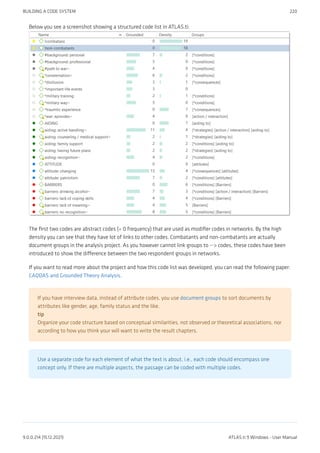
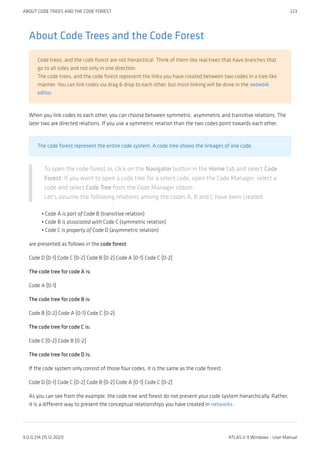
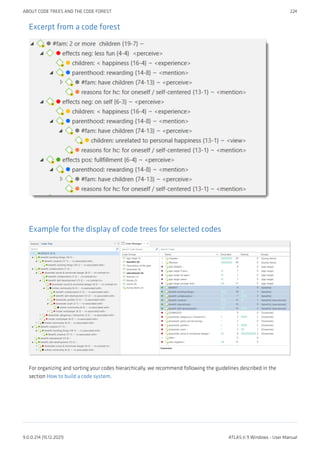
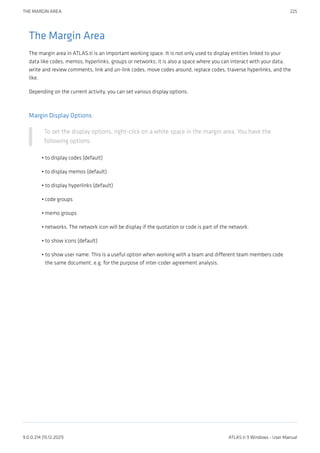
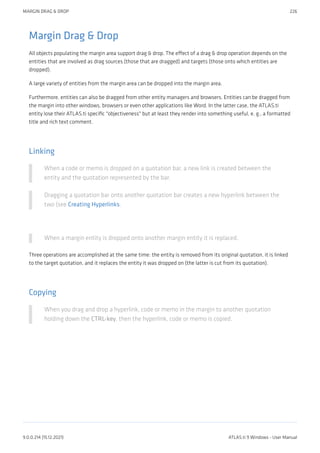
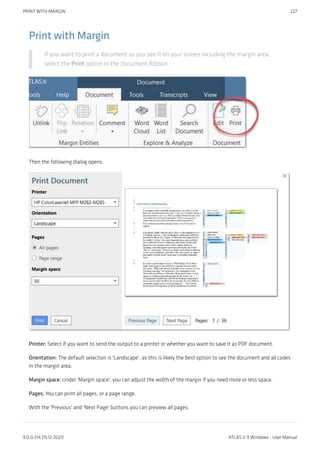
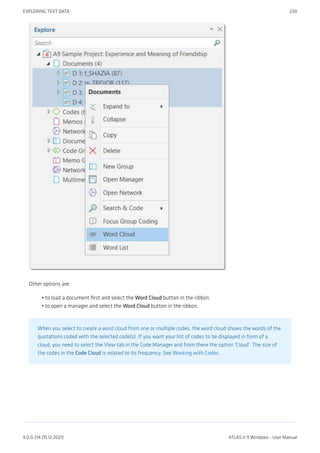
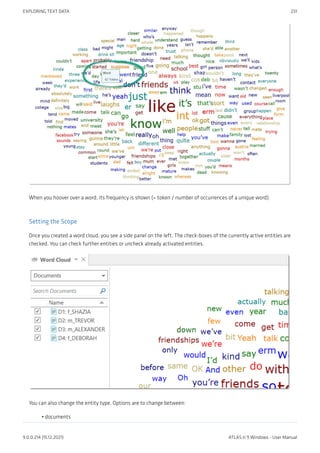
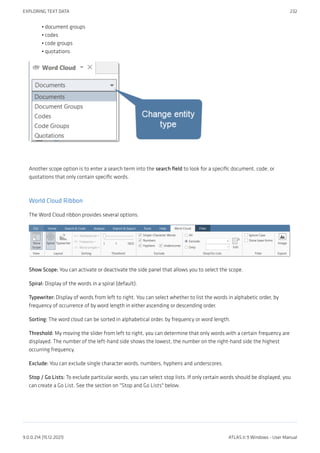
![Filter
Ignore Case: Select this option, if you do not want to count words separately depending on whether they
contain upper or lower case letters.
Show Inflected Forms: The plural forms of nouns, the past tense, past participle, and present participle
forms of verbs, and the comparative and superlative forms of adjectives and adverbs are known as
inflected forms. If you activate this options, the word cloud only shows the basic form of the word, e.g.
building but not buildings.
Export: You can save a word cloud as graphic file (.jpg).
Filter Tab
Character Filter: In this section you can enter special characters that you do not want to be counted and displayed
in the word cloud. By default, the following characters are excluded:
|"(){}[]<>/#+-_%$&“”´`@^‘„
You can select whether these characters should generally be removed or only at word ends.
If you add or remove characters, or deactivate the restriction to word ends, you can click on the Reload button.
This updates the word cloud.
Context Menu Options
When you right-click on a word, you have the following options:
Remove from Word Cloud
Add to Stop List
Copy to Clipboard
Search in Context
•
•
•
•
•
•
EXPLORING TEXT DATA 233
9.0.0.214 (15.12.2021) ATLAS.ti 9 Windows - User Manual](https://image.slidesharecdn.com/atlas-220501063737/85/ATLAS-ti_ManualWin-v9-pdf-247-320.jpg)
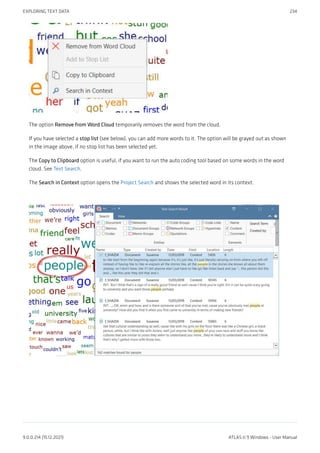
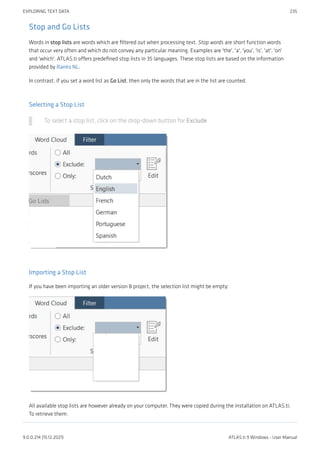
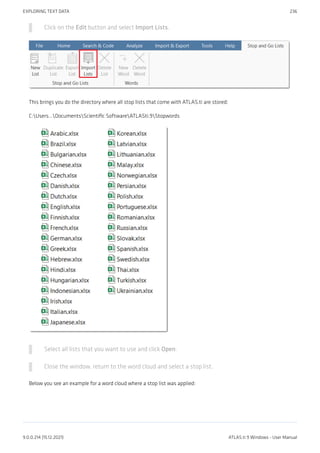
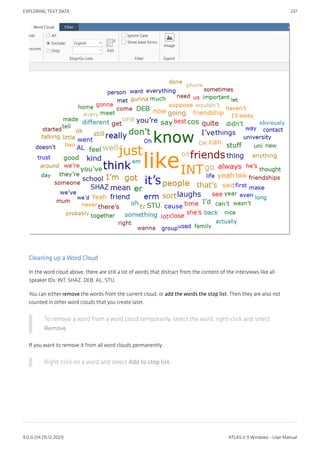
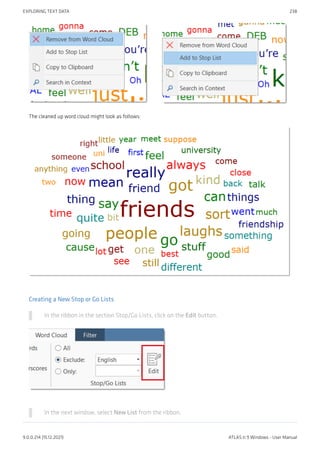
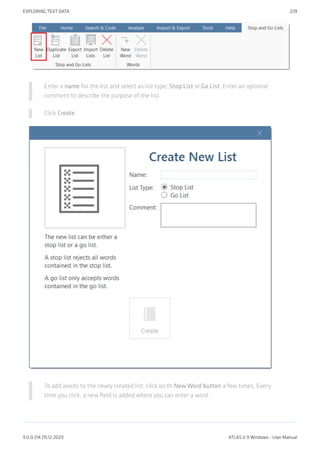
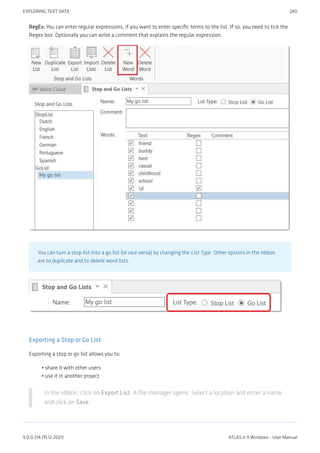
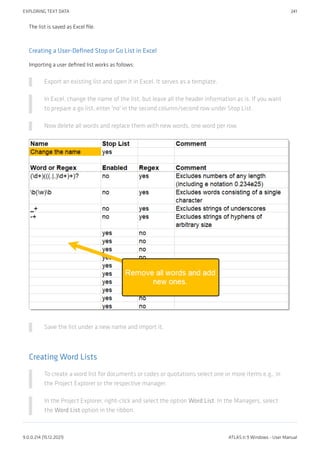
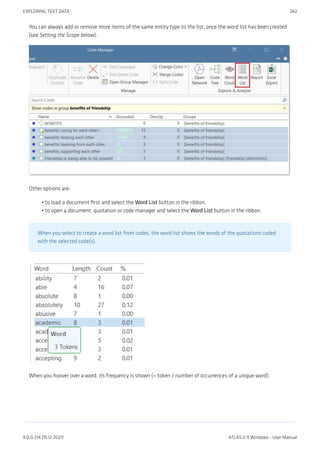
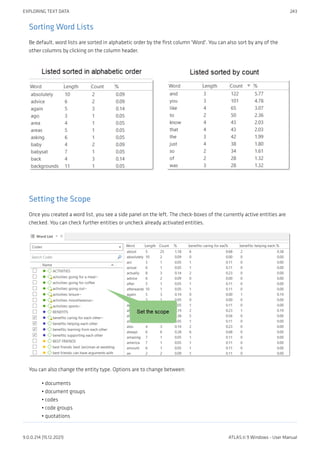
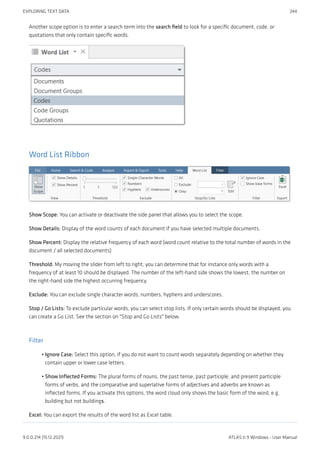
![There are limits in terms of how much data can be meaningfully processed, or moreover handled by and displayed
in Excel. Assuming there are 2000 unique words in a document, and you process 100 documents, this results in an
Excel table consisting of 200.000 cells.
Filter Tab
Character Filter: In this section you can enter special characters that you do not want to be counted and displayed
in the word cloud. By default, the following characters are excluded:
|"(){}[]<>/#+-_%$&“”´`@^‘„
You can select whether these characters should generally be removed or only at word ends.
If you add or remove characters, or deactivate the restriction to word ends, you can click on the Reload button.
This updates the word cloud.
Context Menu Options
When you right-click on a word, you have the following options:
Remove from List
Add to Stop List
Copy to Clipboard
Search in Context
•
•
•
•
EXPLORING TEXT DATA 245
9.0.0.214 (15.12.2021) ATLAS.ti 9 Windows - User Manual](https://image.slidesharecdn.com/atlas-220501063737/85/ATLAS-ti_ManualWin-v9-pdf-259-320.jpg)
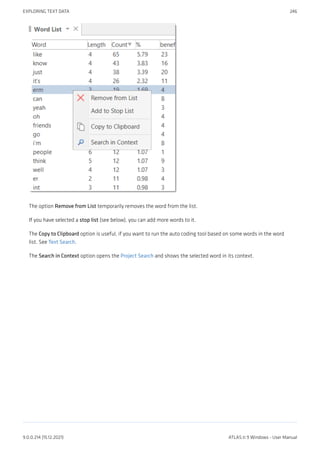
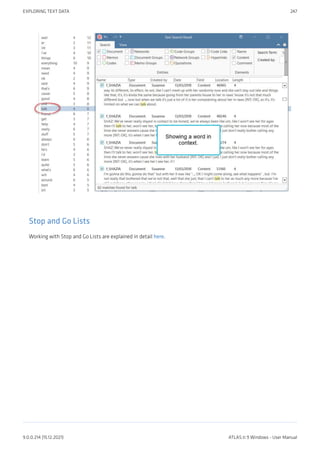
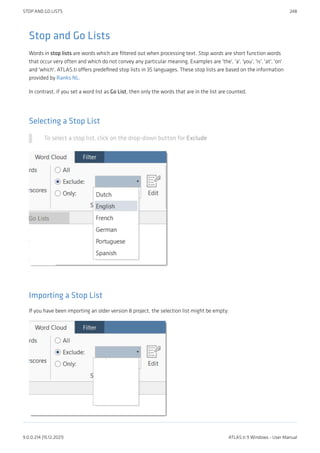
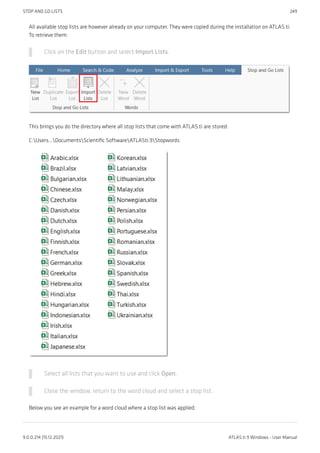
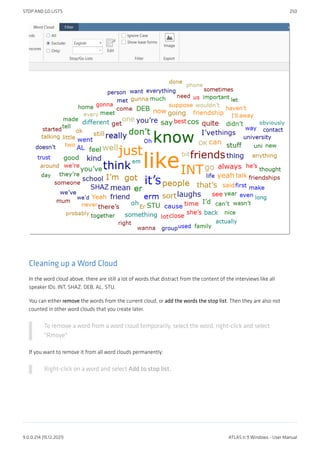
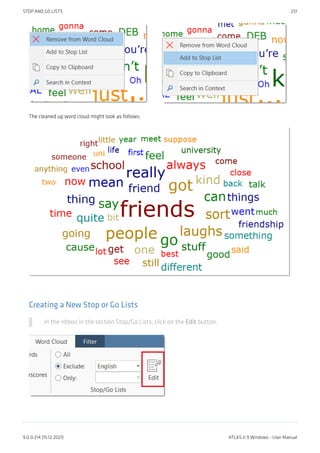
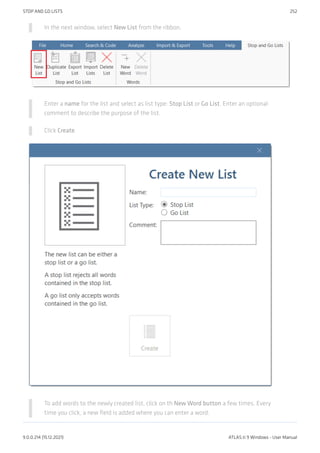
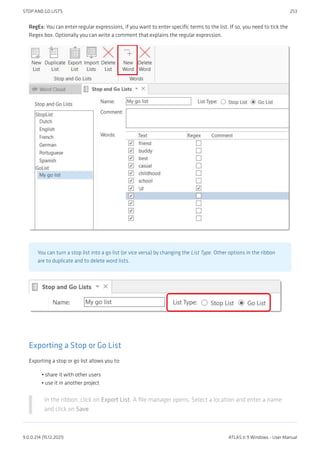
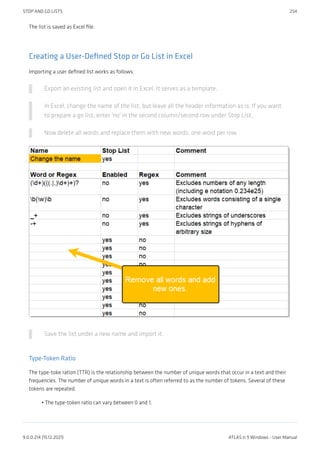
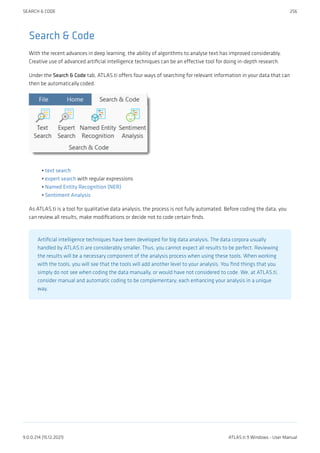
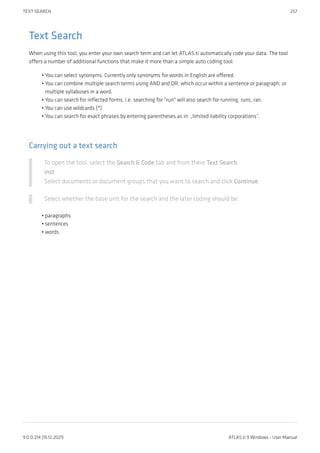
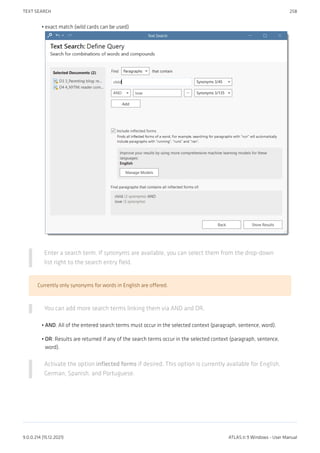
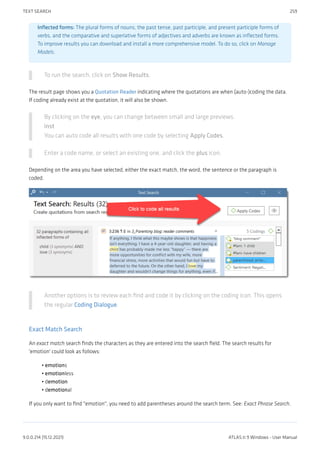
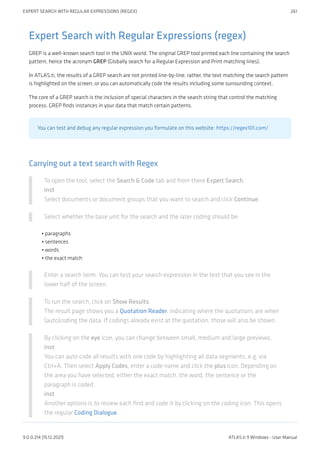
![GREP Examples
GREP Expression Description
^ Matches an empty string at the beginning of a line.
$ Matches an empty string at the end of a line.
. Matches any character except a new line.
+
Matches at least one occurrence of the preceding expression or
character.
*
Matches the preceding element zero or more times. For
example, ab*c matches "ac," "abc," "abbbc," etc.
?
Matches the preceding element zero or one time. For example,
ba? matches "b" or "ba."
[]
Matches a range or set of characters: [a-z] or [0-9] or
[aeiou]. For example: [0-9] finds all numeric characters,
while [^0-9] finds all non-numeric character
b Matches an empty string at a word boundary
B Matches an empty string not a word boundary
< Matches an empty string at the beginning of a word
> Matches an empty string at the end of a word
Backspace character disables the
special GREP functionality of the
following character:
GREP Expression Description
d Matches any digit (equivalent to [0-9])
D Matches anything but a digit
s Matches a white-space character
S Matches anything but a white-space character
w Matches any word constituent character
W any character but a word constituent
Character classes
Character
Classes
Description
[:alnum:] Any alphanumeric, i.e., a word constituent, character
[:alpha:] Any alphabetic character
[:cntrl:]
Any control character. In this version, it means any character whose ASCII code is <
32.
[:digit:] Any decimal digit
[:graph:]
Any graphical character. In this version, this mean any character with the code >=
32.
[:lower:] Any lowercase character
[:punct:] Any punctuation character
[:space:] Any white-space character
[:upper:] Any uppercase character
[:xdigit:] Any hexadecimal character
EXPERT SEARCH WITH REGULAR EXPRESSIONS (REGEX) 262
9.0.0.214 (15.12.2021) ATLAS.ti 9 Windows - User Manual](https://image.slidesharecdn.com/atlas-220501063737/85/ATLAS-ti_ManualWin-v9-pdf-276-320.jpg)
![Note that these elements are components of the character classes, i.e. they have to be enclosed in an
extra set of square brackets to form a valid regular expression. A non-empty string of digits or arbitrary
length would be represented as [[:digit:]]+
Examples of GREP Searches
In the following, a few search examples are presented showing the matching GREP expression in the column on
the right.
The expression man|woman matches "man" and "woman." You could also use (|wo)man to the same effect.
H(a|e)llo matches "Hello" and "Hallo."
H(a|e)+llo matches "Haaaaaallo" as well as "Heeeeeaaaaeaeaeaeaello."
And how about the (angry|lazy|stupid) (man|woman) (walk|run|play|fight)ing with the
gr(a|e)y dog - get the idea?
•
•
•
•
EXPERT SEARCH WITH REGULAR EXPRESSIONS (REGEX) 263
9.0.0.214 (15.12.2021) ATLAS.ti 9 Windows - User Manual](https://image.slidesharecdn.com/atlas-220501063737/85/ATLAS-ti_ManualWin-v9-pdf-277-320.jpg)
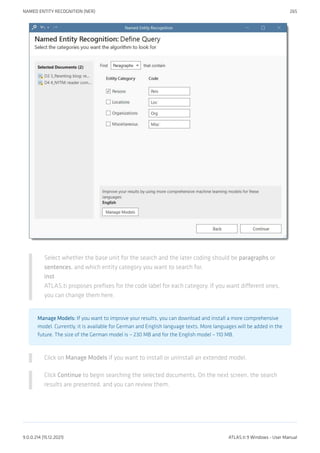
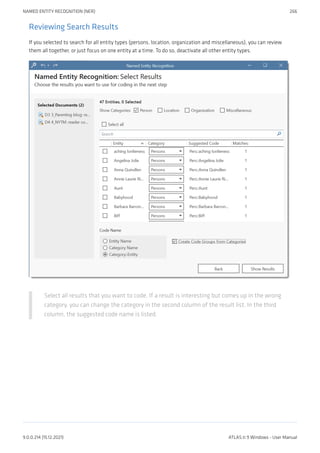
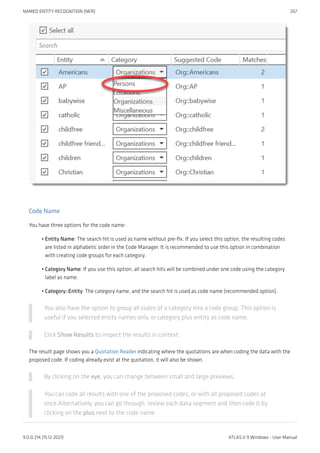
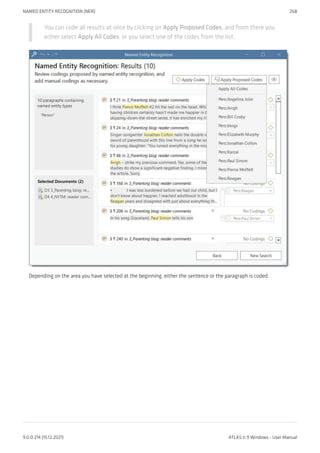
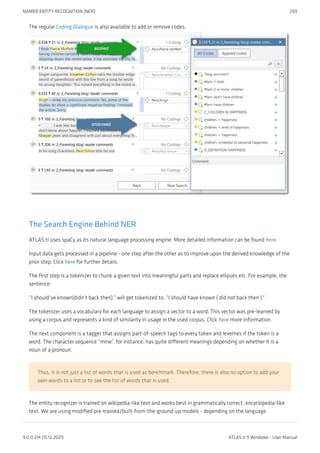
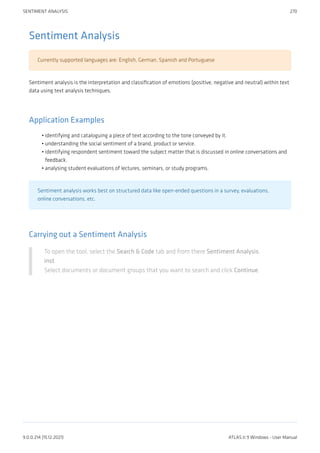
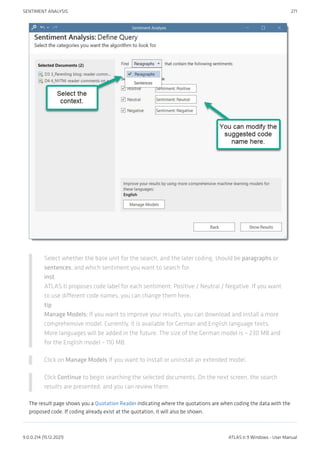
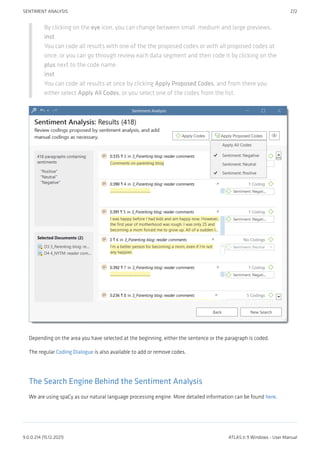
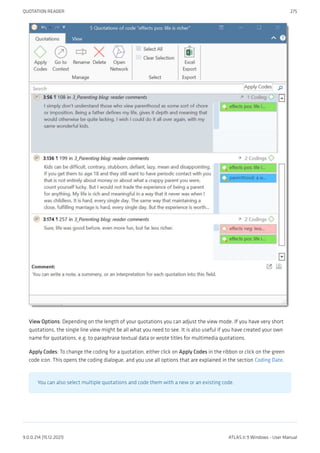
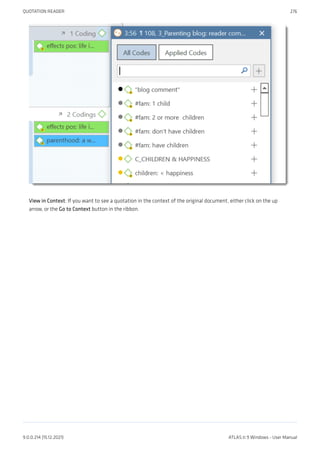
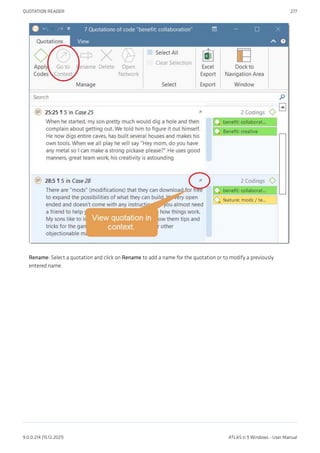
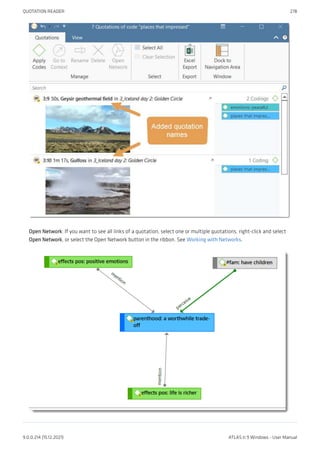
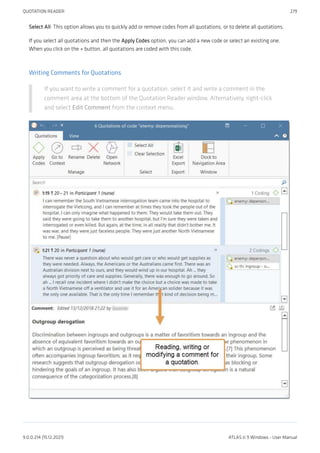
![Custom Pattern
You can also define your own pattern including the use of regular expressions.
This might be useful if you have previously prepared transcripts and speaker IDs have not been used consistently.
For instance, the regular expression: To+(m|n) matches "Toom," "Ton," or "Toon" to find different spellings of the
name 'Tom'.
([A-Z]+): recognizes identifiers consisting of letters from A to Z.
([A-Z]+[0-9]+): recognizes identifiers that consist of a combination of letters and numbers
For more information, see Regular Expressions (GREP).
You can use this functionality to auto code any data that has a specific structure. It does not necessarily
have to be a speaker. It could be a date, a number, or any other type of identifier.
CUSTOM PATTERN 283
9.0.0.214 (15.12.2021) ATLAS.ti 9 Windows - User Manual](https://image.slidesharecdn.com/atlas-220501063737/85/ATLAS-ti_ManualWin-v9-pdf-297-320.jpg)
![Example transcripts
The speaker IDs do not have to be in bold letters. Bold letters are used here only to make it easier for you to see,
which ones are the speaker IDs.
Example A (pattern 1)
Alex: I don't know, I'm the sort, I don't really struggle to make friends cos everyone tells me I've got a big mouth,
and I don't stop talking [laughs]
Tom: So is that how, is that how you met just, just through you striking up a conversation?
Deb: I'm trying to think exactly [laughs] I think that's what it was, we were both in the same research methods
class ...
Example B (pattern 1)
Alex:
I don't know, I'm the sort, I don't really struggle to make friends cos everyone tells me I've got a big mouth, and I
don't stop talking [laughs] .
Tom:
So is that how, is that how you met just, just through you striking up a conversation?
Deb:
I'm trying to think exactly [laughs] I think that's what it was, we were both in the same research methods class.
Example C (pattern 1)
It is also possible to add further information to each speaker like their gender, age group, educational level
etc. This way, also this information will be automatically coded.
Alex: gender male: age group 1: education high school:
I don't know, I'm the sort, I don't really struggle to make friends cos everyone tells me I've got a big mouth, and I
don't stop talking [laughs]
Tom: gender male: age group 2: education high school:
So is that how, is that how you met just, just through you striking up a conversation?
EXAMPLE TRANSCRIPTS 284
9.0.0.214 (15.12.2021) ATLAS.ti 9 Windows - User Manual](https://image.slidesharecdn.com/atlas-220501063737/85/ATLAS-ti_ManualWin-v9-pdf-298-320.jpg)
![Deb: gender female: age group 2: education some college:
I'm trying to think exactly [laughs] I think that's what it was, we were both in the same research methods class.
Example D (pattern 2)
@Alex: I don't know, I'm the sort, I don't really struggle to make friends cos everyone tells me I've got a big mouth,
and I don't stop talking [laughs].
@Tom: So is that how, is that how you met just, just through you striking up a conversation?
@Deb: I'm trying to think exactly [laughs] I think that's what it was, we were both in the same research methods
class.
If your data is not transcribed yet, we recommend using pattern 2 as it is unlikely this pattern will find
sections that are not speaker units.
EXAMPLE TRANSCRIPTS 285
9.0.0.214 (15.12.2021) ATLAS.ti 9 Windows - User Manual](https://image.slidesharecdn.com/atlas-220501063737/85/ATLAS-ti_ManualWin-v9-pdf-299-320.jpg)
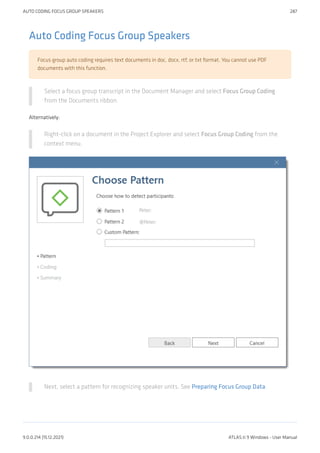
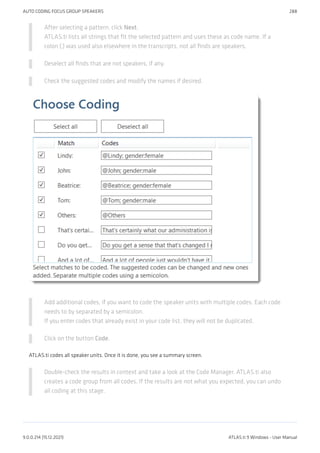
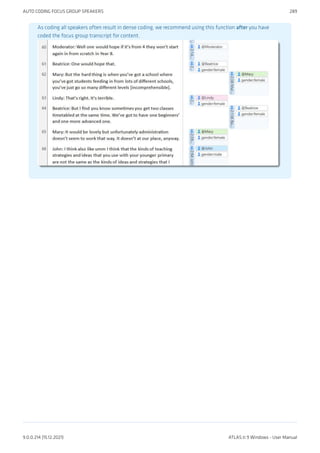
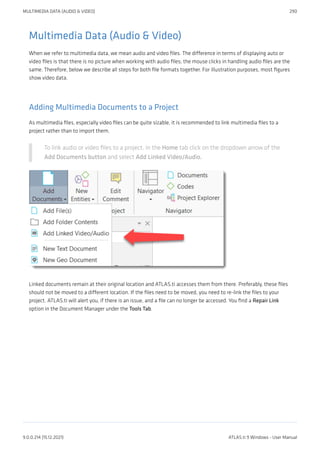
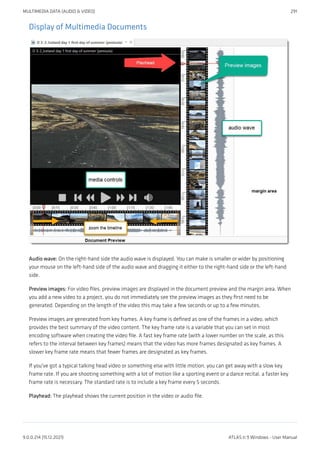
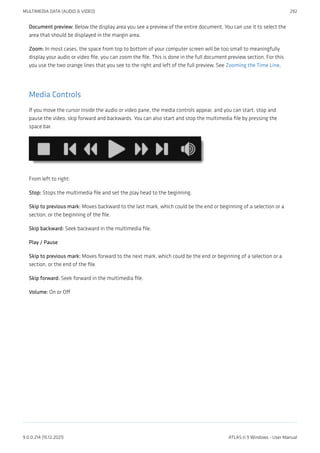
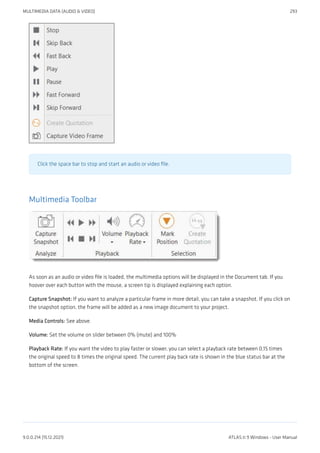
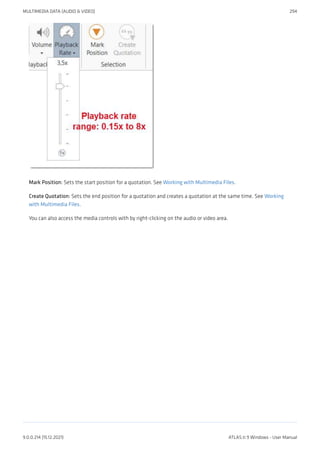
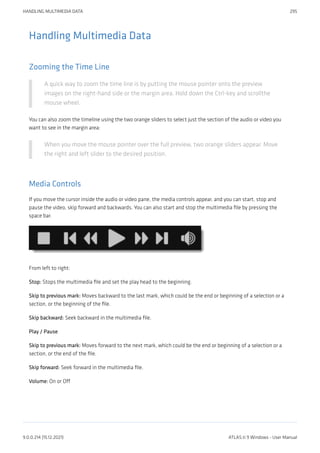
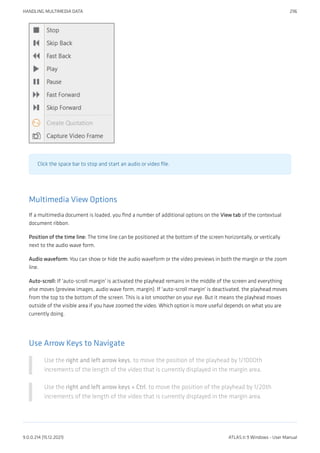
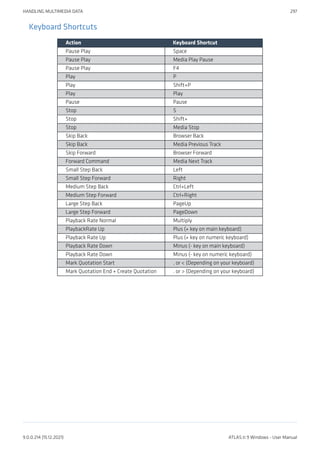

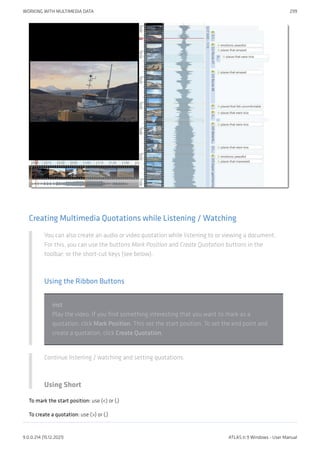

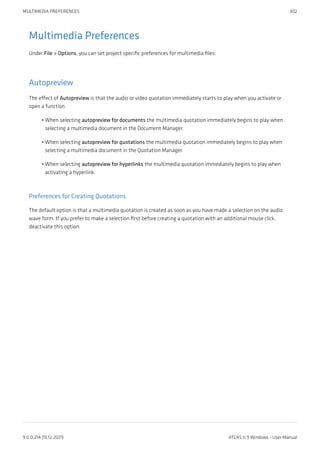
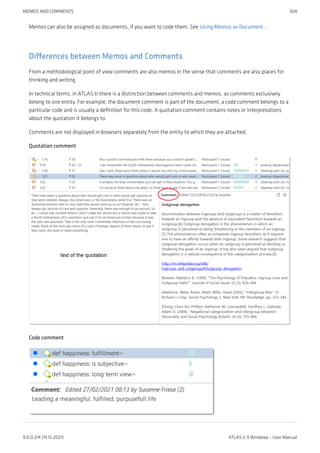
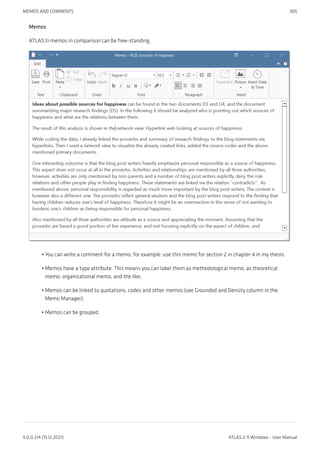
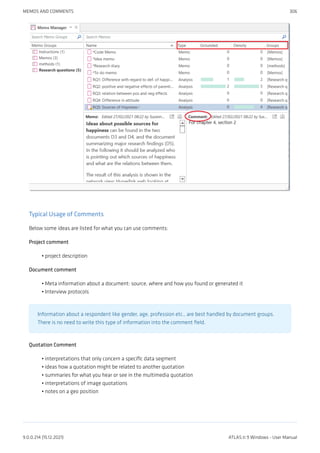
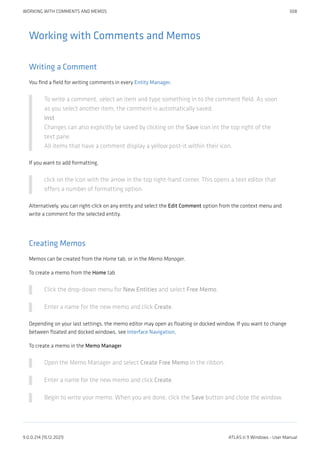
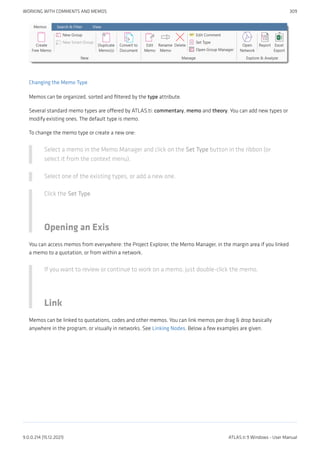
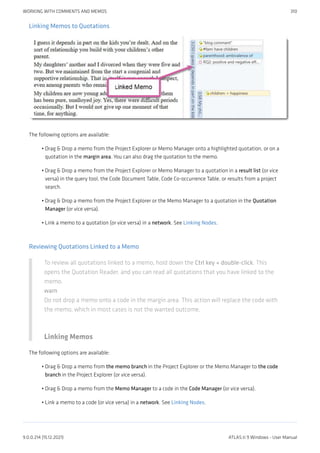
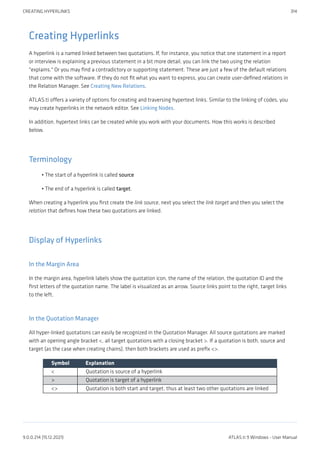
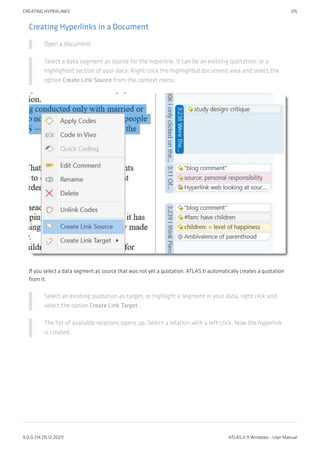
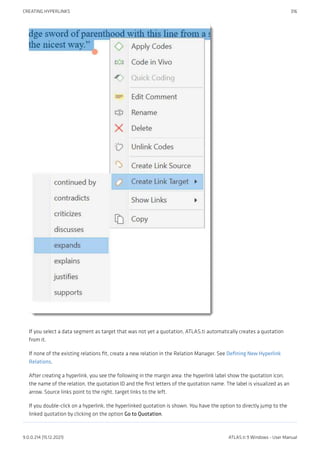
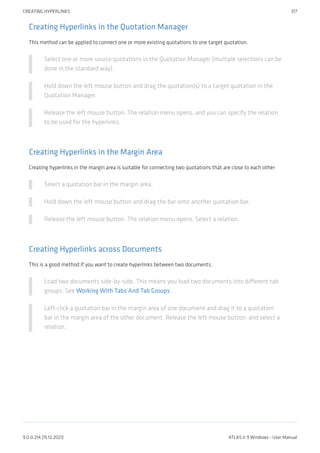
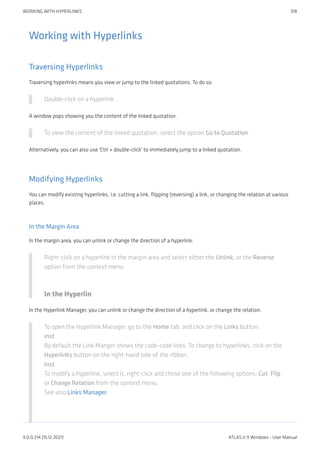
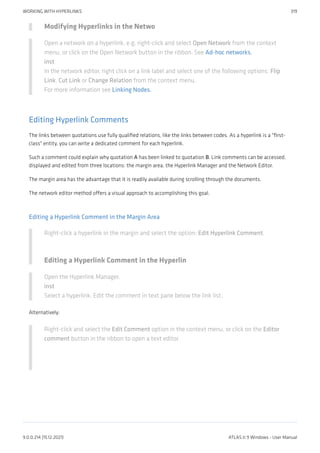
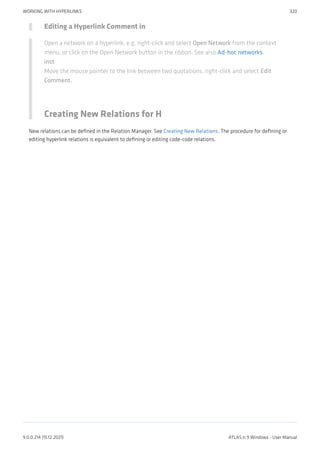
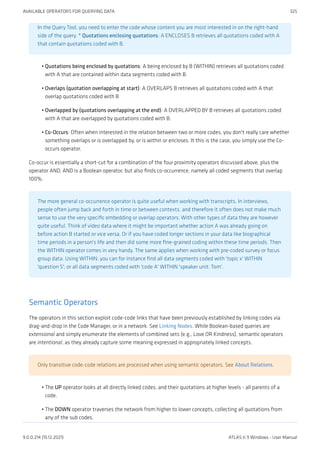
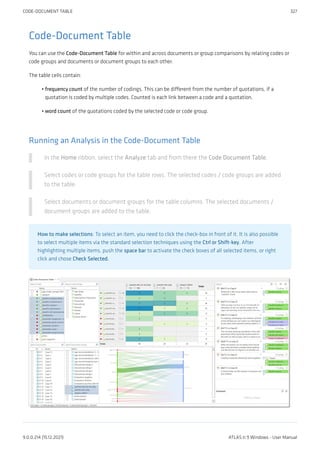
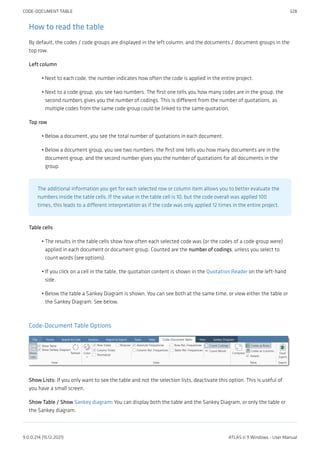
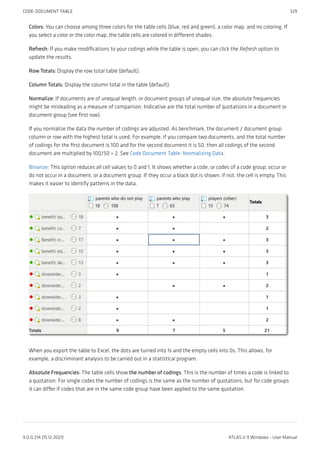
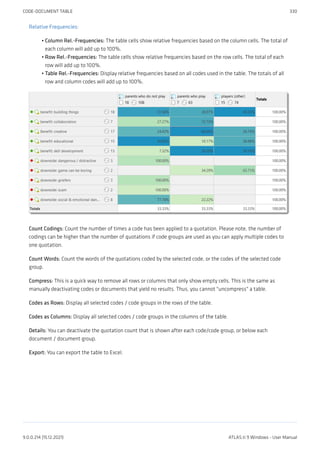
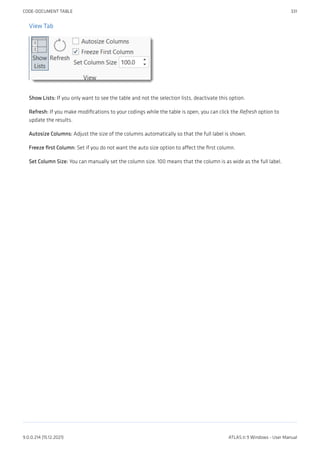
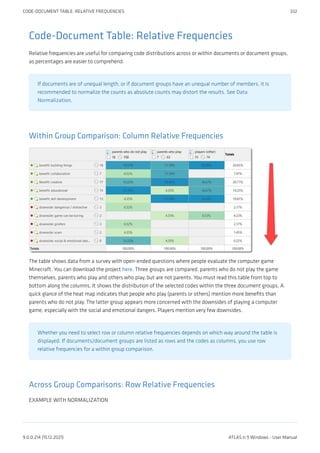
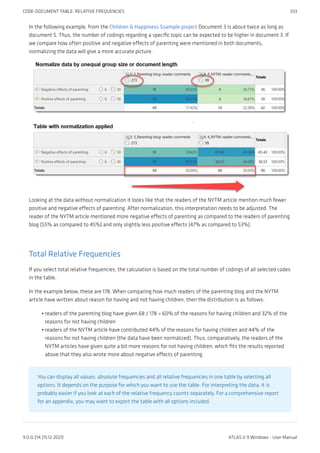
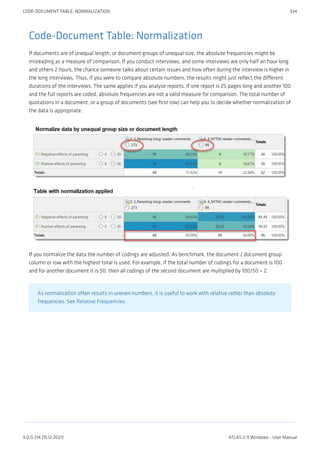

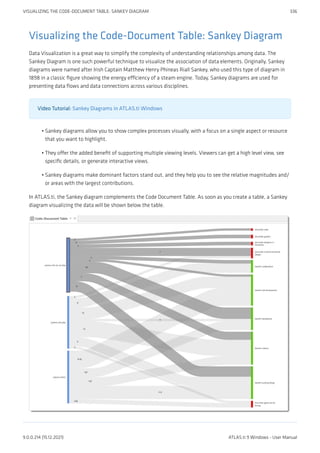
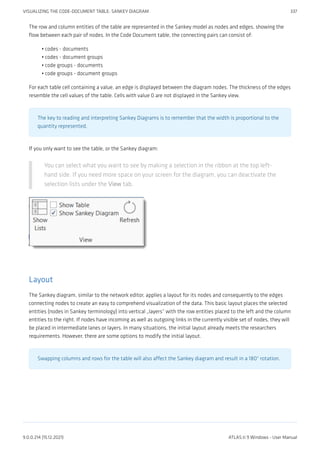
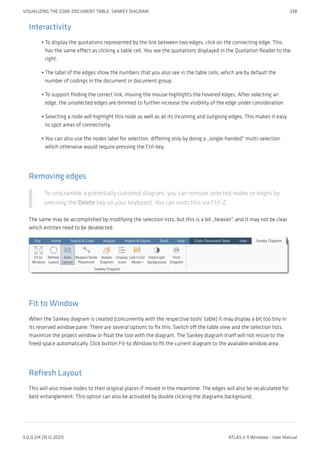
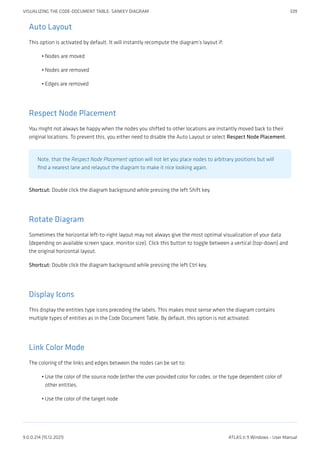
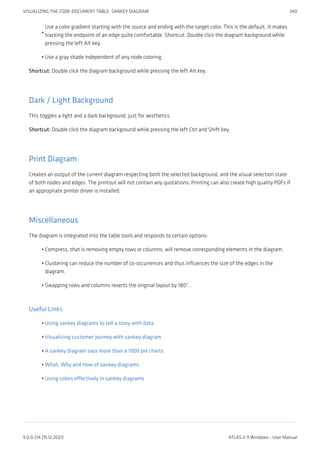
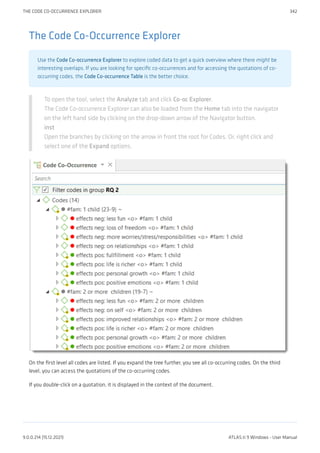
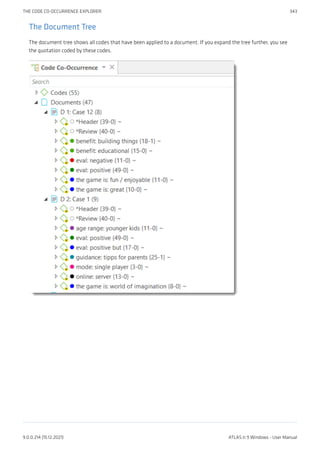
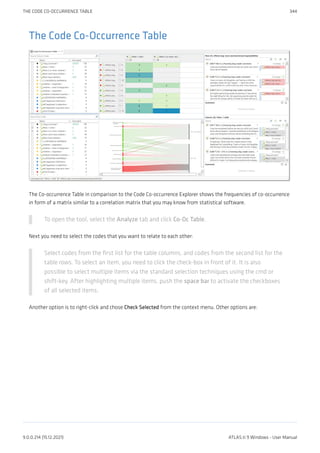
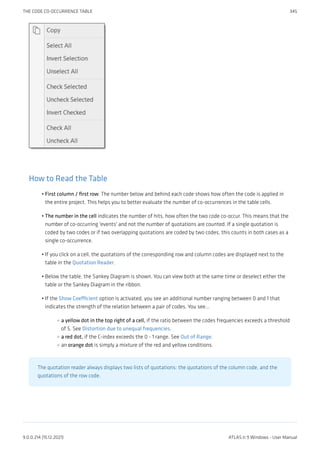
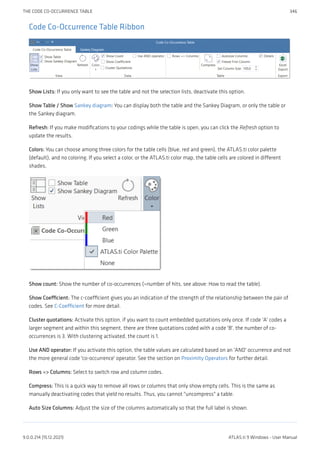
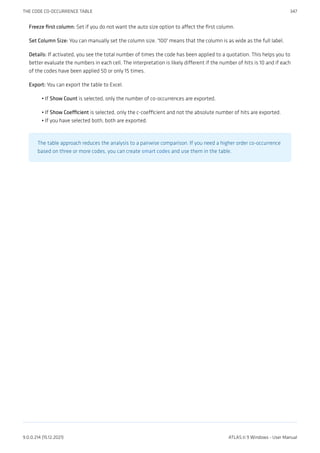
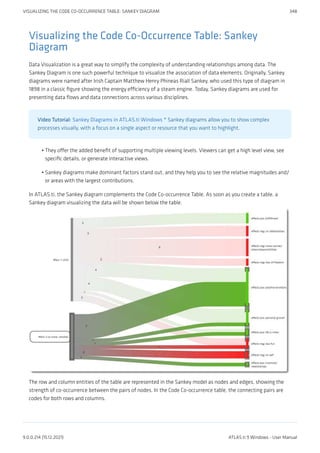
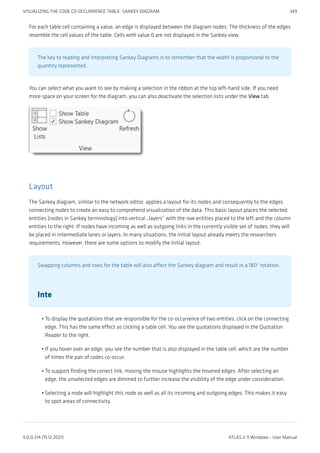
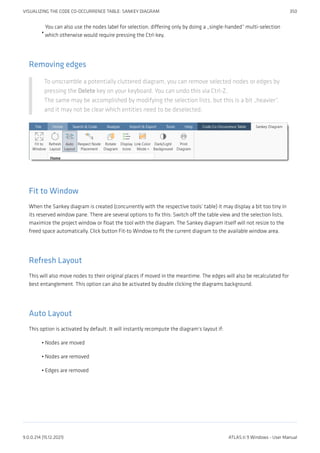
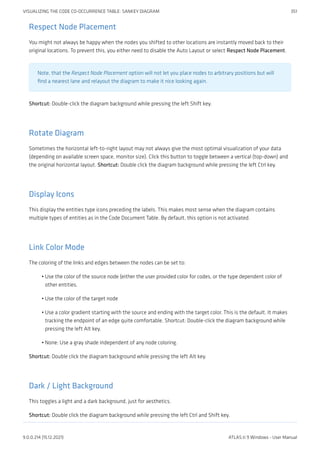
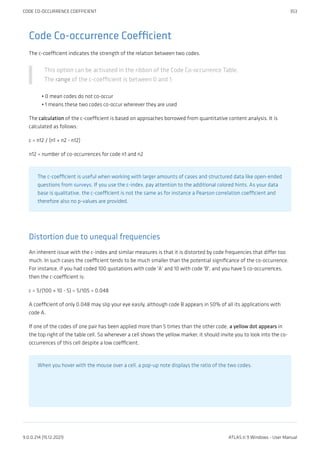
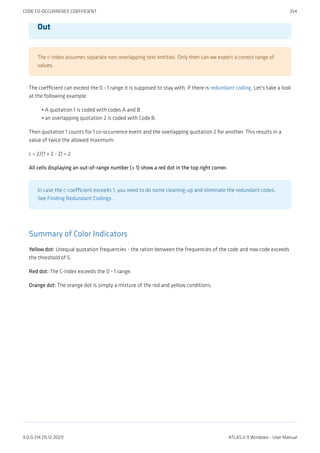
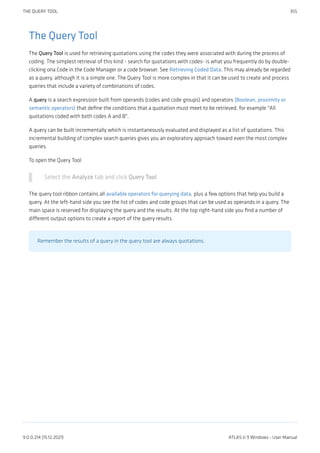
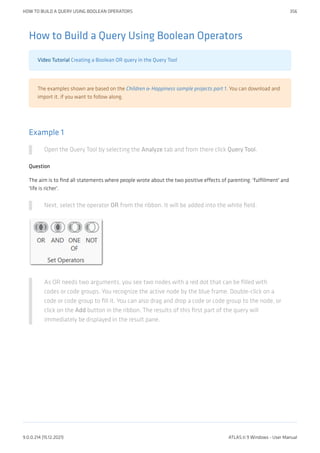
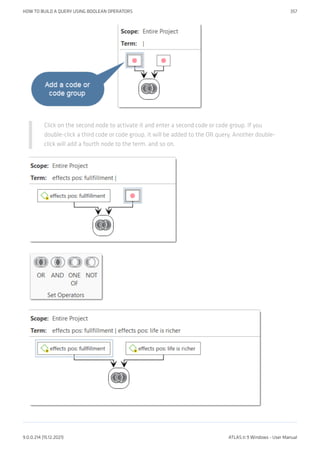
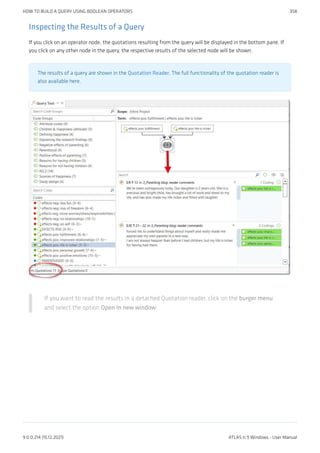
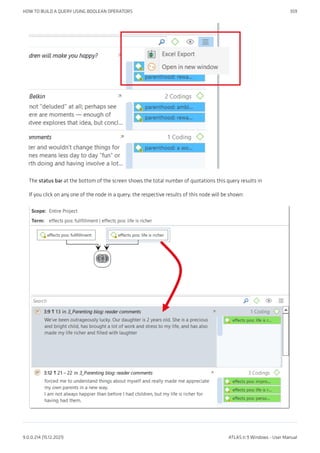
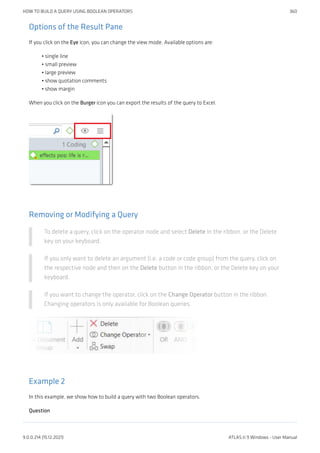
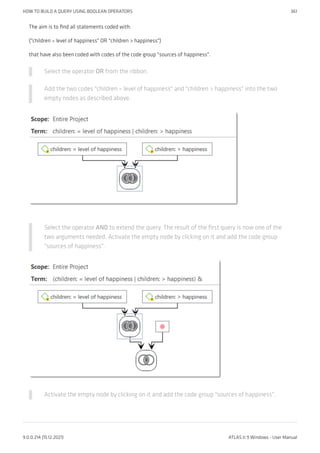
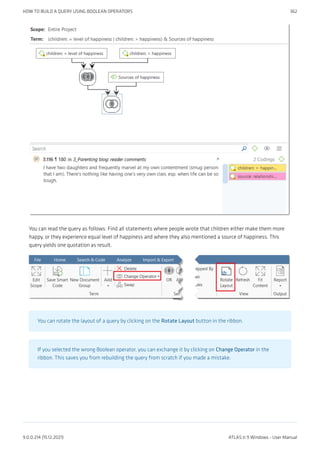
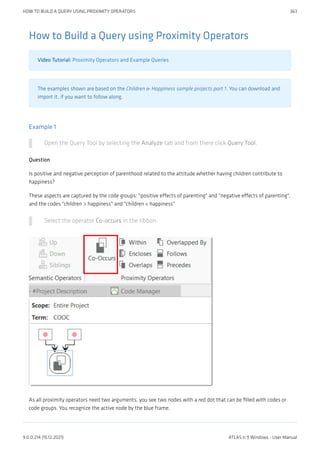
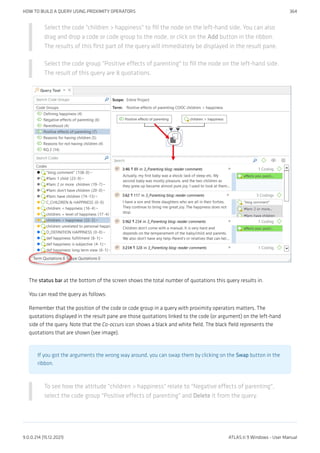
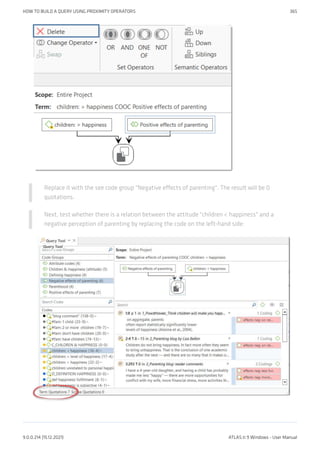
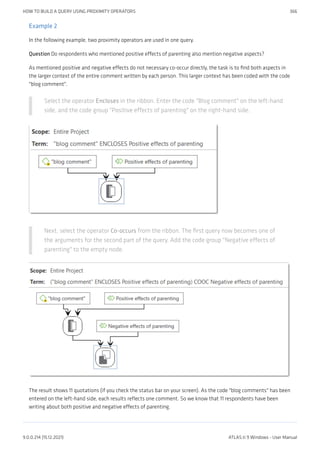
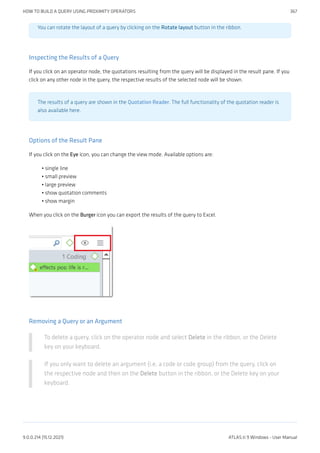
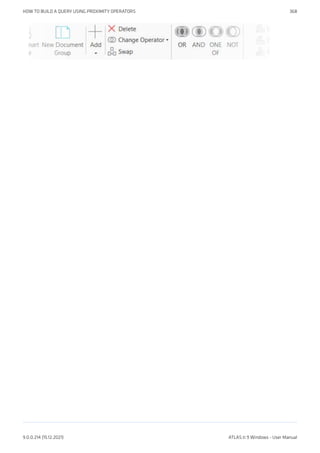
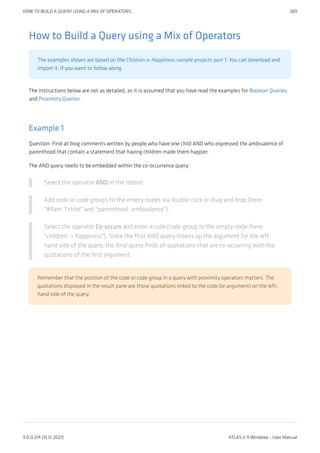
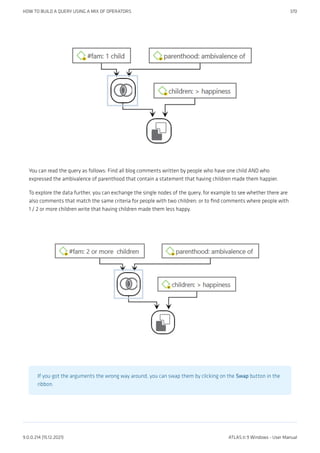
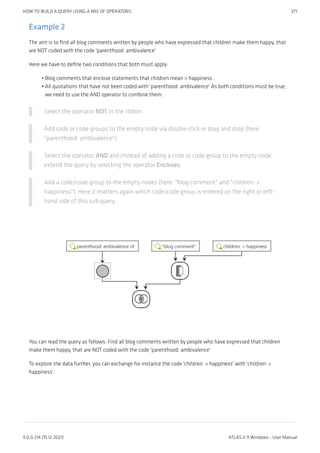
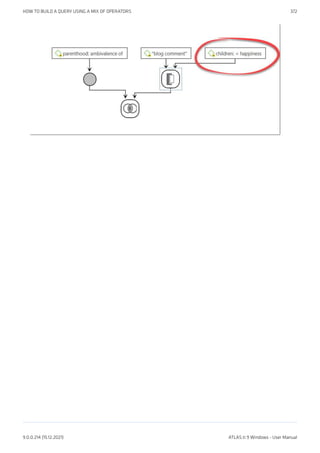
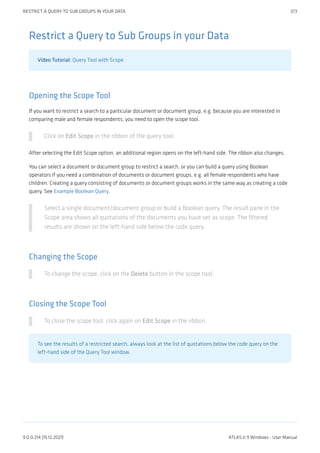
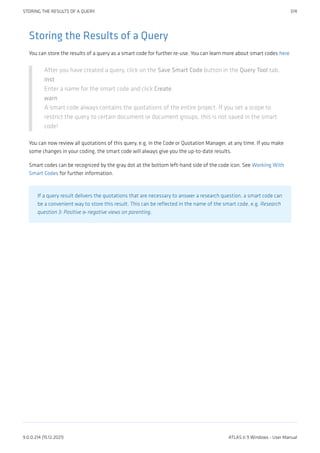
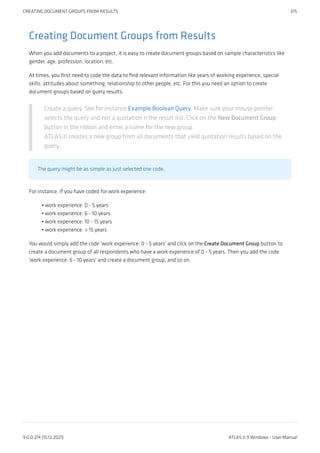
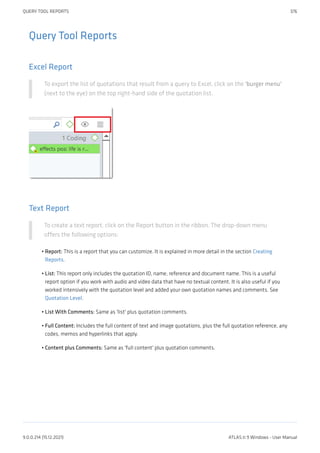
![Working With Smart Groups
A reason for creating a smart group is to apply them as global filter. See Applying Global Filters For Data
Analysis. Another application is to add them to a network and display document group - code
connections.
Creating a Smart Group
To create a new smart group, open a Manager and select two or more groups. Click on New
Smart Group in the ribbon, or right-click select this option from the context menu.
inst
Accept the suggested name or enter a new one, and click Create.
tip
Smart entities can be recognized by the little gray circle at the bottom left of the icon.
Editing a Smart Group
Smart groups can only be edited in their respective group managers.
Go to the Home ribbon, click on the drop-down of the appropriate entity and select [ ]
Groups.
inst
Select the smart group you want to edit and click Edit Smart Group in the ribbon.
This opens the Smart Group Editor that looks similar to the query tool.
The following operators are available:
OR: combines all selected groups and forms a larger group AND: creates a smart group consisting of the
intersection of the selected groups like 'female respondents from urban areas'. ONE OF (Exactly one of the
following is true): creates a smart group only containing members that are unique to each group and do not occur
in any of the other selected groups. Example: In the sample project Evaluation of a computer game, respondents
evaluate the game in different ways. If you want to find those respondents who either evaluate the game as being
creative or educational (and not both), you can use the one of operator.
IMAGE
NOT (None of the following are true): creates a smart group excluding the members of the selected group.
Example: The sample project children and happiness contains two document groups that have been created based
on the issues coded in the data. These are: documents that contain codings on positive and negative effects of
parenting. There are some documents that only contain codings on positive effects, others that only contain
codings on negative effects, and yet some that contain both. If you want to find only those documents that
contain codings on positive effects, you can create the following smart document group:
WORKING WITH SMART GROUPS 382
9.0.0.214 (15.12.2021) ATLAS.ti 9 Windows - User Manual](https://image.slidesharecdn.com/atlas-220501063737/85/ATLAS-ti_ManualWin-v9-pdf-396-320.jpg)
![Creating Snapshots
You can create snapshots from smart codes and smart groups.
Creating a Snapshot Code
Open the Code Manager and select a smart code. Click on the button Create Snapshot in
the ribbon.
The default name for the snapshot code is the name of the smart code plus the suffix [SN
1]; [SN 2] if you create second snapshot code of the same smart code and so on.
Creating a Snapshot Group
Open the Group Manager either by selecting the option in the ribbon of the respective
manager, or from the drop-down of the entity type button in the Home ribbon.
Select the smart group and then Create Snapshot from the ribbon.
CREATING SNAPSHOTS 385
9.0.0.214 (15.12.2021) ATLAS.ti 9 Windows - User Manual](https://image.slidesharecdn.com/atlas-220501063737/85/ATLAS-ti_ManualWin-v9-pdf-399-320.jpg)
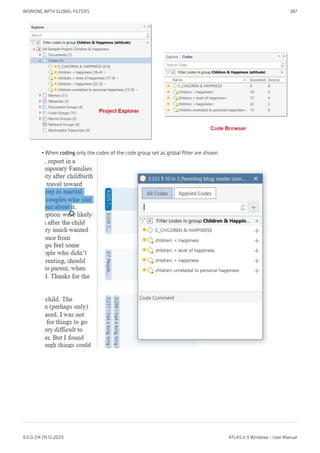
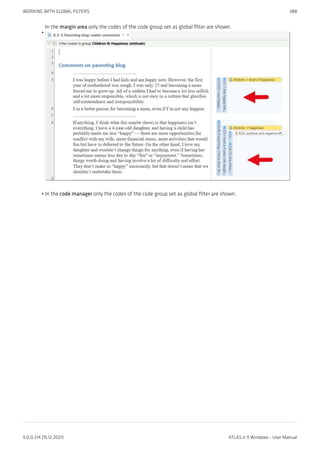
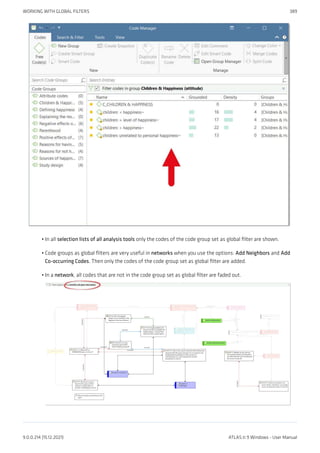
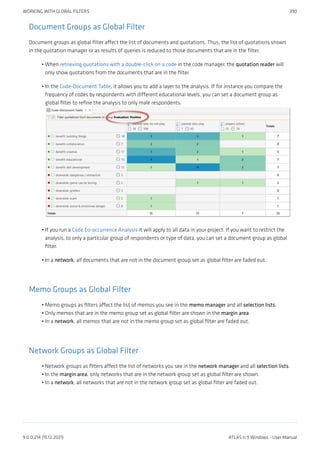
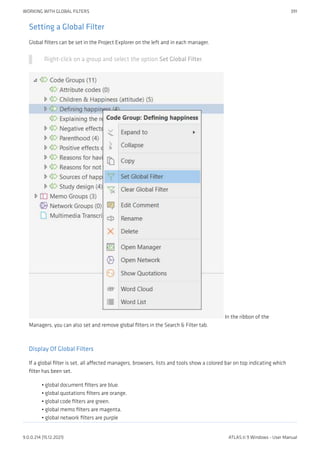
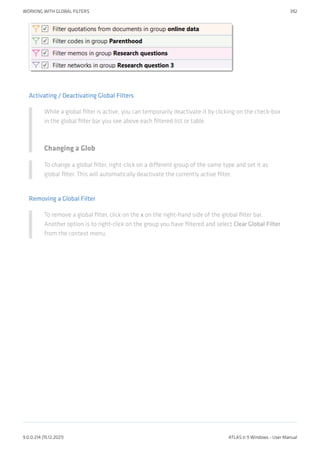
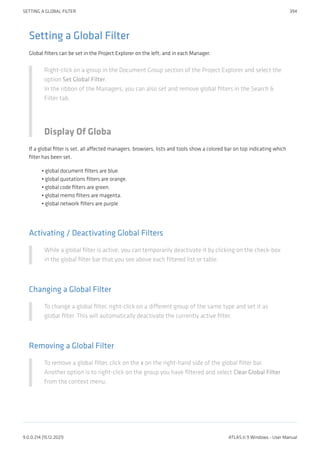
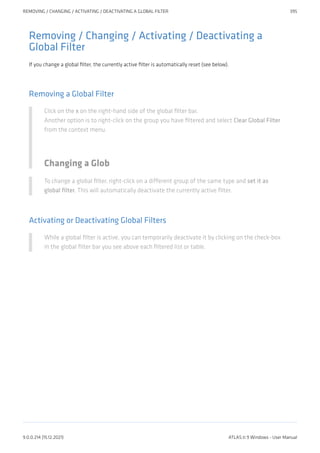

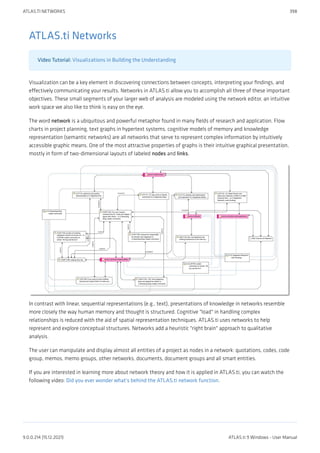
![Relations
ATLAS.ti allows you to establish named links to more clearly express the nature of the relationships between
concepts. With named links, you may express a sentence like "a broken leg causes pain" by two nodes (the source
node "broken leg" and the target node "pain") connected with a named link ("causes" or "is-cause-of").
The name of a link is displayed in the network editor as a label attached to the link midway between the two
connected nodes.
Six pre-set relations are available in ATLAS.ti. These standard relations can be substituted, modified, or
supplemented by user-defined relations.
Link vs. Relation
It is important to understand the difference between a relation (or a link type) and the link itself: There is only one
"is part of" relation, but potentially many links that can use it. Another way to think of links and relations is to
view links as instances of relations. Links are informed about the characteristics of relations, which define their
styles. If a characteristic of a relation is changed (e.g., line width, color, symbol), these changes are propagated to
all links using it.
ATLAS.ti Default Relations
The default relations that come with the software are listed in the table below. C1 and C2 are source and target
nodes, respectively.
Relation Name short name symbolic name width color Property
is-associated-with R == 1 Black Symmetric
is-part-of G [] 1 Black Transitive
is-cause-of N => 1 Black Transitive
contradicts A <> 1 Black Symmetric
is-a Isa 0 2 Black Transitive
noname 1 Black Symmetric
is-property-of P *} 1 Black Asymmetric
Some of these characteristics directly affect the display of links, while others affect processing (e.g., search
routines, automatic layout). A link between concepts is displayed in a network editor by a line with the relation's
label. You can choose from three different labels (name, short and symbolic). The relation property affects both
the display and processing capabilities of a relation. All transitive and asymmetric relations are symbolized in the
network editor with an arrow pointing toward the target code. Symmetric relations are displayed as a line with
two arrows pointing to both ends of the link.
The following properties are user-definable: the labels, the width and color of the line linking two nodes, the
property, and the preferred layout direction.
The preferred layout direction affects the layout of a network when opening an ad hoc network.
RELATIONS 401
9.0.0.214 (15.12.2021) ATLAS.ti 9 Windows - User Manual](https://image.slidesharecdn.com/atlas-220501063737/85/ATLAS-ti_ManualWin-v9-pdf-415-320.jpg)
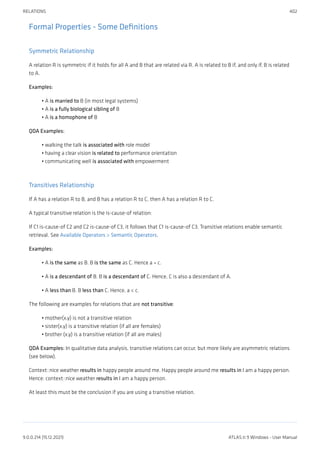
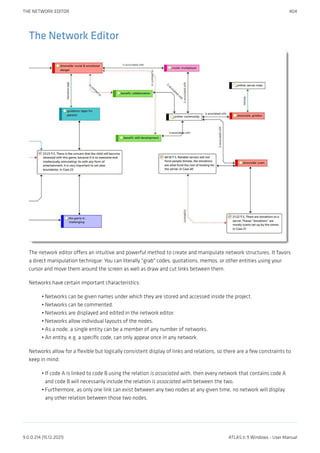
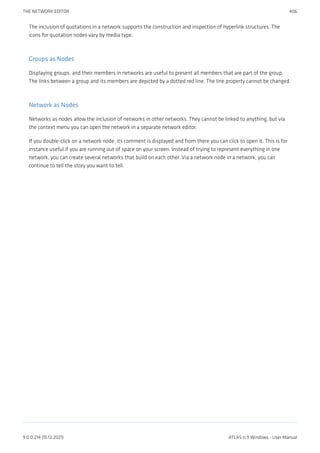
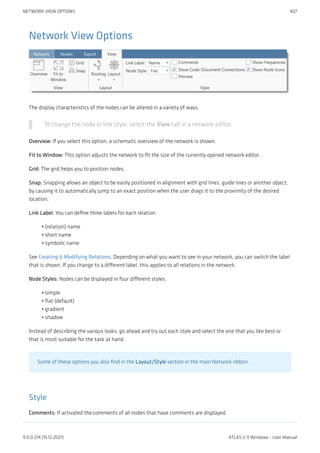
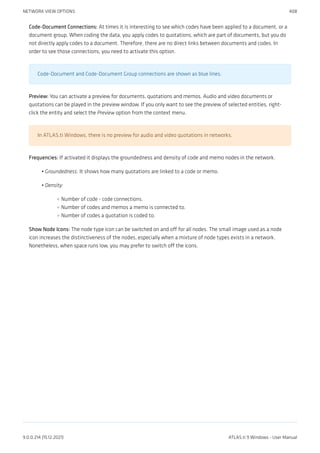
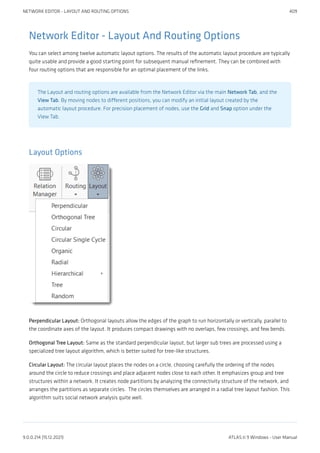
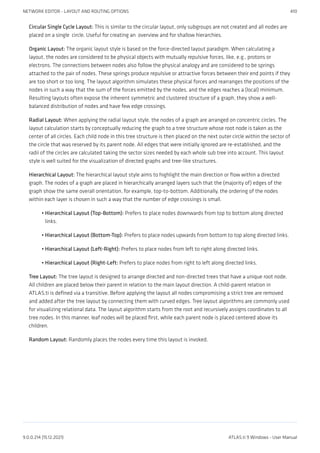
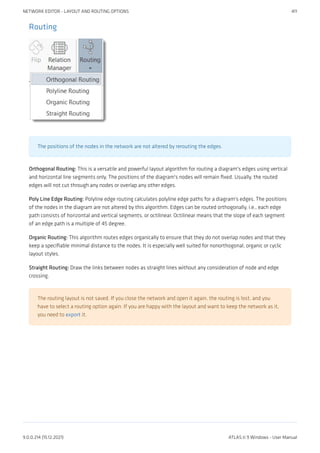
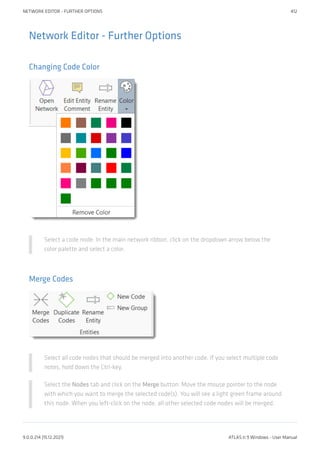
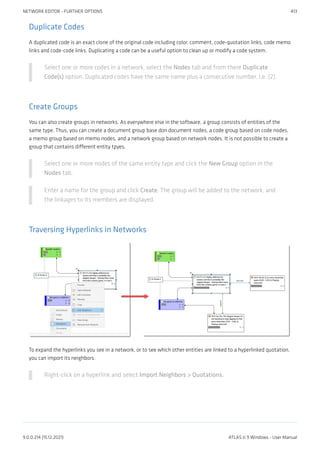
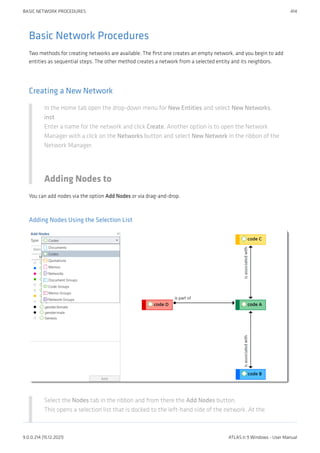
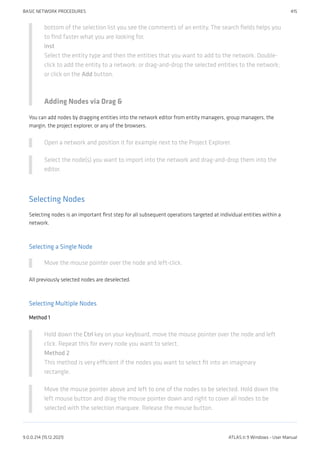
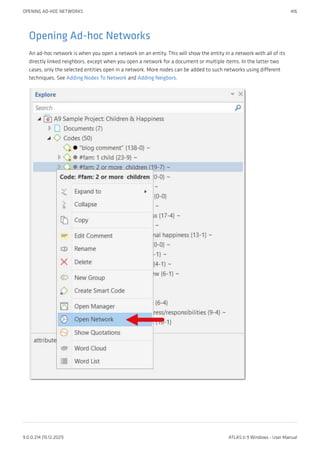
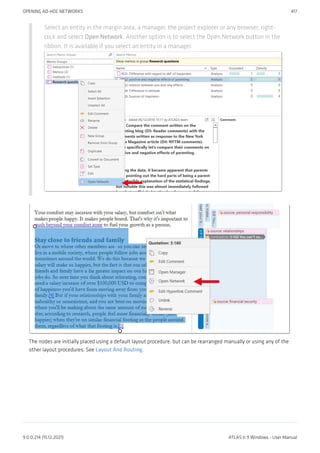
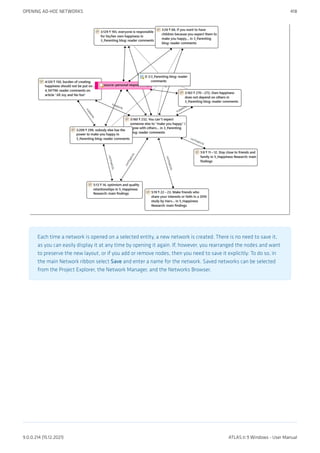
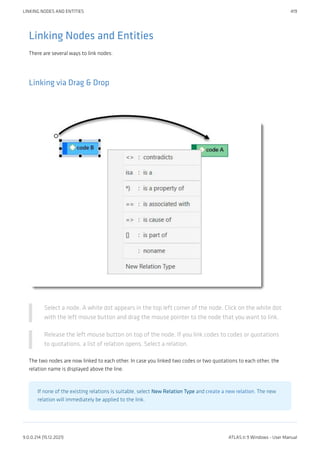
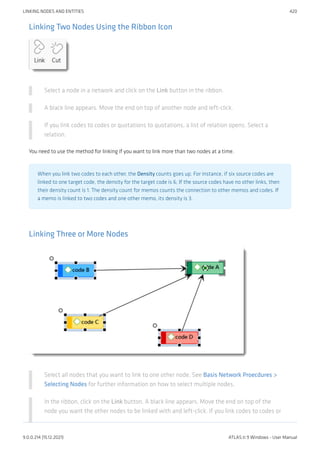
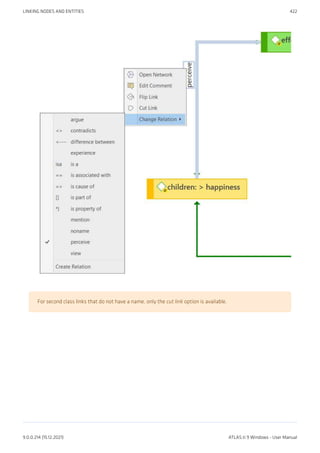
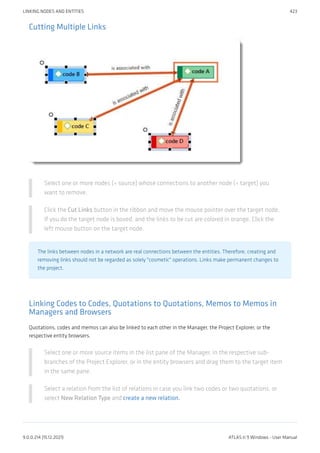
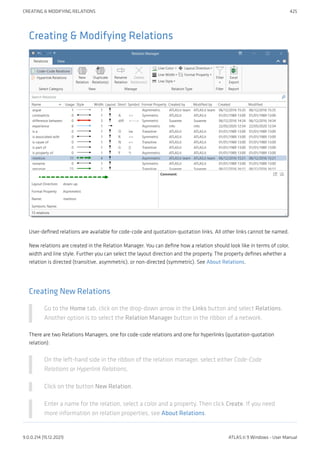
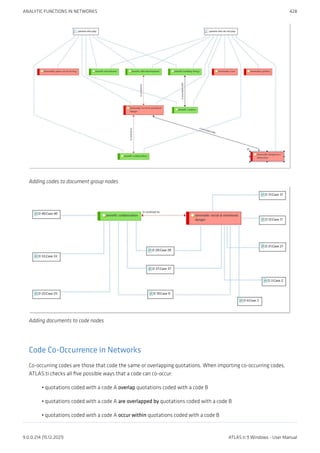
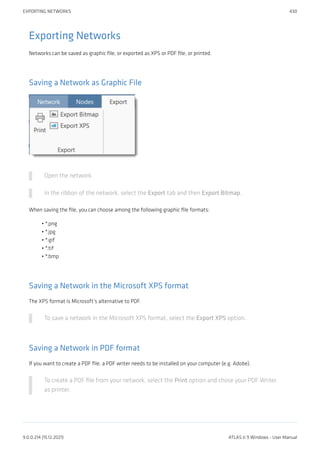
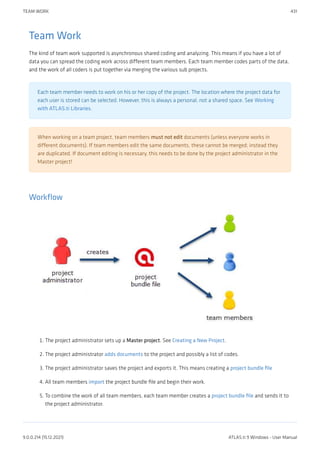
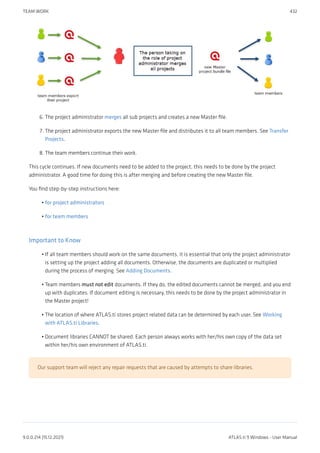
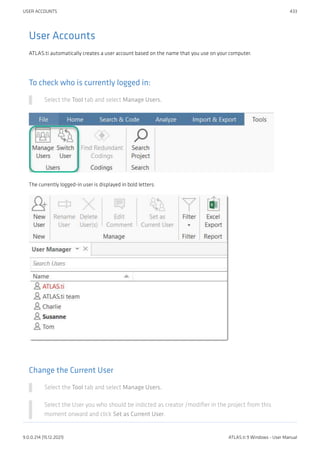
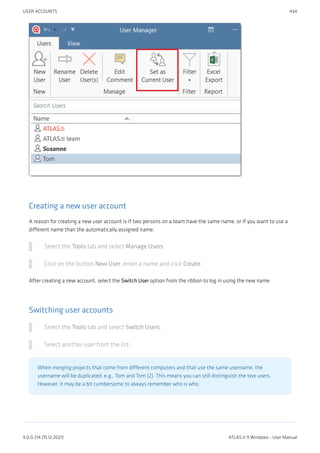
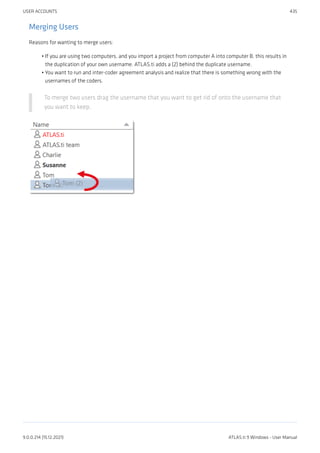
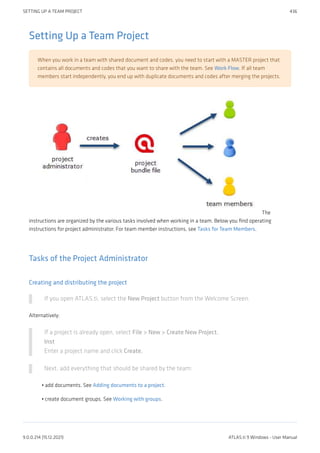
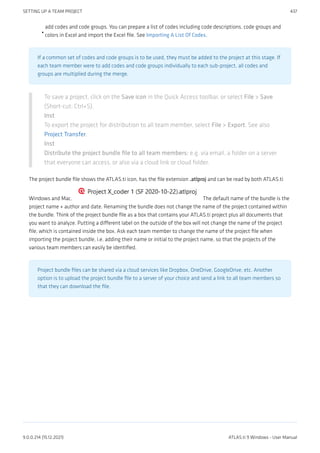
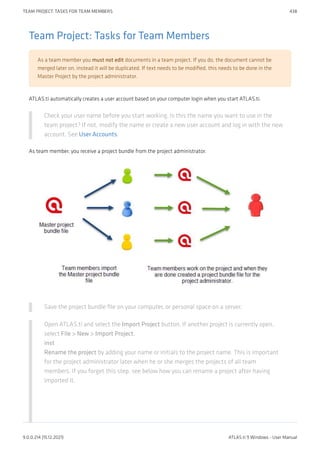
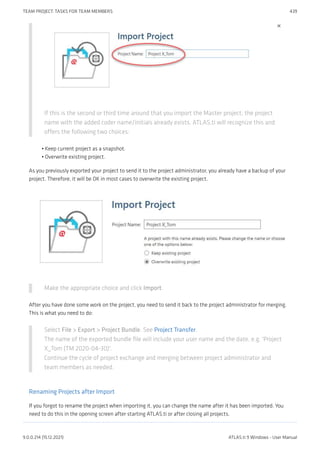

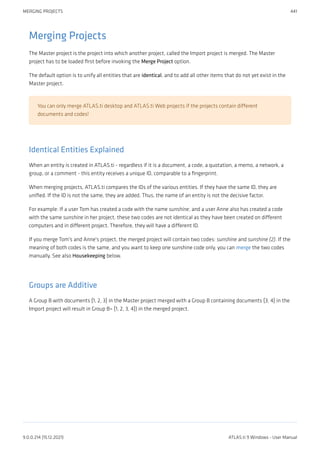
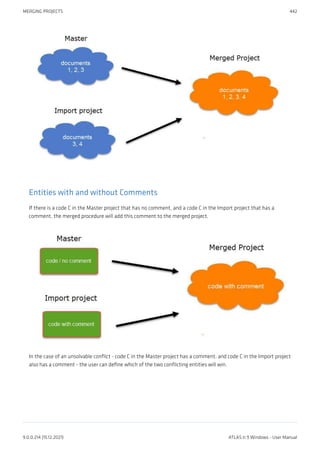
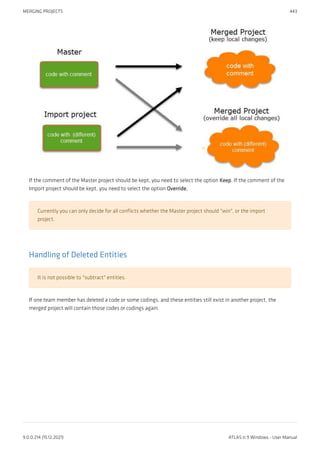
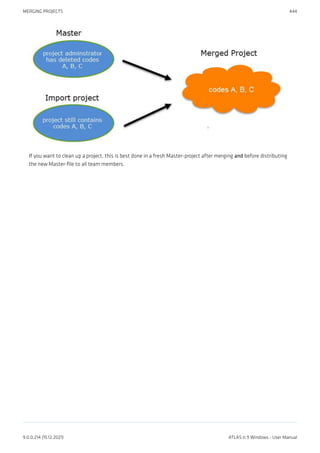
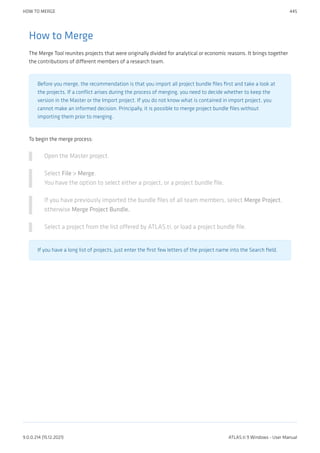
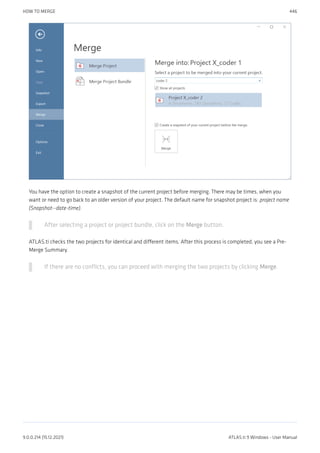
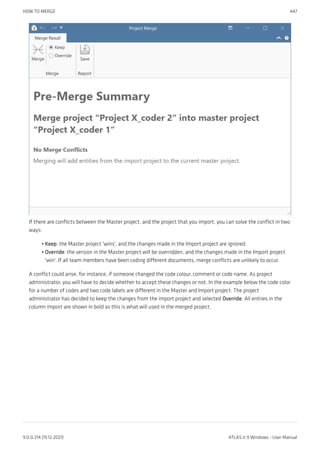
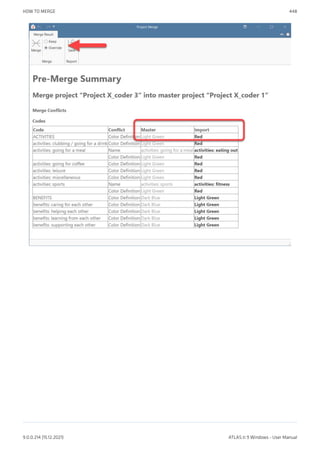
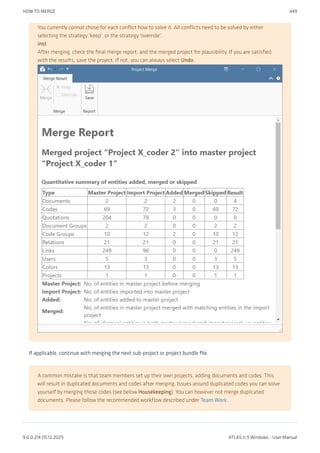
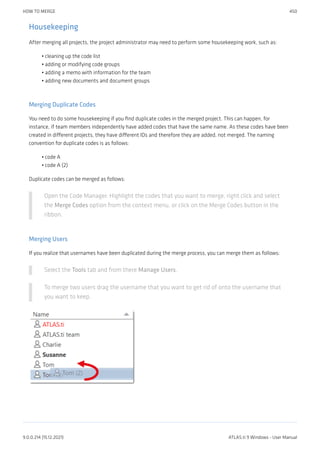
![Inter-coder Agreement (ICA)
You can test inter-coder agreement in text, audio and video documents. Image documents are not
supported. This also applies to image quotations in text PDF documents.
As you need to start from a common Master project when setting up a project for ICA analysis, you cannot
check for inter-coder agreement if one of the coders is using the Web version. All coders need to use the
desktop version (Mac or Windows). For a more detailed explanation, see Merging Projects.
Why It Matters
The purpose of collecting and analyzing data is that researchers find answers to the research questions that
motivated the study in the first place. Thus, the data are the trusted ground for any reasoning and discussion of
the results. Therefore, the researchers should be confident that their data has been generated taking precaution
against distortions and biases, intentional or accidental, and that the mean the same thing to anyone who uses
them. Reliability grounds this confidence empirically (Krippendorff, 2004).
Richards (2009) wrote: "But being reliable (to use the adjective) beats being unreliable. If a category is used in
different ways, you will be unable to rely on it to bring you all the relevant data. Hence, you may wish to ensure that
you yourself are reliably interpreting a code the same way across time, or that you can rely on your colleagues to use
it in the same way" (p. 108).
There are two ways to rationalize reliability, one routed in measurement theory, which is less relevant for the type
of data that ATLAS.ti users have. The second one is an interpretivist conception of reliability. When collecting any
type of interview data or observations, the phenomena of interest usually disappears right after it has been
recorded or observed. Therefore, the analyst's ability to examine the phenomena relies heavily on a consensual
reading and use of the data that represent the phenomena of interest. Researchers need to presume that their
data can be trusted to mean the same to all of their users.
This means "that the reading of textual data as well as of the research results is replicable elsewhere, that
researchers demonstrably agree on what they are talking about. Here, then, reliability is the degree in which
members of a designated community agree on the readings, interpretations, responses to, or uses of given texts or
data. [...] Researchers need to demonstrate the trustworthiness of their data by measuring their reliability"
(Krippendorff, 2004, p. 212).
Testing the reliability of the data is a first step. Only after establishing that the reliability is sufficiently high, it
makes sense to proceed with the analysis of the data. If there is considerable doubt what the data mean, it will be
difficult to justify the further analysis and the results of this analysis.
ATLAS.ti's inter-coder agreement tool lets you assess the agreement of how multiple coders code a given body of
data. In developing the tool we worked closely together with Prof. Klaus Krippendorff, one of the leading experts
in this field, author of the book Content Analysis: An Introduction of Its Methodology, and the originator of the
Krippendorff's alpha coefficient for measuring inter-coder agreement.
INTER-CODER AGREEMENT (ICA) 451
9.0.0.214 (15.12.2021) ATLAS.ti 9 Windows - User Manual](https://image.slidesharecdn.com/atlas-220501063737/85/ATLAS-ti_ManualWin-v9-pdf-465-320.jpg)
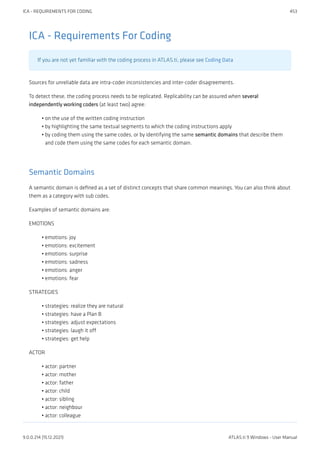
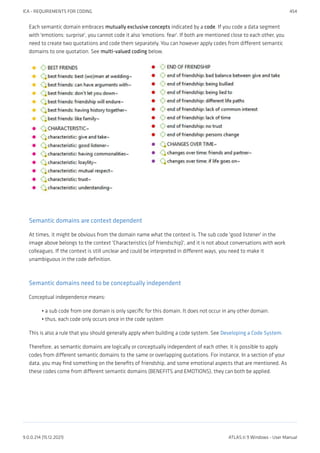

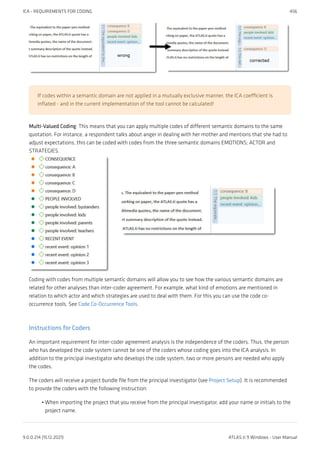
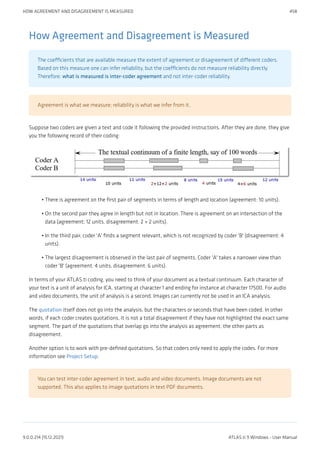
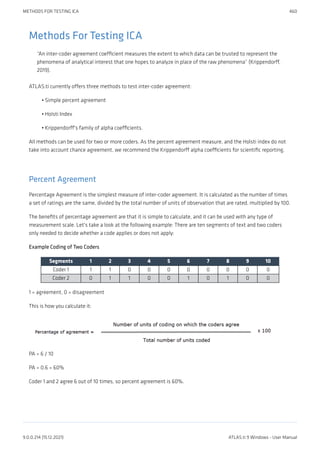
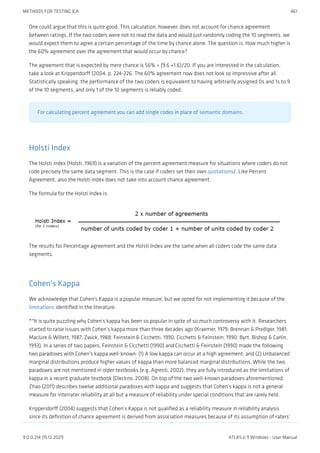
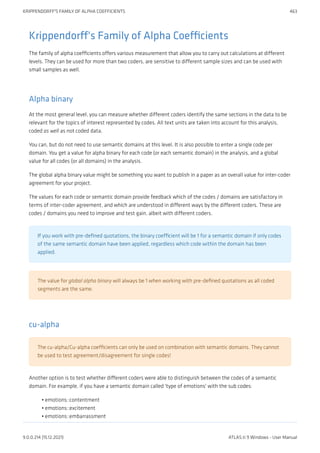
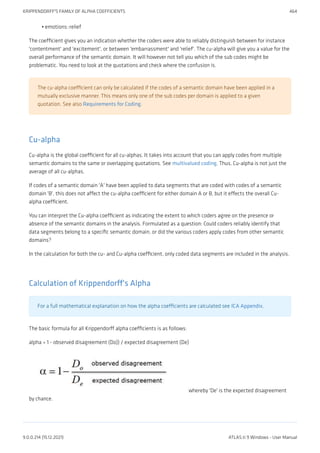
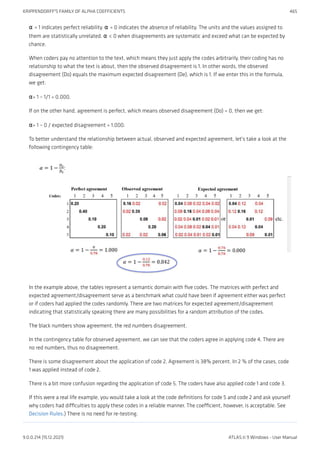
![References
Banerjee, M., Capozzoli, M., McSweeney, L., Sinha, D. (1999). Beyond kappa: A review of interrater agreement
measures. The Canadian Journal of Statistics, Vol. 27 (1), 3-23.]
Cohen, Jacob (1960). A coefficient of agreement for nominal scales. Educational and Psychological Measurement.
20 (1): 37–46. doi:10.1177/001316446002000104.
Holsti, O. R. (1969). Content analysis for the social sciences and humanities, Reading, MA: Addison-Wesley.
Krippendorff, Klaus (2004/2012/2018). Content Analysis: An Introduction to Its Methodology. 2ed /3rd /4th
edition. Thousand Oaks, CA: Sage.
Zwick, Rebecca (1988). Another look at interrater agreement. Psychological Bulletin, 103, 347-387.
Xie, Q. (2013). Agree or disagree? A demonstration of an alternative statistic to cohens kappa for measuring the
extent and reliability of agreement between observer. In Proceedings of the Federal Committee on Statistical
Methodology Research Conference, The Council of Professional Associations on Federal Statistics, Washington,
DC, USA, 2013.
KRIPPENDORFF'S FAMILY OF ALPHA COEFFICIENTS 466
9.0.0.214 (15.12.2021) ATLAS.ti 9 Windows - User Manual](https://image.slidesharecdn.com/atlas-220501063737/85/ATLAS-ti_ManualWin-v9-pdf-480-320.jpg)