

Recommended
More Related Content
What's hot
What's hot (9)
Similar to Area
Similar to Area (20)
More from Husnain Haider
More from Husnain Haider (20)
Recently uploaded
Recently uploaded (20)
Area
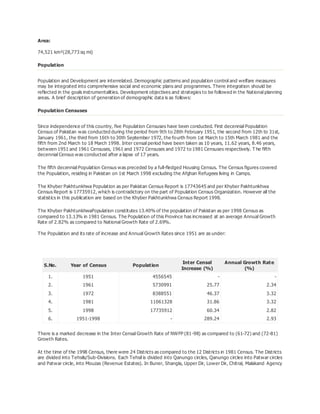
- 1. Area: 74,521 km²(28,773 sq mi) Population Population and Development are interrelated. Demographic patterns and population control and welfare measures may be integrated into comprehensive social and economic plans and programmes. There integration should be reflected in the goals instrumentalities. Development objectives and strategies to be followed in the National planning areas. A brief description of generation of demographic data is as follows: Population Censuses Since independence of this country, five Population Censuses have been conducted. First decennial Population Census of Pakistan was conducted during the period from 9th to 28th February 1951, the second from 12th to 31st, January 1961, the third from 16th to 30th September 1972, the fourth from 1st March to 15th March 1981 and the fifth from 2nd March to 18 March 1998. Inter censal period have been taken as 10 years, 11.62 years, 8.46 years, between 1951 and 1961 Censuses, 1961 and 1972 Censuses and 1972 to 1981 Censuses respectively. T he fifth decennial Census was conducted after a lapse of 17 years. The fifth decennial Population Census was preceded by a full-fledged Housing Census. The Census figures covered the Population, residing in Pakistan on 1st March 1998 excluding the Afghan Refugees living in Camps. The Khyber Pakhtunkhwa Population as per Pakistan Census Report is 17743645 and per Khyber Pakhtunkhwa Census Report is 17735912, which is contradictory on the part of Population Census Organization. However all the statistics in this publication are based on the Khyber Pakhtunkhwa Census Report 1998. The Khyber PakhtunkhwaPopulation constitutes 13.40% of the population of Pakistan as per 1998 Census as compared to 13.13% in 1981 Census. The Population of this Province has increased at an average Annual Growth Rate of 2.82% as compared to National Growth Rate of 2.69%. The Population and its rate of increase and Annual Growth Rates since 1951 are as under: S.No. Year of Census Population Inter Censal Increase (%) Annual Growth Rate (%) 1. 1951 4556545 - - 2. 1961 5730991 25.77 2.34 3. 1972 8388551 46.37 3.32 4. 1981 11061328 31.86 3.32 5. 1998 17735912 60.34 2.82 6. 1951-1998 - 289.24 2.93 There is a marked decrease in the Inter Censal Growth Rate of NWFP (81-98) as compared to (61-72) and (72-81) Growth Rates. At the time of the 1998 Census, there were 24 Districts as compared to the 12 Districts in 1981 Census. The Districts are divided into Tehsils/Sub-Divisions. Each Tehsil is divided into Qanungo circles, Qanungo circles into Patwar circles and Patwar circle, into Mouzas (Revenue Estates). In Buner, Shangla, Upper Dir, Lower Dir, Chitral, Malakand Agency
- 2. and Kohistan District, each Tehsil/Sub-Division is, however, divided into Union councils and Union councils into villages. The sex ratio (Males per hundred Females) in 1981 was 109, which is now 105 in 1998 Census and has registered decline. The population density has increased to 238 persons per Sq.Km in 1998 Census from 148 persons per Sq.Km in 1981. DISTRICT WISE AREA, POPULATION, DENSITY AND GROWTH RATE OF Khyber Pakhtunkhwa, 1981 & 1998 CENSUSES District Area in Sq.Kms Population %age change in 1998 over 1981 Population density per Sq.Km Growth rate 1981- 1998 (Percent) 1981 (Census) 1998 (Census) 1981 1998 NWFP 74521 11061328 17735912 60.34 148 238 2.82 Abbottabad 1967 647635 880666 35.98 329 448 1.82 Bannu 1227 422027 675667 60.10 344 551 2.81 Battagram 1301 339119 307278 -9.39 261 236 -0.58 Buner 1865 265517 506048 90.59 142 271 3.86 Charsadda 996 630811 1022364 62.07 633 1026 2.88 Chitral 14850 208560 318689 52.80 14 21 2.52 D.I.Khan 7326 494432 852995 72.52 67 116 3.26 Hangu 1097 182474 314529 72.37 166 287 3.25 Haripur 1725 479031 692228 44.51 278 401 2.19 Karak 3372 249681 430796 72.54 74 128 3.26 Kohat 2545 326617 562644 72.26 128 221 3.25 Kohistan 7492 465237 472570 1.58 62 63 0.09
- 3. Lakki 3164 288759 490025 69.70 91 155 3.16 Lower Dir 1583 404844 717649 77.27 256 453 3.42 Malakand 952 257797 452291 75.44 271 475 3.36 Mansehra 4579 770235 1152839 49.67 168 252 2.40 Mardan 1632 881465 1460100 65.64 540 895 3.01 Nowshera 1748 537638 874373 62.63 308 500 2.90 Peshawar 1257 1113303 2019118 81.36 886 1606 3.56 Shangla 1586 251546 434563 72.76 159 274 3.27 Swabi 1543 625035 1026804 64.28 405 665 2.96 Swat 5337 715938 1257602 75.66 134 236 3.37 Tank 1679 141062 238216 68.87 84 142 3.13 Upper Dir 3699 362565 575858 58.83 98 156 2.76 DISTRICT WISE POPULATION & SEX RATIO IN Khyber Pakhtunkhwa, 1981 & 1998 CENSUSES Area Population % change in Population 1998 over 1981 Sex ratio (Males per 100 females) 1981 1998 1981 1998 Pakistan 84253644 132352279 57.09 111 108 NWFP 11061328 17735912 60.34 109 105 Abbottabad 647635 880666 35.98 107 100 Bannu 422027 675667 60.10 110 107 Battagram 339119 307278 -9.39 135 107 Buner 265517 506048 90.59 105 100 Charsadda 630811 1022364 62.07 108 108 Chitral 208560 318689 52.80 107 103 D.I.Khan 494432 852995 72.52 113 111 Hangu 182474 314529 72.37 98 96 Haripur 479031 692228 44.51 102 100 Karak 249681 430796 72.54 101 96 Kohat 326617 562644 72.26 106 101 Kohistan 465237 472570 1.58 133 124 Lakki 288759 490025 69.70 108 104 Lower Dir 404844 717649 77.27 103 98 Malakand 257797 452291 75.44 105 107 Mansehra 770235 1152839 49.67 103 98 Mardan 881465 1460100 65.64 108 107 Nowshera 537638 874373 62.63 111 109 Peshawar 1113303 2019118 81.36 112 111
- 4. Shangla 251546 434563 72.76 109 106 Swabi 625035 1026804 64.28 103 101 Swat 715938 1257602 75.66 110 106 Tank 141062 238216 68.87 112 109 Upper Dir 362565 575858 58.83 103 103 DISTRICT WISE POPULATION & SEX RATIO IN Khyber Pakhtunkhwa, 1981 & 1998 CENSUSES Area Population % change in Population 1998 over 1981 Sex ratio (Males per 100 females) 1981 1998 1981 1998 Pakistan 84253644 132352279 57.09 111 108 NWFP 11061328 17735912 60.34 109 105 Abbottabad 647635 880666 35.98 107 100 Bannu 422027 675667 60.10 110 107 Battagram 339119 307278 -9.39 135 107 Buner 265517 506048 90.59 105 100 Charsadda 630811 1022364 62.07 108 108 Chitral 208560 318689 52.80 107 103 D.I.Khan 494432 852995 72.52 113 111 Hangu 182474 314529 72.37 98 96 Haripur 479031 692228 44.51 102 100 Karak 249681 430796 72.54 101 96 Kohat 326617 562644 72.26 106 101 Kohistan 465237 472570 1.58 133 124 Lakki 288759 490025 69.70 108 104 Lower Dir 404844 717649 77.27 103 98 Malakand 257797 452291 75.44 105 107 Mansehra 770235 1152839 49.67 103 98 Mardan 881465 1460100 65.64 108 107 Nowshera 537638 874373 62.63 111 109 Peshawar 1113303 2019118 81.36 112 111 Shangla 251546 434563 72.76 109 106 Swabi 625035 1026804 64.28 103 101 Swat 715938 1257602 75.66 110 106 Tank 141062 238216 68.87 112 109 Upper Dir 362565 575858 58.83 103 103
- 5. DISTRICT WISE POPULATION & SEX RATIO IN Khyber Pakhtunkhwa, 1981 & 1998 CENSUSES Area Population % change in Population 1998 over 1981 Sex ratio (Males per 100 females) 1981 1998 1981 1998 Pakistan 84253644 132352279 57.09 111 108 NWFP 11061328 17735912 60.34 109 105 Abbottabad 647635 880666 35.98 107 100 Bannu 422027 675667 60.10 110 107 Battagram 339119 307278 -9.39 135 107 Buner 265517 506048 90.59 105 100 Charsadda 630811 1022364 62.07 108 108 Chitral 208560 318689 52.80 107 103 D.I.Khan 494432 852995 72.52 113 111 Hangu 182474 314529 72.37 98 96 Haripur 479031 692228 44.51 102 100 Karak 249681 430796 72.54 101 96 Kohat 326617 562644 72.26 106 101 Kohistan 465237 472570 1.58 133 124 Lakki 288759 490025 69.70 108 104 Lower Dir 404844 717649 77.27 103 98 Malakand 257797 452291 75.44 105 107 Mansehra 770235 1152839 49.67 103 98 Mardan 881465 1460100 65.64 108 107 Nowshera 537638 874373 62.63 111 109 Peshawar 1113303 2019118 81.36 112 111 Shangla 251546 434563 72.76 109 106 Swabi 625035 1026804 64.28 103 101 Swat 715938 1257602 75.66 110 106 Tank 141062 238216 68.87 112 109 Upper Dir 362565 575858 58.83 103 103 DISTRICT WISE POPULATION OF URBAN AND RURAL AREAS IN Khyber Pakhtunkhwa., 1972, 1981 & 1998 CENSUSES District 1972 (Census) 1981 (Census) 1998 (Census) Total Urban Rural Total Urban Rural Total Urban Rural NWFP 838855 1 119565 5 719289 6 1106132 8 166565 3 939567 5 1773591 2 299408 4 14741828 Abbottabad 551144 68569 482575 679328 96966 582362 880666 157904 722762
- 6. Bannu 350629 43757 306872 434668 43210 391458 675667 47676 627991 Battagram 174009 - 174009 339119 - 339119 307278 - 307278 Buner 187984 - 187984 265517 - 265517 506048 - 506048 Charsadda 513193 105064 408129 630811 131834 498977 1022364 192851 829513 Chitral 159000 19437 139563 208560 - 208560 318689 30622 288067 D.I.Khan 380229 74934 305295 494432 91595 402837 852995 125807 727188 Hangu 125721 27882 97839 182474 34427 148047 314529 64217 250312 Haripur 426068 45323 380745 490104 55009 435095 692228 82735 609493 Karak 191204 - 191204 249681 13679 236002 430796 27893 402903 Kohat 264465 65202 199263 326617 87819 238798 562644 151913 410731 Kohistan 204521 - 204521 465237 - 465237 472570 - 472570 Lakki 216590 14359 202231 276118 18755 257363 490025 46878 443147 Lower Dir 277481 - 277481 404844 - 404844 717649 44335 673314 Malakand 185872 67012 118860 257797 - 257797 452291 43179 409112 Mansehra 713597 28380 685217 727469 37436 690033 1152839 61376 1091463 Mardan 696622 127263 569359 881465 166302 715163 1460100 295128 1164972 Nowshera 433287 102935 330352 566594 150991 415603 874373 227030 647343 Peshawar 784443 272697 511746 1084347 566248 518099 2019118 982816 1036302 Shangla 179813 - 179813 251546 - 251546 434563 - 434563 Swabi 507631 67418 440213 625035 58301 566734 1026804 179214 847590 Swat 520614 51117 469497 715938 88078 627860 1257602 173868 1083734 Tank 93389 14306 79083 141062 25003 116059 238216 35741 202475 Upper Dir 251045 - 251045 362565 - 362565 575858