The study aimed to characterize the effects of auditory processing disorder (APD) on the middle latency response (MLR) by comparing neural responses in children with and without APD. Electroencephalography was used to record MLRs elicited by clicks presented to the left, right, and both ears. Results showed that children with APD had more asymmetrical MLR responses between ears compared to controls. Specifically, those with APD had lower Na amplitude responses in the left ear versus the right ear or controls. This suggests APD impacts binaural integration as reflected in the MLR.
1. The Middle Latency Response in Children with Auditory Processing Disorder
Janice Yi and Deborah Moncrieff, Ph.D. Department of Communication
Science and Disorders
First Experiences in Research, Dietrich School of Arts & Sciences, University of Pittsburgh
Introduction Results
Conclusions
Methods
• With the waveforms of the grand averages, there
is a correlation of WNL being between AMB+ and
AMB.
• The evoked responses from the left and right
ears were indeed more asymmetrical in children
with APD.
• AMB could be recognized from analysis of Na
amplitude.
• Subjects are given initial hearing test along
with several dichotic listening tests.
• Each subject is later fitted to an EEG electrode
cap (figure 1, pictured to the right).
• C4, CZ, and C3 are the three focused electrode
sites.
• Clicks are presented to the right ear, the left
ear, then both ears. Each click is presented at a
rate of 9/sec at 60 dB nHL. Responses will be
recorded for 1000 sweeps at a time for each
ear twice.
Objective
• The goal of the study is to characterize the effects
of a binaural integration deficit on latency and
amplitude measures of the middle latency response
(MLR).
• It is hypothesized that evoked responses from the
left and right ears will be more asymmetrical in
children with binaural integration deficits than in
control children.
• Everyday our ears are put in competition when
different stimuli arrive simultaneously. Binaural
integration is the auditory processing skill that
enables correct processing and integration of
information for listening and learning.
• Children are the targeted subjects because early
detection of binaural integration deficit and
intervention with the proper treatment will lessen
communication and learning difficulties and
strengthen their performance in school.
• Electrophysiology is used to measure and compare
neural transmissions through auditory pathways in
children with and without binaural integration
deficits.
Fig.1
References
Keith, Robert W. (1999). Clinical Issues in Central
Auditory Processing Disorders. American Speech-
Language-Hearing Association (Vol. 30, pp. 339-343)
Fig 1,
https://gtecmedical.files.wordpress.com/2012/08/gte
c_eeg_bci_5438_medsize.jpg
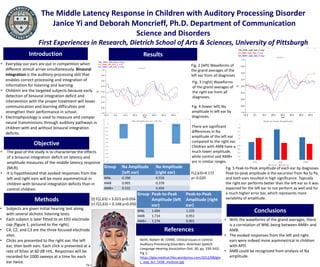
Fig. 2 (left) Waveforms of
the grand averages of the
left ear from all diagnoses.
Fig. 5 Peak-to-Peak amplitude of each ear by diagnoses
Peak-to-peak amplitude is the excursion from Na to Pa,
and both ears resulted in high significance. Typically
the right ear performs better than the left ear so it was
expected for the left ear to not perform as well and for
a much higher error bar, which represents more
variability of amplitude.
Group Na Amplitude
(left ear)
Na Amplitude
(right ear)
WNL 0.390 0.550
AMB 0.901 0.378
AMB+ 0.531 0.494
Group Peak-to-Peak
Amplitude (left
ear)
Peak-to-Peak
Amplitude (right
ear)
WNL 1.004 1.235
AMB 1.714 0.951
AMB+ 1.274 0.901
(l) F(2,63) = 3.023 p=0.056
(r) F(2,63) = 3.148 p=0.050
ms
-10.0 0.0 10.0 20.0 30.0 40.0 50.0 60.0
µV 0.0
0.3
0.5
0.8
1.0
-0.3
-0.5
-0.8
-1.0
*GA_WNL_left_fast_F.avg
GA_AMB_left_fast_F.avg
GA_AMB+_left_fast_F.avg
Electrode: C4
Subject:
EEG file: GA_WNL_left_fast_F.avg
Rate - 10000 Hz, HPF - 10 Hz, LPF - 2000 Hz, Notch - 60 Hz
Neuroscan
SCAN 4.5
Printed : 14:21:53 14-Apr-2015
ms
-10.0 0.0 10.0 20.0 30.0 40.0 50.0 60.0
µV 0.0
0.3
0.5
0.8
1.0
-0.3
-0.5
-0.8
-1.0
*GA_WNL_right_fast_F.avg
GA_AMB_right_fast_F.avg
GA_AMB+_right_fast_F.avg
Electrode: C3
Subject:
EEG file: GA_WNL_right_fast_F.avg
Rate - 10000 Hz, HPF - 10 Hz, LPF - 2000 Hz, Notch - 60 Hz
Neuroscan
SCAN 4.5
Printed : 14:22:54 14
Fig. 4 (lower left) Na
amplitude in left ear by
diagnoses.
There are significant
differences in Na
amplitude of the left ear
compared to the right ear.
Children with AMB have a
much lower amplitude,
while control and AMB+
are in similar ranges.
F(2,63)=4.172
p= 0.020
Fig. 3 (right) Waveforms
of the grand averages of
the right ear from all
diagnoses.