SlideShare a Scribd company logo
1 of 20
Medthod 1                                         11.50%
            period       Principle       Interest        Repayments    Total Payment
                     1     75,000,000.00    8,625,000.00                  8,625,000.00
                     2     75,000,000.00    8,625,000.00                  8,625,000.00
                     3     75,000,000.00    8,625,000.00                  8,625,000.00
                     4     75,000,000.00    8,625,000.00                  8,625,000.00
                     5     75,000,000.00    8,625,000.00                  8,625,000.00
                     6     75,000,000.00    8,625,000.00                  8,625,000.00
                     7     75,000,000.00    8,625,000.00 75,000,000.00   83,625,000.00
                                                                        135,375,000.00


Medthod 2                                         13.50%
            period       Principle       Interest         Repayments      Total Payments
                     1    100,000,000.00          Err:522    5,000,000.00          Err:522
                     2     95,000,000.00          Err:522    5,000,000.00          Err:522
                     3     90,000,000.00          Err:522    5,000,000.00          Err:522
                     4     85,000,000.00          Err:522    5,000,000.00          Err:522
                     5     80,000,000.00          Err:522    5,000,000.00          Err:522
                     6     75,000,000.00          Err:522    5,000,000.00          Err:522
                     7     70,000,000.00          Err:522                          Err:522
                                                          total                    Err:522
Remiander
 95,000,000.00
 90,000,000.00
 85,000,000.00
 80,000,000.00
 75,000,000.00
 70,000,000.00
Pinkerton
terminal g           5.00%
R                    8.17%                                                              0.7 cf g

IS                   1983    1984    1985    1986    1987    average %
net sales            296.4   307.7   312.4   367.7   408.3
                                                               8.5%      sales growth
cogs                 264.5   275.4   286.3   342.5   381.7
                                                              91.4%      % of sales

operating expenses   15.5    17.1    24.9    24.5     27
                                                               6.4%      % of sales
ebitda               16.4    15.2     1.2     0.7    -0.4
depreciation          -       -        -       -       -

other deductions       -       -       -       -       -
ebit                 16.4    15.2     1.2     0.7    -0.4
taxes                 4.9     4.6     0.4     0.2    -0.1      30%
ebiat                11.5    10.6     0.8     0.5    -0.3

BS
NWC                  22.8    23.6    29.9    36.1    38.8
                                                               8.9%      % of sales
Net PPE               11     11.3    13.1    15.1    17.6
                                                               4.0%      % of sales

ebiat
net capex                                                                change net PPE
change NWC                                                               change NWC
CF
TV
CF+TV
PV                                                                               $150.35


                                                                                           Method 1
Method 2
-12.75%        -12.50%        -66.12%              5.00%          5.00%    5.00%

   1988             1989            1990          1991            1992            1993           1994
  363.4            323.4           287.8         302.2           317.3           333.2          349.9
 -11.0%           -11.0%          -11.0%         5.00%           5.00%           5.00%          5.00%
  332.1            295.6           263.1         276.2           290.1           304.6          319.8
  91.4%            91.4%           91.4%         91.4%           91.4%           91.4%          91.4%

  21.8             19.1           16.7            17.5            18.4           19.3           20.3
  6.0%             5.9%           5.8%            5.8%            5.8%           5.8%           5.8%
   9.4              8.7            8.1             8.5             8.9            9.3            9.8
    -                -              -               -               -              -              -

    -                -              -               -               -              -              -
   9.4              8.7            8.1             8.5             8.9            9.3            9.8
   2.8              2.6            2.4             2.5             2.7            2.8            2.9
   6.6              6.1            5.6             5.9             6.2            6.5            6.9


  31.3             23.9           17.8            18.7            19.7           20.7           21.7
  8.6%             7.4%           6.2%            6.2%            6.2%           6.2%           6.2%
  14.5             12.9           11.5            12.1            12.7           13.3           14.0
   4%               4%             4%              4%              4%             4%             4%

   6.6             6.1              5.6            5.9             6.2            6.5            6.9
   -3.1            -1.6            -1.4            0.6             0.6            0.6            0.7
   -7.5            -7.3            -6.1            0.9             0.9            1.0            1.0
   17.2            15.0            13.2            4.5             4.7            4.9            5.2
                                                                 155.13
   17.2            15.0            13.2            4.5            159.8


                                       11.50%
period        Principle       Interest        Repayments    Total Payment
          1     75,000,000.00    8,625,000.00                   8,625,000.00
          2     75,000,000.00    8,625,000.00                   8,625,000.00
          3     75,000,000.00    8,625,000.00                   8,625,000.00
          4     75,000,000.00    8,625,000.00                   8,625,000.00
          5     75,000,000.00    8,625,000.00                   8,625,000.00
          6     75,000,000.00    8,625,000.00                   8,625,000.00
          7     75,000,000.00    8,625,000.00 75,000,000.00   83,625,000.00
                                                             135,375,000.00
13.50%
period       Principle       Interest        Repayments      Total Payments Remiander
         1    100,000,000.00 13,500,000.00      5,000,000.00   18,500,000.00 95,000,000.00
         2     95,000,000.00 12,825,000.00      5,000,000.00   17,825,000.00 90,000,000.00
         3     90,000,000.00 12,150,000.00      5,000,000.00   17,150,000.00 85,000,000.00
         4     85,000,000.00 11,475,000.00      5,000,000.00   16,475,000.00 80,000,000.00
         5     80,000,000.00 10,800,000.00      5,000,000.00   15,800,000.00 75,000,000.00
         6     75,000,000.00 10,125,000.00      5,000,000.00   15,125,000.00 70,000,000.00
         7     70,000,000.00    9,450,000.00                   79,450,000.00
                                             total            180,325,000.00
5.00%    5.00%    5.00%    5.00%    5.00%    5.00%

 1995     1996     1997     1998     1999     2000
367.4    385.7    405.0    425.3    446.5    468.9
5.00%    5.00%    5.00%    5.00%    5.00%    5.00%
335.8    352.6    370.2    388.7    408.1    428.5
91.4%    91.4%    91.4%    91.4%    91.4%    91.4%

21.3     22.4     23.5     24.7     25.9     27.2
5.8%     5.8%     5.8%     5.8%     5.8%     5.8%
10.3     10.8     11.3     11.9     12.5     13.1
  -        -        -        -        -        -

 -        -         -        -        -        -
10.3     10.8     11.3     11.9     12.5     13.1
3.1      3.2       3.4      3.6      3.8      3.9
7.2      7.6       7.9      8.3      8.8      9.2


22.8     23.9     25.1     26.4     27.7     29.1
6.2%     6.2%     6.2%     6.2%     6.2%     6.2%
14.7     15.4     16.2     17.0     17.9     18.8
 4%       4%       4%       4%       4%       4%

 7.2      7.6      7.9      8.3      8.8      9.2
 0.7      0.7      0.8      0.8      0.9      0.9
 1.1      1.1      1.2      1.3      1.3      1.4
 5.4      5.7      6.0      6.3      6.6      6.9
Pinkerton
terminal g
R

IS                   1983     1984   1985     1986    1987 average %
net sales            296.4   307.7   312.4   367.7   408.3
                                                                8.5% sales growth
cogs                 264.5   275.4   286.3   342.5   381.7
                                                               91.4% % of sales
Gross Profit          31.9    32.3    26.1    25.2     26.6
                                                                8.6% % of sales
operating expenses    15.5    17.1    24.9    24.5      27
                                                                6.4% % of sales
ebitda                16.4    15.2     1.2     0.7     -0.4
depreciation
                                                                     % of net ppe

other deductions
ebit                  16.4    15.2     1.2     0.7    -0.4
taxes                 7.71    7.14    0.56    0.33   -0.19      47% avg of CPP's tax
ebiat                 8.69    8.06    0.64    0.37   -0.21

BS
NWC                   22.8    23.6    29.9    36.1    38.8
                                                               8.9% % of sales
Net PPE                11     11.3    13.1    15.1    17.6
                                                               4.0% % of sales

ebiat
net capex                                                            change net PPE
change NWC                                                           change NWC
CF
TV
CF+TV
PV
cf g

          2010      2011     2012      2013      2014
         367.5     330.7     297.7    312.5     328.2
       -10.0%    -10.0%    -10.0%     5.0%      5.0%
         338.6     299.3     263.2    274.6     286.3

         28.9      31.5      34.4       38.0      41.9
       8.50%     9.00%     9.50%     10.25%    10.25%
         22.0      19.5      17.3       18.1      19.0
        6.0%      5.9%      5.8%       5.8%      5.8%
          6.8      11.9      17.2       19.9      22.8


          6.8      11.9      17.2      19.9      22.8
          3.2       5.6       8.1       9.3      10.7
          3.6       6.3       9.1      10.5      12.1


         31.6      24.5      18.5       19.4      20.3
        8.6%      7.4%      6.2%       6.2%      6.2%
         14.7      13.2      11.9       12.5      13.1
          4%        4%        4%         4%        4%

          3.6       6.3       9.1      10.5      12.1
         -2.9      -1.5      -1.3       0.6       0.6
         -7.2      -7.1      -6.0       0.9       1.0
         13.7      14.9      16.4       9.0      10.5

More Related Content

What's hot

SNC : Opp day Feb 18, 2013
SNC : Opp day Feb 18, 2013  SNC : Opp day Feb 18, 2013
SNC : Opp day Feb 18, 2013 TonHor Hor
 
2011 Mid Year Industrial Market Report
2011 Mid Year Industrial Market Report2011 Mid Year Industrial Market Report
2011 Mid Year Industrial Market Reportbrianparrish
 
2 Q07 Results Presentation
2 Q07 Results Presentation2 Q07 Results Presentation
2 Q07 Results PresentationLocaliza
 
2012 Mid Year Industrial Market Report
2012 Mid Year Industrial Market Report2012 Mid Year Industrial Market Report
2012 Mid Year Industrial Market Reportbrianparrish
 
2분기 영문 캐피탈ir자료
2분기 영문 캐피탈ir자료2분기 영문 캐피탈ir자료
2분기 영문 캐피탈ir자료Hyundai Finance
 
Recap des sociétés cotées
Recap des sociétés cotéesRecap des sociétés cotées
Recap des sociétés cotéesIDIR2001
 
Recap des résultats 2010 sociétés cotées
Recap des résultats 2010 sociétés cotéesRecap des résultats 2010 sociétés cotées
Recap des résultats 2010 sociétés cotéesIDIR2001
 
Swifton - The Capital Network - Financial Projections
Swifton - The Capital Network - Financial ProjectionsSwifton - The Capital Network - Financial Projections
Swifton - The Capital Network - Financial ProjectionsDavid Fogel
 
Swifton CFOs - McCarter English - Fin Proj 100511
Swifton CFOs - McCarter English - Fin Proj 100511Swifton CFOs - McCarter English - Fin Proj 100511
Swifton CFOs - McCarter English - Fin Proj 100511David Fogel
 
Swifton CFOs LLC - Boston BizSpark presentation - Financial Projections for I...
Swifton CFOs LLC - Boston BizSpark presentation - Financial Projections for I...Swifton CFOs LLC - Boston BizSpark presentation - Financial Projections for I...
Swifton CFOs LLC - Boston BizSpark presentation - Financial Projections for I...David Fogel
 
2012 Investment Review (Us)
2012 Investment Review (Us)2012 Investment Review (Us)
2012 Investment Review (Us)andrewyoungkofc
 
Eletropaulo 1 q10_eng_final
Eletropaulo 1 q10_eng_finalEletropaulo 1 q10_eng_final
Eletropaulo 1 q10_eng_finalAES Eletropaulo
 
Eletropaulo 1 q10_eng_final [modo de compatibilidade]
Eletropaulo 1 q10_eng_final [modo de compatibilidade]Eletropaulo 1 q10_eng_final [modo de compatibilidade]
Eletropaulo 1 q10_eng_final [modo de compatibilidade]AES Eletropaulo
 
11/13/2007 - 3Q07 Earnings Call Presentation
11/13/2007  	-   	3Q07 Earnings Call Presentation11/13/2007  	-   	3Q07 Earnings Call Presentation
11/13/2007 - 3Q07 Earnings Call PresentationAES Tietê
 
Embraer 1Q11 Results
Embraer 1Q11 ResultsEmbraer 1Q11 Results
Embraer 1Q11 ResultsEmbraer RI
 

What's hot (19)

Investors' Meeting - 1Q09 Results
Investors' Meeting - 1Q09 ResultsInvestors' Meeting - 1Q09 Results
Investors' Meeting - 1Q09 Results
 
SNC : Opp day Feb 18, 2013
SNC : Opp day Feb 18, 2013  SNC : Opp day Feb 18, 2013
SNC : Opp day Feb 18, 2013
 
2011 Mid Year Industrial Market Report
2011 Mid Year Industrial Market Report2011 Mid Year Industrial Market Report
2011 Mid Year Industrial Market Report
 
2 Q07 Results Presentation
2 Q07 Results Presentation2 Q07 Results Presentation
2 Q07 Results Presentation
 
Apresentacao Call Result 1 T08 Eng Final
Apresentacao Call Result 1 T08 Eng FinalApresentacao Call Result 1 T08 Eng Final
Apresentacao Call Result 1 T08 Eng Final
 
2012 Mid Year Industrial Market Report
2012 Mid Year Industrial Market Report2012 Mid Year Industrial Market Report
2012 Mid Year Industrial Market Report
 
2분기 영문 캐피탈ir자료
2분기 영문 캐피탈ir자료2분기 영문 캐피탈ir자료
2분기 영문 캐피탈ir자료
 
Recap des sociétés cotées
Recap des sociétés cotéesRecap des sociétés cotées
Recap des sociétés cotées
 
Recap des résultats 2010 sociétés cotées
Recap des résultats 2010 sociétés cotéesRecap des résultats 2010 sociétés cotées
Recap des résultats 2010 sociétés cotées
 
Apimec 2 q06 results
Apimec   2 q06 resultsApimec   2 q06 results
Apimec 2 q06 results
 
Swifton - The Capital Network - Financial Projections
Swifton - The Capital Network - Financial ProjectionsSwifton - The Capital Network - Financial Projections
Swifton - The Capital Network - Financial Projections
 
Swifton CFOs - McCarter English - Fin Proj 100511
Swifton CFOs - McCarter English - Fin Proj 100511Swifton CFOs - McCarter English - Fin Proj 100511
Swifton CFOs - McCarter English - Fin Proj 100511
 
Swifton CFOs LLC - Boston BizSpark presentation - Financial Projections for I...
Swifton CFOs LLC - Boston BizSpark presentation - Financial Projections for I...Swifton CFOs LLC - Boston BizSpark presentation - Financial Projections for I...
Swifton CFOs LLC - Boston BizSpark presentation - Financial Projections for I...
 
2012 Investment Review (Us)
2012 Investment Review (Us)2012 Investment Review (Us)
2012 Investment Review (Us)
 
Q3 2009 Earning Report of Posco
Q3 2009 Earning Report of PoscoQ3 2009 Earning Report of Posco
Q3 2009 Earning Report of Posco
 
Eletropaulo 1 q10_eng_final
Eletropaulo 1 q10_eng_finalEletropaulo 1 q10_eng_final
Eletropaulo 1 q10_eng_final
 
Eletropaulo 1 q10_eng_final [modo de compatibilidade]
Eletropaulo 1 q10_eng_final [modo de compatibilidade]Eletropaulo 1 q10_eng_final [modo de compatibilidade]
Eletropaulo 1 q10_eng_final [modo de compatibilidade]
 
11/13/2007 - 3Q07 Earnings Call Presentation
11/13/2007  	-   	3Q07 Earnings Call Presentation11/13/2007  	-   	3Q07 Earnings Call Presentation
11/13/2007 - 3Q07 Earnings Call Presentation
 
Embraer 1Q11 Results
Embraer 1Q11 ResultsEmbraer 1Q11 Results
Embraer 1Q11 Results
 

Viewers also liked

Support Presentation
Support PresentationSupport Presentation
Support PresentationJake Stimpson
 
Presentation lancour
Presentation lancourPresentation lancour
Presentation lancourJake Stimpson
 
August 2 Slideshow
August 2 SlideshowAugust 2 Slideshow
August 2 SlideshowK Brackett
 
Atrium Renovation 8/9
Atrium Renovation 8/9Atrium Renovation 8/9
Atrium Renovation 8/9K Brackett
 
Handlingsprogram 2010 Centerpartiet Varberg
Handlingsprogram 2010  Centerpartiet VarbergHandlingsprogram 2010  Centerpartiet Varberg
Handlingsprogram 2010 Centerpartiet VarbergCenterpartiet Varberg
 
Input ESOL
Input ESOLInput ESOL
Input ESOLsruff13
 

Viewers also liked (8)

Support Presentation
Support PresentationSupport Presentation
Support Presentation
 
Presentation lancour
Presentation lancourPresentation lancour
Presentation lancour
 
Microsoft Company
Microsoft CompanyMicrosoft Company
Microsoft Company
 
August 2 Slideshow
August 2 SlideshowAugust 2 Slideshow
August 2 Slideshow
 
Atrium Renovation 8/9
Atrium Renovation 8/9Atrium Renovation 8/9
Atrium Renovation 8/9
 
Handlingsprogram 2010 Centerpartiet Varberg
Handlingsprogram 2010  Centerpartiet VarbergHandlingsprogram 2010  Centerpartiet Varberg
Handlingsprogram 2010 Centerpartiet Varberg
 
Wmt Model Template
Wmt Model TemplateWmt Model Template
Wmt Model Template
 
Input ESOL
Input ESOLInput ESOL
Input ESOL
 

Similar to Method 1 vs Method 2 Loan Repayment Analysis/TITLE

2 q07 financial and operating results presentation
2 q07 financial and operating results presentation2 q07 financial and operating results presentation
2 q07 financial and operating results presentationEquatorial
 
Banco Sabadell FY10 Results
Banco Sabadell FY10 ResultsBanco Sabadell FY10 Results
Banco Sabadell FY10 ResultsBanco Sabadell
 
3Q11 Presentation
3Q11 Presentation3Q11 Presentation
3Q11 PresentationGafisa RI !
 
Presentation 1Q12 | Locamerica
Presentation 1Q12 | LocamericaPresentation 1Q12 | Locamerica
Presentation 1Q12 | Locamericalocamerica
 
Tabela de conversao z-dpmo
Tabela de conversao   z-dpmoTabela de conversao   z-dpmo
Tabela de conversao z-dpmoHugo Oliveira
 
30-06-2012 - 2Q12 Results Presentation
30-06-2012 - 2Q12 Results Presentation30-06-2012 - 2Q12 Results Presentation
30-06-2012 - 2Q12 Results Presentationsonaeri
 
Banco ABC - 3rd Quarter 2008 Results Presentation
Banco ABC - 3rd Quarter 2008 Results PresentationBanco ABC - 3rd Quarter 2008 Results Presentation
Banco ABC - 3rd Quarter 2008 Results PresentationBanco ABC Brasil
 
Apresentação call 3 t12_eng
Apresentação call 3 t12_engApresentação call 3 t12_eng
Apresentação call 3 t12_engArteris S.A.
 
Eletropaulo 1 q10_eng_final
Eletropaulo 1 q10_eng_finalEletropaulo 1 q10_eng_final
Eletropaulo 1 q10_eng_finalAES Eletropaulo
 
ApresentaçãO 1 Q07
ApresentaçãO 1 Q07ApresentaçãO 1 Q07
ApresentaçãO 1 Q07Localiza
 
Earnings Results 2Q07
Earnings Results 2Q07Earnings Results 2Q07
Earnings Results 2Q07JBS RI
 
omnicom group Q3 2006 Investor Presentation
omnicom group  Q3 2006 Investor Presentationomnicom group  Q3 2006 Investor Presentation
omnicom group Q3 2006 Investor Presentationfinance22
 
1Q09 Results Presentation
1Q09 Results Presentation1Q09 Results Presentation
1Q09 Results PresentationJBS RI
 
Apres call 2_q10_v2
Apres call 2_q10_v2Apres call 2_q10_v2
Apres call 2_q10_v2Arteris S.A.
 

Similar to Method 1 vs Method 2 Loan Repayment Analysis/TITLE (20)

Ohl Apr Eng
Ohl Apr EngOhl Apr Eng
Ohl Apr Eng
 
Apimec – 4 q07 results
Apimec – 4 q07 resultsApimec – 4 q07 results
Apimec – 4 q07 results
 
2 q07 financial and operating results presentation
2 q07 financial and operating results presentation2 q07 financial and operating results presentation
2 q07 financial and operating results presentation
 
Banco Sabadell FY10 Results
Banco Sabadell FY10 ResultsBanco Sabadell FY10 Results
Banco Sabadell FY10 Results
 
3Q11 Presentation
3Q11 Presentation3Q11 Presentation
3Q11 Presentation
 
Presentation 1Q12 | Locamerica
Presentation 1Q12 | LocamericaPresentation 1Q12 | Locamerica
Presentation 1Q12 | Locamerica
 
Presentation 1Q12
Presentation 1Q12Presentation 1Q12
Presentation 1Q12
 
Tabela de conversao z-dpmo
Tabela de conversao   z-dpmoTabela de conversao   z-dpmo
Tabela de conversao z-dpmo
 
30-06-2012 - 2Q12 Results Presentation
30-06-2012 - 2Q12 Results Presentation30-06-2012 - 2Q12 Results Presentation
30-06-2012 - 2Q12 Results Presentation
 
Banco ABC - 3rd Quarter 2008 Results Presentation
Banco ABC - 3rd Quarter 2008 Results PresentationBanco ABC - 3rd Quarter 2008 Results Presentation
Banco ABC - 3rd Quarter 2008 Results Presentation
 
Presentation 2Q12
Presentation 2Q12Presentation 2Q12
Presentation 2Q12
 
Apresentação call 3 t12_eng
Apresentação call 3 t12_engApresentação call 3 t12_eng
Apresentação call 3 t12_eng
 
Eletropaulo 1 q10_eng_final
Eletropaulo 1 q10_eng_finalEletropaulo 1 q10_eng_final
Eletropaulo 1 q10_eng_final
 
ApresentaçãO 1 Q07
ApresentaçãO 1 Q07ApresentaçãO 1 Q07
ApresentaçãO 1 Q07
 
Earnings Results 2Q07
Earnings Results 2Q07Earnings Results 2Q07
Earnings Results 2Q07
 
omnicom group Q3 2006 Investor Presentation
omnicom group  Q3 2006 Investor Presentationomnicom group  Q3 2006 Investor Presentation
omnicom group Q3 2006 Investor Presentation
 
Apimec 2 q05 results
Apimec   2 q05 resultsApimec   2 q05 results
Apimec 2 q05 results
 
1Q09 Results Presentation
1Q09 Results Presentation1Q09 Results Presentation
1Q09 Results Presentation
 
Apimec – 3 q07 results
Apimec – 3 q07 resultsApimec – 3 q07 results
Apimec – 3 q07 results
 
Apres call 2_q10_v2
Apres call 2_q10_v2Apres call 2_q10_v2
Apres call 2_q10_v2
 

Method 1 vs Method 2 Loan Repayment Analysis/TITLE

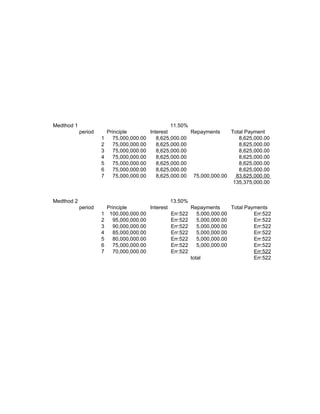
  • 1. Medthod 1 11.50% period Principle Interest Repayments Total Payment 1 75,000,000.00 8,625,000.00 8,625,000.00 2 75,000,000.00 8,625,000.00 8,625,000.00 3 75,000,000.00 8,625,000.00 8,625,000.00 4 75,000,000.00 8,625,000.00 8,625,000.00 5 75,000,000.00 8,625,000.00 8,625,000.00 6 75,000,000.00 8,625,000.00 8,625,000.00 7 75,000,000.00 8,625,000.00 75,000,000.00 83,625,000.00 135,375,000.00 Medthod 2 13.50% period Principle Interest Repayments Total Payments 1 100,000,000.00 Err:522 5,000,000.00 Err:522 2 95,000,000.00 Err:522 5,000,000.00 Err:522 3 90,000,000.00 Err:522 5,000,000.00 Err:522 4 85,000,000.00 Err:522 5,000,000.00 Err:522 5 80,000,000.00 Err:522 5,000,000.00 Err:522 6 75,000,000.00 Err:522 5,000,000.00 Err:522 7 70,000,000.00 Err:522 Err:522 total Err:522
  • 2. Remiander 95,000,000.00 90,000,000.00 85,000,000.00 80,000,000.00 75,000,000.00 70,000,000.00
  • 3. Pinkerton terminal g 5.00% R 8.17% 0.7 cf g IS 1983 1984 1985 1986 1987 average % net sales 296.4 307.7 312.4 367.7 408.3 8.5% sales growth cogs 264.5 275.4 286.3 342.5 381.7 91.4% % of sales operating expenses 15.5 17.1 24.9 24.5 27 6.4% % of sales ebitda 16.4 15.2 1.2 0.7 -0.4 depreciation - - - - - other deductions - - - - - ebit 16.4 15.2 1.2 0.7 -0.4 taxes 4.9 4.6 0.4 0.2 -0.1 30% ebiat 11.5 10.6 0.8 0.5 -0.3 BS NWC 22.8 23.6 29.9 36.1 38.8 8.9% % of sales Net PPE 11 11.3 13.1 15.1 17.6 4.0% % of sales ebiat net capex change net PPE change NWC change NWC CF TV CF+TV PV $150.35 Method 1
  • 5. -12.75% -12.50% -66.12% 5.00% 5.00% 5.00% 1988 1989 1990 1991 1992 1993 1994 363.4 323.4 287.8 302.2 317.3 333.2 349.9 -11.0% -11.0% -11.0% 5.00% 5.00% 5.00% 5.00% 332.1 295.6 263.1 276.2 290.1 304.6 319.8 91.4% 91.4% 91.4% 91.4% 91.4% 91.4% 91.4% 21.8 19.1 16.7 17.5 18.4 19.3 20.3 6.0% 5.9% 5.8% 5.8% 5.8% 5.8% 5.8% 9.4 8.7 8.1 8.5 8.9 9.3 9.8 - - - - - - - - - - - - - - 9.4 8.7 8.1 8.5 8.9 9.3 9.8 2.8 2.6 2.4 2.5 2.7 2.8 2.9 6.6 6.1 5.6 5.9 6.2 6.5 6.9 31.3 23.9 17.8 18.7 19.7 20.7 21.7 8.6% 7.4% 6.2% 6.2% 6.2% 6.2% 6.2% 14.5 12.9 11.5 12.1 12.7 13.3 14.0 4% 4% 4% 4% 4% 4% 4% 6.6 6.1 5.6 5.9 6.2 6.5 6.9 -3.1 -1.6 -1.4 0.6 0.6 0.6 0.7 -7.5 -7.3 -6.1 0.9 0.9 1.0 1.0 17.2 15.0 13.2 4.5 4.7 4.9 5.2 155.13 17.2 15.0 13.2 4.5 159.8 11.50% period Principle Interest Repayments Total Payment 1 75,000,000.00 8,625,000.00 8,625,000.00 2 75,000,000.00 8,625,000.00 8,625,000.00 3 75,000,000.00 8,625,000.00 8,625,000.00 4 75,000,000.00 8,625,000.00 8,625,000.00 5 75,000,000.00 8,625,000.00 8,625,000.00 6 75,000,000.00 8,625,000.00 8,625,000.00 7 75,000,000.00 8,625,000.00 75,000,000.00 83,625,000.00 135,375,000.00
  • 6. 13.50% period Principle Interest Repayments Total Payments Remiander 1 100,000,000.00 13,500,000.00 5,000,000.00 18,500,000.00 95,000,000.00 2 95,000,000.00 12,825,000.00 5,000,000.00 17,825,000.00 90,000,000.00 3 90,000,000.00 12,150,000.00 5,000,000.00 17,150,000.00 85,000,000.00 4 85,000,000.00 11,475,000.00 5,000,000.00 16,475,000.00 80,000,000.00 5 80,000,000.00 10,800,000.00 5,000,000.00 15,800,000.00 75,000,000.00 6 75,000,000.00 10,125,000.00 5,000,000.00 15,125,000.00 70,000,000.00 7 70,000,000.00 9,450,000.00 79,450,000.00 total 180,325,000.00
  • 7. 5.00% 5.00% 5.00% 5.00% 5.00% 5.00% 1995 1996 1997 1998 1999 2000 367.4 385.7 405.0 425.3 446.5 468.9 5.00% 5.00% 5.00% 5.00% 5.00% 5.00% 335.8 352.6 370.2 388.7 408.1 428.5 91.4% 91.4% 91.4% 91.4% 91.4% 91.4% 21.3 22.4 23.5 24.7 25.9 27.2 5.8% 5.8% 5.8% 5.8% 5.8% 5.8% 10.3 10.8 11.3 11.9 12.5 13.1 - - - - - - - - - - - - 10.3 10.8 11.3 11.9 12.5 13.1 3.1 3.2 3.4 3.6 3.8 3.9 7.2 7.6 7.9 8.3 8.8 9.2 22.8 23.9 25.1 26.4 27.7 29.1 6.2% 6.2% 6.2% 6.2% 6.2% 6.2% 14.7 15.4 16.2 17.0 17.9 18.8 4% 4% 4% 4% 4% 4% 7.2 7.6 7.9 8.3 8.8 9.2 0.7 0.7 0.8 0.8 0.9 0.9 1.1 1.1 1.2 1.3 1.3 1.4 5.4 5.7 6.0 6.3 6.6 6.9
  • 8.
  • 9.
  • 10.
  • 11.
  • 12.
  • 13.
  • 14.
  • 15.
  • 16.
  • 17.
  • 18.
  • 19. Pinkerton terminal g R IS 1983 1984 1985 1986 1987 average % net sales 296.4 307.7 312.4 367.7 408.3 8.5% sales growth cogs 264.5 275.4 286.3 342.5 381.7 91.4% % of sales Gross Profit 31.9 32.3 26.1 25.2 26.6 8.6% % of sales operating expenses 15.5 17.1 24.9 24.5 27 6.4% % of sales ebitda 16.4 15.2 1.2 0.7 -0.4 depreciation % of net ppe other deductions ebit 16.4 15.2 1.2 0.7 -0.4 taxes 7.71 7.14 0.56 0.33 -0.19 47% avg of CPP's tax ebiat 8.69 8.06 0.64 0.37 -0.21 BS NWC 22.8 23.6 29.9 36.1 38.8 8.9% % of sales Net PPE 11 11.3 13.1 15.1 17.6 4.0% % of sales ebiat net capex change net PPE change NWC change NWC CF TV CF+TV PV
  • 20. cf g 2010 2011 2012 2013 2014 367.5 330.7 297.7 312.5 328.2 -10.0% -10.0% -10.0% 5.0% 5.0% 338.6 299.3 263.2 274.6 286.3 28.9 31.5 34.4 38.0 41.9 8.50% 9.00% 9.50% 10.25% 10.25% 22.0 19.5 17.3 18.1 19.0 6.0% 5.9% 5.8% 5.8% 5.8% 6.8 11.9 17.2 19.9 22.8 6.8 11.9 17.2 19.9 22.8 3.2 5.6 8.1 9.3 10.7 3.6 6.3 9.1 10.5 12.1 31.6 24.5 18.5 19.4 20.3 8.6% 7.4% 6.2% 6.2% 6.2% 14.7 13.2 11.9 12.5 13.1 4% 4% 4% 4% 4% 3.6 6.3 9.1 10.5 12.1 -2.9 -1.5 -1.3 0.6 0.6 -7.2 -7.1 -6.0 0.9 1.0 13.7 14.9 16.4 9.0 10.5