Comprehensive Assessment
Analyst presentation
JukkaVesala, Director General Micro-Prudential Supervision III
John Fell, Acting Director General Macro-Prudential Policy & Financial Stability
Sunday 26th October 2014
Rubric
www.ecb.europa.eu
3
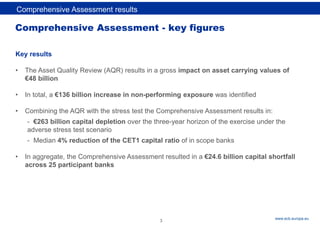
Comprehensive Assessment -key figures
Key results
• The Asset Quality Review (AQR) results in a gross impact on asset carrying values of
€48 billion
• In total, a €136 billion increase in non-performing exposure was identified
• Combining the AQR with the stress test the Comprehensive Assessment results in:
- €263 billion capital depletion over the three-year horizon of the exercise under the
adverse stress test scenario
- Median 4% reduction of the CET1 capital ratio of in scope banks
• In aggregate, the Comprehensive Assessment resulted in a €24.6 billion capital shortfall
across 25 participant banks
Comprehensive Assessment results
5.
Rubric
www.ecb.europa.eu
Comprehensive Assessment results
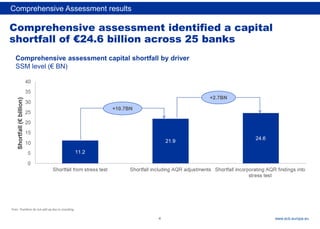
Note:Numbers do not add up due to rounding
Comprehensive assessment identified a capital
shortfall of €24.6 billion across 25 banks
+10.7BN
Comprehensive assessment capital shortfall by driver
SSM level (€ BN)
+2.7BN
4
6.
Rubric
www.ecb.europa.eu
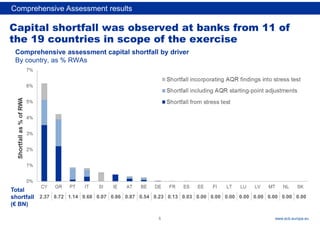
Capital shortfall wasobserved at banks from 11 of
the 19 countries in scope of the exercise
Comprehensive assessment capital shortfall by driver
By country, as % RWAs
Total
shortfall
(€ BN)
2.37 8.72 1.14 9.68 0.07 0.86 0.87 0.54 0.23 0.13 0.03 0.00 0.00 0.00 0.00 0.00 0.00 0.00 0.00
5
Comprehensive Assessment results
7.
Rubric
www.ecb.europa.eu
Comprehensive Assessment results
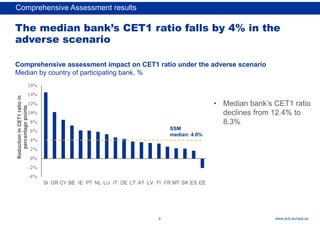
•Median bank’s CET1 ratio
declines from 12.4% to
8.3%
Comprehensive assessment impact on CET1 ratio under the adverse scenario
Median by country of participating bank, %
SSM
median: 4.0%
The median bank’s CET1 ratio falls by 4% in the
adverse scenario
6
Rubric
www.ecb.europa.eu
8
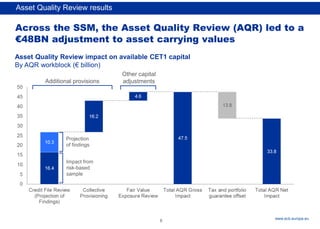
Across the SSM,the Asset Quality Review (AQR) led to a
€48BN adjustment to asset carrying values
Asset Quality Review impact on available CET1 capital
By AQR workblock (€ billion)
Additional provisions
Other capital
adjustments
Projection
of findings
Impact from
risk-based
sample
Asset Quality Review results
10.
Rubric
www.ecb.europa.eu
9
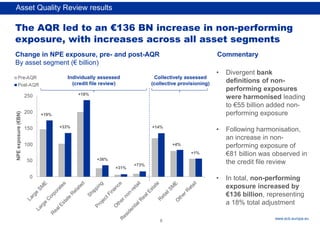
The AQR ledto an €136 BN increase in non-performing
exposure, with increases across all asset segments
Change in NPE exposure, pre- and post-AQR
By asset segment (€ billion)
• Divergent bank
definitions of non-
performing exposures
were harmonised leading
to €55 billion added non-
performing exposure
• Following harmonisation,
an increase in non-
performing exposure of
€81 billion was observed in
the credit file review
• In total, non-performing
exposure increased by
€136 billion, representing
a 18% total adjustment
Commentary
NPE
exposure
(€BN)
Individually assessed
(credit file review)
Collectively assessed
(collective provisioning)
+33%
+19%
+18%
+31%
+36%
+73%
+14%
+4%
+1%
Asset Quality Review results
11.
Rubric
www.ecb.europa.eu
10
Individually assessed
(credit filereview)
Collectively assessed
(collective provisioning)
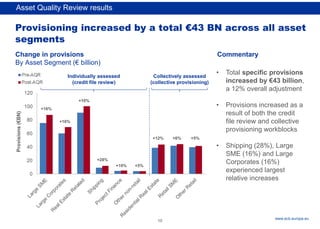
Provisioning increased by a total €43 BN across all asset
segments
Change in provisions
By Asset Segment (€ billion)
• Total specific provisions
increased by €43 billion,
a 12% overall adjustment
• Provisions increased as a
result of both the credit
file review and collective
provisioning workblocks
• Shipping (28%), Large
SME (16%) and Large
Corporates (16%)
experienced largest
relative increases
Commentary
Provisions
(€BN)
+16%
+16%
+10%
+28%
+10% +5%
+12% +6% +5%
Asset Quality Review results
12.
Rubric
www.ecb.europa.eu
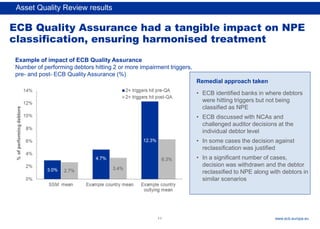
ECB Quality Assurancehad a tangible impact on NPE
classification, ensuring harmonised treatment
• ECB identified banks in where debtors
were hitting triggers but not being
classified as NPE
• ECB discussed with NCAs and
challenged auditor decisions at the
individual debtor level
• In some cases the decision against
reclassification was justified
• In a significant number of cases,
decision was withdrawn and the debtor
reclassified to NPE along with debtors in
similar scenarios
Example of impact of ECB Quality Assurance
Number of performing debtors hitting 2 or more impairment triggers,
pre- and post- ECB Quality Assurance (%)
Remedial approach taken
11
Asset Quality Review results
13.
Rubric
www.ecb.europa.eu
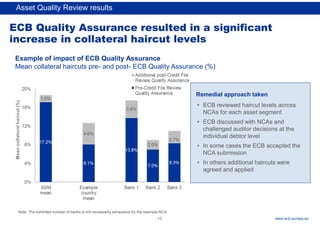
ECB Quality Assuranceresulted in a significant
increase in collateral haircut levels
Example of impact of ECB Quality Assurance
Mean collateral haircuts pre- and post- ECB Quality Assurance (%)
Note: The exhibited number of banks is not necessarily exhaustive for the example NCA
• ECB reviewed haircut levels across
NCAs for each asset segment
• ECB discussed with NCAs and
challenged auditor decisions at the
individual debtor level
• In some cases the ECB accepted the
NCA submission
• In others additional haircuts were
agreed and applied
Remedial approach taken
Asset Quality Review results
12
14.
Rubric
www.ecb.europa.eu
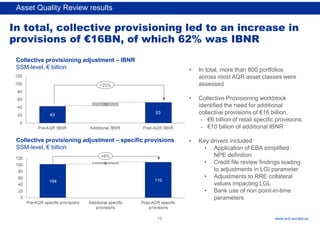
In total, collectiveprovisioning led to an increase in
provisions of €16BN, of which 62% was IBNR
Collective provisioning adjustment – IBNR
SSM-level, € billion
Collective provisioning adjustment – specific provisions
SSM-level, € billion
• In total, more than 800 portfolios
across most AQR asset classes were
assessed
• Collective Provisioning workblock
identified the need for additional
collective provisions of €16 billion,
- €6 billion of retail specific provisions
- €10 billion of additional IBNR
• Key drivers included
• Application of EBA simplified
NPE definition
• Credit file review findings leading
to adjustments in LGI parameter
• Adjustments to RRE collateral
values impacting LGL
• Bank use of non point-in-time
parameters
+23%
+6%
Asset Quality Review results
13
15.
Rubric
www.ecb.europa.eu
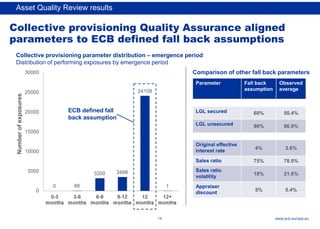
Collective provisioning QualityAssurance aligned
parameters to ECB defined fall back assumptions
Collective provisioning parameter distribution – emergence period
Distribution of performing exposures by emergence period
Asset Quality Review results
ECB defined fall
back assumption
Parameter Fall back
assumption
Observed
average
LGL secured 60% 50.4%
LGL unsecured 90% 86.9%
Original effective
interest rate
4% 3.6%
Sales ratio 75% 78.0%
Sales ratio
volatility
18% 21.6%
Appraiser
discount
5% 5.4%
Comparison of other fall back parameters
Number
of
exposures
14
16.
Rubric
www.ecb.europa.eu
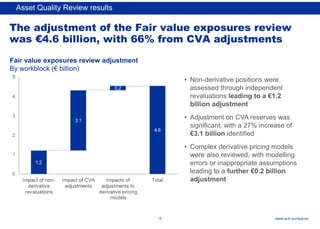
The adjustment ofthe Fair value exposures review
was €4.6 billion, with 66% from CVA adjustments
Fair value exposures review adjustment
By workblock (€ billion)
• Non-derivative positions were
assessed through independent
revaluations leading to a €1.2
billion adjustment
• Adjustment on CVA reserves was
significant, with a 27% increase of
€3.1 billion identified
• Complex derivative pricing models
were also reviewed, with modelling
errors or inappropriate assumptions
leading to a further €0.2 billion
adjustment
Asset Quality Review results
15
Rubric
www.ecb.europa.eu
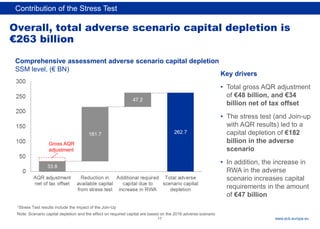
1Stress Test resultsinclude the impact of the Join-Up
Note: Scenario capital depletion and the effect on required capital are based on the 2016 adverse scenario
Overall, total adverse scenario capital depletion is
€263 billion
Contribution of the Stress Test
Comprehensive assessment adverse scenario capital depletion
SSM level, (€ BN)
Key drivers
• Total gross AQR adjustment
of €48 billion, and €34
billion net of tax offset
• The stress test (and Join-up
with AQR results) led to a
capital depletion of €182
billion in the adverse
scenario
• In addition, the increase in
RWA in the adverse
scenario increases capital
requirements in the amount
of €47 billion
Gross AQR
adjustment
17
19.
Rubric
www.ecb.europa.eu
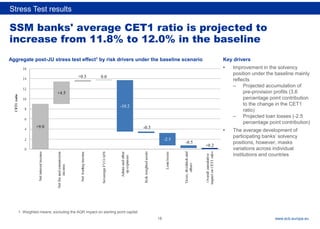
SSM banks' averageCET1 ratio is projected to
increase from 11.8% to 12.0% in the baseline
Key drivers
• Improvement in the solvency
position under the baseline mainly
reflects
– Projected accumulation of
pre-provision profits (3.6
percentage point contribution
to the change in the CET1
ratio)
– Projected loan losses (-2.5
percentage point contribution)
• The average development of
participating banks’ solvency
positions, however, masks
variations across individual
institutions and countries
Stress Test results
Aggregate post-JU stress test effect1 by risk drivers under the baseline scenario
1. Weighted means; excluding the AQR impact on starting point capital
18
20.
Rubric
www.ecb.europa.eu
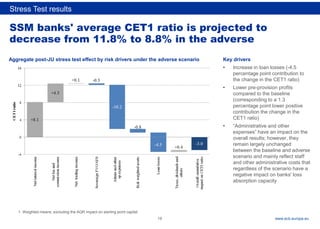
SSM banks' averageCET1 ratio is projected to
decrease from 11.8% to 8.8% in the adverse
Key drivers
• Increase in loan losses (-4.5
percentage point contribution to
the change in the CET1 ratio)
• Lower pre-provision profits
compared to the baseline
(corresponding to a 1.3
percentage point lower positive
contribution the change in the
CET1 ratio)
• “Administrative and other
expenses” have an impact on the
overall results; however, they
remain largely unchanged
between the baseline and adverse
scenario and mainly reflect staff
and other administrative costs that
regardless of the scenario have a
negative impact on banks' loss
absorption capacity
Stress Test results
Aggregate post-JU stress test effect by risk drivers under the adverse scenario
1. Weighted means; excluding the AQR impact on starting point capital
19
21.
Rubric
www.ecb.europa.eu
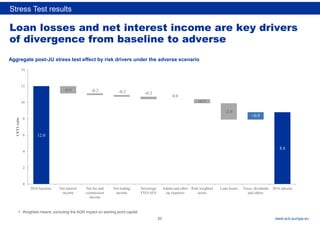
Loan losses andnet interest income are key drivers
of divergence from baseline to adverse
Stress Test results
Aggregate post-JU stress test effect by risk drivers under the adverse scenario
1. Weighted means; excluding the AQR impact on starting point capital
12.0
8.8
-0.9 -0.2 -0.2 -0.3
0.0
-0.5
-2.0
+0.9
0
2
4
6
8
10
12
14
2016 baseline Net interest
income
Net fee and
commission
income
Net trading
income
Sovereign
FVO/AFS
Admin and other
op expenses
Risk weighted
assets
Loan losses Taxes, dividends
and others
2016 adverse
CET1
ratio
20
22.
Rubric
www.ecb.europa.eu
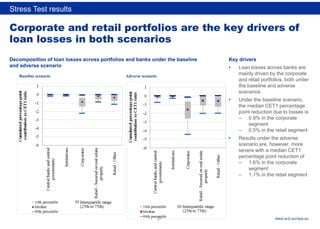
Corporate and retailportfolios are the key drivers of
loan losses in both scenarios
Key drivers
• Loan losses across banks are
mainly driven by the corporate
and retail portfolios, both under
the baseline and adverse
scenarios
• Under the baseline scenario,
the median CET1 percentage
point reduction due to losses is:
– 0.9% in the corporate
segment
– 0.5% in the retail segment
• Results under the adverse
scenario are, however, more
severe with a median CET1
percentage point reduction of
– 1.6% in the corporate
segment
– 1.1% in the retail segment
Stress Test results
Baseline scenario Adverse scenario
Decomposition of loan losses across portfolios and banks under the baseline
and adverse scenario
21
23.
Rubric
www.ecb.europa.eu
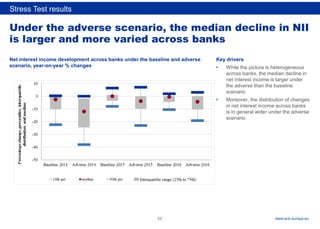
Under the adversescenario, the median decline in NII
is larger and more varied across banks
Key drivers
• While the picture is heterogeneous
across banks, the median decline in
net interest income is larger under
the adverse than the baseline
scenario
• Moreover, the distribution of changes
in net interest income across banks
is in general wider under the adverse
scenario
Stress Test results
Net interest income development across banks under the baseline and adverse
scenario, year-on-year % changes
22
24.
Rubric
www.ecb.europa.eu
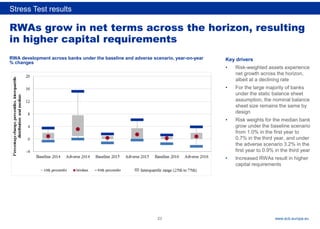
RWAs grow innet terms across the horizon, resulting
in higher capital requirements
Stress Test results
RWA development across banks under the baseline and adverse scenario, year-on-year
% changes
Key drivers
• Risk-weighted assets experience
net growth across the horizon,
albeit at a declining rate
• For the large majority of banks
under the static balance sheet
assumption, the nominal balance
sheet size remains the same by
design
• Risk weights for the median bank
grow under the baseline scenario
from 1.0% in the first year to
0.7% in the third year, and under
the adverse scenario 3.2% in the
first year to 0.9% in the third year
• Increased RWAs result in higher
capital requirements
23
25.
Rubric
www.ecb.europa.eu
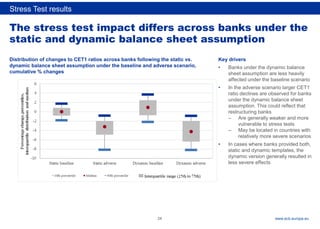
The stress testimpact differs across banks under the
static and dynamic balance sheet assumption
Stress Test results
Distribution of changes to CET1 ratios across banks following the static vs.
dynamic balance sheet assumption under the baseline and adverse scenario,
cumulative % changes
Key drivers
• Banks under the dynamic balance
sheet assumption are less heavily
affected under the baseline scenario
• In the adverse scenario larger CET1
ratio declines are observed for banks
under the dynamic balance sheet
assumption. This could reflect that
restructuring banks
– Are generally weaker and more
vulnerable to stress tests
– May be located in countries with
relatively more severe scenarios
• In cases where banks provided both,
static and dynamic templates, the
dynamic version generally resulted in
less severe effects
24
26.
Rubric
www.ecb.europa.eu
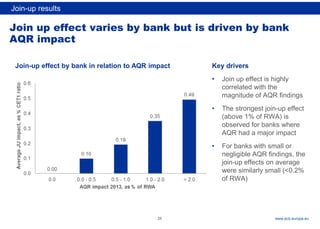
Join up effectvaries by bank but is driven by bank
AQR impact
Join-up effect by bank in relation to AQR impact Key drivers
• Join up effect is highly
correlated with the
magnitude of AQR findings
• The strongest join-up effect
(above 1% of RWA) is
observed for banks where
AQR had a major impact
• For banks with small or
negligible AQR findings, the
join-up effects on average
were similarly small (<0.2%
of RWA)
Join-up results
25
27.
Rubric
www.ecb.europa.eu
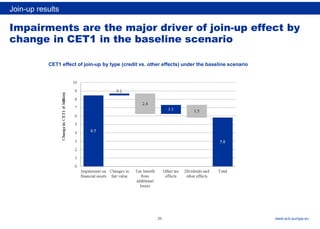
Impairments are themajor driver of join-up effect by
change in CET1 in the baseline scenario
Join-up results
CET1 effect of join-up by type (credit vs. other effects) under the baseline scenario
26
28.
Rubric
www.ecb.europa.eu
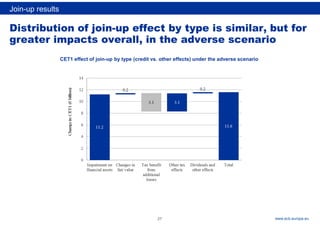
Distribution of join-upeffect by type is similar, but for
greater impacts overall, in the adverse scenario
Join-up results
CET1 effect of join-up by type (credit vs. other effects) under the adverse scenario
27
29.
Rubric
www.ecb.europa.eu
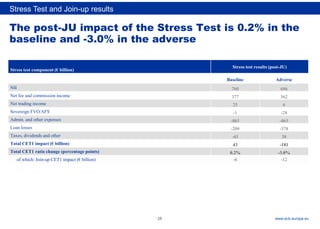
The post-JU impactof the Stress Test is 0.2% in the
baseline and -3.0% in the adverse
Stress test component (€ billion)
Stress test results (post-JU)
Baseline Adverse
NII 760 686
Net fee and commission income 377 362
Net trading income 25 6
Sovereign FVO/AFS -1 -28
Admin. and other expenses -865 -865
Loan losses -209 -378
Taxes, dividends and other -45 38
Total CET1 impact (€ billion) 43 -181
Total CET1 ratio change (percentage points) 0.2% -3.0%
of which: Join-up CET1 impact (€ billion) -6 -12
Stress Test and Join-up results
28