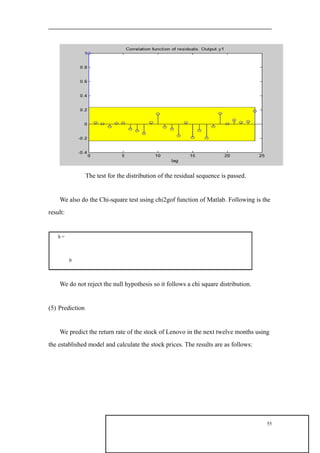
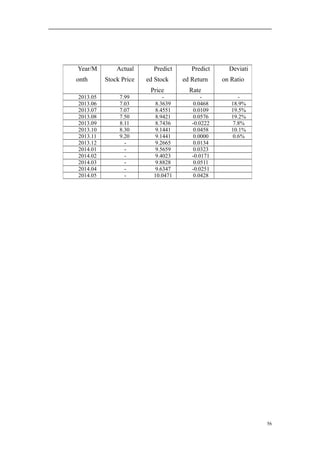
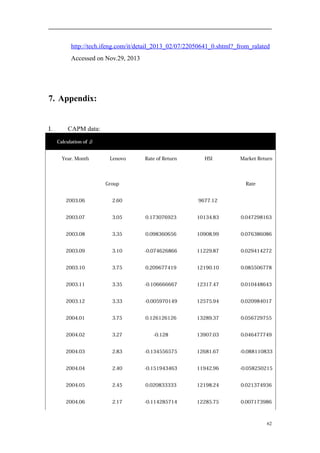
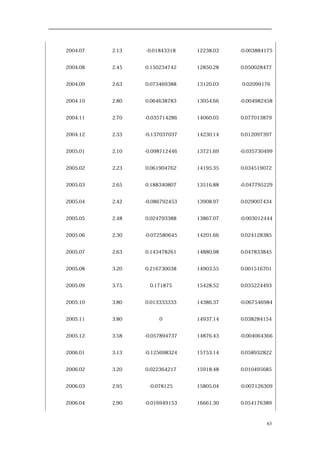
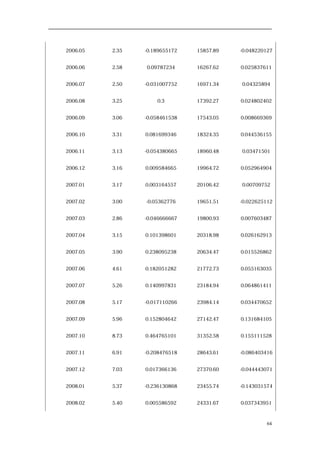
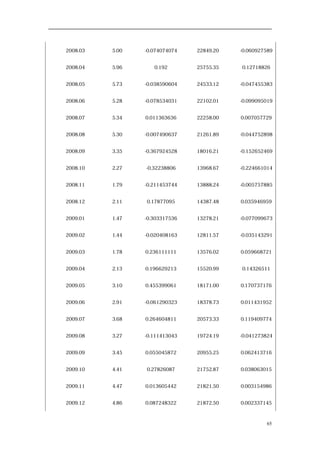
The document provides an analysis of Lenovo Group to determine whether the fund should continue holding its equity in the company. It analyzes Lenovo using PEST analysis, Porter's Five Forces model, SWOT analysis, and trend analysis. It also compares Lenovo to competitors and provides technical analysis of Lenovo's stock price. The analysis concludes that Lenovo is a good long-term investment due to its good valuation and corporate fundamentals. The target stock price by the end of 2013 is predicted to be $1.091 based on the PE method and ARIMA model.

![2013 Included as a constituent stock in the Hang Seng Index.
2013 Declaring the establishment of two new end-to-end business groups:
Lenovo and Think business groups respectively.
2.2 PEST Model:
2.2.1 Political Environment:
Lenovo has broadened its business scale to many different regions around the
world. The whole market can be segmented into three parts according to the political
environments.
First of all, the Chinese market is undoubtedly the primary one for that more than
40 percent of the total revenue of Lenovo is gained in this region [1]. The Chinese
government is now fully supporting a project called Consumer Electronics Subsidy
Program. The program aims to expand the domestic electronics market by offering a
lower selling price to the buyers who lived in the countryside instead of urban areas.
This measure turns out to take effect and the once depressed electronics market was
successfully stimulated. Another important political driver in China is the plan of
further urbanization. Since that the penetration rate of personal computers in Chinese
households is still low, the prospect for Lenovo to increase its sales in mainland China
is really respectable. Furthermore, Chinese government is implementing a hospital
information system domestically. The process of informatization is bound to boost the
sales of the PC manufacturers, which is also an opportunity for Lenovo. However, a
lack of legal protection of property rights in mainland China is definitely a threat for
Lenovo. The company has to take the risk of being plagiarized of its research and
development achievements in its operation there.
Secondly, in India, the government is also supporting Lenovo in its own way. In
the year of 2012, the government of Tamil Nadu ordered a million laptops from
5](https://image.slidesharecdn.com/15b5ae20-afc8-446e-bbf8-93d7f44978e6-160225003350/85/Analysis-on-Whether-to-Keep-Holding-Lenovo-s-Equity-8-320.jpg)
![Lenovo and single-handedly made the firm a market leader. In fact, the Indian
government is still under a course of office-work electronization and the transform
will not be completed till several years later. Recently, there is a saying goes that India
is now the world’s office. Since that personal computer is an essential part in the
office, it can be predicted that the need for personal computers of the Indian market
will keep an upward trend in the future.
Another segment of the global market is the North American, European regions
and Japan. Different from the previous two segments, these three regions have a more
developed and sound political environment. Their government welcomes foreign
companies like Lenovo to establish business in their countries.
2.2.2 Economic Environment:
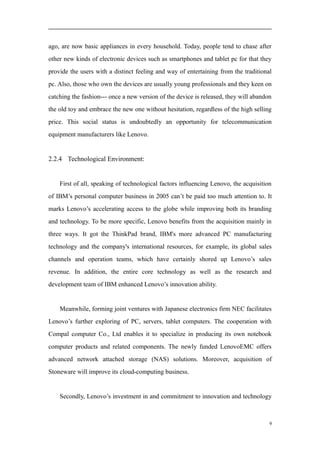
Economic factors also have inevitable influence on Lenovo’s operating. First,
let’s take a look at mainland China. As the Graph 1 shows, from 2010 to 2013, the
domestic disposable income per capita always rose stably from the quarter to quarter
in every single year [2]. So does the domestic non-productive expenditure per capita.
That means the purchasing power of Chinese is not so badly weakened due to the
financial crisis these years. Hence, the market demand for electronic devices is out of
concern for Lenovo in this aspect.
Nevertheless, Lenovo is facing a problem of increasing product cost in China-
located factories. The fact is, China is no longer the world’s factory it used to be with
a fairly low wage level. Conversely, due to the inflation and appreciation of RMB, the
cost of manufacturing in mainland China has been ascending lately. As a
consequence, Lenovo may have to consider establishing new factories out of
mainland China, for example, countries like Vietnam and Indonesia are becoming
more welcomed for manufacturers because of their cheaper labor force. How to save
6](https://image.slidesharecdn.com/15b5ae20-afc8-446e-bbf8-93d7f44978e6-160225003350/85/Analysis-on-Whether-to-Keep-Holding-Lenovo-s-Equity-9-320.jpg)
![the cost and maintain a good profit margin in mainland China will be a priority in
Lenovo’s future itinerary.
Figure 1: Two Economic Indicators of Mainland China
Indian’s economic condition is not alike that of mainland China. The exchange
rate of Indian rupee against US dollar is constantly dropping according to the statistics
these years (see Graph 2)[3]. Despite of a series of measures taken by the Indian
government and Reserve Bank of India, there still shows no apparent sign of
appreciation in the near future. The depression of the Indian overall economy will
certainly lead to a plunge in the domestic market demand. Lenovo’s sales plan may
need some adjustments as correspondingly.
Figure 2: Exchange Rate of Indian Rupee against US Dollar
7](https://image.slidesharecdn.com/15b5ae20-afc8-446e-bbf8-93d7f44978e6-160225003350/85/Analysis-on-Whether-to-Keep-Holding-Lenovo-s-Equity-10-320.jpg)
![In the rest business regions of Lenovo, the economy is mingled with hope and
fear. As is known to all, North American, European regions and Japan is still under the
shade of the financial crisis started in 2008. Especially in the Europe, nine countries’
credit rating has been degraded by S&P, including one of the largest economies,
France. However, the condition is not totally hopeless. BBC news reported that in
October 2013, Eurozone unemployment falls for first time since early 2011, according
to official data [4]. Meanwhile in the United States, the consumer prices fell 0.1% in
October 2013 as petrol prices dropped, told by the US Labor Department. William
Nicholls of Capital Spreads says: “This is not only good news for consumers, this is
also a welcome development for equity investors, as continuing fiscal stimulus will
keep allowing the companies they are invested in to prosper - the market has rallied as
a result.”[5] All the news above indicates that these countries are undergoing a slow
recovery from the financial crisis, the prospect for Lenovo in these regions are quite
optimistic.
2.2.3 Social Environment:
The social environment is generally the same worldwide. With the pace of life
increasingly quicker, telecommunication devices is becoming more and more
common day by day. Personal computers, which were regarded as luxuries decades
8](https://image.slidesharecdn.com/15b5ae20-afc8-446e-bbf8-93d7f44978e6-160225003350/85/Analysis-on-Whether-to-Keep-Holding-Lenovo-s-Equity-11-320.jpg)
![reform is eye-catching. For instance, in 2010, strategic products like LePhone,
Skylight, ideapad U160, were launched in china and met with positive comments.
Generously speaking, the whole world encourages technological development.
Furthermore, as China is the most important market for Lenovo and now it has
been concerning on emerging markets such as India and Brazil, and prospects of its
technological growth are promising. In the field of information application in these
countries, Lenovo has full room for improvement and competition in the markets is
less fierce than in developed countries like the United States.
Last but not least, there is no denying that the dominant position of traditional
super powers in the electronic industry has been trembled. In recent years, with the
prevalence of smartphones and tablets, the rapid rise of the Apple IOS and the
Android systems, the wintel alliance formed by Windows and Intel is confronted with
challenges. The brand-new pattern in the sector is taking shape. Therefore, it makes
sense that Lenovo bought back its smartphone and tablet division in 2009 and makes
great effort in the aspect. Most importantly, the emphasis on property rights protection
nowadays is good to the whole industry.
2.3 Michael Porter's Five Forces Model:
2.3.1 Bargaining Power of Suppliers:
The suppliers’ bargaining power in this market is relatively low because there are
many suppliers and the products that they provide, such as electronic components,
have little differentiation.[6] The fact that Lenovo’s products are not strictly restricted
by suppliers indicates that the suppliers don’t have much power in bargaining. What’s
more, Lenovo itself has several industrial bases so it also has the ability to
manufacture raw material, which means that the constraints on selecting suppliers are
not very large. Lenovo emphasizes on the cost performance, expansion ability and
10](https://image.slidesharecdn.com/15b5ae20-afc8-446e-bbf8-93d7f44978e6-160225003350/85/Analysis-on-Whether-to-Keep-Holding-Lenovo-s-Equity-13-320.jpg)
![holds the largest market share. It also takes the first places in global emerging
markets such as India and Russia and has a significantly growing market share in
mature and critical markets, for example, Japan, America and Germany. Lenovo
shows tremendous capability for improvement.
- Competency in mergers and acquisitions. Lenovo has been continuously
acquiring firms to bring patents, new capabilities, assets and skills to the company.
[7] Most importantly, through successful acquisitions and joint ventures, Lenovo
accessed new markets and distribution networks. For example, through the
acquisition of IBM in 2004, Lenovo got some sales channels in the international
market and IBM’s technology, which improved its own brand image. In 2007,
Lenovo announced to stop using the brand “IBM”, only keeping the enterprise
brand “Lenovo” and two product brand “Think” and “Idea”. The double-brand
strategy diversifies Lenovo’s products in the international market.
- Vertical integration. Lenovo’s strategy to vertically integrate let the company to
keep costs low, keep up with the pace, control inventory and rely less on original
equipment manufacturers (OEM). Lenovo manufactures nearly half of its
hardware and has set up production plants in low cost regions such as China,
Brazil and Argentina to benefit from higher margins. It is also able to manufacture
low cost products that are price competitive.
- Understanding of the Chinese market. Lenovo has emerged in China and
continues to be one of the largest players in homeland market. With the experience
of operating more than two decade years in China, Lenovo knows the Chinese
market very much and has the ability to suit Chinese tastes, which results for the
wide acceptance and support for the business' products.
- New idea in employee training. A concept called “Fupan” was emphasized by
15](https://image.slidesharecdn.com/15b5ae20-afc8-446e-bbf8-93d7f44978e6-160225003350/85/Analysis-on-Whether-to-Keep-Holding-Lenovo-s-Equity-18-320.jpg)
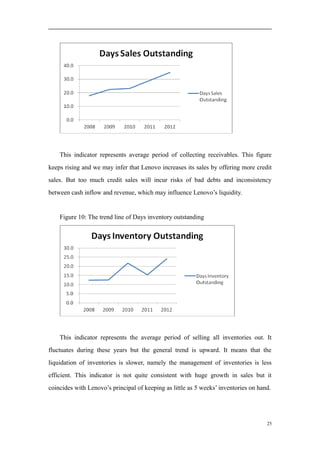
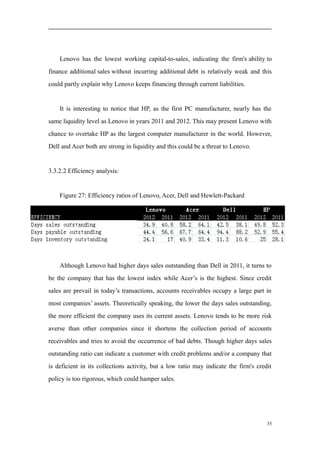
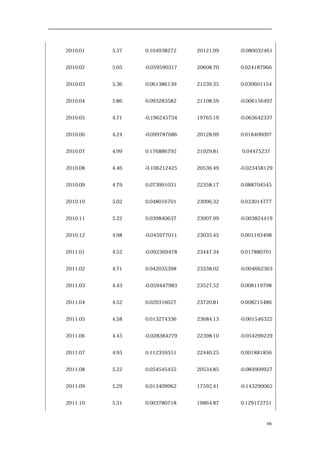
![Figure 11: The trend line of Days payables outstanding
Days payables outstanding represents the average period of making full payments
to its creditors. The indicator fluctuates sharply but show downward trend generally.
Lenovo is rated as AAA by Joint Credit in 2012.[8] For a powerful firm like Lenovo,
the ability to extend payment period is also kind of short-term financing. Thus the
larger this indicator is the better.
Figure 12: The trend analysis of total asset turnover
Although sales increase dramatically, total asset turnover decreases a lot. This
indicates that the production efficiency and usage of assets are not efficient.
Considering that the expansion strategy of Lenovo includes purchasing more assets or
equipments, the decrease is quite acceptable. But Lenovo need to pay more attention
to asset management.
26](https://image.slidesharecdn.com/15b5ae20-afc8-446e-bbf8-93d7f44978e6-160225003350/85/Analysis-on-Whether-to-Keep-Holding-Lenovo-s-Equity-29-320.jpg)
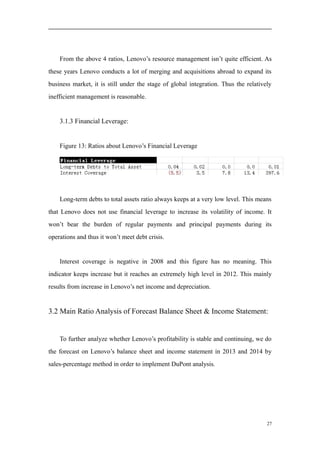
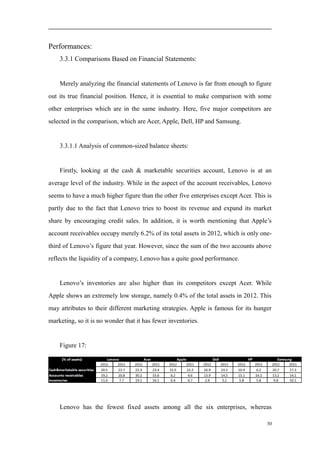
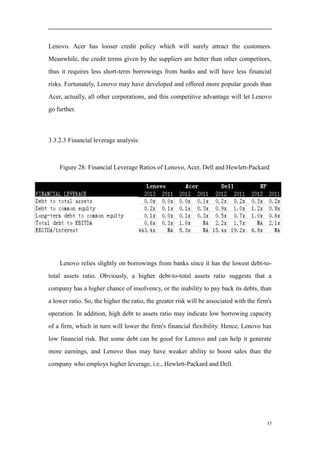
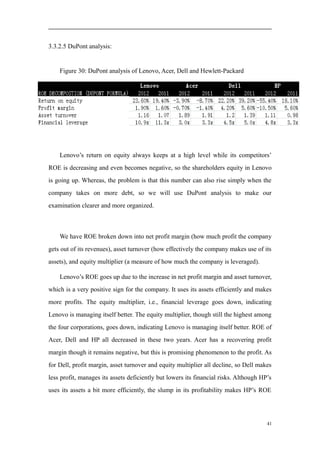
![Personal computer companies have a debt/equity of under 0.5[9], then all these
four companies have appropriate debt level. The low debt- and long-term debt-to-
common equity ratios of Lenovo both give us the idea that Lenovo has been
conservative in financing its growth with debts like Acer, compared to the aggressive
borrowing strategy of HP and Dell. As a result, the net profit of Lenovo will not be
influenced so greatly as other competitors’. In fact, if a lot of debt is used to finance
increased operations (high debt to equity), the company could potentially generate
more earnings than it would have. If this were to increase earnings by a greater
amount than the debt cost (interest), then the shareholders benefit as more earnings
are being spread among the same amount of shareholders. However, the cost of this
debt financing may outweigh the return that the company generates on the debt
through investment and business activities and become too much for the company to
handle. This can lead to bankruptcy, which would leave shareholders with nothing.
Consequently, Lenovo could use a little higher financial leverage than what it is now
but such leverage should fall in average industry range.
Furthermore, the amount of required interest expenses from Lenovo is rather
small because of Lenovo’s few borrowings from banks, and therefore Lenovo has the
highest interest coverage rate. Seen from the financial statements, Acer experienced
losses in 2011 and 2012 and HP in 2012, while Lenovo had negative interest expenses
in 2011 and HP in both 2011 and 2012, so sometimes the EBIT/Interest and
EBITDA/Interest is not possible to be calculated.
From the above analysis, we can conclude that Lenovo and Acer have similar
capital structures. They tend to use less bank loans and have low financial leverage
and risks. By contrast, Dell and Hewlett-Packard rely more on borrowings, involving
more risks but higher profit in good economic condition than Lenovo.
38](https://image.slidesharecdn.com/15b5ae20-afc8-446e-bbf8-93d7f44978e6-160225003350/85/Analysis-on-Whether-to-Keep-Holding-Lenovo-s-Equity-41-320.jpg)
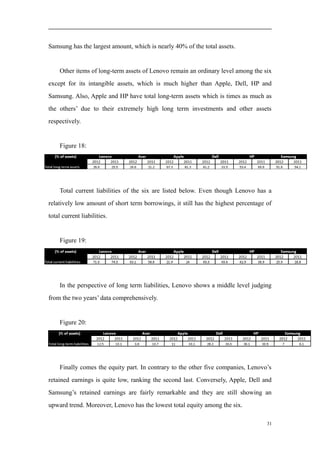
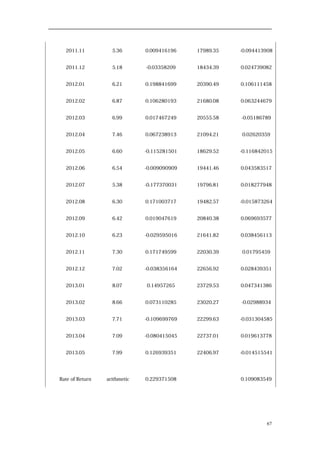
![3.3.2.4 Growth analysis:
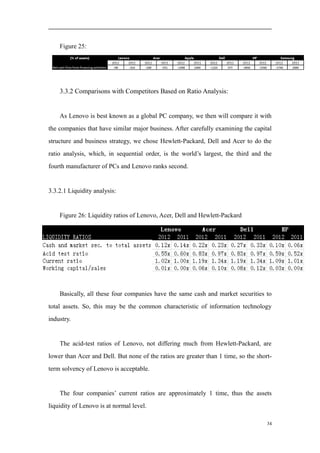
Figure 29: Liquidity ratios of Lenovo, Acer, Dell and Hewlett-Packard
Lenovo, though suffered a downward trend in sales growth speed, has an absolute
advantage in sales growth, operating income growth as well as net income growth
over other selected competitors. While it is clear that the sales volume of Acer, Dell
and Hewlett-Packard is declining in recent two years. So, why is the case.
Acer has suffered losses since 2010. Wang Zentang, the chairman of Acer, has
always believed that the importance of P and NB were higher than that of mobile
phone and tablets. He didn’t catch the change trend of market direction, thus resulting
in the poor strain capacity with the rise of Apple and Samsung. Acer then hardly had
competitive products in smartphone and tablet industry. What’s more, Wang insisted
on supporting all products produced by Microsoft only without the expectation that
Android and IOS would beat Microsoft, which turned out to be a rout in almost all
product lines and a disaster to its operation. Fortunately, Acer successively became
one of the top-tier London Olympics sponsors and senior partners of The Olympic
Games in 2012, turning the table and having a slower pace of declines at last.
Dell performed well in 2011 but after missing out the smartphone trend, its
revenue and profit growth slumped dramatically. Dell’s announcement that it doesn’t
want, or can’t get, a slice of the smartphone market[10] stands out as a surprise at that
time since people were being told that the PC market was shrinking, Android’s market
39](https://image.slidesharecdn.com/15b5ae20-afc8-446e-bbf8-93d7f44978e6-160225003350/85/Analysis-on-Whether-to-Keep-Holding-Lenovo-s-Equity-42-320.jpg)
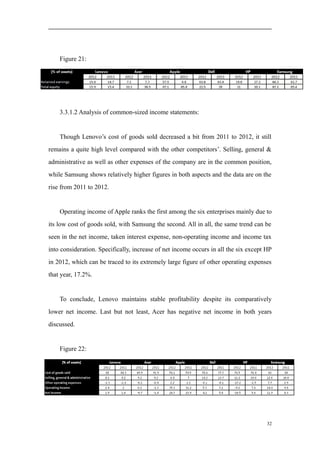
![share was growing, and the smartphone business had the potential to be worth $150
billion by 2014. According to the company’s VP of Global Operations, Jeff Clarke,
Dell had no plans to re-enter the market in the near future either, thinking it needs a
lot of investments to really be successful in smartphone industry. Then in November,
analysts figured its revenues fell by 26-percent and its share of the business dropped
by 6-percent too[10].
HP’s growth declined sharply after a series of missteps since 2010. First, it hasn’t
grown its own leaders, all but Cathie Lesjak, the CFO who filled in as interim CEO,
have come from outside the company. Second, Carly Fiorina attempted to ditch HP’s
stodgy but hardworking and open culture, setting it on the path toward becoming a
slave to the supply chain rather than a company obsessed with invention,”
Businessweek’s reporters write. Meanwhile, the boardroom leaks to reporters became
a massive scandal that showed how dysfunctional HP’s leadership had become. Third,
Hurd’s cost-cutting, even though save the company from heavy loss, became almost
maniacal. He insisted on inexplicable cost-saving measures, like turning the lights off
at 6 p.m. at some facilities to save on electric bills so employees couldn’t work late,
Fortune previously reported. Fourth, Even the President of the United States only gets
four years to do big things.[11] Yet Meg Whitman wants five years but spent her first
year announcing one horrible bit of news after another. Fifth, HP has a mobile
strategy in shambles. Whitman has said that HP needs to create its own smartphone,
but it won’t be happening in 2013 since it can’t lose billions getting into the
business[12].
Lenovo has nearly seized every opportunity in recent years and had comparably
better strategies, so chances are that it be the largest PC manufacturer in the world in
the near future.
40](https://image.slidesharecdn.com/15b5ae20-afc8-446e-bbf8-93d7f44978e6-160225003350/85/Analysis-on-Whether-to-Keep-Holding-Lenovo-s-Equity-43-320.jpg)
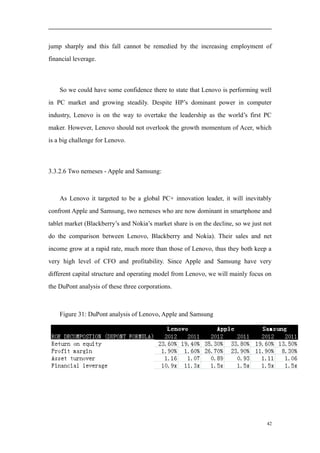
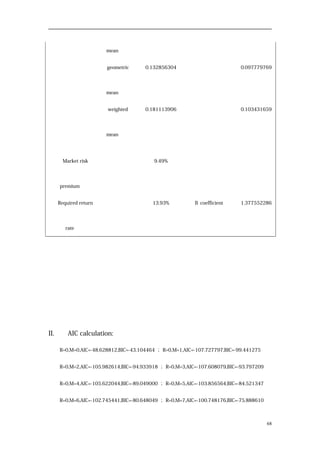
![As shown in the Figure 29, not surprisingly, Apple has the top ROE due to its
unique design, wide popularity and Steve Jobs sharp observations [13]. Apple’s profit
margin, if compared with other seven companies together, is also the top one. Apple is
so profitable that even there is a slight decline in its asset turnover, ROE still keeps
climbing. Apple hardly borrows any loans from banks because its CFO is affluent to
maintain the essential operations and expansions every year, then Apple’s leverage
keeps at a lower level than other competitors and relief itself of the debt crisis. All
these place great pressure on Lenovo
The ROE of Samsung falls below that of Lenovo. This seems to be optimistic for
Lenovo. However, Lenovo’s high ROE is due to its larger debts than Samsung and
Samsung’s profit margin is actually almost 10 times of Lenovo’s, which makes
Lenovo’s way to a leader in PC+ era rather tough. Meanwhile, Samsung’s income
expenses are always negative in 2011 and 2012 and this is a sign for the fast growth of
Samsung.
Faced with the strong advantages of Apple and Samsung and other unknown but
potential competitors, Lenovo therefore has to do more to realize its goal of being a
leader worldwide.
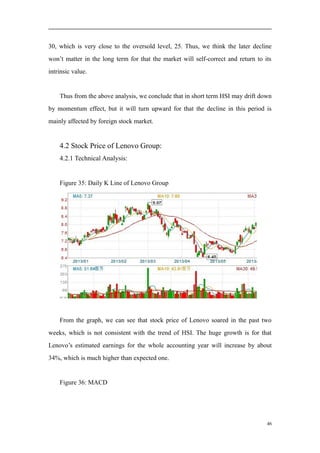
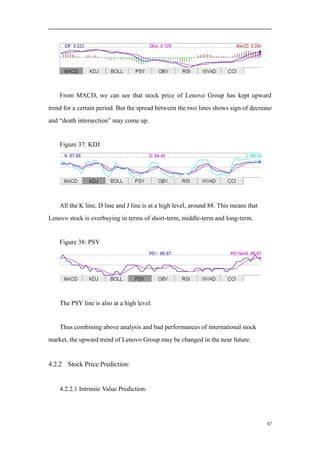
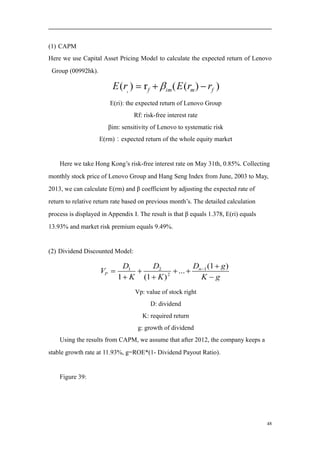
4. Stock Price Analysis & Forecast:
4.1 Hang Seng Index:
Hang Seng Index is the most authentic and representative index of Hong Kong
Stock Market. It is the benchmark of the Hong Kong stock market. What’s more, in
February, 2013, Lenovo was incorporated in the Hang Seng Composite Index.[14]
Thus we start the analysis of Lenovo’s stock price with the research in HSI’s future
43](https://image.slidesharecdn.com/15b5ae20-afc8-446e-bbf8-93d7f44978e6-160225003350/85/Analysis-on-Whether-to-Keep-Holding-Lenovo-s-Equity-46-320.jpg)


![6. Reference:
[1]: Lenovo’s Annual Report 2012/2013
[2]: Macro-economic Database of the People Net
http://hgsj.people.com.cn/index.php?cid=135&tid=62
Accessed on Nov.27, 2013
[3]: Yahoo Finance
http://finance.yahoo.com/q/bc?s=INRUSD=X&t=2y&l=on&z=m&q=l&c
Accessed on Nov.28, 2013
[4]: BBC News: Eurozone unemployment falls for first time since 2011
http://www.bbc.co.uk/news/business-25151974
Accessed on Nov.28,2013
[5]: BBC News: US prices fall 0.1% in October as petrol costs drop
http://www.bbc.co.uk/news/business-25018540
Accessed on Nov.29, 2013
[6]: UKESSAYS.com: Five forces driving competition
http://www.ukessays.com/essays/marketing/five-forces-driving-competition-
marketing-essay.php Accessed on Nov.29, 2013
[7]: Strategic Management Insight: SWOT analysis of Lenovo
60](https://image.slidesharecdn.com/15b5ae20-afc8-446e-bbf8-93d7f44978e6-160225003350/85/Analysis-on-Whether-to-Keep-Holding-Lenovo-s-Equity-63-320.jpg)
![http://www.strategicmanagementinsight.com/swot-analyses/lenovo-swot-
analysis.html Accessed on Nov.29, 2013
[8]: China Economy Network
http://finance.ce.cn/rolling/201211/29/t20121129_17020315.shtml
Accessed on Nov. 30, 2013
[9] Borowsk, A. (2010) Financial Management: The role and importance of
capital markets and EMH
[10] Boxall, A. (2012) Dell says goodbye to both smartphones and Android,
stops international sales
http://www.digitaltrends.com/mobile/dell-says-goodbye-to-both-
smartphones-and-android/ Accessed on November 29, 2013
[11] Fortune (2012) How Hewlett-Packard lost its way
http://tech.fortune.cnn.com/2012/05/08/500-hp-apotheker/
Accessed on November 29, 2013
[12] Bort, J. (2013) THE HP ROLLER COASTER: 5 big mistakes, 5 lucky breaks
in a disastrous decade Published by Business Insider
http://business.financialpost.com/2013/01/12/the-hp-roller-coaster-5-big-
mistakes-5-lucky-breaks-in-a-disastrous-decade/ Accessed on November 28,
2013
[13] Singh, S. (2012) What drives Apple’s success?
http://www.androidauthority.com/what-drives-apples-success-80438/
Accessed on November 29, 2013
[14]: ifeng technology:
61](https://image.slidesharecdn.com/15b5ae20-afc8-446e-bbf8-93d7f44978e6-160225003350/85/Analysis-on-Whether-to-Keep-Holding-Lenovo-s-Equity-64-320.jpg)


![Black Berry Vs. Apple Case 1[1]](https://cdn.slidesharecdn.com/ss_thumbnails/blackberryvs-applecase11-091113001854-phpapp01-thumbnail.jpg?width=640&height=640&fit=bounds)


