- Alexander's, Inc. filed a Form 10-Q with the SEC for the quarterly period ended June 30, 2015.
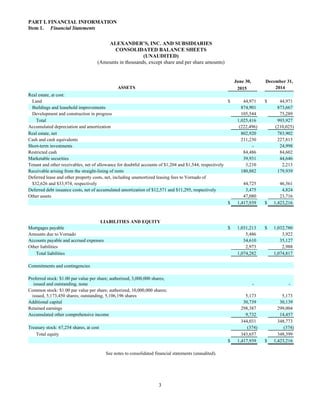
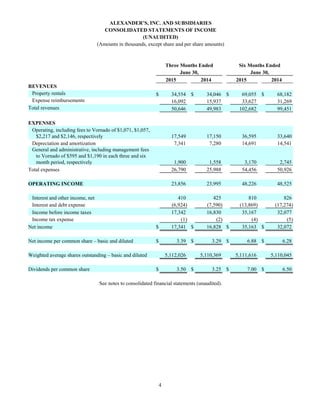
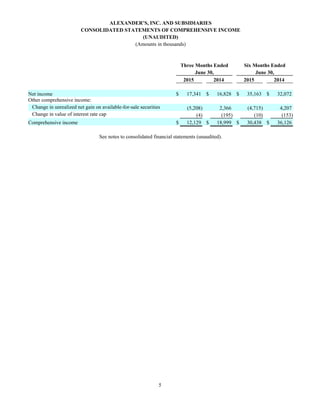
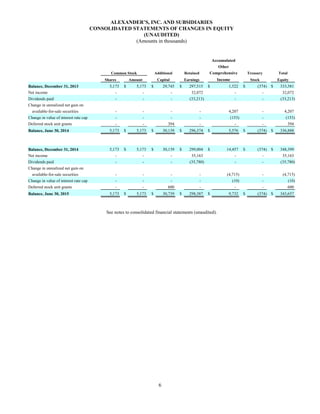
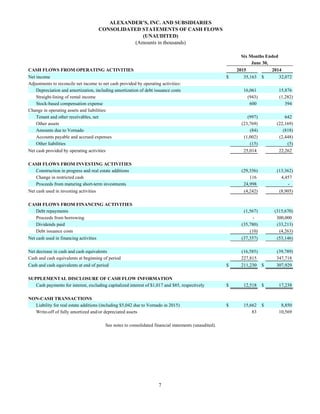
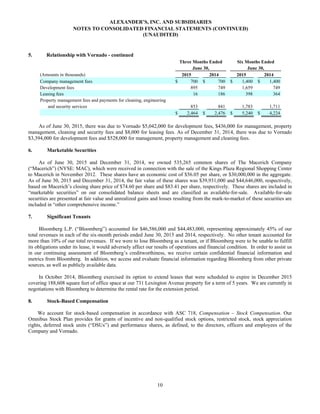
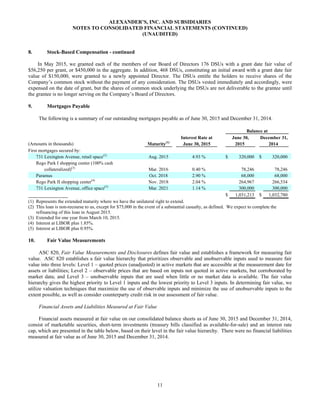
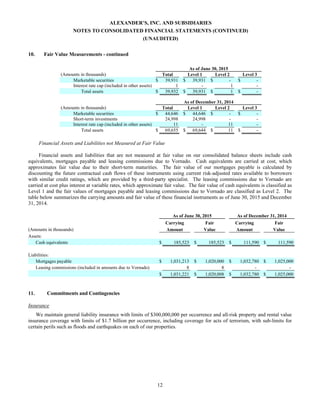
- The filing includes consolidated financial statements such as the balance sheet, income statement, and statement of cash flows.
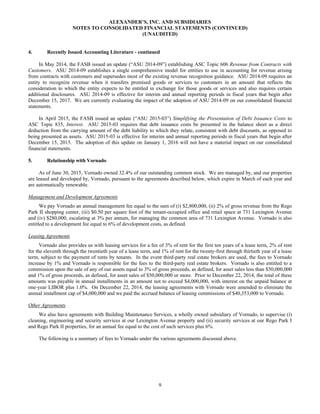
- It discloses that Alexander's had total revenues of $102.7 million for the first six months of 2015, with net income of $35.2 million.