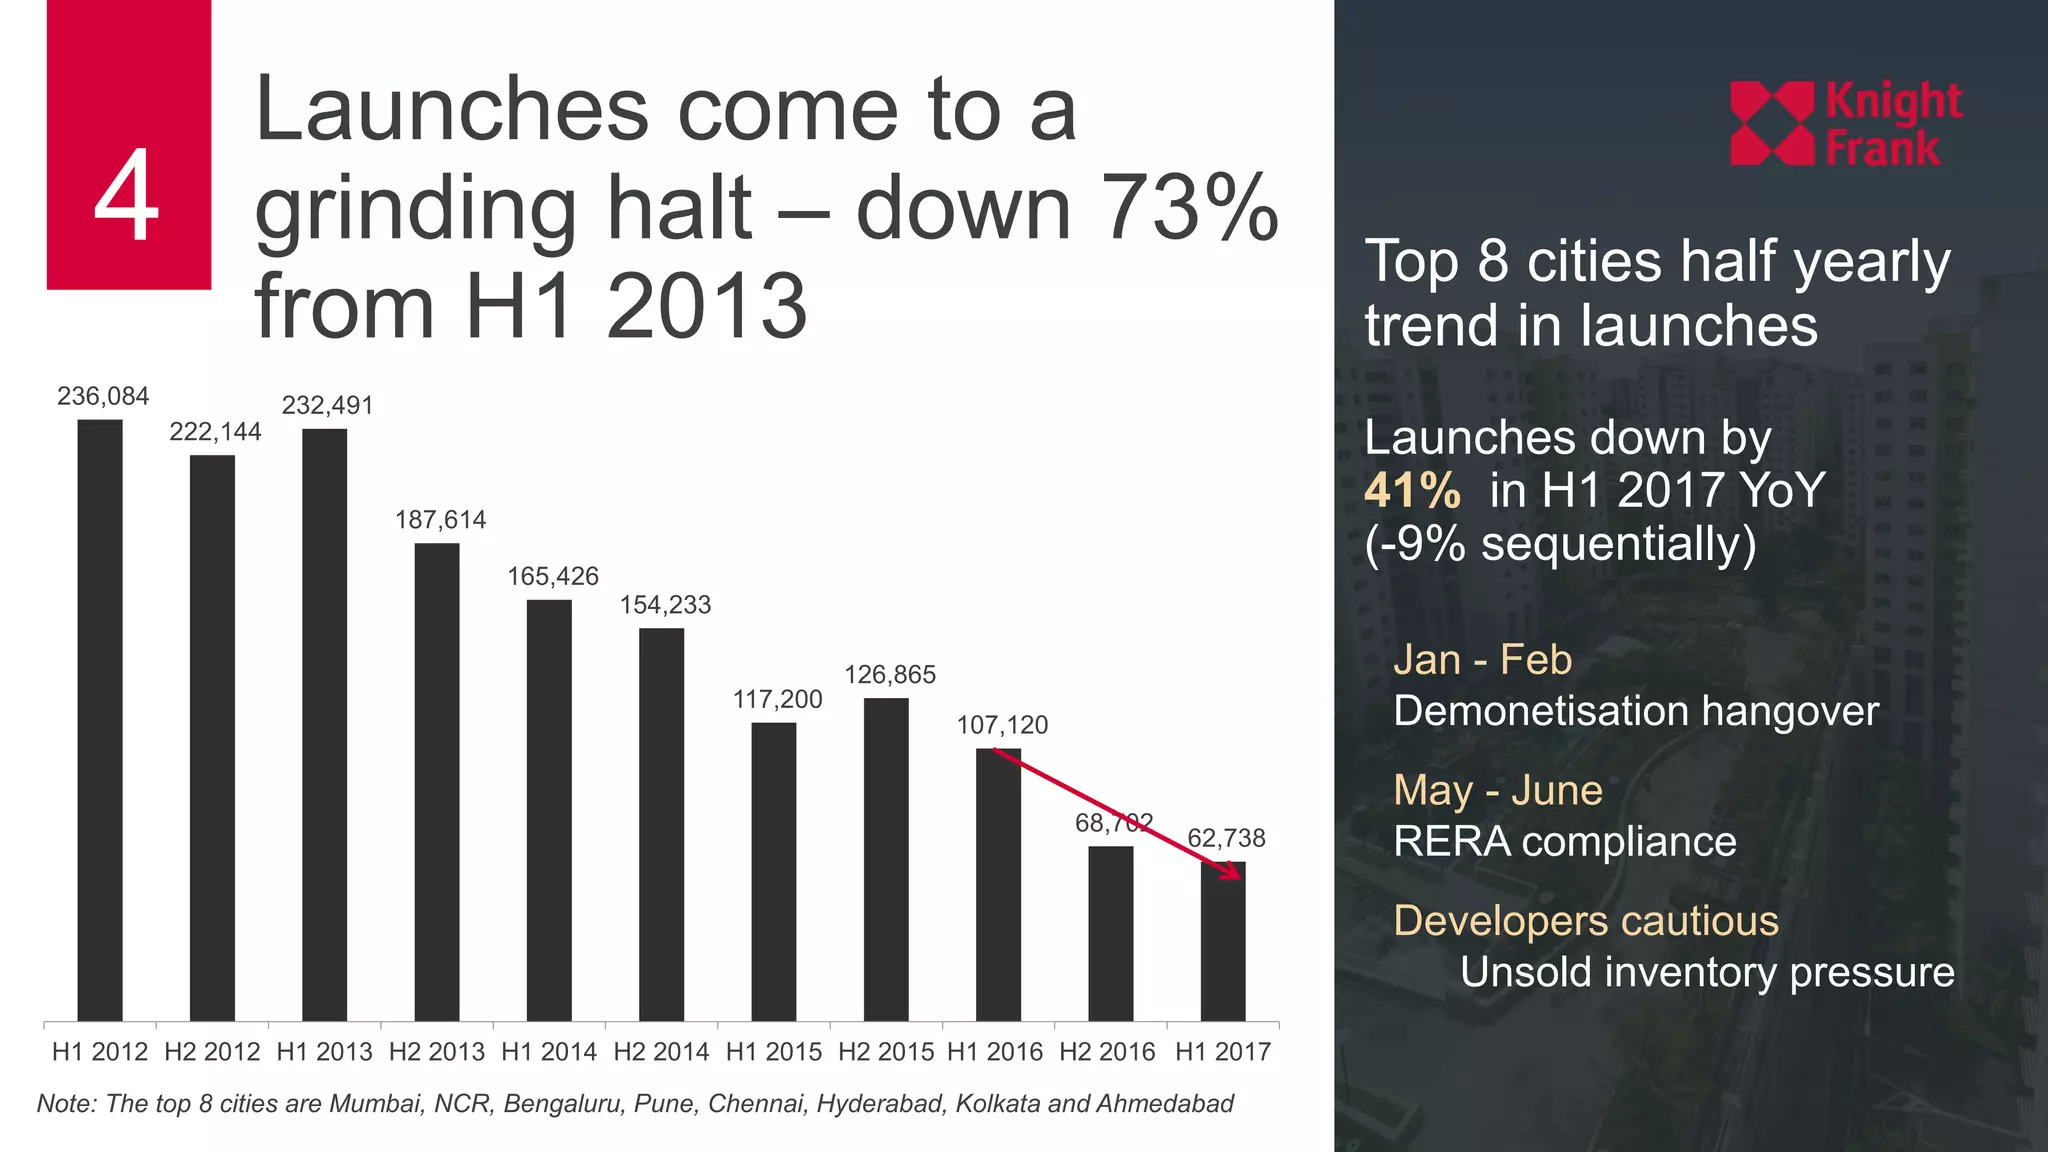
INDIA
REAL
ESTATE
JANUARY – JUNE 2017
1
RESIDENTIAL
RECAP 20162
2016 launches and sales
at a decadal low
• Demonetisation and its effects
KEY FINDINGS
RESIDENITAL H1 20173
Affordable housing
a structural change;
71% launches in
less than INR 50
lakh category vis a
vis 52% a year ago
Launches
crash
41% -
reach lowest
level in 7 years
596,044
unsold inventory
in top 8 cities–
17% drop from
peak of H2 2014
Sales down by
11% YoY –
lowest first-half
sales in the last
5 years
236,084
222,144
232,491
187,614
165,426
154,233
117,200
126,865
107,120
68,702
62,738
H1 2012 H2 2012 H1 2013 H2 2013 H1 2014 H2 2014 H1 2015 H2 2015 H1 2016 H2 2016 H1 2017
4
Jan - Feb
Demonetisation hangover
May - June
RERA compliance
Developers cautious
Unsold inventory pressure
Launches come to a
grinding halt – down 73%
from H1 2013
Note: The top 8 cities are Mumbai, NCR, Bengaluru, Pune, Chennai, Hyderabad, Kolkata and Ahmedabad
Top 8 cities half yearly
trend in launches
Launches down by
41% in H1 2017 YoY
(-9% sequentially)
5
NCR & Ahmedabad worst
hit in launches
24,450
17,462
24,281
8,713
5,815
5,700
11,891
8,809
9,740
9,273
13,395
11,300
4,800
5,900
9,093
5,200
15,763
4,800
14,026
7,905
6,035
2,571
9,764
1,874
Mumbai NCR Bengaluru Pune Chennai Hyderabad Kolkata Ahmedabad
Numberofunits
H1 2016 H2 2016 H1 2017
City-wise half-yearly
launches
Ahmedabad and NCR
down 79% and 73% YoY
respectively
Chennai out of slumber,
increases 4% YoY
Sequentially, Mumbai picks up
close to 62% albeit lower by
36% YoY
6
Resurrection of affordable
housing Top 8 cities ticket-size
split of launches
Affordable housing a structural
change with commensurate
supply side response
A significant chunk of new
launches below INR 50 lakh –
71% vis-a-vis 52%
H1 2016 H2 2016 H1 2017
<2.5 mn 17% 20% 36%
2.5-5 mn 35% 39% 35%
5-7.5 mn 22% 20% 14%
7.5-10 mn 10% 11% 6%
>10 mn 10% 6% 8%
>20 mn 6% 4% 1%
71%52%
7
NCR, Pune, Ahmedabad,
Kolkata drive affordable
housing revival
0%
20%
40%
60%
80%
100%
Mumbai NCR Bengaluru Pune Chennai Hyderabad Kolkata Ahmedabad
< Rs 2.5 mn Rs 2.5-5 mn Rs 5-7.5 mn Rs 7.5-10 mn Rs 10-20 mn > Rs 20 mn
Ticket-size split of
launched units in
H1 2017
Around 80% of launches in
NCR, Pune, Ahmedabad and
Kolkata in the sub INR 50 lakh
category
8
Sales not as badly hit as
launches YoY
139,295 140,527
126,616
141,341
135,016
109,158
120,755
-
20,000
40,000
60,000
80,000
100,000
120,000
140,000
160,000
180,000
H1 2014 H2 2014 H1 2015 H2 2015 H1 2016 H2 2016 H1 2017
Numberofunits
Note: The top 8 cities are Mumbai, NCR, Bengaluru, Pune, Chennai, Hyderabad, Kolkata and Ahmedabad
Top 8 cities half yearly
trend in sales
Sales down by 11% YoY but up
sequentially by same margin post
demonetisation
•Government thrust towards
affordable housing
•Freebies and discounts whip
up sales of ready inventory
•Sentiments among buyers up
owing to RERA
9
Sequentially, sales in all
cities have improved
City-wise half-yearly
sales
NCR and Kolkata most hit,
down 26% and 22% YoY
respectively
Pune, Chennai and Hyderabad
witness growth YoY
34,971
23,092
26,220
15,688
8,450
7,700
10,339
8,556
25,403
16,913
20,309
16,800
7,737
7,289
7,308
7,400
32,077
17,188
21,210
17,480
8,850
7,901
8,109
7,941
Mumbai NCR Bengaluru Pune Chennai Hyderabad Kolkata Ahmedabad
H1 2016 H2 2016 H1 2017
10
Time correction already
happened
Residential price index
Across 8 cities, residential price
index lower than Consumer
Price Index (CPI)
95
100
105
110
115
120
125
130
Indexvalue(Q12013=100)
CPI Mumbai NCR Bengaluru Pune
Chennai Hyderabad Kolkata Ahmedabad
11
Pan India unsold inventory
lowest in the last 4 years
Trend of all India unsold
inventory and QTS
Unwinding of unsold inventory
from drastic fall in launches
Less than 3 years required to
offload existing unsold inventory
7.4
8.2
9.0
10.1
11.3 11.5 11.3 11.3 11.3
520,000
540,000
560,000
580,000
600,000
620,000
640,000
660,000
680,000
700,000
720,000
740,000
-
2.0
4.0
6.0
8.0
10.0
12.0
14.0
H1 2013 H2 2013 H1 2014 H2 2014 H1 2015 H2 2015 H1 2016 H2 2016 H1 2017
Unsoldinventory(no.ofunits)
QTS
Unsold inventory (RHS) QTS
12
NCR the worst market –
over 4 year inventory
Inter-city comparison
on unsold inventory
Smaller metros like Pune and
Hyderabad have relatively less
inventory pressure
Unsold units Quarters-to-sell
Mumbai 138,653 8.8
NCR 180,370 17.8
Bengaluru 114,064 10.0
Pune 40,141 4.5
Chennai 28,110 6.6
Hyderabad 22,658 5.9
Kolkata 39,114 10.6
Ahmedabad 32,934 7.7
Top 8 cities 596,044
13
Affordable housing comes to rescue
of the beleaguered real estate sector
Lowest first-half sales and launches
in the last 5 years
SUMMARY
OFFICE
RECAP 201614
2016 office transactions at
40.6 mn sq ft at par with
2015, the highest since 2009
KEY FINDINGS
H1 201715
Co-working
operators show
traction with
around half a
million sq ft taken
up across
Bengaluru, Pune
and NCR
Transactions
down 10% YoY
in H1 2017, new
completions
lower by 5%
At 12%, vacancy
levels at the lowest
since 2012 when it
was 21%
Industry headwinds,
supply crunch affect
IT sector
transactions; share
down to 39% vis-
à-vis 43% a year ago
17.9
20.7
17.9
23.2
20.2 20.6
18.1
0
5
10
15
20
25
H1 2014 H2 2014 H1 2015 H2 2015 H1 2016 H2 2016 H1 2017
mnsqft
16
Transactions decline 10% YoY
in H1 2017
Most cities face a supply
crunch for the country’s
largest occupier – IT/ ITeS
Transactions decline 10%
YoY
Note: The top 6 cities are Mumbai, NCR, Bengaluru, Pune, Chennai and Hyderabad
Top 6 cities ha
trend of transa
17
Top 6 cities half yearly
trend of new completions
In H1 2017, new completions
lower by 5%
Developer inclination towards
residential segment over the
last few years a major cause
17.1
19.5
15.7
18.7 19.0
10.1
17.9
0
5
10
15
20
25
H1 2014 H2 2014 H1 2015 H2 2015 H1 2016 H2 2016 H1 2017
mnsqft
18
Top 6 cities half-yearly
trend of vacancy level
At 12%, vacancy levels at the
lowest level since 2012 when it
was 21%
18.5%
17.5%
16.7%
15.6%
15.1%
13.3%
12.4%
12%
14%
16%
18%
20%
0
5
10
15
20
25
H1 2014 H2 2014 H1 2015 H2 2015 H1 2016 H2 2016 H1 2017
mnsqft
19 City wise trend
Except Mumbai and NCR, other
cities facing low vacancy level
Even prime locations in NCR
and Mumbai are in single digit
All cities except Mumbai had
lower completion compared to
demand
21.9%
17.7%
3.8%
7.9%
10.8%
9.0%
0%
5%
10%
15%
20%
25%
0
1
2
3
4
5
6
7
8
9
Mumbai NCR Bengaluru Pune Chennai Hyderabad
mnsqft
New completions Transactions Vacancy (RHS)
20
Industry-wise transaction
split
IT sector, the backbone of
Indian office market, facing
business challenges
IT industry headwinds, share
down to 39% vis-a-vis 43% a
year ago
Co-working operators show
traction with around 0.5 mn sq ft
taken up across Bengaluru,
Pune and NCR
H1 2016 H2 2016 H1 2017
BFSI 12% 13% 12%
IT/ITeS 43% 49% 39%
Manufacturing 16% 17% 18%
Other Services 29% 21% 31%
21
Industry headwinds, dearth of
relevant supply affect India’s largest
occupier – IT/ITeS
Vacancy lowest since GFC
SUMMARY
22
A slew of the most disruptive reforms in independent
India became a reality in a span of a few months.
Described by many as the Brahmastras against black
economy in an unorganised industry, demonetisation,
RERA, the Benami Prohibition Act and the recently
rolled out GST have time and again pushed the already
sluggish market to the brink. But we believe that these
were corrective measures long due to transform real
estate into a robust, transparent and thriving sector.
The short-term hiccups grappling the industry would
eventually fade away and bear rich dividends in the
future.
Shishir Baijal, Chairman & Managing Director
“
”
INDIA
REAL
ESTATE
JANUARY – JUNE 2017
23
This report is published for general information only and not to be relied upon in anyway. Although high standards have been used in the
preparation of the information analysis, views and projections presented in the report, no responsibility or liability whatsoever can be accepted
by Knight Frank for any loss or damage resultant from any use of, reliance on or reference to the contents of this document.
As a general report this material does not necessarily represent the view of Knight Frank in relation to particular properties or projects.
Reproduction of this report in whole or in part is not allowed without prior written approval of Knight Frank to the form and content within
which it appears.

All India Real Estate Report H1 2017 Presentation

  • 1.
  • 2.
    RESIDENTIAL RECAP 20162 2016 launchesand sales at a decadal low • Demonetisation and its effects
  • 3.
    KEY FINDINGS RESIDENITAL H120173 Affordable housing a structural change; 71% launches in less than INR 50 lakh category vis a vis 52% a year ago Launches crash 41% - reach lowest level in 7 years 596,044 unsold inventory in top 8 cities– 17% drop from peak of H2 2014 Sales down by 11% YoY – lowest first-half sales in the last 5 years
  • 4.
    236,084 222,144 232,491 187,614 165,426 154,233 117,200 126,865 107,120 68,702 62,738 H1 2012 H22012 H1 2013 H2 2013 H1 2014 H2 2014 H1 2015 H2 2015 H1 2016 H2 2016 H1 2017 4 Jan - Feb Demonetisation hangover May - June RERA compliance Developers cautious Unsold inventory pressure Launches come to a grinding halt – down 73% from H1 2013 Note: The top 8 cities are Mumbai, NCR, Bengaluru, Pune, Chennai, Hyderabad, Kolkata and Ahmedabad Top 8 cities half yearly trend in launches Launches down by 41% in H1 2017 YoY (-9% sequentially)
  • 5.
    5 NCR & Ahmedabadworst hit in launches 24,450 17,462 24,281 8,713 5,815 5,700 11,891 8,809 9,740 9,273 13,395 11,300 4,800 5,900 9,093 5,200 15,763 4,800 14,026 7,905 6,035 2,571 9,764 1,874 Mumbai NCR Bengaluru Pune Chennai Hyderabad Kolkata Ahmedabad Numberofunits H1 2016 H2 2016 H1 2017 City-wise half-yearly launches Ahmedabad and NCR down 79% and 73% YoY respectively Chennai out of slumber, increases 4% YoY Sequentially, Mumbai picks up close to 62% albeit lower by 36% YoY
  • 6.
    6 Resurrection of affordable housingTop 8 cities ticket-size split of launches Affordable housing a structural change with commensurate supply side response A significant chunk of new launches below INR 50 lakh – 71% vis-a-vis 52% H1 2016 H2 2016 H1 2017 <2.5 mn 17% 20% 36% 2.5-5 mn 35% 39% 35% 5-7.5 mn 22% 20% 14% 7.5-10 mn 10% 11% 6% >10 mn 10% 6% 8% >20 mn 6% 4% 1% 71%52%
  • 7.
    7 NCR, Pune, Ahmedabad, Kolkatadrive affordable housing revival 0% 20% 40% 60% 80% 100% Mumbai NCR Bengaluru Pune Chennai Hyderabad Kolkata Ahmedabad < Rs 2.5 mn Rs 2.5-5 mn Rs 5-7.5 mn Rs 7.5-10 mn Rs 10-20 mn > Rs 20 mn Ticket-size split of launched units in H1 2017 Around 80% of launches in NCR, Pune, Ahmedabad and Kolkata in the sub INR 50 lakh category
  • 8.
    8 Sales not asbadly hit as launches YoY 139,295 140,527 126,616 141,341 135,016 109,158 120,755 - 20,000 40,000 60,000 80,000 100,000 120,000 140,000 160,000 180,000 H1 2014 H2 2014 H1 2015 H2 2015 H1 2016 H2 2016 H1 2017 Numberofunits Note: The top 8 cities are Mumbai, NCR, Bengaluru, Pune, Chennai, Hyderabad, Kolkata and Ahmedabad Top 8 cities half yearly trend in sales Sales down by 11% YoY but up sequentially by same margin post demonetisation •Government thrust towards affordable housing •Freebies and discounts whip up sales of ready inventory •Sentiments among buyers up owing to RERA
  • 9.
    9 Sequentially, sales inall cities have improved City-wise half-yearly sales NCR and Kolkata most hit, down 26% and 22% YoY respectively Pune, Chennai and Hyderabad witness growth YoY 34,971 23,092 26,220 15,688 8,450 7,700 10,339 8,556 25,403 16,913 20,309 16,800 7,737 7,289 7,308 7,400 32,077 17,188 21,210 17,480 8,850 7,901 8,109 7,941 Mumbai NCR Bengaluru Pune Chennai Hyderabad Kolkata Ahmedabad H1 2016 H2 2016 H1 2017
  • 10.
    10 Time correction already happened Residentialprice index Across 8 cities, residential price index lower than Consumer Price Index (CPI) 95 100 105 110 115 120 125 130 Indexvalue(Q12013=100) CPI Mumbai NCR Bengaluru Pune Chennai Hyderabad Kolkata Ahmedabad
  • 11.
    11 Pan India unsoldinventory lowest in the last 4 years Trend of all India unsold inventory and QTS Unwinding of unsold inventory from drastic fall in launches Less than 3 years required to offload existing unsold inventory 7.4 8.2 9.0 10.1 11.3 11.5 11.3 11.3 11.3 520,000 540,000 560,000 580,000 600,000 620,000 640,000 660,000 680,000 700,000 720,000 740,000 - 2.0 4.0 6.0 8.0 10.0 12.0 14.0 H1 2013 H2 2013 H1 2014 H2 2014 H1 2015 H2 2015 H1 2016 H2 2016 H1 2017 Unsoldinventory(no.ofunits) QTS Unsold inventory (RHS) QTS
  • 12.
    12 NCR the worstmarket – over 4 year inventory Inter-city comparison on unsold inventory Smaller metros like Pune and Hyderabad have relatively less inventory pressure Unsold units Quarters-to-sell Mumbai 138,653 8.8 NCR 180,370 17.8 Bengaluru 114,064 10.0 Pune 40,141 4.5 Chennai 28,110 6.6 Hyderabad 22,658 5.9 Kolkata 39,114 10.6 Ahmedabad 32,934 7.7 Top 8 cities 596,044
  • 13.
    13 Affordable housing comesto rescue of the beleaguered real estate sector Lowest first-half sales and launches in the last 5 years SUMMARY
  • 14.
    OFFICE RECAP 201614 2016 officetransactions at 40.6 mn sq ft at par with 2015, the highest since 2009
  • 15.
    KEY FINDINGS H1 201715 Co-working operatorsshow traction with around half a million sq ft taken up across Bengaluru, Pune and NCR Transactions down 10% YoY in H1 2017, new completions lower by 5% At 12%, vacancy levels at the lowest since 2012 when it was 21% Industry headwinds, supply crunch affect IT sector transactions; share down to 39% vis- à-vis 43% a year ago
  • 16.
    17.9 20.7 17.9 23.2 20.2 20.6 18.1 0 5 10 15 20 25 H1 2014H2 2014 H1 2015 H2 2015 H1 2016 H2 2016 H1 2017 mnsqft 16 Transactions decline 10% YoY in H1 2017 Most cities face a supply crunch for the country’s largest occupier – IT/ ITeS Transactions decline 10% YoY Note: The top 6 cities are Mumbai, NCR, Bengaluru, Pune, Chennai and Hyderabad Top 6 cities ha trend of transa
  • 17.
    17 Top 6 citieshalf yearly trend of new completions In H1 2017, new completions lower by 5% Developer inclination towards residential segment over the last few years a major cause 17.1 19.5 15.7 18.7 19.0 10.1 17.9 0 5 10 15 20 25 H1 2014 H2 2014 H1 2015 H2 2015 H1 2016 H2 2016 H1 2017 mnsqft
  • 18.
    18 Top 6 citieshalf-yearly trend of vacancy level At 12%, vacancy levels at the lowest level since 2012 when it was 21% 18.5% 17.5% 16.7% 15.6% 15.1% 13.3% 12.4% 12% 14% 16% 18% 20% 0 5 10 15 20 25 H1 2014 H2 2014 H1 2015 H2 2015 H1 2016 H2 2016 H1 2017 mnsqft
  • 19.
    19 City wisetrend Except Mumbai and NCR, other cities facing low vacancy level Even prime locations in NCR and Mumbai are in single digit All cities except Mumbai had lower completion compared to demand 21.9% 17.7% 3.8% 7.9% 10.8% 9.0% 0% 5% 10% 15% 20% 25% 0 1 2 3 4 5 6 7 8 9 Mumbai NCR Bengaluru Pune Chennai Hyderabad mnsqft New completions Transactions Vacancy (RHS)
  • 20.
    20 Industry-wise transaction split IT sector,the backbone of Indian office market, facing business challenges IT industry headwinds, share down to 39% vis-a-vis 43% a year ago Co-working operators show traction with around 0.5 mn sq ft taken up across Bengaluru, Pune and NCR H1 2016 H2 2016 H1 2017 BFSI 12% 13% 12% IT/ITeS 43% 49% 39% Manufacturing 16% 17% 18% Other Services 29% 21% 31%
  • 21.
    21 Industry headwinds, dearthof relevant supply affect India’s largest occupier – IT/ITeS Vacancy lowest since GFC SUMMARY
  • 22.
    22 A slew ofthe most disruptive reforms in independent India became a reality in a span of a few months. Described by many as the Brahmastras against black economy in an unorganised industry, demonetisation, RERA, the Benami Prohibition Act and the recently rolled out GST have time and again pushed the already sluggish market to the brink. But we believe that these were corrective measures long due to transform real estate into a robust, transparent and thriving sector. The short-term hiccups grappling the industry would eventually fade away and bear rich dividends in the future. Shishir Baijal, Chairman & Managing Director “ ”
  • 23.
    INDIA REAL ESTATE JANUARY – JUNE2017 23 This report is published for general information only and not to be relied upon in anyway. Although high standards have been used in the preparation of the information analysis, views and projections presented in the report, no responsibility or liability whatsoever can be accepted by Knight Frank for any loss or damage resultant from any use of, reliance on or reference to the contents of this document. As a general report this material does not necessarily represent the view of Knight Frank in relation to particular properties or projects. Reproduction of this report in whole or in part is not allowed without prior written approval of Knight Frank to the form and content within which it appears.