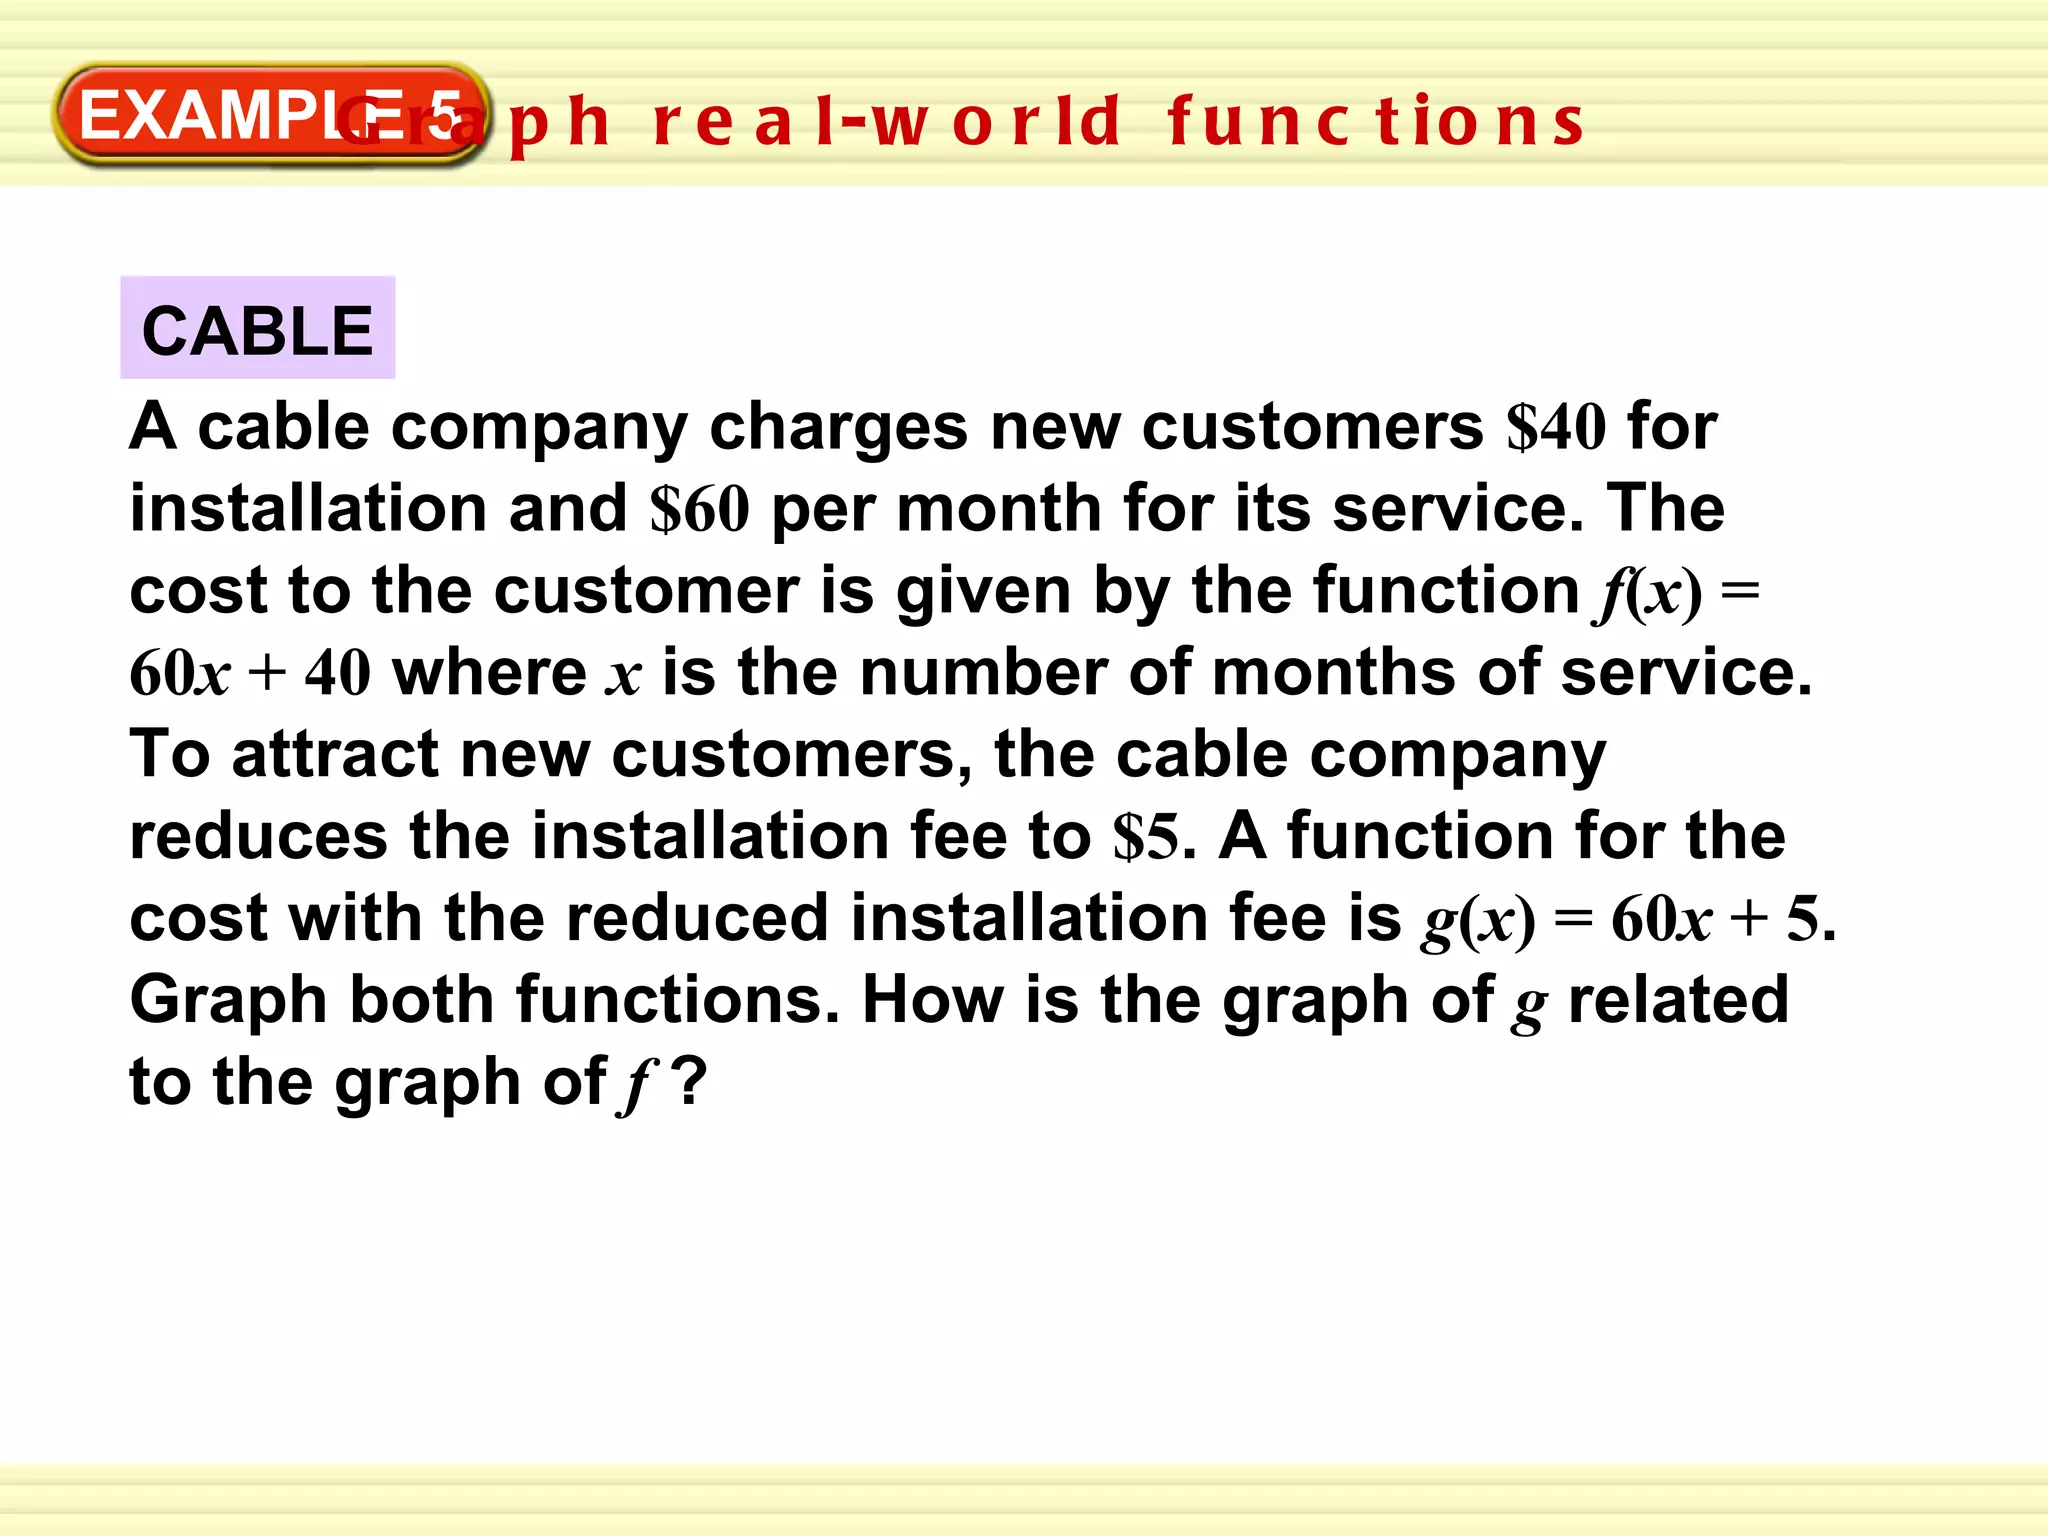
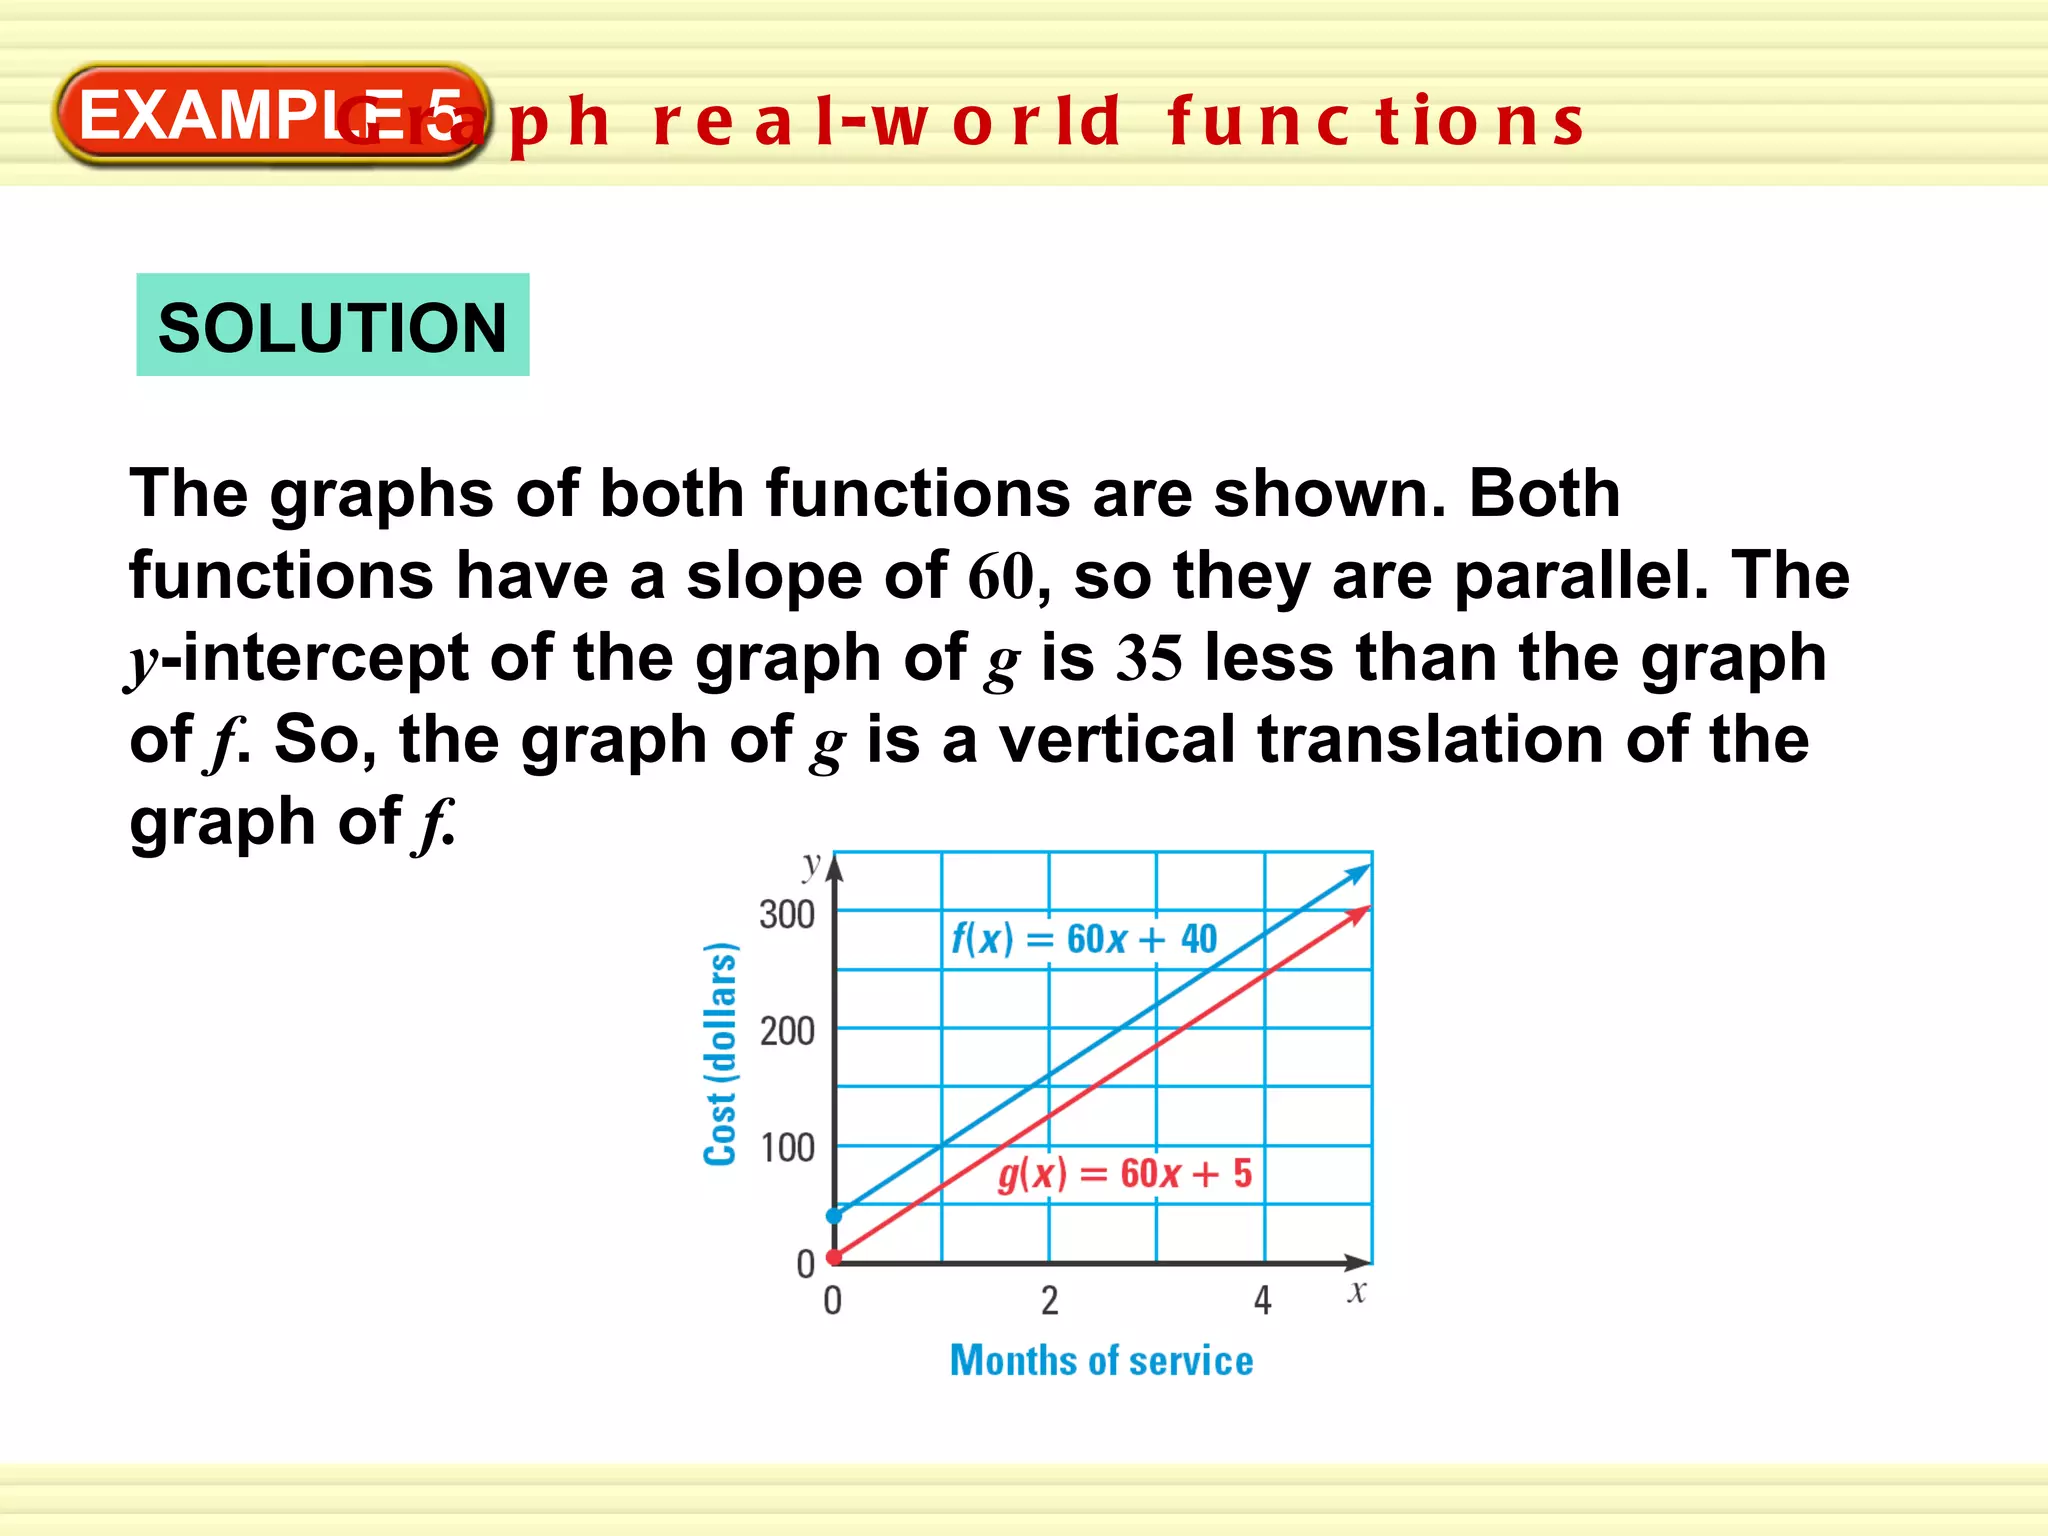
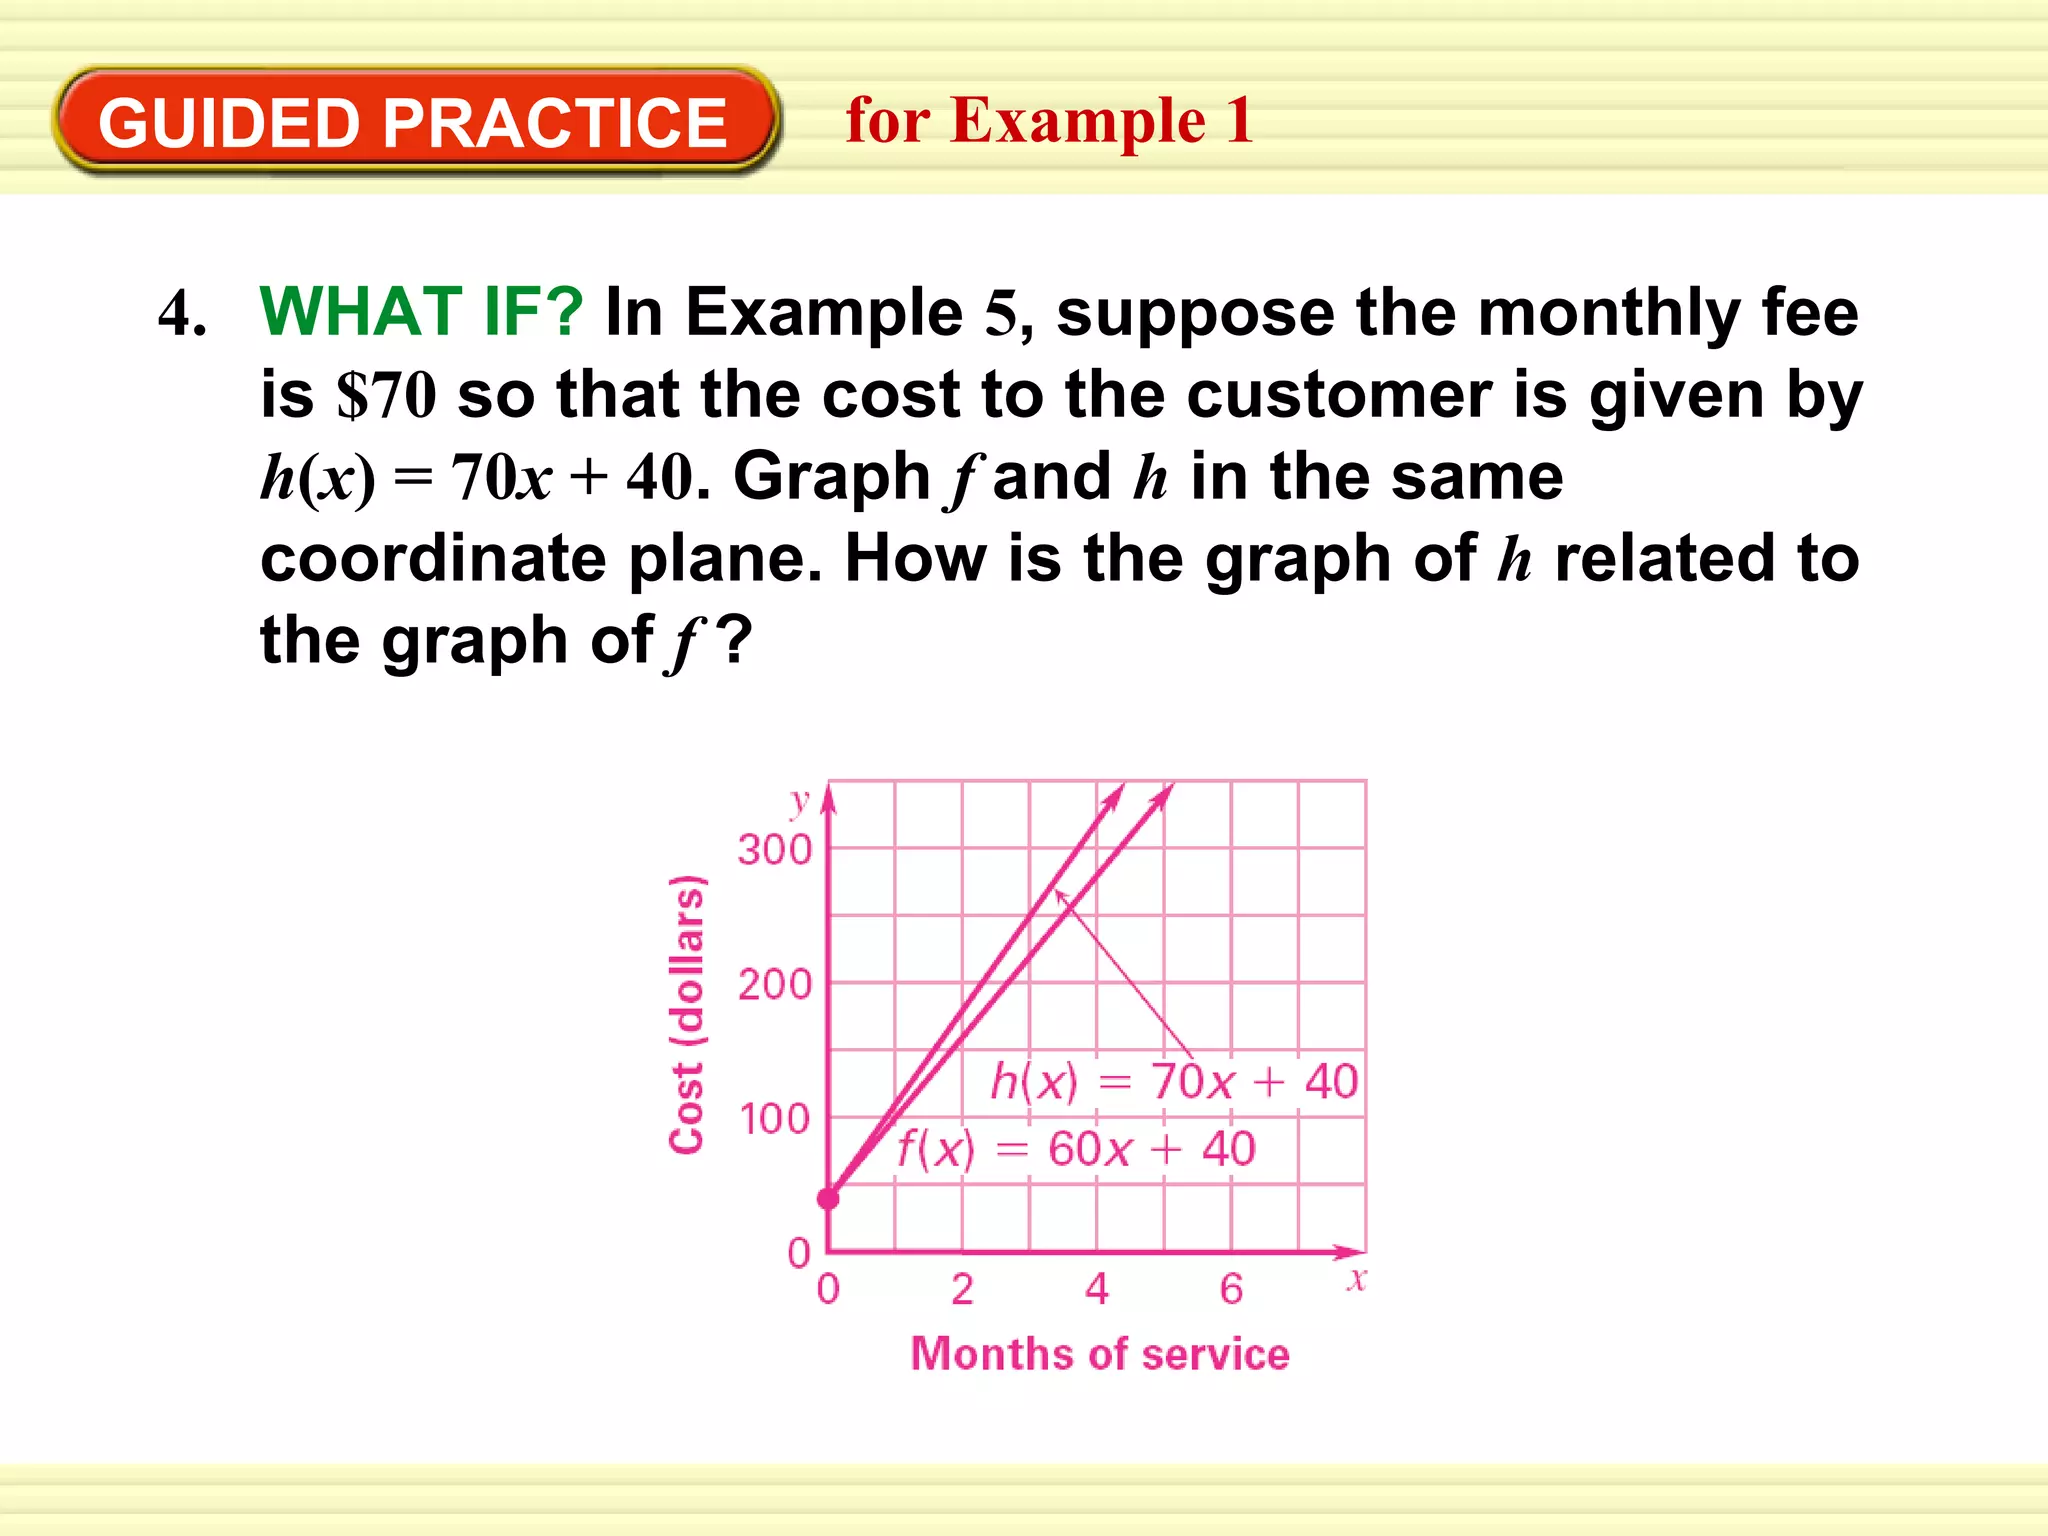
The document describes two functions that model the cost of cable service over time. Function f(x) = 60x + 40 models the original cost with a $40 installation fee and $60 monthly fee. Function g(x) = 60x + 5 models the reduced cost with a $5 installation fee. Both functions have a slope of 60, so their graphs are parallel lines. The y-intercept of g is 35 less than f, so g's graph is a vertical translation of f's graph. A third function h(x) = 70x + 40 with a $70 monthly fee is discussed. Its graph rises faster than f due to the greater slope, but they have the same y-intercept of 40.


![Inequalties Of Combined Functions2[1]](https://cdn.slidesharecdn.com/ss_thumbnails/inequaltiesofcombinedfunctions21-100108192449-phpapp02-thumbnail.jpg?width=640&height=640&fit=bounds)
![Inequalties Of Combined Functions2[1]](https://cdn.slidesharecdn.com/ss_thumbnails/inequaltiesofcombinedfunctions21-100112203423-phpapp02-thumbnail.jpg?width=640&height=640&fit=bounds)


![Coded Agents – with UiPath SDK + LangGraph [Virtual Hands-on Workshop]](https://cdn.slidesharecdn.com/ss_thumbnails/codedagentsdeck-251215155422-5497c599-thumbnail.jpg?width=640&height=640&fit=bounds)


