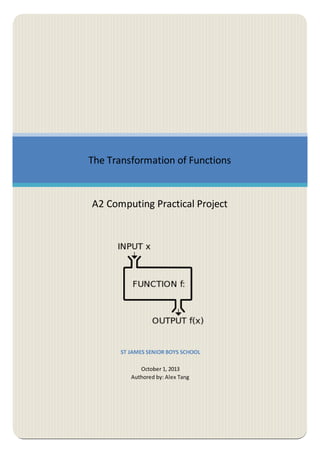
1. The Transformation of Functions
A2 Computing Practical Project
ST JAMES SENIOR BOYS SCHOOL
October 1, 2013
Authored by: Alex Tang
2. Alex Tang
1 | P a g e
CONTENTS
ANALYSIS ...................................................................................................1
EXPLANATION OF TERMINOLOGY INVOLVED.........................................................2
DEFINITIONS................................................................................................2
IDENTIFICATION OF THE PROBLEM.....................................................................7
DESCRIPTION OF THE CURRENT SYSTEM ..............................................................7
DATA FLOW DIAGRAM OF CURRENT SYSTEM ........................................................8
LEVEL 1 DATA FLOW DIAGRAM OF CURRENT SYSTEM .............................................8
INTERVIEW WITH CURRENT AS MATHS PUPILS..................................................... 9
USERS OF THE NEW SYSTEM ......................................................................... 11
USER NEEDS ..............................................................................................11
GENERAL OBJECTIVES...................................................................................11
OBJECTIVES FOR THE PROPOSED SYSTEM ..........................................................11
LIMITATIONS .............................................................................................12
DATA SOURCES, STORES AND DESTINATIONS FOR THE PROPOSED SYSTEM .................12
DATA VOLUMES .........................................................................................13
DATA FLOW DIAGRAM OF THE PROPOSED SYSTEM ............................................14
LEVEL 1 DATA FLOW DIAGRAM OF PROPOSED SYSTEM .........................................15
ANALYSIS DATA DICTIONARY ..........................................................................17
REALISTIC APPRAISAL OF THE FEASIBILITY OF POTENTIAL SOLUTIONS.......................18
PROGRAMMED IN DELPHI PASCAL ..................................................................18
FORMAL INTERVIEW WITH MR MCREADY .........................................................19
JUSTIFICATION OF THE CHOSEN SOLUTION ........................................................20
APPENDIX – C2/C3 SPEC .............................................................................21
3. Alex Tang
2 | P a g e
DESIGN.....................................................................................................22
OVERALL AIM OF THE PROJECT ......................................................................23
DESCRIPTION OF THE MODULAR STRUCTURE OF THE SYSTEM .................................23
SYSTEM FLOWCHARTS ..................................................................................27
DESIGN DATA DICTIONARY ...........................................................................31
VOLUMETRICS............................................................................................33
AMOUNT OF HARD DRIVE SPACE REQUIRED ...........................................................................33
IDENTIFICATION OF STORAGE MEDIA .....................................................................................33
HARDWARE SPECIFICATIONS................................................................................................33
IDENTIFICATION OF SUITABLE ALGORITHMS .......................................................34
USER INTERFACE DESIGN ..............................................................................45
SECURITY & INTEGRITY OF DATA .....................................................................47
SYSTEM SECURITY .......................................................................................47
TEST STRATEGY ..........................................................................................48
SYSTEM TESTING.......................................................................................49
DESIGN OF DETAILED TEST PLAN .....................................................................50
MINIMAL TEST DATA...................................................................................56
TEST EVALUATION.......................................................................................60
SYSTEM MAINTENANCE ............................................................................61
SYSTEM OVERVIEW .....................................................................................62
DETAILED ALGORITHM DESIGN ......................................................................64
PROCEDURE AND VARIABLE LISTING ................................................................78
ANNOTATED CODE LISTING............................................................................80
ANNOTATED DESIGN VIEWS...........................................................................97
USER MANUAL.........................................................................................99
INTRODUCTION ........................................................................................100
4. Alex Tang
3 | P a g e
INSTALLATION ..........................................................................................100
DETAILED SCREEN DISPLAYS.........................................................................101
STEP BY STEP GUIDANCE FOR USE..................................................................105
APPRAISAL .............................................................................................112
OBJECTIVES EVALUATED .............................................................................113
FURTHER DEVELOPMENT ............................................................................114
USER FEEDBACK........................................................................................116
USER FEEDBACK ANALYSIS...........................................................................118
APPENDIX AND BIBLIOGRAPHY ...............................................................119
BIBLIOGRAPHY .........................................................................................120
APPENDIX EVIDENCE .................................................................................121
FULL CODE WITH NO ANNOTATIONS ...............................................................136
6. Alex Tang
2 | P a g e
Explanation of terminology involved:
Being a maths based project, some terminology may be confusing. I will define the main
terms that I will be using throughout my coursework using definitions given to me by my
maths teacher.
Definitions:
Function - Given a binary relation Z on sets A and B, we say that the Z is a function if each
element of A is paired with at most one element of B. In this case we call A the domain set,
and we call B the range set.
F(x) – A function that applies a transformation to the value of x.
Exponential function - A function whose value is a constant raised to the power of the
argument, e.g. y = x^a.
Logarithmic function - The logarithm of a number is the exponent to which another fixed
value, the base, must be raised to produce that number, e.g. log10100 = 2.
Trigonometric function - The function of an angle expressed as a ratio of the length of the
sides of right-angled triangle containing the angle, e.g. Tan (σ) = ¾.
Transformation - A process by which one expression or function is converted into another
one of similar value.
Prior knowledge of this topic isn’t required to understand the project; however, I will
include some examples of graphs and their transformations on the next few pages. Please
note, these are just examples, the end program will be able to perform more
transformations.
7. Alex Tang
3 | P a g e
Transformations of the form: ‘ f(x) = x ‘
Transformations of the form: ‘ f(x) = x2 ‘
8. Alex Tang
4 | P a g e
Transformations of the form: ‘ f(x) = x3 ‘
Transformations of the form: ‘ f(x) = 1/x ‘
9. Alex Tang
5 | P a g e
Transformations of the form: ‘ f(x) = sin(x) ‘
Transformations of the form: ‘ f(x) = cos(x) ‘
10. Alex Tang
6 | P a g e
Transformations of the form: ‘ f(x) = cos(x) ‘
Transformations of the form: ‘ f(x) = ex ‘
11. Alex Tang
7 | P a g e
Example(s)/question
taken from maths
textbook
Verbal interactive
explanation/Autograph
diagram
Students copy/recieve
notes from Mr Mcready
Identification of the problem:
St James for Senior Boys requires all pupils to study maths up until year 11, where they have
the choice to pursue it into AS/A2 years. The maths department consists of 8 teachers, 5 of
which are focused on AS and 3 are focused on A2. It is clear that maths in our school is a
fundamental skill, that is why it is the largest department. Throughout the academic year,
we would be given printouts, past papers, syllabuses and notes, all which help us achieve
the best grades.
Studying maths, especially in year 12, I had learnt a lot about graphs and functions (mainly
from the Core 2 syllabus) as well as some trigonometry (Core 3) in year 13. The syllabus
states that examinees could be asked to sketch graphs or sometimes show intersections of
functions involving exponential functions, logarithmic functions and trigonometric
functions. Mr Mcready our teacher uses a software package called AutoGraph to visually
demonstrate the transformation/intersections of such graphs. The problem arises when we
are asked to sketch functions which consist of several transformations of such graphs for
homework or in exams. Since AutoGraph is not a free software package or readily available,
Mr Mcready approached me asking if I had any ideas on how to help the AS/A2 students
strengthen their knowledge of visually representing graphs without being dependant on him
in class.
Description of the current system:
Mr Mcready uses his own knowledge of the core syllabus, as well as the textbook to draw
diagrams of graphs, or in the case of more complex graphs, he uses AutoGraph. Autograph
is a CAD software package; it enables the user to type in a function of X which it then uses to
draw the graph. The graphs are always accurate and can be transformed by any means
necessary. When dealing with simple graphs, Mr Mcready draws them on the whiteboard,
but has before told us that they aren’t always 100% accurate, plus they are time-consuming
to draw. He would draw the untransformed graph of the function and do a step-by-step
explanation of each transformation taking place to form the overall function. In the rare
occasion, Mr Mcready will copy an example from the C3 textbook onto a hand-out and ask
us to learn through inspection. Pupils struggle with drawing functions, especially when
tackling homework involving functions as they have no means of checking their answers,
resulting in errors being carried forward. To summarise:
12. Alex Tang
8 | P a g e
Data flow diagram of current system:
Level 1 Data flow diagram of currentsystem:
13. Alex Tang
9 | P a g e
Interview with current AS maths pupils:
15. Alex Tang
11 | P a g e
Users of the new system:
Mr Mcready has access to more advanced CAD software, AutoGraph, henceforth I shall be
focusing on making the pupils the real end users. In both sixth form years, there are a total
of 28 doing single maths, with only 5 doing further maths. The application will be designed
to fulfil the needs of Mr Mcready, as well as the needs of the pupils focusing on AS/A2
maths.
Simplicity is the key; the program must be easy to use, interactive and clear so that the topic
of transformations of graphs can be easily understood. Mr Mcready should have a greater
understanding of the program; however, he won’t be using the software, just overseeing me
as I implement the desired topics to the software package.
User needs:
The software needs to be readily available, I have permission from my schools IT
department to supply my software when it is ready to each school computer. Furthermore,
all the maths pupils will be given a copy onto their USB drives to take home for use in
homework and revision.
The software will incorporate the required chapters from the C2/C3 textbooks, including
some further material found in C4. Mr Mcready would also like to incorporate some
examples as a sort of guidance for the pupils.
Taking into account the end users, the program will need some color along with some
explanations (pop up boxes) to give the users the opportunity to fully utilize the software
and make it seem less dull.
General objectives:
From personal experience, I realize that maths could have made more sense if it had been
portrayed visually. The system will include a simple to use/understand GUI, several
algorithms and of course the main graph body. Users will be given a choice of which graph
they would like to use, as well as what transformation(s) they would like to do on that
graph. A box with an equation in terms of f(x) will be updated at runtime to show the
equation of the graph after being transformed. The graph can then be saved externally.
Objectives for the proposed system:
1. The system must cover the transformations of graphs topic by using fundamental
and more complex types of functions and transformations.
2. The proposed system must be able to apply a function transformation at real time.
3. The user can choose what type of function is being used.
4. The user can choose what type of transformation is being used.
5. Scroll bars as well as input boxes will affect the magnitude of the transformations.
6. An undo button will be incorporated to undo a previous transformation.
7. A text box displaying the overall current function should be present.
8. The graph can be saved and printed.
16. Alex Tang
12 | P a g e
9. Explanations are given regarding each transformation.
Limitations:
1. Not all the types of functions/transformations are incorporated in the system.
2. X and Y coordinates are finite and are within a small range.
3. Only real numbers to an accuracy of 2 decimal points are used, therefore some
intersections might not be 100% accurate.
4. The canvas cannot be zoomed in/out from.
Data sources, stores and destinations for the proposed system:
Stores:
Core 2 mathematics textbook (Edexcel): Being a maths pupil myself, I have the entire
core maths book set (C1-C4) at my disposal. I shall be using mainly C2 (but also C3) to
choose which functions/transformations will be incorporated in my system.
Core 2 Past papers (Edexcel): Using past papers as a sort of reference, I will be able
to see which transformations occur the most, as well as what type of functions are
used to further help me incorporate the correct functions/transformations during
the programming stage.
Sources:
Mr Mcready (Maths Teacher): The maths teacher will specify which
function/transformation should be used. The user will have the choice of choosing
the magnitude of transformation as well as the function from a selection of choices
besides the axis.
o Function ‘F(x)’: The functions are the mathematical graphs I will be including
in my project, for example: x2, sin(x) and ex. These are all the un-transformed
versions without and transformations applied to them. The user can choose
what function he wishes to use from a selection besides the axis.
o Type of Transformation: The mathematical transformations are the ones
which transform the basic functions, for example: F(x) + a and F(x+a). These
will have pre-set values (most likely 0) and can be changed through user
input or slide bars. For transformations that have no magnitude, such as –F(x)
and F(-x), radio buttons will be used. The overall transformation equation will
be displayed on a panel below the axis.
o X,y coordinates: A domain and range need to defined during program
creation, these will probably be between -10 and 10. During implementation,
the magnitude of the transformations cannot go beyond those values.
Destinations:
Student: The student will receive a transformed function as an output in which will
include several different properties.
o The transformed function: The complete function with corresponding
transformations applied to it.
17. Alex Tang
13 | P a g e
o Overall function: A panel next to the axis will contain the overall function of
the current graph, e.g. x2-3x-4.
o Explanation: A text box will contain simple information about every
transformation applied to the function for the user to observe.
o Notes: Written examples and explanations given to the pupils by maths
teachers to solidify understanding.
Data Volumes:
1. Functions:
a. F(x) = x
b. F(x) = x2
c. F(x) = x3
d. F(x) = 1/x
e. F(x) = ex
f. F(x) = sin(x)
g. F(x) = cos(x)
h. F(x) = tan(x)
2. Transformations: Where ‘a’ is a variable that corresponds to the magnitude of the
transformation.
a. F(x) + a
b. F(x) – a
c. F(x + a)
d. F(x – a)
e. F(ax)
f. aF(x)
g. –F(x)
h. F(-x)
i. Modulus
3. X,Y coordinates: These values depend on the range and domain, both of which are
the same in the proposed system; -10 to 10.
18. Alex Tang
14 | P a g e
Data Flow Diagram of the Proposed System
19. Alex Tang
15 | P a g e
Level 1 Data flow diagram of proposed system
20. Alex Tang
16 | P a g e
Looking closely at the level 1 data flow diagram for the proposed system:
1. Draw the basic function:
As the system is started up, the first process the user has to decide upon is which
function he will be transforming. As a function (from a choice of 8) is chosen, the
respected graph is drawn onto the canvas area at run-time.
2. Apply transformation:
The second process involves a combination of steps. After the user selects the type
of graph to be transformed, he then has the ability to select from a choice of 9
transformations to transform the graph. It is to be noted, several transformations
can be applied to the same graph to create a compound function.
3. Explanations:
This process doesn’t fully utilize the system I am creating; it is mostly dependant on
the teacher supplying the students with the required notes. However, the program
will output an explanation in terms of an edit box showing the current value of f(x).
An illustrative data flow representation is found below with all the steps elaborated to more
detail:
1) The required functions and their graphs are
preset into the program by the programmer.
2) As the user chooses a function, the respected
function is drawn onto the canvas area.
3) The y-coordinates are found out by using the
mathematical functions found in the algorithm.
1) The required transformations are preset into the
program by the programmer.
2) As the user changes the magnitudes through
entering a value or shifting the scroll bars, the
function is transformed at run-time.
3) Only the tranformed function is displayed on the
canvas.
1) The data storages store the explanations, notes
and answers.
2) The program is able to output an accurate value
of f(x) after each function is transformed.
3) The maths pupils will be able to distinquish which
transformations have been applied by analysing
f(x).
1
2
3
21. Alex Tang
17 | P a g e
Analysis data dictionary
Name Description Data type Size
Function The graphs which are
used within the
system. These are
only the original
functions which the
transformations
occur on.
Real (each x
coordinate has a
respective y
coordinate, they
both are real values)
-10 to 10 (in both x
and y axis).
X coordinates Each function has to
have a domain, it
must be valid and
within the specified
canvas area.
Real -10 to 10
Untransformed f(x) The graph which is
drawn after the user
selects a function.
Real -10 to 10
Y coordinate The value output
after the x
coordinates have
been passed through
the graph functions
inside the program.
Real -10 to 10
Transformation The translations used
within the program.
The values of these
are altered by the
user at run-time.
Real/Integer -10 to 10
(larger/smaller
values can be used;
however, will have
no effect as the
canvas area is finite).
Transformed f(x) The final stage of the
process where the
graph has been fully
transformed creating
a singular or
compound function.
Real -10 to 10
Explanations/Notes Data which is passed
directly from the
teacher to the pupil;
not passed through
the system.
However, a value of
f(x) will be displayed
as the explanation.
String Undefined.
22. Alex Tang
18 | P a g e
Realistic Appraisal of the Feasibility of Potential Solutions
Manual Solution:
Continuing with Mr Mcready’s technique of occasionally drawing graphs on the whiteboard,
valuable lesson time will get wasted, as often the students require up to 10 minutes for
copying. The time wasted could otherwise be used to solidify the students’ knowledge.
Photocopying notes also causes a problem, these notes, if not well kept tend to get lost,
resulting in the student having no reference material, Mr Mcready would either have to
draw the graph again, photocopy another pair of notes or in the worst case scenario depend
on the students to solve for themselves.
Bespoke software:
The school currently has one licence to AutoGraph, Mr Mcready’s, but it wouldn’t be within
the schools budget to buy any more. Bespoke software does cater towards the needs of the
pupils, which is apparent; however, it cannot be a realistic option, mainly to do with the
price.
Shareware software:
There is an abundance of free graph drawing software which is efficient, meaning there are
limited options for students to choose from. Some packages cover all the required topics;
however, these are usually trial versions with limited user guidance/explanations. The
schools budget cannot cover 25-30 CAD software licenses, therefore the cost of continuing
to photocopy notes would indefinitely be more cost-efficient.
Programmed In Delphi Pascal
With prior knowledge of Delphi Pascal from year 12, I have decided to create my system
with it. Borland 7 Delphi has many mathematical and graphical functions, including Bezier
curves, which will provide me with a basis on plotting curved graphs. Furthermore, Delphi
Pascal is a beginner oriented language which includes all the required syntax.
C was my second language of choice; it is less demanding on syntax than Delphi Pascal,
however, there are more trigonometric functions as well as parabolic functions
incorporated in Delphi Pascal which would definitely improve my program. Furthermore, C
doesn’t incorporate as many math libraries, including Bezier curves.
23. Alex Tang
19 | P a g e
Formal interview with Mr Mcready:
24. Alex Tang
20 | P a g e
Justification of the Chosen Solution
After conducting a formal interview with Mr Mcready, My computing teacher and several
pupils as well as analysing current teaching methods, I have decided to implement the
interactive system through Delphi Pascal.
The bespoke solution (using AutoGraph) isn’t feasible for the school in terms of costs and
pupil satisfaction. Firstly as I have previously stated, the running costs per year are outside
the budget of the math department. Secondly, pupils using AutoGraph will not be satisfied
with their time using the software because the program does not solely focus on the topic
of transforming functions. Hence, the pupil will need prior knowledge to navigate through
the program interface to locate the correct options whereas a basic solution dedicated to
transformation functions will not.
Programming a new system in Pascal whilst taking in the requirements of the end-users and
the current A level maths students I would be able to incorporate a well-rounded system
focused on a singular topic of transforming functions. Pascal is my choice of high level
language because I have been studying it in my AS years doing computing, plus it is an
object-oriented programming language; a perfect sync with the maths library it provides.
Overall, the Delphi 7 IDE will provide me with the relative components required to create an
interactive system, the back layer of maths functions provided by the Pascal language will
supply me with the required functions and the knowledge I have of doing A level
maths/computing will provide me with the correct syntax required.
27. Alex Tang
23 | P a g e
Overall aim of the project
The aim of this project is to produce a computer aided learning system for Mr Mcready to
help the students doing AS/A2 maths understand graphs and transformations in more
detail, as well as accuracy. The system will allow the students to either type in a function of
‘x’ and have the graph drawn for them, this mode would mainly be used by the pupils to
check their answer, or they can do step by step transformations on their own where a
function is broken down into its composite transformations so the pupil can see how each
and every transformation affects the overall graph. Furthermore, Mr Mcready asked if I
could incorporate saving to the project, so the pupils could print out any transformations
they were struggling with and ask for assistance.
I shall be programming Delphi Pascal, focusing majorly on the C2/C3 aspects of maths to
incorporate a solid understanding of plotting functions to the students. Taking in account
the needs of the end users, a simple GUI is needed as to not confuse any pupils. To be able
to produce this program, I need to create a thorough design to make sure it meets all the
necessary objectives.
Description of the modular structure of the system
First Tier – Transformation of f(x)
28. Alex Tang
24 | P a g e
Second tier – Display chosen f(x)
29. Alex Tang
25 | P a g e
Second tier – Transform current f(x)
Second tier – Text box displays current f(x)
30. Alex Tang
26 | P a g e
Second tier – Main menu
Second tier – Clear all and canvas
31. Alex Tang
27 | P a g e
Second tier – Save Graph
Systemflowcharts
An easy to trace method involving different types of ‘boxes’ which represent different
operations. I am using LucidChart software for the diagrams; https://www.lucidchart.com
Main menu flow chart:
This flowchart represents the point right when the program is initialized. The user is
prompted to enter his/hers name before proceeding into the main program form. Also,
the user is able to exit the program at any time.
32. Alex Tang
28 | P a g e
Selecting a function:
The user will be able to see the selection of functions (eight in total) available to use as
the form is brought up. These graphs are all predefined within the code, so only the flag
variable prompting each one is initialised. As a function (a button on the form) is selected,
the value of the flag variable is updated accordingly. An edit box will contain the value of
f(x) (which will also change as the flag variable is updated) which is updated at run-time.
This whole process is within a repeat loop; the canvas and f(x) are cleared when a new
function is selected. Each graph is drawn on the canvas area; the user will be able to see
the graphs on the VDU instantaneously.
33. Alex Tang
29 | P a g e
Transformation of f(x):
After selecting the type of function to use, the user can select which transformation(s) he
wants to apply. The magnitude of transformation can be changed using scroll bars and
input boxes found on the form. As each transformation is applied, f(x) is updated at run-
time and the graph is drawn instantly. The user can restart by clearing the canvas at any
point.
34. Alex Tang
30 | P a g e
Clear canvas and Save graph:
These flowcharts demonstrate two features in the program, clearing and saving. For
clearing, after the user has finished with a transformation, he can reset the system and
create another. The saving feature simply saves the current canvas onto a file format
chosen by the user.
35. Alex Tang
31 | P a g e
Design Data Dictionary
Object name Data type Max size/length Validation
required
Description
Xmax Integer 200 (Value of X is
constant
throughout)
None The pre-set value of
the size of the X
axis
Ymax Integer 200 (Value of Y is
constant
throughout)
None The pre-set value of
the size of the Y
axis
OutStr String 10 None (Input during
run-time)
Position of the
scrollbar
Flag Integer 8 None A pointer variable
which allows
functions to call
other functions
Y1 Integer 10 Data type check
(Value must a
whole number)
A value which
stores the
magnitude of the
f(x+a)
transformation
Y2 Integer 10 Data type check
(Value must a
whole number)
A value which
stores the
magnitude of the
f(x)+a
transformation
Y3 Real 10 Data type check
(Value must be a
number)
A value which
stores the
magnitude of the
f(ax)
transformation
Y4 Real 10 Data type check
(Value must be a
number)
A value which
stores the
magnitude of the
af(x)
transformation
A String 10 Data type check
(Value must be a
character)
A variable which
stores the output
from the position of
scrollbar1
(magnitude of
transformation
value)
B String 10 Data type check
(Value must be a
character)
A variable which
stores the output
from the position of
scrollbar2
(magnitude of
transformation
value)
36. Alex Tang
32 | P a g e
C String 10 Data type check
(Value must be a
character)
A variable which
stores the output
from the position of
scrollbar3
(magnitude of
transformation
value)
D String 10 Data type check
(Value must be a
character)
A variable which
stores the output
from the position of
scrollbar4
(magnitude of
transformation
value)
sFx String 8 None A variable which
stores f(x) in string
format to be
displayed to the
user
i Integer 10 None Stepper variable
used within for
loops
XCord Integer 10 Data type check
(Value must a
whole number)
Variable which
stores magnitude of
y=x
O Integer 400 None A stepper variable
which stores the x-
coordinate
increments of the
draw axis function
P Integer 400 None A stepper variable
which stores the y-
coordinate
increments of the
draw axis function
Xa Single 20 None A variableused as a
stepper and to
increment the
while loop.
Ya Single 20 None A variable used to
store the absolute
value of Xa as well
as the original Xa
Xi Integer 400 None Used as a check
when drawing a
Tan(x) function to
see if the line is
beyond the
domain.
Yi Integer 400 None Used as a check
when drawing a
Tan(x) function to
see if the line is
beyond the
domain.
37. Alex Tang
33 | P a g e
Volumetrics
Amount of hard drive space required:
Data storage is not a concern for my project as there are no records or databases to store,
apart from the memory required for sub-routines, variables and forms. Therefore, there is
no need for me to make calculations to the amount of hard drive space required.
Identification of storage media:
Since this is not a database project, storage media for a database or any other included files
is not required. The only compartment of the program that will be saved is the actual
program itself, which in reality is almost no memory (~500kb), if compared to a whole
database. The prospectus users are of course the maths students, but also the maths
department, therefore computers at school should have the program pre-loaded on their
HDD for the students to use during school time. I my opinion, HDD is the perfect storage
media because it provides a fast access time and can be read from multiple times.
Another storage medium that would be perfect for storing as well as transferring the
program would be a USB flash drive. Any size of flash drive would be sufficient, but a 1-GB
one is most common and cheap than a larger capacity one. Being easily portable and
accessible, it will allow the students to transfer the program to their home computers for
further use when not at school. A different use for the USB drive could be as a back-up of
the program if the original version corrupts.
Hardware specifications:
Desktop:
Desktop Tower: To run the application.
VDU (monitor): To be able to visually display the program.
Keyboard: Used to input data (e.g. magnitude of transformation and name).
Mouse (or other pointer device): Used to select options on the form (e.g. selecting
type of graph and moving scrollbars).
HDD: TO store the program on.
Laptop:
Laptop (as a whole): The screen, processor, keyboard, HDD and mouse pad
combined.
External mouse: Faster use than a mouse pad.
USB flash drive: To access the program from if not already stored in the HDD.
38. Alex Tang
34 | P a g e
Identification of suitable Algorithms
With coordination from both my computing and maths teachers, I decided to keep the
number of algorithms to the bare minimal as to refrain from the code becoming untraceable
for other programmers looking at it. The algorithms mostly come from the system
flowcharts; however some names may not be identical.
1. DrawAxisFunction: Plots the axis, taking the predefined intervals.
2. XCoord: Plots a straight line parallel to the y-axis at a value given by the user.
3. YCoord: Plots a straight line parallel to the x-axis at a value given by the user.
4. LinearGraph: Function to draw ‘y = x’.
5. QuadraticGraph: Function to draw ‘y = x2’.
6. CubicGraph: Function to draw ‘y = x3’.
7. CosineGraph: Function to draw ‘y = Cos(x)’.
8. SineGraph: Function to draw ‘y = Sin(x)’.
9. ExponentialGraph: Function to draw ‘y = ex’.
10. ReciprocalGraph: Function to draw ‘y = 1/x’.
11. TangentGraph: Function to draw ‘y = Tan(x)’.
12. Displayf(x)AsString: An edit box to update as each transformation is applied to a
graph to give the current f(x).
13. ClearAll: Resets the canvas as well as all the inputs/outputs.
14. ScrollBarShift: To convert the value of the scrollbar position into values used by the
program.
15. CaseOfGraphOption: A large nested if statement in order to process which graph is
being accessed as well as the transformation being applied.
16. SaveGraph: An option to save the current canvas.
39. Alex Tang
35 | P a g e
I think it will be necessary to explain the plotting techniques I use in the program in greater
detail; these functions are pre-defined and are not made by me. These are the
Canvas.Moveto*(moves the pen to the desired position) and Canvas.Lineto*(draws a line
from the current position to the desired position) commands, they both only have two
parameters which are:
As shown above, both the parameters of the Moveto and Lineto functions are predefined as
integers. These posed a problem, the problem of not being able to draw curved lines in a
small domain. My solution to this problem came from using a process called ‘Floor and
ceiling’. ‘Floor’ is a rounding function which rounds the given number down (it has a single
parameter) to the nearest non-floating point integer. ‘Ceiling’ is the same, except the
parameter is rounded up. In the actual code, I chose to use Floor as to not create a function
which goes beyond the limit of 400 pixels.
Here is a table demonstrating the functions in use:
X Floor Ceiling
-1.1 -2 -1
0 0 0
1.01 1 2
2.9 2 3
3 3 3
So implementing Floor into the previous function, we get:
Still, there was a slight problem, the variables which correlate to the magnitude of
transformation were declared as real numbers*, yet the ‘Moveto’ and ‘Lineto’ functions can
only take integers as their parameters. The end product would look somewhat like this:
*Transformations can be real or integer values, as shown above as ‘a’.
*Note,Form1 isdeclaredbefore the
function declaration because the
program contains multiple forms.
40. Alex Tang
36 | P a g e
Using high level Pseudocode, I have described the algorithms I shall be using during the
implementation stage. These algorithms are done in a very precise format, similar to that
format used in Delphi Pascal so that understanding can be clearer.
I will explain each algorithm with greater detail in the technical solution chapter, as I feel I
would need to have fully completed the working program to be able to fully explain the use
of each line of code.
Please note, this section was partially completed after completing the coding, therefore
some parts have been edited to incorporate the correct variables/procedures/iterations etc…
Type Declarations:
//Note,theseare thefinal typedeclarationsused in the final code.
procedure XCoordClick(Sender:TObject);
procedure ClearClick(Sender:TObject);
procedure YCoordClick(Sender:TObject);
procedure MainMenuClick(Sender:TObject);
procedure QuadraticClick(Sender:TObject);
procedure CubicClick(Sender:TObject);
procedure ScrollBar1Change(Sender:TObject);
procedure ScrollBar2Change(Sender:TObject);
procedure ScrollBar3Change(Sender:TObject);
procedure ScrollBar4Change(Sender:TObject);
procedure CosineClick(Sender:TObject);
procedure SineClick(Sender:TObject);
procedure ExponentialClick(Sender:TObject);
procedure LinearClick(Sender:TObject);
procedure ReciprocalClick(Sender:TObject);
procedure TangentClick(Sender:TObject);
procedure Transformation1Click(Sender:TObject);
procedure Transformation2Click(Sender:TObject);
procedure Transformation3Click(Sender:TObject);
procedure Transformation4Click(Sender:TObject);
procedure CheckBox3Click(Sender:TObject);
procedure SaveGraphClick(Sender:TObject);
41. Alex Tang
37 | P a g e
1) DrawAxisFunction:
2) XCoord:
Var
O, P = Integer;
XMax = Integer;
YMax = Integer;
O = 20;
Repeat
MovePenToPosition=(XMax,0);
DrawLineToPosition=(XMax,O);
DrawLineToPosition=(XMax + 3, O);
DrawLineToPosition=(XMax - 3, O);
IncrementO by 20;
Until O is > = HeightOfCanvas; //Valueof 400
P = 20;
Repeat
MovePenToPosition=(0, YMax);
DrawLineToPosition=(P,YMax);
DrawLineToPosition=(P,YMax + 3);
DrawLineToPosition=(P,YMax – 3);
IncrementP by 20;
Until P is >= WidthOfCanvas;//Valueof 400
Lines 9, 10, 17 and 18 are a repeat
of the LineToandMoveTo functions;
they are made to insert dashes
along equal distances to represent
the scale.
Var
XCord= Integer;
I = Integer;
XMax = Integer;
YMax = Integer;
For I = -10 to 10
If I = XCord Then
MovePenToPosition=(XMax + (20*i),YMax);
DrawLineToPosition=(XMax + (20*i), 0);
DrawLineToPosition=(XMax + (20*i), 400);
XMax and YMax are a constant
value throughout the program:
Ymax = Shape1.Heightdiv2;
Xmax = Shape1.Widthdiv2;
42. Alex Tang
38 | P a g e
3) YCoord:
4) LinearGraph:
Var
YCord = Integer;
I = Integer;
XMax = Integer;
YMax = Integer;
For I = -10 to 10
If I = YCordThen
MovePenToPosition=(XMax , YMax – (20*i));
DrawLineToPosition=(0,YMax – (20*i));
DrawLineToPosition=(XMax + (20*i), 400);
Var
Xa, Ya = Real;
a, b, c, d = Real;
MovePenToPosition=((Xa+ a) * (1/b),(Ya+ c) * d)
While Xais <= 10
Ya = Xa; //y = x
DrawLineToPosition=(200 + ((20 * Xa) + a) * (1/b),(200-((20 * Ya) + c) * d)
IncrementXa by 0.01;
a refersto f(x +/- a) b referstof(ax) c referstof(x) + a d referstoaf(x)
Valuesneedtobe scaled
up to the canvas size and
pixel size of the screen
43. Alex Tang
39 | P a g e
5) QuadraticGraph:
6) CubicGraph:
Var
Xa, Ya = Real;
a, b, c, d = Real;
MovePenToPosition=((Xa+ a) * (1/b),(Ya+ c) * d)
While Xais <= 10
Ya = Xa * Xa; //y = x^2
DrawLineToPosition=(200 + ((20 * Xa) + a) * (1/b),(200-((20 * Ya) + c) * d)
IncrementXa by 0.01;
Var
Xa, Ya = Real;
a, b, c, d = Real;
MovePenToPosition=((Xa+ a) * (1/b),(Ya+ c) * d)
While Xais <= 10
Ya = Xa * Xa * Xa; //y = x^3
DrawLineToPosition=(200 + ((20 * Xa) + a) * (1/b),(200-((20 * Ya) + c) * d)
IncrementXa by 0.01;
44. Alex Tang
40 | P a g e
7) CosineGraph:
8) SineGraph:
Var
Xa, Ya = Real;
a, b, c, d = Real;
MovePenToPosition=((Xa+ a) * (1/b),(Ya+ c) * d)
While Xais <= 10
Ya = Cos(x);//y = cos(x)
DrawLineToPosition=(200 + ((20 * Xa) + a) * (1/b),(200-((20 * Ya) + c) * d)
IncrementXa by 0.01;
Var
Xa, Ya = Real;
a, b, c, d = Real;
MovePenToPosition=((Xa+ a) * (1/b),(Ya+ c) * d)
While Xais <= 10
Ya = Sin(x);//y =sin(x)
DrawLineToPosition=(200 + ((20 * Xa) + a) * (1/b),(200-((20 * Ya) + c) * d)
IncrementXa by 0.01;
45. Alex Tang
41 | P a g e
9) ExponentialGraph:
10) ReciprocalGraph:
Var
Xa, Ya = Real;
a, b, c, d = Real;
MovePenToPosition=((Xa+ a) * (1/b),(Ya+ c) * d)
While Xais <= 10
Ya = Exp(x);//y = exp(x)
DrawLineToPosition=(200 + ((20 * Xa) + a) * (1/b),(200-((20 * Ya) + c) * d)
IncrementXa by 0.01;
Var
Xa, Ya = Real;
a, b, c, d = Real;
MovePenToPosition=((Xa+ a) * (1/b),(Ya+ c) * d)
While Xais <= 10
Ya = 1/x; //y = 1/x
DrawLineToPosition=(200 + ((20 * Xa) + a) * (1/b),(200-((20 * Ya) + c) * d)
IncrementXa by 0.01;
46. Alex Tang
42 | P a g e
11) TangentGraph:
12) Displayf(x)AsString:
Var
Xa, Ya = Real;
a, b, c, d = Real;
MovePenToPosition=((Xa+ a) * (1/b),(Ya+ c) * d)
While Xais <= 10
Ya = Tan(x);//y = tan(x)
DrawLineToPosition=(200 + ((20 * Xa) + a) * (1/b),(200-((20 * Ya) + c) * d)
IncrementXa by 0.01;
Var
sFx = String;
Flag= Integer;
a, b, c, d = Integer;
Case of Flag Value
1: sFx = 'x';
2: sFx = 'x^2';
3: sFx = 'x^3';
4: sFx = 'Cos(x)';
5: sFx = 'Sin(x)';
6: sFx = 'e^x';
7: sFx = '1/x';
8: sFx = 'Tan(x)';
Output a + ‘(‘+ b + sFx + c + ‘)’+ d;
a, b, c and d have all beenstated
above,these are all variable holders
for the magnitudesof transformations
Flagis a global variable whichwill
correlate toeach type of
transformation
47. Alex Tang
43 | P a g e
13) ClearAll:
14)ScrollBarShift:
Flag= 0;
DrawAxisFunction;
ResetTextBoxes
ResetEditBoxes
ResetScrollbarPositions
ResetCheckBoxes
If ScollBarCurrentPosition is>0 then
ConvertToString(ScollBarCurrentPosition);
Output ‘+’ And StringScrollBarPosition;
If ScrollBarCurrentPosition is<0 then
ConvertToString(ScollBarCurrentPosition);
Output StringScrollBarPosition;
If ScollBarCurrentPosition is=0 then
Output ‘0’;
Outputa value of zero
(as a string) inthe edit
box
If the original value of the
scroll bar positionisless
than 0, the outputwill be a
negative number(aminus
signwill be predefined)
Unlike negative numbers,positive
numbersdonot have the plussign
before them.Thisposedaproblem
whenapplyingthemasparameters
to transformationsasthe output
f(x) wasunclear
48. Alex Tang
44 | P a g e
15)CaseOfGraphOption:
Var
Xa, Ya = Integer;
If Flag= 1 then
DrawRectangleOverCanvas(1,1,400,400);
DrawAxisFunction;
Draw LinearGraph(Xa,Ya);
If Flag= 2 then
DrawRectangleOverCanvas(1,1,400,400);
DrawAxisFunction;
Draw Quadratic(Xa,Ya);
If Flag= 3 then
DrawRectangleOverCanvas(1,1,400,400);
DrawAxisFunction;
Draw Cubic(Xa,Ya);
//Thecode is then copied forthe other 5 flag options,the
code is reused each time,so it is unnecessary to includeit all.
A Rectangle is drawn over the
currentcanvas to create a new layer
for use
Axis is redrawn
49. Alex Tang
45 | P a g e
User Interface Design
Main Menu form:
Transformation form:
50. Alex Tang
46 | P a g e
I believe it is necessary for me to explain why I chose the layout of the transformation to be
the way it currently is. The main menu form is quite simplistic so I reckon a thorough
description is not needed.
The eight functions in the top right corner have been given a large surface area to stand out
beyond the other functionalities of the program. A novice user would be able to distinguish
that those are the main buttons of the program.
Using the conventional methods of sliding a scroll bar, I used an editbox alongside it to give
just that extra bit of accuracy. As the user shifts the scroll bar, the value of the editbox will
change accordingly, however, the system is not limited to only varying the magnitude using
a scrollbar, the user can directly input a number into the relative editbox for even greater
accuracy. After the user chooses a value, he would need to press the function button
located to the left of the editbox to see a transformation.
The modulus transformation only uses a checkbox, I believe it is more simple to only have
two Boolean states; on and off so that the user would not get confused as to which part of
f(x) is being changed to being absolute. As the checkbox is selected, the current graph
(transformed or not) would be reflected parallel to the x-axis. It is to be noted, modulus
converts the y coordinates of a function into absolute values (non-negative), however, if a
transformation has already taken place, the y coordinates may not always be positive (e.g.
shifts up and down).
Two input boxes for the x/y values have been provided below the transformations. These
allow a user to enter an integer in one or both boxes to find the solution to a function.
Normal button formats have been given to ‘Clear’, ‘Main menu’ and ‘Save’ to cement the
fact this program is like any other ordinary program. The user should feel as though the
whole component is interactive and simple to use, even if he/she is a computer genius.
The canvas area was given a size of 400x400 pixels. I believe this size is adequate for the
functions/transformations I provide because the domain and range both have small values.
Also, a canvas this size is perfect size on a PC, even if being projected on the whiteboard,
whereas a larger canvas may cause distortion.
Lastly, the f(x)= layer is designed as an editbox, however, it is unavailable for use by the user
(read-only). It is placed below the graph as it is the only logical place to have it; a quick
mathematical representation without the need of looking at the canvas. Another reason the
edit box is below the canvas area is if the teacher wants to set a test where he would cover
up the canvas and expect the pupils to draw the respected graph on a piece of paper using
only the f(x) edit box. He could then show the canvas and check to who got the graph
drawing correct.
51. Alex Tang
47 | P a g e
Security & integrity of data
Security of the program isn’t a big problem, there isn’t a large back layer of data storage
(database/excel etc…) in the actual program, therefore keeping the data secure is not really
a massive issue.
Validating data is the main concern for me; there are several cases where variables are
converted to string from integer and vice versa. These could pose a threat because non-
numerical values could be input into the program creating run-time errors.
There are 11 cases where data is input from the user:
1. 4 cases are to do with the position of the scrollbar; these need to be validated so the
correct numerical representations are displayed in their respected textboxes.
Furthermore, a range change needs to be implemented so the positional values of
the scroll bars do not go beyond the required range.
2. 6 cases are to do with data validation. There are six textboxes which data can be
input into by the user. These need to be validated during run-time, so non-
numerical values are rejected.
3. 1 case of data input where there is no data validation is in the initial main menu
form where the user is prompted to enter his/her name.
Apart from the previously stated objects, there are other objects such as the check boxes
and buttons which do not need validation as they are of Boolean type.
I can finally conclude that my data integrity for this program is sufficient.
System security
I have previously stated that I plan to make the program available for use by anyone at
school and at home. This means, the software is readily available from all school computers
and the maths department for use in and outside school. The role of the system
maintenance team once I have left the school would be to insure the software is not
misused and the role of Mr Mcready would be to provide assistance with any errors the
pupils encounter. Transferring the program through previously stated mediums would again
be the responsibility of the maths department as the program pre-loaded on the school
computers will not be available for transferability.
I believe security of the system is not essential (in my case), the pupils and teachers would
only have access to the .exe file, meaning the code itself cannot be edited. Furthermore, as
the software is available to be the students, it would be their own responsibility to look
after it.
52. Alex Tang
48 | P a g e
Test strategy
I believe it is vital to test the program thoroughly before it being implemented into the
school system to ensure that the number of errors is minimised. It will be necessary to
create a strategic testing plan before actually writing up the system testing chapter so that
there is an efficient and clear end product.
I will use a mixture of black box and white box testing techniques; black box to test the input
and output of the system through the eyes of a user to check if all types of magnitudes have
the appropriate validation and configuration, and white box testing to go thoroughly
through each line of code to check for errors/ incorrect logic, especially the function
drawing algorithms where the mathematics behind the code needs to be valid.
The main area of testing would be each function (each algorithm) where the logic behind
the maths needs to be correct in order to display the desired graph. Also, there are linked
functions, and due to programming in a function based language, the order of these
functions is very important to insure the correct values of parameters are passed through.
54. Alex Tang
50 | P a g e
Design of detailed test plan
Test
Number
Purpose Description Test Data
Reference
Evidence
Reference
(refer to
Appendix)
1 Clicking
‘Transformationmode’
on the mainmenuform
shouldletthe user
proceedontoform2.
Changing from the main
menu form to the
transformation mode
form.
TD1 n/a
2 Clickingthe picture on
the mainmenuform
shouldletthe user
proceedontoform2.
Changing from the main
menu form to the
transformation mode
form.
TD2 n/a
3 Clicking exit program
terminates the
program.
Exiting the program. TD3 n/a
4 Check if name
entered in the main
menu form is
displayed on form2.
When opening the
transformation mode
form, the name would
appear on the bottom.
TD4 n/a
5 All types of characters
are accepted when
entering the name in
the main menu form.
Names with hyphens or
apostrophes to be
accepted.
TD5 n/a
6 User prompted to
enter name in the
main menu form.
Name field cannot be
empty.
TD6 E1
7 Clicking ‘Linear’ draws
the correct function
and axis.
Draws f(x)=x TD7 E2
8 Clicking ‘Quadratic’
draws the correct
function and axis.
Draws f(x)=x2 TD8 E3
9 Clicking ‘Cubic’ draws
the correct function
and axis.
Draws f(x)=x3 TD9 E4
10 Clicking ‘Cosine’
draws the correct
function and axis.
Draws f(x)=cos(x) TD10 E5
11 Clicking ‘Sine’ draws
the correct function
and axis.
Draws f(x)=sin(x) TD11 E6
12 Clicking ‘Tangent’
draws the correct
function and axis.
Draws f(x)=tan(x) TD12 E7
55. Alex Tang
51 | P a g e
13 Clicking ‘Exponential’
draws the correct
function and axis.
Draws f(x)=ex TD13 E8
14 Clicking ‘Reciprocal’
draws the correct
function and axis.
Draws f(x)=1/x TD14 E9
15 Value of ‘flag’
updated upon clicking
‘Linear’.
Data check. TD15 n/a
16 Value of ‘flag’
updated upon clicking
‘Quadratic’.
Data check. TD16 n/a
17 Value of ‘flag’
updated upon clicking
‘Cubic’.
Data check. TD17 n/a
18 Value of ‘flag’
updated upon clicking
‘Cosine’.
Data check. TD18 n/a
19 Value of ‘flag’
updated upon clicking
‘Sine’.
Data check. TD19 n/a
20 Value of ‘flag’
updated upon clicking
‘Tangent’.
Data check. TD20 n/a
21 Value of ‘flag’
updated upon clicking
‘Exponential’.
Data check. TD21 n/a
22 Value of ‘flag’
updated upon clicking
‘Reciprocal’.
Data check. TD22 n/a
23 Transformation1
applies correct
transformation when
clicked.
‘F(x) +/- a’
transformation is applied
to the selected graph.
TD23 E10
24 Transformation2
applies correct
transformation when
clicked.
‘F(x +/- a)’
transformation is applied
to the selected graph.
TD24 E11
25 Transformation3
applies correct
transformation when
clicked.
‘aF(x)’ transformation is
applied to the selected
graph.
TD25 E12
26 Transformation4
applies correct
transformation when
clicked.
‘F(ax)’ transformation is
applied to the selected
graph.
TD26 E13
56. Alex Tang
52 | P a g e
27 ScrollBar1 displays
correct positional
value in its edit box.
Value for the magnitude
of transformation.
TD27 E14
28 ScrollBar2 displays
correct positional
value in its edit box.
Value for the magnitude
of transformation.
TD28 E15
29 ScrollBar3 displays
correct positional
value in its edit box.
Value for the magnitude
of transformation.
TD29 E16
30 ScrollBar4 displays
correct positional
value in its edit box.
Value for the magnitude
of transformation.
TD30 E17
31 Graph of ‘Linear’ is
updated at run-time
when a
transformation is
applied.
Current canvas is erased
and replaced by the
transformed function.
TD31 n/a
32 Graph of ‘Quadratic’
is updated at run-
time when a
transformation is
applied.
Current canvas is erased
and replaced by the
transformed function.
TD32 n/a
33 Graph of ‘Cubic’ is
updated at run-time
when a
transformation is
applied.
Current canvas is erased
and replaced by the
transformed function.
TD33 n/a
34 Graph of ‘Cosine’ is
updated at run-time
when a
transformation is
applied.
Current canvas is erased
and replaced by the
transformed function.
TD34 n/a
35 Graph of ‘Sine’ is
updated at run-time
when a
transformation is
applied.
Current canvas is erased
and replaced by the
transformed function.
TD35 n/a
36 Graph of ‘Tangent’ is
updated at run-time
when a
transformation is
applied.
Current canvas is erased
and replaced by the
transformed function.
TD36 n/a
37 Graph of
‘Exponential’ is
updated at run-time
when transformation
is applied.
Current canvas is erased
and replaced by the
transformed function.
TD37 n/a
57. Alex Tang
53 | P a g e
38 Graph of ‘Reciprocal’
is updated at run-
time when a
transformation is
applied.
Current canvas is erased
and replaced by the
transformed function.
TD38 n/a
39 Clicking on a new
function clears
current canvas and
displays the chosen
function.
Used to transform a
different function.
TD39 E18
40 Selecting the modulus
checkbox1, ‘Linear’
Graph is transformed
and redrawn with a
red color. Clicking
again will undo the
option.
Ability to flick between
‘F(x)=x’ and ‘F(x)=|x|’.
TD40 E19
41 Selecting the modulus
checkbox1,
‘Quadratic’ Graph is
transformed and
redrawn with a red
color. Clicking again
will undo the option.
Ability to flick between
‘F(x)=x2’ and ‘F(x)=|x2|’.
TD41 E20
42 Selecting the modulus
checkbox1, ‘Cubic’
Graph is transformed
and redrawn with a
red color. Clicking
again will undo the
option.
Ability to flick between
‘F(x)=x3’ and ‘F(x)=|x3|’.
TD42 E21
43 Selecting the modulus
checkbox1, ‘Cosine’
Graph is transformed
and redrawn with a
red color. Clicking
again will undo the
option.
Ability to flick between
‘F(x)=cos(x)’ and
‘F(x)=cos(|x|)’.
TD43 E22
44 Selecting the modulus
checkbox1, ‘Sine’
Graph is transformed
and redrawn with a
red color. Clicking
again will undo the
option.
Ability to flick between
‘F(x)=sin(x)’ and
‘F(x)=sin(|x|)’.
TD44 E23
58. Alex Tang
54 | P a g e
45 Selecting the
modulus checkbox1,
‘Tangent’ Graph is
transformed and
redrawn with a red
color. Clicking again
will undo the option.
Ability to flick between
‘F(x)=tan(x)’ and
‘F(x)=tan(|x|)’
TD45 E24
46 Selecting the
modulus checkbox1,
‘Exponential’ Graph
is transformed and
redrawn with a red
color. Clicking again
will undo the option.
Ability to flick between
‘F(x)=ex’ and ‘F(x)=e|x|’
TD46 E25
47 Selecting the
modulus checkbox1,
‘Reciprocal’ Graph is
transformed and
redrawn with a red
color. Clicking again
will undo the option.
Ability to flick between
‘F(x)=1/x’ and
‘F(x)=1/|x|’
TD47 E26
48 Applying a
transformation to
any function when
the modulus option
is selected should
transform the
modulus function.
To transform a function
that is absolute.
TD48 E27
49 Inputting a value for
‘x’ should draw a
line parallel to the y-
axis at that value.
Used to find
intersections more easily
TD49 E28
50 Inputting a value for
‘y’ should draw a
line parallel to the x-
axis at that value.
Used to find
intersections more easily
TD50 E29
51 Clicking ‘Clear’
should erase the
current canvas and
draw the axis.
To have a fresh canvas
for further use.
TD51 E30
52 Clicking ‘Clear’
should reset the
value of ‘flag’.
To allow the use of
another function.
TD52 n/a
53 Clicking ’Clear’
should clear/reset
edit/text boxes.
Completely reset the
program
TD53 n/a
59. Alex Tang
55 | P a g e
54 Clicking ‘Clear’ should
change the pen.color
to black.
The color of the pen can
be changed.
TD54 n/a
55 Clicking ‘Clear’ should
un-select any
checkboxes.
For use in the modulus
transformation.
TD55 n/a
56 Clicking ‘Main Menu’
should take the user
back to form1.
Going back to the main
menu.
TD56 n/a
57 Clicking ‘Save Graph’
should open the save
dialogue and prompt
the user to save the
file under a desired
name and format.
Saving current canvas. TD57 E31
58 Selecting any original
graph should update
the ‘f(x)’ text box
correctly.
Displays the function in
mathematical format.
TD58 E32
59 Transforming any
graph should update
‘f(x)’ text box
correctly.
Displays the transformed
function in mathematical
format.
TD59 E33
60 ‘f(x)’ text box to be
reset when ‘clear’ is
clicked.
Clears f(x) for the next
function.
TD60 E34
61 The functions do not
go beyond the pre-
defined range and
domain.
So graphs are not drawn
beyond the given canvas.
TD61 n/a
60. Alex Tang
56 | P a g e
Minimal Test Data
Some Test data I have left blank as there was no reasonable way of testing without writing a
whole paragraph.
Test Data
Reference
Test Data Data Type Expected Result Actual Result
TD1 User clicks
‘Transformation
mode’ button
Normal data Proceeds to the
transformation
form whilst
closing main
menu form
As expected
TD2 User clicks main menu
picture
Normal data Proceeds to the
transformation
form whilst
closing main
menu form
As expected
TD3 User clicks ‘exit
program’ button
Normal data Program is
terminated
As expected
TD4 - - - -
TD5 Name = James Normal data Name is saved and
displayed on
form2
As expected
Name = James.B Normal data Name is saved and
displayed on
form2
As expected
Name =
James1846%.@
Erroneous
data
User prompted to
use a simple name
Any name is
accepted
TD6 - - - -
TD7 x = -9 Normal data y = -9 As expected
x = 10 Boundary data y = 10 As expected
TD8 x = 2 Normal data y = 4 As expected
x = -10 Boundary data y = 100 As expected
TD9 x = 1 Normal data y = 1 As expected
x = 10 Boundary data y = 1000 (any
value above 400 is
ignored, however
is still processed)
As expected
TD10 x = π (180) Normal data y = -1 As expected
x = 2π (360) Boundary data y = 1 As expected
TD11 x = 0 Normal data y = 0 As expected
x = -2π Boundary data y = 0 As expected
TD12 x = 45 Normal data y = 1 As expected
x = 360 Boundary data y = 0 As expected
x = -90 Erroneous
data
Value is ignored
by the function an
Infinite value.
As expected
61. Alex Tang
57 | P a g e
TD13 x = 5 Normal data y = e5 As expected
x = 0 Boundary data y = 1 As expected
TD14 x = 8 Normal data y = 0.125 As expected
x = -10 Boundary data y = -0.1 As expected
x = 0 Erroneous
data
Value must be
ignored as 1/0 is
not computable.
As excepted
TD15 User clicks ‘Linear’
button
Normal data Flag = 1 As expected
TD16 User clicks ‘Quadratic’
button
Normal data Flag = 2 As expected
TD17 User clicks ‘Cubic’
button
Normal data Flag = 3 As expected
TD18 User clicks ‘Cosine’
button
Normal data Flag = 4 As expected
TD19 User clicks ‘Sine’
button
Normal data Flag = 5 As expected
TD20 User clicks ‘Tangent’
button
Normal data Flag = 8 As expected
TD21 User clicks
‘Exponential’ button
Normal data Flag = 6 As expected
TD22 User clicks ‘Reciprocal’
button
Normal data Flag = 7 As expected
TD23 User clicks ‘F(x) +/- a’
button
Normal data Chosen graph is
transformed
vertically upwards
As expected
TD24 User clicks ‘F(x +/- a)’
button
Normal data Chosen graph is
transformed
horizontally
As expected
TD25 User clicks ‘aF(x)’
button
Normal data Chosen graph is
stretched by scale
factor ‘a’ vertically
As expected
TD26 User clicks ‘F(ax)’ Normal data Chosen graph is
stretched by scale
factor ‘1/a’
horizontally
As expected
TD27
TD28
TD29
TD30
x = 5 Normal data Scroll bar shifts 5
units to the right.
As expected
x = -10 Boundary data Scroll bar shifts 10
units to the left.
As expected
x = 9000 Erroneous
data
Pop-up message
saying to use a
value inside the
range
As expected
62. Alex Tang
58 | P a g e
TD31 - - - -
TD32 - - - -
TD33 - - - -
TD34 - - - -
TD35 - - - -
TD36 - - - -
TD37 - - - -
TD38 - - - -
TD39 User clicks on a
different function
Normal data Canvas erased and
new function is
plotted
As expected
TD40 User clicks checkbox1
after clicking ‘Linear’
button
Normal data Switch from
‘F(x)=x’ to
‘F(x)=|x|’
As expected
TD41 User clicks checkbox1
after clicking
‘Quadratic’ button
Normal data Switch from
‘F(x)=x2’ to
‘F(x)=|x2|’
As expected
TD42 User clicks checkbox1
after clicking ‘Cubic’
button
Normal data Switch from
‘F(x)=x3’ to
‘F(x)=|x3|’.
As expected
TD43 User clicks checkbox1
after clicking ‘Cosine’
button
Normal data Switch from
‘F(x)=cos(x)’ to
‘F(x)=cos(|x|)’
As expected
TD44 User clicks checkbox1
after clicking ‘Sine’
button
Normal data Switch from
‘F(x)=sin(x)’ to
‘F(x)=sin(|x|)’
As expected
TD45 User clicks checkbox1
after clicking ‘Tangent’
button
Normal data Switch from
‘F(x)=tan(x)’ to
‘F(x)=tan(|x|)’
As expected
TD46 User clicks checkbox1
after clicking
‘Exponential’ button
Normal data Switch from
‘F(x)=ex’ to
‘F(x)=e|x|’
As expected
TD47 User clicks checkbox1
after clicking
‘Reciprocal’ button
Normal data Switch from
‘F(x)=1/x’ to
‘F(x)=1/|x|’
As expected
TD48 e.g. applying ‘F(x) + 2’
to ‘F(x) = |x|’
Normal data F(x) = |x|+2 As expected
e.g. applying ‘0F(x)’ to
‘F(x) = |x2|’
Erroneous
data
a zero value of
aF(x) is invalid
As expected
63. Alex Tang
59 | P a g e
TD49 x = 4 Normal data Line drawn at x=4
parallel to the y-
axis
As expected
x = -10 Boundary
data
Line drawn at x=-10
parallel to the y-
axis
As expected
x = 5.5 Erroneous
data
Invalid input, user
prompted to input
an integer
As expected
TD50 y = 1 Normal data Line drawn at y=1
parallel to the x-
axis
As expected
y = 10 Boundary
data
Line drawn at y=10
parallel to the x-
axis
As expected
y = 0 Boundary
data
Overlap of axis,
user won’t be able
to see the line
As expected
y = abc Erroneous
data
Invalid input, user
prompted to input
an integer
As expected
TD51 User clicks ‘clear’ Normal data Canvas cleared and
axis drawn
As expected
TD52 User clicks ‘clear’ Normal data flag = 0 As expected
TD53 User clicks ‘clear’ Normal data Edit7.text := ' '; As expected
TD54 User clicks ‘clear’ Normal data Canvas.Pen.Color :=
RGB(0,0,0);
As expected
TD55 User clicks ‘clear’ Normal data CheckBox3.Checked
:= false;
As expected
TD56 User clicks ‘main
menu’
Normal data Transformation
form is converted
to main menu form
As expected
TD57 User clicks ‘save
graph’
Normal data File is saved under
users chosen name
and format
As expected
TD58
TD59
e.g. user selected
‘F(x) = tan(x)’
Normal data Edit box contains:
f(x) = tan(x)
As expected
e.g. user selects ‘F(x)
= 1/x’ and
transformed it into
‘F(x) = 2/x’
Normal data Edit box contains:
f(x) = 2/x
As expected
TD60 User clicks ‘clear’ Normal data Edit box contains ‘ ‘ Instead, (0) is
displayed
TD61 - - - -
64. Alex Tang
60 | P a g e
Test Evaluation
For a mathematical based project such as mine, precision is the key requirement. Input and
output of data must be checked thoroughly to ensure the program does not crash or create
an invalid/incorrect output.
Looking closely at my system testing above, it is clear there are many sectors which need to
be carefully analysed, mainly the application of transformation to a function, but also small
things such as value input and scroll bar position changing.
If I was to have more time, I could have done an even deeper level of testing, looking all
types of inputs to see what type of outputs could occur. I am confident I have tested all the
main and required components, however, for a 100% reliable program; much more detail
would be required.
All in all, only 2 small areas need work on, it is apparent that the system is functioning as
proposed.
66. Alex Tang
62 | P a g e
System Overview
The system I have built is revolved around two forms; the main menu form and the
transformation mode form. On each form there are different options, for example, on the
main menu form, the user can enter his/her name and on the transformation form, the user
can edit and transform functions. I would like to go through each form in some detail.
Form1, or the Main Menu form, is the first form the user will be able to see when the
application is run. I have designed it so that when the user chooses to proceed onto the
transformation mode form, Form1 is terminated (to reduce confusion). The user is able to
enter a name which will be displayed on Form2 (Transformation mode form) which will be
beneficial when saving/printing the end product.
Form2 is the real transformation environment. The user has the choice between 8 different
functions (previously stated) and 9 transformations (also previously stated) which can all be
interlinked to create a compound type function. When the user selects his choice of
function, the original graph of that function is drawn simultaneously along with the axis on
the canvas area.
As the original graph is drawn, the user has the ability to transform said function using one
or all of the transformations provided. The user can vary between using slider panels and
text boxes, along with a checkbox for the use of modulus. As the slider is moved and its
corresponding button pressed, the graph is transformed immediately at run time whilst the
previous original graph is erased. The text boxes alongside the scrollbars are a means of
displaying the numerical value of the position of the scrollbar; however, these can be edited
by the user to input real numbers, e.g. 1.897 which the scrollbar cannot do. It is to be noted,
however, applying a compound of transformations can create confusion due to the finite
range of y/x-axis, for example: selecting a value of 8 for the transformation ‘F(x) + a’
combined with the transformation of ‘3F(x)’ would output a y value of 24. This is
problematic as this value is outside the pre-set domain, resulting in the function being
displayed beyond the actual canvas area.
The modulus transformation is represented through a checkbox; the current graph
(transformed or original) would have its negative values converted into absolute values
(positive values). This transformation occurs instantaneously when the checkbox is selected,
and can be easily reverted by simple un-selecting the checkbox. I designed the modulus
function of a graph to stand out (to again reduce confusion) by changing the Pen color to
red when being selected.
Simultaneously as a graph is being transformed, a text box found below the drawing area
displays the current magnitude of the overall function in a mathematical format. The format
is: aF(bx + c) + d where each a, b, c, d variable is controlled by the choice of magnitude
selected by the user.
Lastly, there other buttons found on the transformation mode form include: ‘Main menu’,
‘Clear graph’ and ‘Save graph’. I shall talk about each one independently.
.
67. Alex Tang
63 | P a g e
The ‘Main menu’ button simply closes Form2 and displays Form1. The name of the user and
current transformation is kept even after transformation form is closed down. The user can
however edit his/her name when revisiting the main menu.
The ‘Clear graph’ button initializes a full reset of Form2. Firstly, the values of some particular
variables are reset (flag, Xa, Ya etc…), edit boxes are cleared, position of scroll bars is reset
and lastly the canvas is erased.
The ‘Save graph’ button allows the user to save and print the current canvas. The function
uses the Windows default save dialogue; however, the user is able to select the type of
format and name of the file.
68. Alex Tang
64 | P a g e
Detailed Algorithm Design
In this part, I will compare the Pseudocode I have previously written with the current code
used in the actual program. The Pseudocode is on the left, the code on the right.
1) DrawAxisFunction:
Var
O, P = Integer;
XMax = Integer;
YMax = Integer;
O = 20;
Repeat
MovePenToPosition=(XMax,0);
DrawLineToPosition=(XMax,O);
DrawLineToPosition=(XMax + 3, O);
DrawLineToPosition=(XMax - 3, O);
IncrementO by 20;
Until O is > = HeightOfCanvas; //Valueof 400
P = 20;
Repeat
MovePenToPosition=(0, YMax);
DrawLineToPosition=(P,YMax);
DrawLineToPosition=(P,YMax + 3);
DrawLineToPosition=(P,YMax – 3);
IncrementP by 20;
Until P is >= WidthOfCanvas;//Valueof
400
Procedure DrawAxisFunction;//Drawsthe axis
var
O, P : Integer;
begin
Ymax := form1.Shape1.Heightdiv2;
Xmax := form1.Shape1.Widthdiv2;
Form1.Canvas.Pen.Color:=RGB(0,0,0);
Form1.canvas.Pen.Width:=1;
withForm1.canvasdo
begin
O := 20;
Repeat
Moveto(Xmax,0);
Lineto(Xmax,O);
Lineto(Xmax+3,O);
Lineto(Xmax-3,O);
O := O + 20;
Until O >= form1.Shape1.Height;
begin
P:= 20;
Repeat
MoveTo(0,Ymax);
Lineto(P,Ymax);
Lineto(P,Ymax+3);
Lineto(P,Ymax-3);
P := P + 20;
Until P >= form1.Shape1.Width;
end;
end;
end;
69. Alex Tang
65 | P a g e
Var
YCord = Integer;
I = Integer;
XMax = Integer;
YMax = Integer;
For I = -10 to 10
If I = YCordThen
MovePenToPosition=(XMax , YMax –
(20*i));
DrawLineToPosition=(0,YMax – (20*i));
DrawLineToPosition=(XMax + (20*i), 400);
Procedure TForm1.YCoordClick(Sender:
TObject);//(y)=x
var
XCord,i : Integer;
begin
Ymax := Shape1.Heightdiv2;
Xmax := Shape1.Widthdiv2;
XCord:= StrToInt(Edit5.text);
For i := -10 to 10 do
if i = XCordthen
withcanvasdo
begin
Moveto(Xmax,Ymax-(20*i));
Lineto(0,Ymax-(20*i));
Lineto(401,Ymax-(20*i));
end;
end;
2) XCoord:
Var
XCord= Integer;
I = Integer;
XMax = Integer;
YMax = Integer;
For I = -10 to 10
If I = XCordThen
MovePenToPosition=(XMax + (20*i),
YMax);
DrawLineToPosition=(XMax + (20*i), 0);
DrawLineToPosition=(XMax + (20*i), 400);
Procedure TForm1.XCoordClick(Sender:
TObject); //y=(x)
var
XCord,i : Integer;
begin
Ymax := Shape1.Heightdiv2;
Xmax := Shape1.Widthdiv2;
XCord:= StrToInt(Edit1.text);
For i := -10 to 10 do
if i = XCordthen
withcanvasdo
begin
Moveto(Xmax+(20*i),Ymax);
Lineto(Xmax+(20*i),0);
Lineto(Xmax+(20*i),401);
end;
end;
3) YCoord:
70. Alex Tang
66 | P a g e
4) LinearGraph:
Var
Xa, Ya = Real;
a, b, c, d = Real;
MovePenToPosition=((Xa+ a) *
(1/b),(Ya + c) * d)
While Xais <= 10
Ya = Xa; //y = x
DrawLineToPosition=(200 +
((20 * Xa) + a) * (1/b),(200-
((20 * Ya) + c) * d)
IncrementXa by 0.01;
Procedure LinearGraph(Xa,Ya: single);//Linearfunction
begin
Xa := -20;
Y1 := 20 * Strtoint(form1.edit4.text);
Y2 := -(20 * Strtoint(form1.edit6.text));
Y3 := StrtoFloat(form1.edit2.text);
Y4 := StrtoFloat(form1.edit3.text);
Form1.Canvas.MoveTo(Integer(Floor((Xa+Y2)*(1/Y4))),
Integer(Floor(Y3*(Ya+Y1))));
while Xa<= 10 do
begin
if form1.CheckBox3.checked=true then
begin
form1.Canvas.Pen.Color:=RGB(255,0,0);
Ya := Abs(Xa);
end
else
Ya := Xa;
Form1.Canvas.Lineto(200+(Integer(Floor((20*Xa*(1/Y4))+Y2))),
200-(Integer(Floor(Y3*(20*Ya+Y1)))));
Xa := Xa + 0.01;
end;
end;
Procedure TForm1.LinearClick(Sender:TObject);//Linear
functionclick
var
Xa, Ya : Single;
begin
Canvas.Rectangle(1,1,400,400);
DrawAxisFunction;
Ymax := Shape1.Heightdiv2;
Xmax := Shape1.Widthdiv2;
Withcanvas do
begin
LinearGraph(Xa,Ya);
Flag := 1;
end;
end;
71. Alex Tang
67 | P a g e
5) QuadraticGraph:
Var
Xa, Ya = Real;
a, b, c, d = Real;
MovePenToPosition=((Xa+ a) *
(1/b),(Ya + c) * d)
While Xais <= 10
Ya = Xa * Xa; //y = x^2
DrawLineToPosition=(200 +
((20 * Xa) + a) * (1/b),(200-
((20 * Ya) + c) * d)
IncrementXa by 0.01;
Procedure QuadraticGraph(Xa,Ya: single);//Quadratic
function
begin
Xa := -20;
Y1 := 20 * Strtoint(form1.edit4.text);
Y2 := -(20 * Strtoint(form1.edit6.text));
Y3 := StrtoFloat(form1.edit2.text);
Y4 := StrtoFloat(form1.edit3.text);
Form1.Canvas.MoveTo(Integer(Floor((Xa+Y2)*(1/Y4))),
Integer(Floor(Y3*(Ya+Y1))));
while Xa<=20 do
begin
if form1.CheckBox3.checked=true then
begin
form1.Canvas.Pen.Color:=RGB(255,0,0);
Ya := abs(Xa*Xa)
end
else
Ya := Xa*Xa;
Form1.Canvas.Lineto(200+(Integer(Floor((20*Xa*(1/Y4))+Y2))),
200-(Integer(Floor(Y3*(20*Ya+Y1)))));
Xa := Xa + 0.01;
end;
end;
Procedure TForm1.QuadraticClick(Sender:TObject);
//Quadraticfunctionclick
var
Xa, Ya : Single;
begin
Canvas.Rectangle(1,1,400,400);
DrawAxisFunction;
Ymax := Shape1.Heightdiv2;
Xmax := Shape1.Widthdiv2;
Withcanvas do
begin
QuadraticGraph(Xa,Ya);
Flag := 2;
end;
end;
72. Alex Tang
68 | P a g e
Var
Xa, Ya = Real;
a, b, c, d = Real;
MovePenToPosition=((Xa+ a) *
(1/b),(Ya + c) * d)
While Xais <= 10
Ya = Xa * Xa * Xa; //y = x^3
DrawLineToPosition=(200 +
((20 * Xa) + a) * (1/b),(200-
((20 * Ya) + c) * d)
IncrementXa by 0.01;
Procedure CubicGraph(Xa,Ya: single);//Cubic function
begin
Xa := -20;
Y1 := 20 * Strtoint(form1.edit4.text);
Y2 := -(20 * Strtoint(form1.edit6.text));
Y3 := StrtoFloat(form1.edit2.text);
Y4 := StrtoFloat(form1.edit3.text);
Form1.Canvas.MoveTo(Integer(Floor((Xa+Y2)*(1/Y4))),
Integer(Floor(Y3*(Ya+Y1))));
while Xa<=20 do
begin
if form1.CheckBox3.checked=true then
begin
form1.Canvas.Pen.Color:=RGB(255,0,0);
Ya := Abs(Xa*Xa*Xa)
end
else
Ya := Xa*Xa*Xa;
Form1.Canvas.Lineto(200+(Integer(Floor((20*Xa*(1/Y4))+Y2))),
200-(Integer(Floor(Y3*(20*Ya+Y1)))));
Xa := Xa + 0.01;
end;
end;
Procedure TForm1.CubicClick(Sender:TObject);//Cubic
functionclick
Var
Xa, Ya : Single;
begin
Canvas.Rectangle(1,1,400,400);
DrawAxisFunction;
Ymax := Shape1.Heightdiv2;
Xmax := Shape1.Widthdiv2;
Withcanvas do
begin
CubicGraph(Xa,Ya);
Flag := 3;
end;
end;
6) CubicGraph:
73. Alex Tang
69 | P a g e
Var
Xa, Ya = Real;
a, b, c, d = Real;
MovePenToPosition=((Xa+ a) *
(1/b),(Ya + c) * d)
While Xais <= 10
Ya = Cos(x);//y = cos(x)
DrawLineToPosition=(200 +
((20 * Xa) + a) * (1/b),(200-
((20 * Ya) + c) * d)
IncrementXa by 0.01;
Procedure CosineGraph(Xa,Ya:single);//Cosine function
begin
Xa := -20;
Y1 := 20 * Strtoint(form1.edit4.text);
Y2 := -(20 * Strtoint(form1.edit6.text));
Y3 := StrtoFloat(form1.edit2.text);
Y4 := StrtoFloat(form1.edit3.text);
Form1.Canvas.MoveTo(Integer(Floor((Xa+Y2)*(1/Y4))),
Integer(Floor(Y3*(Ya+Y1))));
while Xa<=20 do
begin
if form1.CheckBox3.checked=true then
begin
form1.Canvas.Pen.Color:=RGB(255,0,0);
Ya := Abs(Cos(Xa))
end
else
Ya := Cos(Xa);
Form1.Canvas.Lineto(200+(Integer(Floor((20*Xa*(1/Y4))+Y2))),
200-(Integer(Floor(Y3*(20*Ya+Y1)))));
Xa := Xa + 0.01;
end;
end;
Procedure TForm1.CosineClick(Sender:TObject);//Cosine
functionclick
var
Xa, Ya : Single;
begin
Canvas.Rectangle(1,1,400,400);
DrawAxisFunction;
Ymax := Shape1.Heightdiv2;
Xmax := Shape1.Widthdiv2;
Withcanvas do
begin
CosineGraph(Xa,Ya);
Flag := 4;
end;
end;
7) CosineGraph:
74. Alex Tang
70 | P a g e
8) SineGraph:
Var
Xa, Ya = Real;
a, b, c, d = Real;
MovePenToPosition=((Xa+ a) *
(1/b),(Ya + c) * d)
While Xais <= 10
Ya = Sin(x);//y =sin(x)
DrawLineToPosition=(200 +
((20 * Xa) + a) * (1/b),(200-
((20 * Ya) + c) * d)
IncrementXa by 0.01;
Procedure SineGraph(Xa,Ya: Single);//Sine function
begin
Xa := -20;
Y1 := 20 * Strtoint(form1.edit4.text);
Y2 := -(20 * Strtoint(form1.edit6.text));
Y3 := StrtoFloat(form1.edit2.text);
Y4 := StrtoFloat(form1.edit3.text);
Form1.Canvas.MoveTo(Integer(Floor((Xa+Y2)*(1/Y3))),
Integer(Floor(Y4*(Ya+Y1))));
while Xa<= 20 do
begin
if form1.CheckBox3.checked=true then
begin
form1.Canvas.Pen.Color:=RGB(255,0,0);
Ya := Abs(Sin(Xa))
end
else
Ya := Sin(Xa);
Form1.Canvas.Lineto(200+(Integer(Floor((20*Xa*(1/Y3))+Y2))),
200-(Integer(Floor(Y4*(20*Ya+Y1)))));
Xa := Xa + 0.01;
end;
end;
Procedure TForm1.SineClick(Sender:TObject);//Sine function
click
var
Xa, Ya : Single;
begin
Canvas.Rectangle(1,1,400,400);
DrawAxisFunction;
Ymax := Shape1.Heightdiv2;
Xmax := Shape1.Widthdiv2;
Withcanvas do
begin
SineGraph(Xa,Ya);
Flag := 5;
end;
end;
75. Alex Tang
71 | P a g e
9) ExponentialGraph:
Var
Xa, Ya = Real;
a, b, c, d = Real;
MovePenToPosition=((Xa+ a) *
(1/b),(Ya + c) * d)
While Xais <= 10
Ya = Exp(x);//y = exp(x)
DrawLineToPosition=(200 +
((20 * Xa) + a) * (1/b), (200-
((20 * Ya) + c) * d)
IncrementXa by 0.01;
Procedure ExponentialGraph(Xa,Ya: single);//Exponential
function
begin
Xa:= -20;
Y1 := 20 * Strtoint(form1.edit4.text);
Y2 := -(20 * Strtoint(form1.edit6.text));
Y3 := StrtoFloat(form1.edit2.text);
Y4 := StrtoFloat(form1.edit3.text);
Form1.Canvas.MoveTo(Integer(Floor((Xa+Y2)*(1/Y4))),
Integer(Floor(Y3*(Ya+Y1))));
while Xa<=20 do
begin
if form1.CheckBox3.checked=true then
begin
form1.Canvas.Pen.Color:=RGB(255,0,0);
Ya := Abs(exp(Xa))
end
else
Ya := exp(Xa);
Form1.Canvas.Lineto(200+(Integer(Floor((20*Xa*(1/Y4))+Y2))),
200-(Integer(Floor(Y3*(20*Ya+Y1)))));
Xa := Xa + 0.01;
end;
end;
Procedure TForm1.ExponentialClick(Sender: TObject);
//Exponential functionclick
var
Xa, Ya : Single;
begin
Canvas.Rectangle(1,1,400,400);
DrawAxisFunction;
Ymax := Shape1.Heightdiv2;
Xmax := Shape1.Widthdiv2;
Withcanvas do
begin
ExponentialGraph(Xa,Ya);
Flag := 6;
end;
end;
76. Alex Tang
72 | P a g e
Var
Xa, Ya = Real;
a, b, c, d = Real;
MovePenToPosition=((Xa+ a) *
(1/b),(Ya + c) * d)
While Xais <= 10
Ya = 1/x; //y = 1/x
DrawLineToPosition=(200 +
((20 * Xa) + a) * (1/b),(200-
((20 * Ya) + c) * d)
IncrementXa by 0.01;
Procedure ReciprocalGraph(Xa,Ya: single);//Reciprocal
function
begin
Xa:= -20;
Y1 := 20 * Strtoint(form1.edit4.text);
Y2 := -(20 * Strtoint(form1.edit6.text));
Y3 := StrtoFloat(form1.edit2.text);
Y4 := StrtoFloat(form1.edit3.text);
Form1.Canvas.MoveTo(Integer(Floor((Xa+Y2)*(1/Y4))),
Integer(Floor(Y3*(Ya+Y1))));
while Xa<=20 do
begin
if form1.CheckBox3.checked=true then
begin
form1.Canvas.Pen.Color:=RGB(255,0,0);
Ya := abs(1/Xa)
end
else
Ya := 1/Xa;
Form1.Canvas.Lineto(200+(Integer(Floor((20*Xa*(1/Y4))+Y2))),
200-(Integer(Floor(Y3*(20*Ya+Y1)))));
Xa := Xa + 0.01;
end;
end;
Procedure TForm1.ReciprocalClick(Sender:TObject);
//Reciprocal functionclick
var
Xa, Ya : Single;
begin
Canvas.Rectangle(1,1,400,400);
DrawAxisFunction;
Ymax := Shape1.Heightdiv2;
Xmax := Shape1.Widthdiv2;
Withcanvas do
begin
ReciprocalGraph(Xa,Ya);
Flag := 7;
end;
end;
10) ReciprocalGraph:
77. Alex Tang
73 | P a g e
11) TangentGraph:
Var
Xa, Ya = Real;
a, b, c, d = Real;
MovePenToPosition=((Xa+ a) *
(1/b),(Ya + c) * d)
While Xais <= 10
Ya = Tan(x);//y = tan(x)
DrawLineToPosition=(200 +
((20 * Xa) + a) * (1/b),(200-
((20 * Ya) + c) * d)
IncrementXa by 0.01;
Procedure TangentGraph(Xa,Ya: single);//Tangentfunction
Var
Xi,Yi : Integer;
begin
Xa:= -20;
Y1 := 20 * Strtoint(form1.edit4.text);
Y2 := -(20 * Strtoint(form1.edit6.text));
Y3 := StrtoFloat(form1.edit2.text);
Y4 := StrtoFloat(form1.edit3.text);
Form1.Canvas.MoveTo(Integer(Floor((Xa+Y2)*(1/Y4))),
Integer(Floor(Y3*(Ya+Y1))));
while Xa<= 20 do
begin
if form1.CheckBox3.checked=true then
begin
form1.Canvas.Pen.Color:=RGB(255,0,0);
Ya := Abs(Tan(Xa))
end
else
Ya := Tan(Xa);
Xi := 200+(Integer(Floor(20*Xa)));
Yi := 200-(Integer(Floor(20*Ya)));
If (Xi >= 400) or (Yi >= 400) then
Form1.Canvas.Moveto(200+(Integer(Floor((20*Xa*(1/Y4))+Y2))
),200-(Integer(Floor(Y3*(20*Ya+Y1)))));
Form1.Canvas.Lineto(200+(Integer(Floor((20*Xa*(1/Y4))+Y2))),
200-(Integer(Floor(Y3*(20*Ya+Y1)))));
Xa := Xa + 0.01;
end;
end;
Procedure TForm1.TangentClick(Sender:TObject);//Tangent
functionclick
Var
Xa, Ya : single;
begin
Canvas.Rectangle(1,1,400,400);
DrawAxisFunction;
Ymax := Shape1.Heightdiv2;
Xmax := Shape1.Widthdiv2;
Withcanvas do
begin
TangentGraph(Xa,Ya);
Flag := 8;
end;
end;
78. Alex Tang
74 | P a g e
Var
sFx = String;
Flag= Integer;
a, b, c, d = Integer;
Case of Flag Value
1: sFx = 'x';
2: sFx = 'x^2';
3: sFx = 'x^3';
4: sFx = 'Cos(x)';
5: sFx = 'Sin(x)';
6: sFx = 'e^x';
7: sFx = '1/x';
8: sFx = 'Tan(x)';
Output a + ‘(‘+ b + sFx + c + ‘)’+
d;
Procedure DisplayFunctionString;//Displaysthe currentvalue
of f(x)
var
a, b, c, d : String;
sFx : String;
begin
a := '1';
b := '2';
a := Form1.Edit2.text;
If a = '+1' then
a := ' ';
If a = '-1' then
a := '-';
b := Form1.Edit3.text;
If b = '+1' then
b := ' ';
If b = '-1' then
b := '-';
c := Form1.Edit6.text;
d := Form1.Edit4.text;
Case flagof
1: sFx := 'x';
2: sFx := 'x^2';
3: sFx := 'x^3';
4: sFx := 'Cos(x)';
5: sFx := 'Sin(x)';
6: sFx := 'e^x';
7: sFx := '1/x';
8: sFx := 'Tan(x)';
end;
Form1.Edit7.text:=a + '(' + b + sFx + c + ')' + d;
end;
13) ClearAll:
Flag= 0;
DrawAxisFunction;
ResetTextBoxes
ResetEditBoxes
ResetScrollbarPositions
ResetCheckBoxes
Procedure TForm1.ClearClick(Sender:TObject);
//clearfunction
begin
Flag:= 0;
Canvas.Pen.Color:=RGB(0,0,0);
Canvas.Rectangle(1,1,400,400);
DrawAxisFunction;
Edit2.text:= '+' + inttostr(1);
Edit3.text:= '+' + inttostr(1);
Edit4.text:= inttostr(0);
Edit6.text:= inttostr(0);
12) Displayf(x)AsString:
79. Alex Tang
75 | P a g e
Edit7.text:= ' ';
Scrollbar1.Position:=0;
Scrollbar2.Position:=0;
Scrollbar3.Position:=1;
Scrollbar4.Position:=1;
CheckBox3.Checked:=false;
end;
If ScollBarCurrentPosition is>0 then
ConvertToString(ScollBarCurrentPosition);
Output ‘+’ And StringScrollBarPosition;
If ScrollBarCurrentPosition is<0 then
ConvertToString(ScollBarCurrentPosition);
Output StringScrollBarPosition;
If ScollBarCurrentPosition is=0 then
Output ‘0’;
//Thisis repeated forall 4 scroll bars
Procedure TForm1.ScrollBar1Change(Sender:
TObject);//scroll barmovement
begin
If Scrollbar1.Position>0 then
begin
Str(Scrollbar1.Position,outstr);
Edit4.text:= '+' + outstr;
end;
If Scrollbar1.Position<0 then
begin
Str(Scrollbar1.Position,outstr);
Edit4.text:= outstr;
end;
If Scrollbar1.Position=0 then
Edit4.text:= '0';
DisplayFunctionString;
end;
Procedure TForm1.ScrollBar2Change(Sender:
TObject);//scroll barmovement
begin
If Scrollbar2.Position>0 then
begin
Str(Scrollbar2.Position,outstr);
Edit6.text:= '+' + outstr;
end;
If Scrollbar2.Position<0 then
begin
Str(Scrollbar2.Position,outstr);
Edit6.text:= outstr;
end;
If Scrollbar2.Position=0 then
Edit6.text:= '0';
DisplayFunctionString;
end;
procedure TForm1.ScrollBar3Change(Sender:
TObject);//scroll barmovement
begin
14)ScrollBarShift:
80. Alex Tang
76 | P a g e
If Scrollbar3.Position>0 then
begin
Str(Scrollbar3.Position,outstr);
Edit2.text:= '+' + outstr;
end;
If Scrollbar3.Position<0 then
begin
Str(Scrollbar3.Position,outstr);
Edit2.text:= outstr;
end;
If Scrollbar3.Position=0 then
Edit2.text:= '0';
DisplayFunctionString;
end;
Procedure TForm1.ScrollBar4Change(Sender:
TObject);//scroll barmovement
begin
If Scrollbar4.Position>0 then
begin
Str(Scrollbar4.Position,outstr);
Edit3.text:= '+' + outstr;
end;
If Scrollbar4.Position<0 then
begin
Str(Scrollbar4.Position,outstr);
Edit3.text:= outstr;
end;
If Scrollbar4.Position=0 then
Edit3.text:= '0';
DisplayFunctionString;
end;
15)CaseOfGraphOption:
Var
Xa, Ya = Integer;
If Flag= 1 then
DrawRectangleOverCanvas(1,1,400,400);
DrawAxisFunction;
Draw LinearGraph(Xa,Ya);
If Flag= 2 then
DrawRectangleOverCanvas(1,1,400,400);
DrawAxisFunction;
Draw Quadratic(Xa,Ya);
If Flag= 3 then
DrawRectangleOverCanvas(1,1,400,400);
DrawAxisFunction;
Draw Cubic(Xa,Ya);
Procedure CaseOfOption;//Nestedif statement
to applycall fucntions
Var
Xa, Ya : Integer;
begin
If Flag= 1 then
begin
Form1.Canvas.Rectangle(1,1,400,400);
DrawAxisFunction;
LinearGraph(Xa,Ya);
end;
If Flag= 2 then
begin
Form1.Canvas.Rectangle(1,1,400,400);
81. Alex Tang
77 | P a g e
//Thecode is then copied forthe other 5 flag
options,the
code is reused each time,so it is unnecessary to
include it all.
DrawAxisFunction;
QuadraticGraph(Xa,Ya);
end;
If Flag= 3 then
begin
Form1.Canvas.Rectangle(1,1,400,400);
DrawAxisFunction;
CubicGraph(Xa,Ya);
end;
If Flag= 4 then
begin
Form1.Canvas.Rectangle(1,1,400,400);
DrawAxisFunction;
CosineGraph(Xa,Ya);
end;
If Flag= 5 then
begin
Form1.Canvas.Rectangle(1,1,400,400);
DrawAxisFunction;
SineGraph(Xa,Ya);
end;
If Flag= 6 then
begin
Form1.Canvas.Rectangle(1,1,400,400);
DrawAxisFunction;
ExponentialGraph(Xa,Ya);
end;
If Flag= 7 then
begin
Form1.Canvas.Rectangle(1,1,400,400);
DrawAxisFunction;
ReciprocalGraph(Xa,Ya);
end;
If Flag= 8 then
begin
Form1.Canvas.Rectangle(1,1,400,400);
DrawAxisFunction;
TangentGraph(Xa,Ya);
end;
end;
82. Alex Tang
78 | P a g e
Procedure and Variable listing
procedure Button2Click(Sender: TObject); //proceed to form1 button
procedure Button3Click(Sender: TObject); //exits the program
procedure Button1Click(Sender: TObject);
procedure Image1Click(Sender: TObject); //clicking the image brings the user to form1
Tform1 Methods
procedure XCoordClick(Sender: TObject); //button which draws a line parallel to the y-axis
procedure ClearClick(Sender: TObject); //button which calls the clear procedure
procedure YCoordClick(Sender: TObject); //button which draws a line parallel to the x-axis
procedure MainMenuClick(Sender: TObject); //button which takes the use back to form2
procedure QuadraticClick(Sender: TObject); //applies the quadratic function to f(x)
procedure CubicClick(Sender: TObject); //applies the cubic function to f(x)
procedure ScrollBar1Change(Sender:TObject); //procedure to check the position of the scrollbar
procedure ScrollBar2Change(Sender: TObject);//procedure to check the position of the scrollbar
procedure ScrollBar3Change(Sender: TObject);//procedure to check the position of the scrollbar
procedure ScrollBar4Change(Sender: TObject);//procedure to check the position of the scrollbar
procedure CosineClick(Sender: TObject); //applies the cosine function to f(x)
procedure SineClick(Sender: TObject); //applies the quadratic function to f(x)
procedure ExponentialClick(Sender: TObject); //applies the exponential function to f(x)
procedure LinearClick(Sender: TObject); //applies the linear function to f(x)
procedure ReciprocalClick(Sender: TObject); //applies the reciprocal function to f(x)
procedure TangentClick(Sender: TObject); //applies the tangent function to f(x)
procedure Transformation1Click(Sender: TObject); //button that controls a transformation
procedure Transformation2Click(Sender: TObject); //button that controls a transformation
procedure Transformation3Click(Sender: TObject); //button that controls a transformation
procedure Transformation4Click(Sender: TObject); //button that controls a transformation
procedure CheckBox3Click(Sender: TObject); //modulus checkbox
procedure SaveGraphClick(Sender: TObject); //calls the save dialogue function
Tform2 Methods
84. Alex Tang
80 | P a g e
Form1: TForm1;
Xmax, Ymax : Integer;
OutStr : String;
Flag : Integer;
Y1, Y2 : Integer;
Y3, Y4 : Real;
Annotated code listing
Text written in red is not part of the code; I will use it to describe some code found below.
The first piece of code is from the transformation mode form. I believe it is unnecessary to
go into detail about the code behind the main menu form as the code is very simplistic and
easy to understand.
unit RandomGraph;
interface
uses
Windows, Messages, SysUtils, Variants, Classes, Graphics, Controls, Forms,
Dialogs, StdCtrls, ExtCtrls, Math, JPEG;
type
TForm1 = class(TForm)
Shape1: TShape;
Edit1: TEdit;
XCoord: TButton;
Clear: TButton;
Edit4: TEdit;
Transformation1: TButton;
YCoord: TButton;
Edit5: TEdit;
Transformation2: TButton;
Edit6: TEdit;
Panel1: TPanel;
MainMenu: TButton;
Linear: TButton;
Quadratic: TButton;
Cubic: TButton;
Cosine: TButton;
Sine: TButton;
Tangent: TButton;
Exponential: TButton;
Reciprocal: TButton;
Transformation3: TButton;
Edit2: TEdit;
Unit1 Global variables
85. Alex Tang
81 | P a g e
Transformation4: TButton;
Edit3: TEdit;
ScrollBar1: TScrollBar;
ScrollBar2: TScrollBar;
ScrollBar3: TScrollBar;
ScrollBar4: TScrollBar;
CheckBox3: TCheckBox;
Panel2: TPanel;
Edit7: TEdit;
Label2: TLabel;
Label3: TLabel;
Label1: TLabel;
Label4: TLabel;
SaveGraph: TButton;
SaveDialog1: TSaveDialog;
procedure XCoordClick(Sender: TObject);
procedure ClearClick(Sender: TObject);
procedure YCoordClick(Sender: TObject);
procedure MainMenuClick(Sender: TObject);
procedure QuadraticClick(Sender: TObject);
procedure CubicClick(Sender: TObject);
procedure ScrollBar1Change(Sender: TObject);
procedure ScrollBar2Change(Sender: TObject);
procedure ScrollBar3Change(Sender: TObject);
procedure ScrollBar4Change(Sender: TObject);
procedure CosineClick(Sender: TObject);
procedure SineClick(Sender: TObject);
procedure ExponentialClick(Sender: TObject);
procedure LinearClick(Sender: TObject);
procedure ReciprocalClick(Sender: TObject);
procedure TangentClick(Sender: TObject);
procedure Transformation1Click(Sender: TObject);
procedure Transformation2Click(Sender: TObject);
procedure Transformation3Click(Sender: TObject);
procedure Transformation4Click(Sender: TObject);
procedure CheckBox3Click(Sender: TObject);
procedure SaveGraphClick(Sender: TObject);
private
{ Private declarations }
public
{ Public declarations }
end;
var
Form1: TForm1;
Xmax, Ymax : Integer; //constant value through out, correlate to the height/width of the canvas
OutStr : String; //variable used to output the position of the scroll bar in string format
Flag : Integer; //a variable whose job is to point to the correct function/procedure
Y1, Y2 : Integer;
Y3, Y4 : Real;
86. Alex Tang
82 | P a g e
implementation
uses Unit2;
{$R *.dfm}
Procedure DisplayFunctionString; //Displays the current value of f(x)
var
a, b, c, d : String;
sFx : String;
begin
a := '1';
b := '2';
a := Form1.Edit2.text;//value takenfrom the magnitude of transformation, values needto have their signs removed
when input into the function editbox
If a = '+1' then
a := ' ';
If a = '-1' then
a := '-';
b := Form1.Edit3.text;//value taken fromthe magnitude oftransformation, values needto have their signs removed
when input into the function editbox
If b = '+1' then
b := ' ';
If b = '-1' then
b := '-';
c := Form1.Edit6.text; //value taken from the magnitude of transformation
d := Form1.Edit4.text; //value taken from the magnitude of transformation
Case flagof //a case of statement to distinguishthe current graph being used to be output in the function editbox
1: sFx := 'x';
2: sFx := 'x^2';
3: sFx := 'x^3';
4: sFx := 'Cos(x)';
5: sFx := 'Sin(x)';
6: sFx := 'e^x';
7: sFx := '1/x';
8: sFx := 'Tan(x)';
end;
Form1.Edit7.text := a + '(' + b + sFx + c + ')' + d; //outputs the function value in the mathematical format
end;
procedure TForm1.XCoordClick(Sender: TObject); //y=(x)
var
XCord, i : Integer;
begin
Ymax := Shape1.Height div 2; //calculation of the usable canvas area
Xmax := Shape1.Width div 2; //calculation of the usable canvas area
XCord := StrToInt(Edit1.text);
For i := -10 to 10 do //for loop to calculate the placement of the line parallel to the y-axis
if i = XCord then //if statement to calculate if input value is a valid integer
with canvas do
begin
Moveto(Xmax+(20*i),Ymax);
87. Alex Tang
83 | P a g e
Lineto(Xmax+(20*i),0);
Lineto(Xmax+(20*i),401);
end;
end;
procedure TForm1.YCoordClick(Sender: TObject); //(y)=x
var
XCord, i : Integer;
begin
Ymax := Shape1.Height div 2; //calculation of the usable canvas area
Xmax := Shape1.Width div 2; //calculation of the usable canvas area
XCord := StrToInt(Edit5.text);
For i := -10 to 10 do //for loop to calculate the placement of the line parallel to the x-axis
if i = XCord then //if statement to calculate if input value is a valid integer
with canvas do
begin
Moveto(Xmax,Ymax-(20*i));
Lineto(0,Ymax-(20*i));
Lineto(401,Ymax-(20*i));
end;
end;
Procedure DrawAxisFunction; //Draws the axis
var
O, P : Integer;
begin
Ymax := form1.Shape1.Height div 2; //calculation of the usable canvas area
Xmax := form1.Shape1.Width div 2; //calculation of the usable canvas area
Form1.Canvas.Pen.Color := RGB(0,0,0); //pen color changed to black
Form1.canvas.Pen.Width := 1; //pen width changed to 1 point
with Form1.canvas do
begin
O := 20;
Repeat//a repeat statement designedto continuouslydrawa line horizontally, with increments at every 20 units
Moveto(Xmax,0);
Lineto(Xmax,O);
Lineto(Xmax+3,O);
Lineto(Xmax-3,O);
O := O + 20; //incrementing the O variable to indicate next place to draw the axis
Until O >= form1.Shape1.Height; //a range check to ensure the line is not infinitely drawn
begin
P := 20;
Repeat//a repeat statement designedto continuouslydrawa line vertically, with increments at every 20 units
MoveTo(0,Ymax);
Lineto(P,Ymax);
Lineto(P,Ymax+3);
Lineto(P,Ymax-3);
P := P + 20; //incrementing the P variable to indicate next place to draw the axis
Until P >= form1.Shape1.Width; //a range check to ensure the line is not infinitely drawn
end;
end;
88. Alex Tang
84 | P a g e
end;
Procedure LinearGraph(Xa, Ya : single); //Linear function
begin
Xa := -20;
Y1 := 20 * Strtoint(form1.edit4.text);//’f(x)+/- a’ where the value of Y1 is (20*a);thisis onlya shift vertically, so
the value input by the user needs to be converted (multiplied by 20) to be in ratio with the canvas area
Y2 := -(20 * Strtoint(form1.edit6.text)); //’f(x +/- a)’ where the value of Y2 is (20*a);this is onlya shift horizontally,
so the value input by the user needs to be converted (multiplied by 20) to be in ratio with the canvas area
Y3 := StrtoFloat(form1.edit2.text); //’af(x)’ where the value of Y3 is (a); this value is not multiplied by 20 because
this transformation is not a shift, but a stretch of scale factor (a)
Y4 := StrtoFloat(form1.edit3.text); //’f(ax)’ where the value ofY4 is (a);this value is not multiplied by 20 because
this transformation is not a shift, but a stretch of scale factor (1/a)
Form1.Canvas.MoveTo(Integer(Floor((Xa+Y2)*(1/Y4))),Integer(Floor(Y3*(Ya+Y1)))); //the pre-set value
of this function is at upper-left corner of the canvas, however, it is changed as each transformation is applied
while Xa<= 10 do //a controlledloopto ensure eachpoint is plotted, but making sure to staywithinthe canvas range
begin
if form1.CheckBox3.checked=true then //if modulus optionis selected the functiondraws the absolute value
of the fucntion
begin
form1.Canvas.Pen.Color := RGB(255,0,0); //pen color changed to red
Ya := Abs(Xa); //absolute value, no negatives
end
else //if modulus option is not selected, the function carried on from this point ignoring the previous 5 lines
Ya := Xa; //for a linear graph, each Y coordinate is equal to the X coordinate, hence y= x
Form1.Canvas.Lineto(200+(Integer(Floor((20*Xa*(1/Y4))+Y2))),200-
(Integer(Floor(Y3*(20*Ya+Y1))))); //function which draws y= x whilst applying each transformation simultaneously
Xa := Xa + 0.01; //incrementing the loop variable
end;
end;
procedure TForm1.LinearClick(Sender: TObject); //Linear function click
var
Xa, Ya : Single;
begin
Canvas.Rectangle(1,1,400,400); //a clear rectangle is used as a means of ‘erasing’ the current canvas
DrawAxisFunction; //axis drawing function s called after the canvas has been cleared
Ymax := Shape1.Height div 2; //calculation of the usable canvas area
Xmax := Shape1.Width div 2; //calculation of the usable canvas area
With canvas do
begin
LinearGraph(Xa, Ya); //calls the LinearGraph function when the user clicks the relative button
Flag := 1; //important variable update, the programwill knowwhich graph is being used when transformations are
applied
end;
end;
Procedure QuadraticGraph(Xa, Ya : single); //Quadratic function
begin
Xa := -20;
Y1 := 20 * Strtoint(form1.edit4.text); //’f(x)+/- a’ where the value of Y1 is (20*a);thisis onlya shift vertically, so
the value input by the user needs to be converted (multiplied by 20) to be in ratio with the canvas area
Y2 := -(20 * Strtoint(form1.edit6.text)); //’f(x +/- a)’ where the value of Y2 is (20*a);this is onlya shift horizontally,