SlideShare a Scribd company logo
1 of 4
Download to read offline
Prepared by Jenny Levine, ITTS 1 October 22, 2010
ALA Connect at 18 Months (April 2009 – September 2010)
A year and a half after launch, Connect trends continue the patterns we tracked in the 6-month
(http://itts.ala.org/news/2009/12/16/six-month-review-of-ala-connect/) and one-year
(http://itts.ala.org/news/2010/04/27/happy-birthday-connect/) marks.
Continuing trends:
- Although usage is cyclical, it continues to grow at a steady pace overall. The amount of content on the
site has increased, as has the number of groups and communities, but content remains focused on
business-related activities. MentorConnect usage continues to grow.
- At the one-year mark, 15% of active users had logged in to the site (9,078 total). At the 18-month
mark, 19% have logged in (11,408 total).
- Usage spikes still occur around Midwinter and Annual, with the number of visits more than doubling
during the lead up to our two major conference events.
- Activity drops off dramatically on weekends, which isn’t surprising for a professionally-oriented site.
- Posts and online docs continue to be the most popular types of content added, although most online
docs are still used as a way to upload files rather than work collaboratively on the site.
- Although ALA staff remain active contributors, an increasing number of members continue to add
content. The most active email domain continues to be gmail, followed by ala.org.
Prepared by Jenny Levine, ITTS 2 October 22, 2010
- Non-ALA members continue to create accounts on the site at a steady rate; more than 2,000 non-
member accounts have been requested and activated.
- At peak usage in June, the divisions using Connect the most were (in order) ALCTS, RUSA, LITA, ACRL,
and ASCLA (all ranging between 9-10% of their members).
- Although we just started counting round table participation in August, it’s already clear that they’re
using Connect slightly more than divisions when comparing percentage of members who are active on
the site. The most active round tables (in order) are NMRT, MAGERT, GODORT, and LearnRT (all
between approximately 10-12%). RMRT numbers are misleading at this point since it’s a new, very
small group.
Overall, the lowest numbers for round table participants are higher than the lowest numbers for
divisions. Hopefully this indicates that Connect is succeeding in providing a centralized space for round
table groups, which historically have had to create their own infrastructure in order to work together.
Prepared by Jenny Levine, ITTS 3 October 22, 2010
New trends:
- Although the highest usage occurs around Midwinter and Annual, there’s a new spike in the number of
comments added in April, which I believe is due to increased board activity across the Association.
There’s a smaller bump in September that may also indicate increased board activity, as well as a
return to work from summer vacations overall.
- Beginning in late April 2010, there’s a fairly consistent pattern of more original content being created
than comments added. In the past, there have been more comments than new content. It seems that
Prepared by Jenny Levine, ITTS 4 October 22, 2010
more new content is added around Annual Conference, while more comments are added around
Midwinter.
- Users appear to be going straight to specific pages, rather than starting at the home page (also called
the “dashboard”). This probably indicates an increase in the usage of email notifications, as
participants are likely clicking more on emails rather than browsing for a specific content item.
A full set of statistical snapshots for the 18-month mark can be found at
http://www.flickr.com/photos/alastaff/sets/72157625093565137/ .
Overall, the news remains good, but we still hope to see more participation from non-committee members in
2011. Anecdotal feedback remains more positive than negative.
Thank you to Norman Rose in the Office for Research & Statistics for his help verifying my interpretation of the
statistics.

More Related Content

Similar to ALA Connect - 18 month report

Common Knowledge social networking experience overview 3 4-2011
Common Knowledge social networking experience overview 3 4-2011Common Knowledge social networking experience overview 3 4-2011
Common Knowledge social networking experience overview 3 4-2011
CKassadi
 
Common Knowledge Social Networking Experience overview 3 4-2011
Common Knowledge Social Networking Experience overview 3 4-2011Common Knowledge Social Networking Experience overview 3 4-2011
Common Knowledge Social Networking Experience overview 3 4-2011
CKassadi
 
Is Social Networking On The Decline
Is Social Networking On The DeclineIs Social Networking On The Decline
Is Social Networking On The Decline
elearnplymouth
 

Similar to ALA Connect - 18 month report (20)

Leadership Learning Community Board Report
Leadership Learning Community Board ReportLeadership Learning Community Board Report
Leadership Learning Community Board Report
 
Marketingcharts Social Media Data Stacks Ppt
Marketingcharts Social Media Data Stacks PptMarketingcharts Social Media Data Stacks Ppt
Marketingcharts Social Media Data Stacks Ppt
 
Marketingcharts social-media-data-stacks-ppt
Marketingcharts social-media-data-stacks-pptMarketingcharts social-media-data-stacks-ppt
Marketingcharts social-media-data-stacks-ppt
 
Common Knowledge social networking experience overview 3 4-2011
Common Knowledge social networking experience overview 3 4-2011Common Knowledge social networking experience overview 3 4-2011
Common Knowledge social networking experience overview 3 4-2011
 
Common Knowledge Social Networking Experience overview 3 4-2011
Common Knowledge Social Networking Experience overview 3 4-2011Common Knowledge Social Networking Experience overview 3 4-2011
Common Knowledge Social Networking Experience overview 3 4-2011
 
ALA Connect 6 Month Review
ALA Connect 6 Month ReviewALA Connect 6 Month Review
ALA Connect 6 Month Review
 
Is Social Networking On The Decline
Is Social Networking On The DeclineIs Social Networking On The Decline
Is Social Networking On The Decline
 
Estudio sobre ONG y redes sociales
Estudio sobre ONG y redes socialesEstudio sobre ONG y redes sociales
Estudio sobre ONG y redes sociales
 
Nonprofit Social Network Survey Report
Nonprofit Social Network Survey ReportNonprofit Social Network Survey Report
Nonprofit Social Network Survey Report
 
GWI Social Q3 2014
GWI Social Q3 2014GWI Social Q3 2014
GWI Social Q3 2014
 
Social Summary Q2 2014 / Global Web Index
Social Summary Q2 2014 / Global Web IndexSocial Summary Q2 2014 / Global Web Index
Social Summary Q2 2014 / Global Web Index
 
Social Media Statistics Changes in the social sphere from 2009 to 2011.
Social Media Statistics Changes in the social sphere from 2009 to 2011. Social Media Statistics Changes in the social sphere from 2009 to 2011.
Social Media Statistics Changes in the social sphere from 2009 to 2011.
 
Web Index o Indice de la Web 2012
Web Index o Indice de la Web 2012Web Index o Indice de la Web 2012
Web Index o Indice de la Web 2012
 
Discovering social learning_ss
Discovering social learning_ssDiscovering social learning_ss
Discovering social learning_ss
 
DM 101 - Belardi Ostroy - Lists/Acquisition
DM 101 - Belardi Ostroy - Lists/AcquisitionDM 101 - Belardi Ostroy - Lists/Acquisition
DM 101 - Belardi Ostroy - Lists/Acquisition
 
Social media-benchmarks-2015
Social media-benchmarks-2015Social media-benchmarks-2015
Social media-benchmarks-2015
 
Social media-benchmarks-2015
Social media-benchmarks-2015Social media-benchmarks-2015
Social media-benchmarks-2015
 
An analysis of Twitter usage among startups in Europe
An analysis of Twitter usage among startups in EuropeAn analysis of Twitter usage among startups in Europe
An analysis of Twitter usage among startups in Europe
 
Digital in 2016 Executive Summary
Digital in 2016 Executive SummaryDigital in 2016 Executive Summary
Digital in 2016 Executive Summary
 
Digital in 2016 Executive Summary
Digital in 2016 Executive SummaryDigital in 2016 Executive Summary
Digital in 2016 Executive Summary
 

ALA Connect - 18 month report

  • 1. Prepared by Jenny Levine, ITTS 1 October 22, 2010 ALA Connect at 18 Months (April 2009 – September 2010) A year and a half after launch, Connect trends continue the patterns we tracked in the 6-month (http://itts.ala.org/news/2009/12/16/six-month-review-of-ala-connect/) and one-year (http://itts.ala.org/news/2010/04/27/happy-birthday-connect/) marks. Continuing trends: - Although usage is cyclical, it continues to grow at a steady pace overall. The amount of content on the site has increased, as has the number of groups and communities, but content remains focused on business-related activities. MentorConnect usage continues to grow. - At the one-year mark, 15% of active users had logged in to the site (9,078 total). At the 18-month mark, 19% have logged in (11,408 total). - Usage spikes still occur around Midwinter and Annual, with the number of visits more than doubling during the lead up to our two major conference events. - Activity drops off dramatically on weekends, which isn’t surprising for a professionally-oriented site. - Posts and online docs continue to be the most popular types of content added, although most online docs are still used as a way to upload files rather than work collaboratively on the site. - Although ALA staff remain active contributors, an increasing number of members continue to add content. The most active email domain continues to be gmail, followed by ala.org.
  • 2. Prepared by Jenny Levine, ITTS 2 October 22, 2010 - Non-ALA members continue to create accounts on the site at a steady rate; more than 2,000 non- member accounts have been requested and activated. - At peak usage in June, the divisions using Connect the most were (in order) ALCTS, RUSA, LITA, ACRL, and ASCLA (all ranging between 9-10% of their members). - Although we just started counting round table participation in August, it’s already clear that they’re using Connect slightly more than divisions when comparing percentage of members who are active on the site. The most active round tables (in order) are NMRT, MAGERT, GODORT, and LearnRT (all between approximately 10-12%). RMRT numbers are misleading at this point since it’s a new, very small group. Overall, the lowest numbers for round table participants are higher than the lowest numbers for divisions. Hopefully this indicates that Connect is succeeding in providing a centralized space for round table groups, which historically have had to create their own infrastructure in order to work together.
  • 3. Prepared by Jenny Levine, ITTS 3 October 22, 2010 New trends: - Although the highest usage occurs around Midwinter and Annual, there’s a new spike in the number of comments added in April, which I believe is due to increased board activity across the Association. There’s a smaller bump in September that may also indicate increased board activity, as well as a return to work from summer vacations overall. - Beginning in late April 2010, there’s a fairly consistent pattern of more original content being created than comments added. In the past, there have been more comments than new content. It seems that
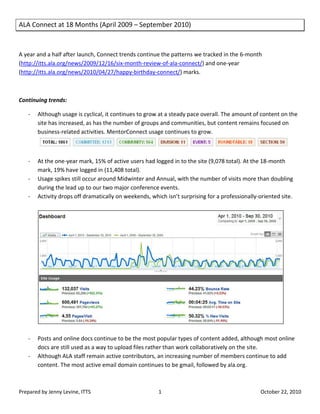
  • 4. Prepared by Jenny Levine, ITTS 4 October 22, 2010 more new content is added around Annual Conference, while more comments are added around Midwinter. - Users appear to be going straight to specific pages, rather than starting at the home page (also called the “dashboard”). This probably indicates an increase in the usage of email notifications, as participants are likely clicking more on emails rather than browsing for a specific content item. A full set of statistical snapshots for the 18-month mark can be found at http://www.flickr.com/photos/alastaff/sets/72157625093565137/ . Overall, the news remains good, but we still hope to see more participation from non-committee members in 2011. Anecdotal feedback remains more positive than negative. Thank you to Norman Rose in the Office for Research & Statistics for his help verifying my interpretation of the statistics.